

carbon dioxide capture and storage carbon dioxide capture and ...
carbon dioxide capture and storage carbon dioxide capture and ...
carbon dioxide capture and storage carbon dioxide capture and ...

Create successful ePaper yourself
Turn your PDF publications into a flip-book with our unique Google optimized e-Paper software.
Primary energy use (EJ yr -1 )<br />
Emissions (MtCO 2 yr -1 )<br />
1.400<br />
1.200<br />
1.000<br />
800<br />
600<br />
400<br />
200<br />
-<br />
MiniCAM<br />
2005 2020 2035 2050 2065 2080 2095<br />
<strong>and</strong> effective trapping mechanisms. There are two different<br />
types of leakage scenarios: (1) abrupt leakage, through<br />
injection well failure or leakage up an ab<strong>and</strong>oned well, <strong>and</strong><br />
(2) gradual leakage, through undetected faults, fractures or<br />
wells. Impacts of elevated CO 2 concentrations in the shallow<br />
subsurface could include lethal effects on plants <strong>and</strong> subsoil<br />
animals <strong>and</strong> the contamination of groundwater. High fluxes<br />
in conjunction with stable atmospheric conditions could lead<br />
a b<br />
1.400<br />
MESSAGE<br />
1.200<br />
1.000<br />
800<br />
600<br />
400<br />
200<br />
Summary for Policymakers<br />
-<br />
2005 2020 2035 2050 2065 2080 2095<br />
90.000<br />
80.000<br />
MiniCAM<br />
c<br />
90.000<br />
80.000<br />
MESSAGE<br />
d<br />
70.000<br />
70.000<br />
60.000<br />
60.000<br />
50.000<br />
50.000<br />
40.000<br />
40.000<br />
30.000<br />
30.000<br />
20.000<br />
10.000<br />
-<br />
Emissions to the<br />
atmosphere<br />
20.000<br />
10.000<br />
Emissions to the<br />
atmosphere<br />
2005 2020 2035 2050 2065 2080 2095 2005 2020 2035 2050 2065 2080 2095<br />
Marginal price of CO2 (2002 US$/tCO2 )<br />
180<br />
160<br />
140<br />
120<br />
100<br />
80<br />
60<br />
40<br />
20<br />
0<br />
MiniCAM<br />
MESSAGE<br />
e<br />
2005 2020 2035 2050 2065 2080 2095<br />
Solar/Wind<br />
Hydro<br />
Biomass<br />
Nuclear<br />
Oil<br />
Gas CCS<br />
Gas (Vented)<br />
Coal CCS<br />
Coal (Vented)<br />
Conservation <strong>and</strong><br />
Energy Efficiency<br />
Renewable Energy<br />
Nuclear<br />
Coal to Gas<br />
Substitution<br />
CCS<br />
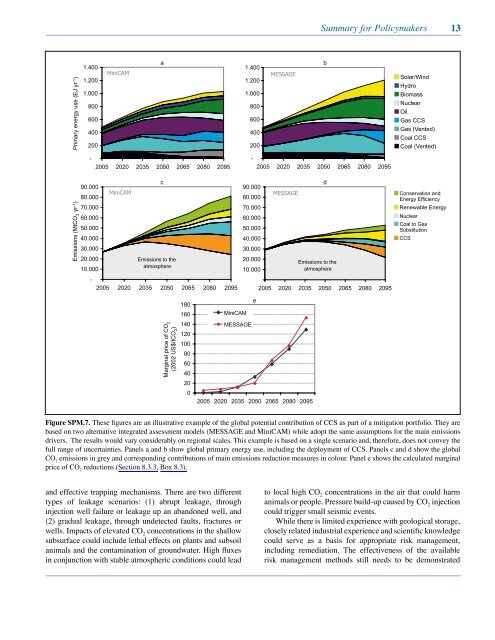
Figure SPM.7. These figures are an illustrative example of the global potential contribution of CCS as part of a mitigation portfolio. They are<br />
based on two alternative integrated assessment models (MESSAGE <strong>and</strong> MiniCAM) while adopt the same assumptions for the main emissions<br />
drivers. The results would vary considerably on regional scales. This example is based on a single scenario <strong>and</strong>, therefore, does not convey the<br />
full range of uncertainties. Panels a <strong>and</strong> b show global primary energy use, including the deployment of CCS. Panels c <strong>and</strong> d show the global<br />
CO 2 emissions in grey <strong>and</strong> corresponding contributions of main emissions reduction measures in colour. Panel e shows the calculated marginal<br />
price of CO 2 reductions (Section 8.3.3, Box 8.3).<br />
to local high CO 2 concentrations in the air that could harm<br />
animals or people. Pressure build-up caused by CO 2 injection<br />
could trigger small seismic events.<br />
While there is limited experience with geological <strong>storage</strong>,<br />
closely related industrial experience <strong>and</strong> scientific knowledge<br />
could serve as a basis for appropriate risk management,<br />
including remediation. The effectiveness of the available<br />
risk management methods still needs to be demonstrated<br />
1


