

carbon dioxide capture and storage carbon dioxide capture and ...
carbon dioxide capture and storage carbon dioxide capture and ...
carbon dioxide capture and storage carbon dioxide capture and ...

You also want an ePaper? Increase the reach of your titles
YUMPU automatically turns print PDFs into web optimized ePapers that Google loves.
4 Summary for Policymakers<br />
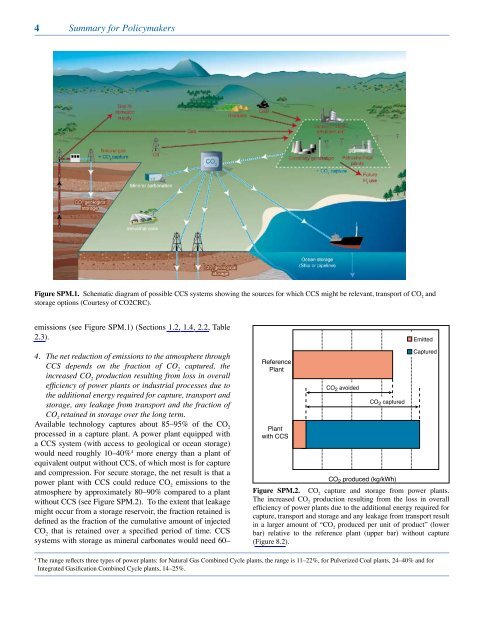
Figure SPM.1. Schematic diagram of possible CCS systems showing the sources for which CCS might be relevant, transport of CO 2 <strong>and</strong><br />
<strong>storage</strong> options (Courtesy of CO2CRC).<br />
emissions (see Figure SPM.1) (Sections 1.2, 1.4, 2.2, Table<br />
2.3).<br />
4. The net reduction of emissions to the atmosphere through<br />
CCS depends on the fraction of CO 2 <strong>capture</strong>d, the<br />
increased CO 2 production resulting from loss in overall<br />
efficiency of power plants or industrial processes due to<br />
the additional energy required for <strong>capture</strong>, transport <strong>and</strong><br />
<strong>storage</strong>, any leakage from transport <strong>and</strong> the fraction of<br />
CO 2 retained in <strong>storage</strong> over the long term.<br />
Available technology <strong>capture</strong>s about 85–95% of the CO 2<br />
processed in a <strong>capture</strong> plant. A power plant equipped with<br />
a CCS system (with access to geological or ocean <strong>storage</strong>)<br />
would need roughly 10–40% 4 more energy than a plant of<br />
equivalent output without CCS, of which most is for <strong>capture</strong><br />
<strong>and</strong> compression. For secure <strong>storage</strong>, the net result is that a<br />
power plant with CCS could reduce CO 2 emissions to the<br />
atmosphere by approximately 80–90% compared to a plant<br />
without CCS (see Figure SPM.2). To the extent that leakage<br />
might occur from a <strong>storage</strong> reservoir, the fraction retained is<br />
defined as the fraction of the cumulative amount of injected<br />
CO 2 that is retained over a specified period of time. CCS<br />
systems with <strong>storage</strong> as mineral <strong>carbon</strong>ates would need 60–<br />
Reference<br />
Plant<br />
Plant<br />
with CCS<br />
CO 2 avoided<br />
CO 2 <strong>capture</strong>d<br />
Emitted<br />
Captured<br />
CO2 produced (kg/kWh)<br />
Figure SPM. . CO2 <strong>capture</strong> <strong>and</strong> <strong>storage</strong> from power plants.<br />
The increased CO2 production resulting from the loss in overall<br />
efficiency of power plants due to the additional energy required for<br />
<strong>capture</strong>, Figuur transport 8.2 <strong>and</strong> <strong>storage</strong> <strong>and</strong> any leakage from transport result<br />
in a larger amount of “CO2 produced per unit of product” (lower<br />
bar) relative to the reference plant (upper bar) without <strong>capture</strong><br />
(Figure 8.2).<br />
4 The range reflects three types of power plants: for Natural Gas Combined Cycle plants, the range is 11–22%, for Pulverized Coal plants, 24–40% <strong>and</strong> for<br />
Integrated Gasification Combined Cycle plants, 14–25%.


