Comparative Analysis of Indian Stock Market with ... - Great Lakes
Comparative Analysis of Indian Stock Market with ... - Great Lakes
Comparative Analysis of Indian Stock Market with ... - Great Lakes

Create successful ePaper yourself
Turn your PDF publications into a flip-book with our unique Google optimized e-Paper software.
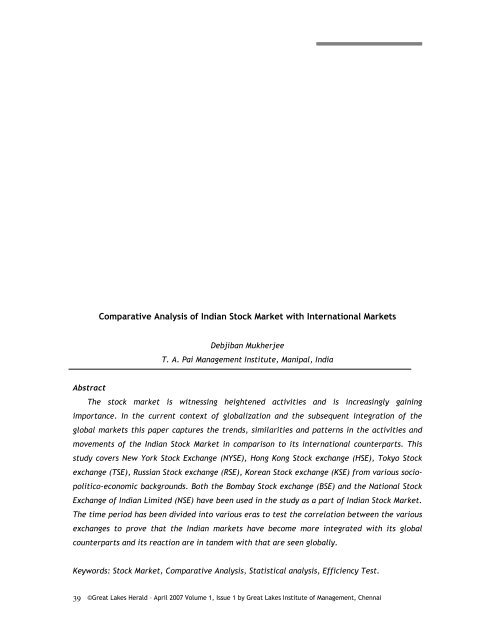
Abstract<br />
39<br />
<strong>Comparative</strong> <strong>Analysis</strong> <strong>of</strong> <strong>Indian</strong> <strong>Stock</strong> <strong>Market</strong> <strong>with</strong> International <strong>Market</strong>s<br />
Debjiban Mukherjee<br />
T. A. Pai Management Institute, Manipal, India<br />
The stock market is witnessing heightened activities and is increasingly gaining<br />
importance. In the current context <strong>of</strong> globalization and the subsequent integration <strong>of</strong> the<br />
global markets this paper captures the trends, similarities and patterns in the activities and<br />
movements <strong>of</strong> the <strong>Indian</strong> <strong>Stock</strong> <strong>Market</strong> in comparison to its international counterparts. This<br />
study covers New York <strong>Stock</strong> Exchange (NYSE), Hong Kong <strong>Stock</strong> exchange (HSE), Tokyo <strong>Stock</strong><br />
exchange (TSE), Russian <strong>Stock</strong> exchange (RSE), Korean <strong>Stock</strong> exchange (KSE) from various socio-<br />
politico-economic backgrounds. Both the Bombay <strong>Stock</strong> exchange (BSE) and the National <strong>Stock</strong><br />
Exchange <strong>of</strong> <strong>Indian</strong> Limited (NSE) have been used in the study as a part <strong>of</strong> <strong>Indian</strong> <strong>Stock</strong> <strong>Market</strong>.<br />
The time period has been divided into various eras to test the correlation between the various<br />
exchanges to prove that the <strong>Indian</strong> markets have become more integrated <strong>with</strong> its global<br />
counterparts and its reaction are in tandem <strong>with</strong> that are seen globally.<br />
Keywords: <strong>Stock</strong> <strong>Market</strong>, <strong>Comparative</strong> <strong>Analysis</strong>, Statistical analysis, Efficiency Test.<br />
©<strong>Great</strong> <strong>Lakes</strong> Herald – April 2007 Volume 1, Issue 1 by <strong>Great</strong> <strong>Lakes</strong> Institute <strong>of</strong> Management, Chennai
1. Introduction<br />
40<br />
The <strong>Indian</strong> stock exchanges hold a place <strong>of</strong> prominence not only in Asia but also at the<br />
global stage. The Bombay <strong>Stock</strong> Exchange (BSE) is one <strong>of</strong> the oldest exchanges across the<br />
world, while the National <strong>Stock</strong> Exchange (NSE) is among the best in terms <strong>of</strong> sophistication<br />
and advancement <strong>of</strong> technology. The <strong>Indian</strong> stock market scene really picked up after the<br />
opening up <strong>of</strong> the economy in the early nineties. The whole <strong>of</strong> nineties were used to<br />
experiment and fine tune an efficient and effective system. The ‘badla’ system was stopped to<br />
control unnecessary volatility while the derivatives segment started as late as 2000. The<br />
corporate governance rules were gradually put in place which initiated the process <strong>of</strong> bringing<br />
the listed companies at a uniform level. On the global scale, the economic environment started<br />
taking paradigm shift <strong>with</strong> the ‘dot com bubble burst’, 9/11, and soaring oil prices. The<br />
slowdown in the US economy and interest rate tightening made the equation more complex.<br />
However after 2000 riding on a robust growth and a maturing economy and relaxed regulations,<br />
outside investors- institutional and others got more scope to operate. This opening up <strong>of</strong> the<br />
system led to increased integration <strong>with</strong> heightened cross-border flow <strong>of</strong> capital, <strong>with</strong> India<br />
emerging as an investment ‘hot spot’ resulting in our stock exchanges being impacted by global<br />
cues like never before.<br />
The study pertains to comparative analysis <strong>of</strong> the <strong>Indian</strong> <strong>Stock</strong> <strong>Market</strong> <strong>with</strong> respect to<br />
various international counterparts. Exchanges are now crossing national boundaries to extend<br />
their service areas and this has led to cross-border integration. Also, exchanges have begun to<br />
<strong>of</strong>fer cross-border trading to facilitate overseas investment options for investors. This not only<br />
increased the appeal <strong>of</strong> the exchange for investors but also attracts more volume. Exchanges<br />
regularly solicit companies outside their home territory and encourage them to list on their<br />
exchange and global competition has put pressure on corporations to seek capital outside their<br />
home country. The <strong>Indian</strong> stock market is the world third largest stock market on the basis <strong>of</strong><br />
investor base and has a collective pool <strong>of</strong> about 20 million investors. There are over 9,000<br />
companies listed on the stock exchanges <strong>of</strong> the country. The Bombay <strong>Stock</strong> Exchange,<br />
established in 1875, is the oldest in Asia. National <strong>Stock</strong> Exchange, a more recent<br />
establishment which came into existence in 1992, is the largest and most advanced stock<br />
market in India is also the third biggest stock exchange in Asia in terms <strong>of</strong> transactions. It is<br />
among the 5 biggest stock exchanges in the world in terms <strong>of</strong> transactions volume.<br />
©<strong>Great</strong> <strong>Lakes</strong> Herald – April 2007 Volume 1, Issue 1 by <strong>Great</strong> <strong>Lakes</strong> Institute <strong>of</strong> Management, Chennai
Origin <strong>of</strong> various stock exchanges:<br />
41<br />
The origin <strong>of</strong> the New York <strong>Stock</strong> Exchange (NYSE) is dated back to May 17, 1792, when the<br />
Buttonwood Agreement was signed by twenty-four stock brokers outside <strong>of</strong> 68 Wall Street in<br />
New York under a buttonwood tree. Also called the “Big Board”, it is the largest stock<br />
exchange in the world in terms <strong>of</strong> dollar volume and second largest in terms <strong>of</strong> number <strong>of</strong><br />
companies listed. The Tokyo stock exchange was established on May 15, 1878 and trading<br />
began on June 1, 1878. In 1943, the exchange was combined <strong>with</strong> ten other stock exchanges in<br />
major Japanese cities to form a single Japanese <strong>Stock</strong> Exchange. It is the second largest stock<br />
exchange market in terms <strong>of</strong> monetary volume and currently has 2302 listed companies. The<br />
Hong Kong stock exchange is the 8th largest stock exchange in the world in terms <strong>of</strong> <strong>Market</strong><br />
capitalization. The Hang Sang Index (HIS), was started on November 24, 1969. The Russian<br />
stock exchange was established in 1995 by consolidating the separate regional stock exchanges<br />
into one uniformly regulated trading floor. The Korea stock exchange was created by the<br />
integration <strong>of</strong> the three existing <strong>of</strong> the Korean Spots and Futures exchanges (Korean stock<br />
exchange, Korean futures exchange & KOSDAQ) under the Korea <strong>Stock</strong> and Futures Exchange<br />
Act.3.5. In this paper, the names <strong>of</strong> the countries and the names <strong>of</strong> the indices <strong>of</strong> those<br />
countries have been used interchangeably. Thus, the names <strong>of</strong> the countries represent the<br />
indices for the purpose <strong>of</strong> analysis and they need to be interpreted that way. Again, all the<br />
analyses have been done <strong>with</strong> the closing prices. The following table gives the country and the<br />
exchange <strong>with</strong> the name <strong>of</strong> its indices.<br />
Country <strong>Stock</strong> exchange name Indices name<br />
India National <strong>Stock</strong> Exchange S & P Nifty<br />
India Bombay <strong>Stock</strong> Exchange Sensex<br />
Hong Kong Hong Kong <strong>Stock</strong> Exchange Hang Seng<br />
USA New York <strong>Stock</strong> Exchange NYSE<br />
Korea Korean <strong>Stock</strong> Exchange KRX 100<br />
Russian Russian <strong>Stock</strong> Exchange RTS Index<br />
2. Past Studies<br />
Poshakwale, Sunil (2002) examined the random walk hypothesis in the emerging <strong>Indian</strong><br />
stock market by testing for the nonlinear dependence using a large disaggregated daily data<br />
from the <strong>Indian</strong> stock market. The sample used was 38 actively traded stocks in the BSE<br />
National Index. He found that the daily returns from the <strong>Indian</strong> market do not conform to a<br />
random walk. Daily returns from most individual stocks and the equally weighted portfolio<br />
exhibit significant non-linear dependence. This is largely consistent <strong>with</strong> previous research that<br />
has shown evidence <strong>of</strong> non-linear dependence in returns from the stock market indexes and<br />
©<strong>Great</strong> <strong>Lakes</strong> Herald – April 2007 Volume 1, Issue 1 by <strong>Great</strong> <strong>Lakes</strong> Institute <strong>of</strong> Management, Chennai
individual stocks in the US and the UK. Noor, Azuddin Yakob, Diana Beal and Delpachitra,<br />
Sarath (2006) studied the stock market seasonality in terms <strong>of</strong> day-<strong>of</strong>-the-week, month-<strong>of</strong>-the-<br />
year, monthly and holiday effects in ten Asian stock markets, namely, Australia, China, Hong<br />
Kong, Japan, India, Indonesia, Malaysia, Singapore, South Korea and Taiwan. He concluded that<br />
the existence <strong>of</strong> seasonality in stock markets and also suggested that this is a global<br />
phenomenon.<br />
Linkage patterns:<br />
42<br />
Masih, M.M. Abul and Masih, Rumi (1997) examined the dynamic linkage patterns among<br />
national stock exchange prices <strong>of</strong> four Asian newly industrializing countries - Taiwan, South<br />
Korea, Singapore and Hong Kong. The sample used comprised end-<strong>of</strong>-the-month closing share<br />
price indices <strong>of</strong> the four NIC stock markets from January 1982 to June 1994. They concluded<br />
that the study <strong>of</strong> these markets are not mutually exclusive <strong>of</strong> each other and significant short-<br />
run linkages appear to run among them. Lau, S T and Diltz, J.D. (1994) studied the transfer <strong>of</strong><br />
information among Tokyo and New York stock exchanges. Agarwal, R N (2000) examined the<br />
financial integration <strong>of</strong> capital markets in developing nations gave insight <strong>with</strong> regards to the<br />
methodology and the area <strong>of</strong> study followed.<br />
In a similar study by Bae, K, Cha, B, and Cheung, Y (1999) the researchers tried to show the<br />
information transmission mechanism that operates for stocks which are dually listed. This has<br />
helped in understanding the channel <strong>of</strong> transmission <strong>of</strong> information that makes the exchanges<br />
dependant on each other.<br />
3. Problem<br />
Presently, the fluctuations in the <strong>Indian</strong> market are attributed heavily to cross border<br />
capital flows in the form <strong>of</strong> FDI, FII and to reaction <strong>of</strong> <strong>Indian</strong> market to global market cues. In<br />
this context, understanding the relationship and influence <strong>of</strong> various exchanges on each other<br />
is very important. This study that compares global exchanges which are from different geo-<br />
politico-socio-economic areas. With the cross border movements <strong>of</strong> capital like never before in<br />
the form <strong>of</strong> FDI and FII, coupled <strong>with</strong> the easing <strong>of</strong> restrictions bringing various stock exchanges<br />
at par in terms <strong>of</strong> system and regulations, it can be assumed reasonably that a particular stock<br />
exchange will have some impact on other exchanges.<br />
4. Objectives<br />
The main objective <strong>of</strong> this study is to capture the trends, similarities and patterns in the<br />
activities and movements <strong>of</strong> the <strong>Indian</strong> <strong>Stock</strong> <strong>Market</strong> in comparison to its international<br />
counterparts. The aim is to help the investors (current and potential) understand the impact <strong>of</strong><br />
©<strong>Great</strong> <strong>Lakes</strong> Herald – April 2007 Volume 1, Issue 1 by <strong>Great</strong> <strong>Lakes</strong> Institute <strong>of</strong> Management, Chennai
important happenings on the <strong>Indian</strong> <strong>Stock</strong> exchange. This is especially relevant in the current<br />
scenario when the financial markets across the globe are getting integrated into one big<br />
market and the impact <strong>of</strong> one exchange on the other exchanges. In other words, the intention<br />
is to test the hypothesis, ‘whether various stock exchanges globally have any impact on each<br />
other’ or they are correlated in any way <strong>with</strong> regard to their movements and, if so, to what<br />
extent. Arising out <strong>of</strong> the main hypothesis is the question - given the above context: What<br />
impact would the result have on the understanding that international diversification <strong>of</strong><br />
investment is desirable and pr<strong>of</strong>itable <strong>with</strong> regard to both risk and return?<br />
5. Methodology<br />
43<br />
For the comparative analysis <strong>of</strong> the different stock exchanges, the period chosen is from<br />
1st January 1995 to 31st July, 2006. This period is divided into different sets <strong>of</strong> years, like<br />
1995-97, 1999-01, 2001-03, and 2003-06, in order to capture the effect and movement <strong>of</strong> stock<br />
exchanges <strong>with</strong> each other during different periods. The economic situation changes during<br />
different times. 1995-1997 period represents the East Asian miracle and crisis period, 1999-<br />
2001 represents technology boom and tech bubble bursting period, 2001-2003 represents the<br />
slow global recovery from the recession, 2003-2006 period represents the investment boom<br />
period especially in the developing and emerging markets. The world is divided into four main<br />
regions, namely, the US, Euro region, India and Asian region. <strong>Stock</strong> exchanges representing<br />
various regions used in this study include NSE (India), NYSE (USA), Hang Seng (South East Asia),<br />
Russian <strong>Stock</strong> Exchange (Russia), Korea (Asia). The number <strong>of</strong> sample units for this study is five.<br />
<strong>Comparative</strong> <strong>Analysis</strong><br />
This is the main part <strong>of</strong> the study wherein the various stock exchanges <strong>of</strong> the sample have<br />
been compared on certain parameters, both qualitatively and quantitatively.<br />
Qualitative <strong>Analysis</strong><br />
In this section the various stock exchanges have been compared on the following<br />
parameters;<br />
1. <strong>Market</strong> Capitalization<br />
2. number <strong>of</strong> listed securities<br />
3. listing agreements<br />
4. circuit filters<br />
5. settlement<br />
These parameters are used to look at selected important aspects <strong>of</strong> any stock exchange, viz.,<br />
the market capitalization gives an idea about the size <strong>of</strong> the respective exchanges; whereas<br />
©<strong>Great</strong> <strong>Lakes</strong> Herald – April 2007 Volume 1, Issue 1 by <strong>Great</strong> <strong>Lakes</strong> Institute <strong>of</strong> Management, Chennai
the number <strong>of</strong> listed securities acts as an indicator for the volume and liquidity <strong>of</strong> any<br />
exchange. The listing agreements take care <strong>of</strong> the governance issue, while circuit filters give<br />
an insight into the risk management framework <strong>of</strong> the said exchange. Finally, the efficiency <strong>of</strong><br />
a stock exchange has been measured in terms <strong>of</strong> its settlement process.<br />
<strong>Market</strong> Capitalization<br />
44<br />
<strong>Market</strong> capitalization is the measure <strong>of</strong> corporate size <strong>of</strong> a country. It shows the current<br />
stock price multiplied by the number <strong>of</strong> outstanding shares. It is commonly referred to as<br />
<strong>Market</strong> cap. It is calculated by multiplying the number <strong>of</strong> common shares <strong>with</strong> the current price<br />
<strong>of</strong> those shares. This term is <strong>of</strong>ten confused <strong>with</strong> capitalization, which is the total amount <strong>of</strong><br />
funds used to finance a firm's balance sheet and is calculated as market capitalization plus<br />
debt (book or market value) plus preferred stock. While there are no strong definitions for<br />
market cap categorizations, a few terms are frequently used to group companies based on its<br />
capitalization. The table below shows the market capitalization <strong>of</strong> various stock markets in the<br />
world.<br />
Based on the above study, it can be observed that India is 15th in the world ranking <strong>of</strong> <strong>Market</strong><br />
capitalization. This is in spite <strong>of</strong> having the third largest investor base, after Japan and USA,<br />
©<strong>Great</strong> <strong>Lakes</strong> Herald – April 2007 Volume 1, Issue 1 by <strong>Great</strong> <strong>Lakes</strong> Institute <strong>of</strong> Management, Chennai
and having the largest number <strong>of</strong> companies listed. United States leads the list <strong>of</strong> countries<br />
<strong>with</strong> the highest market capitalization. It is interesting to note that the total market<br />
capitalization <strong>of</strong> all the companies listed on the New York <strong>Stock</strong> Exchange is greater than the<br />
amount <strong>of</strong> money in the United States. As mentioned earlier, the above data pertain to the<br />
year 2005. The individual and global economy has grown since then. As on March 2006, the<br />
global market capitalization for all stock markets was $43600 billion.<br />
Listed Securities<br />
45<br />
Listing in a stock exchange refers to the admission <strong>of</strong> the securities <strong>of</strong> the company for<br />
trade dealings in a recognized stock exchange. The securities may be <strong>of</strong> any public limited<br />
company, Central or State Government, quasi-governmental and other financial<br />
institutions/corporations, municipalities, etc. Securities <strong>of</strong> any company are listed in a stock<br />
exchange to provide liquidity to the securities, to mobilize savings and to protect the interests<br />
<strong>of</strong> the investors.<br />
India has the highest number <strong>of</strong> companies listed in the stock market. Out <strong>of</strong> this, about 75<br />
% <strong>of</strong> the companies are listed <strong>with</strong> the Bombay <strong>Stock</strong> Exchange. After India, United States has<br />
the highest number <strong>of</strong> companies listed.<br />
©<strong>Great</strong> <strong>Lakes</strong> Herald – April 2007 Volume 1, Issue 1 by <strong>Great</strong> <strong>Lakes</strong> Institute <strong>of</strong> Management, Chennai
Indices<br />
Listing Agreements<br />
Bombay <strong>Stock</strong> Exchange<br />
46<br />
Eligibility Criteria for IPOs/FPOs: Companies have been classified as large cap companies<br />
and small cap companies. Company <strong>with</strong> a minimum issue size <strong>of</strong> Rs. 10 crores and market<br />
capitalization small cap company is a company other than a large cap company.<br />
National <strong>Stock</strong> Exchange<br />
Eligibility Criteria for New companies (IPOs)<br />
Paid Up capital: Not less than 10 Crores<br />
<strong>Market</strong> Capitalisation: Not less than 25 Crores<br />
At least three years track record:<br />
• The company has not been referred to the Board for Industrial and Financial<br />
Reconstruction (BIFR).<br />
• The networth <strong>of</strong> the company has not been wiped out by the accumulated losses<br />
resulting in a negative networth.<br />
• The company has not received any winding up petition accepted by a court.<br />
©<strong>Great</strong> <strong>Lakes</strong> Herald – April 2007 Volume 1, Issue 1 by <strong>Great</strong> <strong>Lakes</strong> Institute <strong>of</strong> Management, Chennai
47<br />
• ‘Promoters’ mean one or more persons <strong>with</strong> a minimum 3 years’ experience <strong>of</strong> each <strong>of</strong><br />
them in the same line <strong>of</strong> business and shall be holding at least 20% <strong>of</strong> the post issue<br />
equity share capital individually or severally<br />
• No disciplinary action by other stock exchanges and regulatory authorities in past three<br />
years.<br />
Existing Companies listed on other stock exchanges<br />
Paid up Capital: Not less than 10 Crores<br />
<strong>Market</strong> Capitalization: Not less than 25 crores.<br />
Minimum Listing Requirements for companies listed on other stock exchanges. The company<br />
should have minimum issued and paid up equity capital <strong>of</strong> Rs. 3 crores. The Company should<br />
have pr<strong>of</strong>it making track record for last three years.<br />
paid up capital.<br />
Minimum net worth <strong>of</strong> Rs. 20 crores<br />
Minimum market capitalization <strong>of</strong> the listed capital should be at least two times <strong>of</strong> the<br />
New York <strong>Stock</strong> Exchange<br />
Domestic listing on NYSE requires minimum certain minimum standards to be met.<br />
Distribution and Size criteria<br />
Distribution <strong>of</strong> shares can be attained through U.S. public <strong>of</strong>ferings, acquisitions made in<br />
the U.S., or by other similar means.<br />
©<strong>Great</strong> <strong>Lakes</strong> Herald – April 2007 Volume 1, Issue 1 by <strong>Great</strong> <strong>Lakes</strong> Institute <strong>of</strong> Management, Chennai
Financial Criteria<br />
(A) The number <strong>of</strong> beneficial holders <strong>of</strong> stock held in "street name" will be considered in<br />
addition to the holders <strong>of</strong> record. The Exchange will make any necessary check <strong>of</strong> such holdings<br />
that are in the name <strong>of</strong> Exchange member organizations.<br />
(B) In connection <strong>with</strong> initial public <strong>of</strong>ferings, spin-<strong>of</strong>fs and carve-outs, the NYSE will accept an<br />
undertaking from the company's underwriter to ensure that the <strong>of</strong>fering will meet or exceed<br />
the NYSE's standards.<br />
(C) If a company either has a significant concentration <strong>of</strong> stock or changing market forces have<br />
adversely impacted the public market value <strong>of</strong> a company that otherwise would qualify for an<br />
Exchange listing, such that its public market value is no more than 10 percent below the<br />
minimum, the Exchange will consider stockholders' equity <strong>of</strong> $60 million or $100 million, as<br />
applicable, as an alternate measure <strong>of</strong> size.<br />
(D) Pre-tax income is adjusted for various items as defined in Section 102.01C <strong>of</strong> the NYSE<br />
Listed Company Manual.<br />
(E) Represents net cash provided by operating activities excluding the changes in working<br />
capital or in operating assets and liabilities, as adjusted for various items as defined in Section<br />
102.01C <strong>of</strong> the NYSE Listed Company Manual. Average global market capitalization for already<br />
existing public companies is represented by the most recent six months <strong>of</strong> trading history. For<br />
IPOs, spin-<strong>of</strong>fs and carve-outs, it is represented by the valuation <strong>of</strong> the company as<br />
represented by, in the case <strong>of</strong> a spin-<strong>of</strong>f, the distribution ratio as priced, or, in the case <strong>of</strong> an<br />
IPO/carve-out, the as-priced <strong>of</strong>fering in relation to the total company's capitalization.<br />
48<br />
©<strong>Great</strong> <strong>Lakes</strong> Herald – April 2007 Volume 1, Issue 1 by <strong>Great</strong> <strong>Lakes</strong> Institute <strong>of</strong> Management, Chennai
Tokyo <strong>Stock</strong> Exchange<br />
Criteria for Listing<br />
The number <strong>of</strong> shareholders:<br />
49<br />
• In case where the number <strong>of</strong> shares to be listed is less than 10 thousand units; 800<br />
persons.<br />
• In case where the number <strong>of</strong> shares to be listed is 10 thousand units or more but less<br />
than 20 thousand units; 1,000 persons,<br />
• In case where the number <strong>of</strong> shares to be listed is 20 thousand units or more; 1,200<br />
persons.<br />
Number <strong>of</strong> years since incorporation:<br />
3 years or more have elapsed by the last day <strong>of</strong> a business year immediately prior to the<br />
day <strong>of</strong> listing application<br />
Amount <strong>of</strong> pr<strong>of</strong>it:<br />
The amount <strong>of</strong> pr<strong>of</strong>it for the first year <strong>of</strong> the latest 2 years was 100 million yen or more;<br />
and 400 million yen or more for the latest year, or<br />
The amount <strong>of</strong> pr<strong>of</strong>it for the first year <strong>of</strong> the latest 3 years was 100 million yen or more;<br />
400 million yen or more for the latest one year <strong>of</strong> the latest 3 years; and the aggregate amount<br />
<strong>of</strong> pr<strong>of</strong>its for all <strong>of</strong> the latest 3 years was 600 million yen or more.<br />
Hong Kong <strong>Stock</strong> Exchange<br />
Basic Listing Requirements for Equities<br />
• Pr<strong>of</strong>it attributable to shareholders: At least HK$50 million in the last three financial<br />
years<br />
• <strong>Market</strong> Capitalisation: At least HK$200 million at the time <strong>of</strong> listing<br />
• Revenue: At least HK$500 million for the most recent audited financial year<br />
• Cashflow: Positive cashflow from operating activities <strong>of</strong> at least HK$100 million in<br />
aggregate for the three preceding financial years<br />
Spread <strong>of</strong> Shareholders:<br />
• 100 shareholders for issuers <strong>with</strong> 24 months <strong>of</strong> active business pursuits.<br />
• 300 shareholders for issuers <strong>with</strong> 12 months <strong>of</strong> active business pursuits.<br />
Public float:<br />
• At least 25% <strong>of</strong> the issuer's total issued share capital must at all times be held by the<br />
public.<br />
©<strong>Great</strong> <strong>Lakes</strong> Herald – April 2007 Volume 1, Issue 1 by <strong>Great</strong> <strong>Lakes</strong> Institute <strong>of</strong> Management, Chennai
Korea <strong>Stock</strong> Exchange<br />
Quantitative Requirement<br />
50<br />
No <strong>of</strong> Shares: At least 1million shares as <strong>of</strong> application date.<br />
Net Worth: At least KRW 10 billion as <strong>of</strong> application date.<br />
Sales Amount: At least KRW 30 billion for the latest fiscal year and the average for the<br />
latest three fiscal years should be at least KRW 20 billion.<br />
Financial Requirement<br />
Pr<strong>of</strong>it: Must show operating pr<strong>of</strong>its, ordinary pr<strong>of</strong>its and net pr<strong>of</strong>its.<br />
Pr<strong>of</strong>its for the latest fiscal year should be at least KRW 2.5 billion and the sum for the<br />
latest three fiscal years should be KRW 5 billion.<br />
Reserve Ratio: At least 50% (25% for large corporations) according to the balance sheet <strong>of</strong><br />
the latest fiscal year.<br />
Reserve ratio = [(Net worth - Paid-in Capital) / Paid-in Capital] * 100<br />
No <strong>of</strong> years since establishment: Have been operating <strong>with</strong>out interruption for at least 3<br />
years since establishment.<br />
Circuit filters<br />
<strong>Stock</strong> <strong>Market</strong>s have the dubious reputation <strong>of</strong> crashing <strong>with</strong>out a warning taking <strong>with</strong> the<br />
savings <strong>of</strong> numerous investors. A stock market crash is a sudden dramatic decline <strong>of</strong> stock<br />
prices across a significant cross-section <strong>of</strong> a market. Crashes are driven by panic as much as by<br />
underlying economic factors. They <strong>of</strong>ten follow speculative stock market bubbles such as the<br />
dot-com bubble.<br />
The study is restricted to the performance <strong>of</strong> the <strong>Indian</strong> <strong>Stock</strong> market, Japan, Hong Kong,<br />
Korean, Russian and the New York <strong>Stock</strong> exchanges. Hence we will be concentrating on the<br />
Asian Financial Crisis, Dot-Com Bubble, and the Russian Financial Crisis etc.<br />
As a counter measure to the instability <strong>of</strong> the stock market, various measures were<br />
introduced by to avoid huge losses. One such solution is circuit breakers. Circuit Breakers are<br />
“a point at which a stock market will stop trading for a period <strong>of</strong> time in response to<br />
substantial drops in value.”(11) They are also referred to as trading curb is certain stock<br />
markets like DJIA and NYSE. This was first introduced after Black Monday. Black Monday is the<br />
name given to Monday, October 19, 1987, when the Dow Jones Industrial Average (DJIA) fell<br />
22.6%.(12). This was done <strong>with</strong> an aim to avert panic in the market and to avoid panic selling.<br />
The Circuit Filters operate according to the rules and requirements <strong>of</strong> the stock <strong>Market</strong> in<br />
question.<br />
©<strong>Great</strong> <strong>Lakes</strong> Herald – April 2007 Volume 1, Issue 1 by <strong>Great</strong> <strong>Lakes</strong> Institute <strong>of</strong> Management, Chennai
NSE<br />
Index-based <strong>Market</strong>-wide Circuit Breakers<br />
51<br />
The index-based market-wide circuit breaker system applies at three stages <strong>of</strong> the index<br />
movement, either way viz. at 10%, 15% and 20%. These circuit breakers, when triggered, bring<br />
about a coordinated trading halt in all equity and equity derivative markets nationwide. The<br />
market-wide circuit breakers are triggered by movement <strong>of</strong> either the BSE Sensex or the NSE<br />
S&P CNX Nifty, whichever is breached earlier.<br />
• In case <strong>of</strong> a 10% movement <strong>of</strong> either <strong>of</strong> these indices, there would be a one-hour market halt<br />
if the movement takes place before 1:00 p.m. In case the movement takes place at or after<br />
1:00 p.m. but before 2:30 p.m., there would be trading halt for ½ hour. In case movement<br />
takes place at or after 2:30 p.m., there will be no trading halt at the 10% level and market<br />
shall continue trading.<br />
• In case <strong>of</strong> a 15% movement <strong>of</strong> either index, there shall be a two-hour halt if the movement<br />
takes place before 1 p.m. If the 15% trigger is reached on or after 1:00 p.m. but before 2:00<br />
p.m., there shall be a one hour halt. If the 15% trigger is reached on or after 2:00 p.m., the<br />
trading shall halt for the remainder <strong>of</strong> the day.<br />
• In case <strong>of</strong> a 20% movement <strong>of</strong> the index, trading shall be halted for the remainder <strong>of</strong> the day.<br />
These percentages are translated into absolute points <strong>of</strong> index variations on a quarterly<br />
basis. At the end <strong>of</strong> each quarter, these absolute points <strong>of</strong> index variations are revised for the<br />
applicability for the next quarter. The absolute points are calculated based on closing level <strong>of</strong><br />
index on the last day <strong>of</strong> the trading in a quarter and rounded <strong>of</strong>f to the nearest 10 points in<br />
case <strong>of</strong> S&P CNX Nifty.<br />
©<strong>Great</strong> <strong>Lakes</strong> Herald – April 2007 Volume 1, Issue 1 by <strong>Great</strong> <strong>Lakes</strong> Institute <strong>of</strong> Management, Chennai
52<br />
In addition to this, there are also price bands for individual securities. Daily price bands<br />
are applicable on securities as below:<br />
BSE<br />
• Daily price bands <strong>of</strong> 2% (either way) on specified securities.<br />
• Daily price bands <strong>of</strong> 5% (either way) on specified securities.<br />
• Daily price bands <strong>of</strong> 10% (either way) on specified securities.<br />
• No price bands are applicable on scrips on which derivative products are available or<br />
scrips included in indices on which derivative products are available.<br />
• Price bands <strong>of</strong> 20% (either way) on all remaining scrips (including debentures, warrants,<br />
preference shares etc). The price bands for the securities in the Limited Physical<br />
<strong>Market</strong> are the same as those applicable for the securities in the Normal <strong>Market</strong>. For<br />
Auction market the price bands <strong>of</strong> 20% are applicable.<br />
• In order to prevent members from entering orders at non-genuine prices in such<br />
securities, the Exchange has fixed operating range <strong>of</strong> 20% for such securities.<br />
Scrip wise Price Bands<br />
1. For scrips (53 scrips) on which derivative products are available and scrips which are<br />
included in indices on which derivative products are available, there is no circuit filter.<br />
However, the Exchange has imposed dummy circuit fitters on these scrips to avoid punching<br />
error, if any.<br />
2. Other Scrips which are not included in above-mentioned category have a circuit filter limit<br />
<strong>of</strong> 20%.<br />
<strong>Market</strong> Wide Circuit Breakers<br />
In addition to the above-stated price bands on individual scrips, SEBI has decided to<br />
implement index based market wide circuit breakers system <strong>with</strong> effect from July 02, 2001.The<br />
circuit breakers are applicable at three stages <strong>of</strong> the index movement either way at 10%, 15%<br />
and 20%. These circuit breakers will bring about a coordinated trading halt in both Equity and<br />
Derivative market.<br />
The market wide circuit breakers can be triggered by movement <strong>of</strong> either BSE SENSEX or<br />
the NSE NIFTY, whichever is breached earlier. The percentage movements are calculated on<br />
the closing index value <strong>of</strong> the quarter. These percentages are translated into absolute points <strong>of</strong><br />
index variation (rounded <strong>of</strong>f to the nearest 25 points in case <strong>of</strong> SENSEX). At the end <strong>of</strong> each<br />
quarter, these absolute points <strong>of</strong> index variations are revised and made applicable for the next<br />
quarter. The absolute points <strong>of</strong> SENSEX variation triggering market wide circuit breaker for a<br />
©<strong>Great</strong> <strong>Lakes</strong> Herald – April 2007 Volume 1, Issue 1 by <strong>Great</strong> <strong>Lakes</strong> Institute <strong>of</strong> Management, Chennai
specified time period for any day <strong>of</strong> the quarter is informed by the Exchange through Press<br />
Release from time to time.<br />
Tokyo <strong>Stock</strong> Exchange<br />
53<br />
There are two circuit breakers which last for only 15 minutes after the price limit is hit.<br />
The first circuit breaker takes effect when the price is 5% above or below the previous trading<br />
day’s settlement price. Another 5% change in the same direction, or a total <strong>of</strong> 10%, will trigger<br />
the second circuit breaker. Limits do not apply to the last 30 minutes <strong>of</strong> the trading day, unless<br />
the 15-minute cooling period spills into that time frame. There are no limits for the last day <strong>of</strong><br />
trading for the contract nearest to expiry.<br />
NYSE<br />
Trading halts are applied by the New York <strong>Stock</strong> Exchange (“NYSE”) under conditions <strong>of</strong><br />
extreme market volatility. The circuit breaker trigger points are set at three levels<br />
representing 10%, 20% and 30% <strong>of</strong> the Dow Jones Industrial Average. The levels are calculated<br />
by the NYSE at the beginning <strong>of</strong> each calendar quarter, using the average closing value <strong>of</strong> the<br />
DJIA for the preceding month and each trigger is rounded to the nearest 50 points. For the<br />
third quarter 2006, the following triggers are in place.<br />
Level 1 circuit breaker triggered if losses are 10% or 1,050 points<br />
(a) before 2:00 p.m. – halted one hour;<br />
(b) at 2:00 p.m. or later but before 2:30 p.m. – halted 30 minutes;<br />
(c) at 2:30 p.m. or later - trading shall continue, unless there is a Level 2 or 3 halt.<br />
Level 2 circuit breaker triggered if losses are 20% or 2,100 points<br />
(a) before 1:00 p.m. – halted two hours;<br />
(b) at 1:00 p.m. or later but before 2:00 p.m. – halted one hour;<br />
(c) at 2:00 p.m. or later - trading shall halt and not resume for the remainder <strong>of</strong> the day.<br />
Level 3 circuit breaker triggered if losses are 30% or 3,150 points<br />
(a) at any time - trading shall halt and not resume for the remainder <strong>of</strong> the day.<br />
Korean <strong>Stock</strong> Exchange<br />
Daily price change limit<br />
To avoid abnormal price fluctuations caused by imbalance in supply and demand, the KRX-<br />
<strong>Stock</strong> <strong>Market</strong> places ± 15% <strong>of</strong> limit that the prices on individual stocks can change during a day,<br />
thus preventing fall or rise <strong>of</strong> the price <strong>of</strong> individual stock more than 15 percent <strong>of</strong> the previous<br />
day’s closing price.<br />
©<strong>Great</strong> <strong>Lakes</strong> Herald – April 2007 Volume 1, Issue 1 by <strong>Great</strong> <strong>Lakes</strong> Institute <strong>of</strong> Management, Chennai
Circuit Breakers<br />
54<br />
The KSE introduced the Circuit Breakers in December 1998. In order to pacify the over-<br />
reaction <strong>of</strong> investors, when the stock price drops suddenly below certain level (more than 10%<br />
<strong>of</strong> the closing price <strong>of</strong> the previous day and such situation continues for longer than one<br />
minute), the circuit breakers system was introduced on December 7, 1998. The trading, which<br />
resumes by periodic call auction where the orders submitted during the first 10 minutes after<br />
the trading halt ended, are matched at a single price.<br />
Regulation on program trading<br />
As a measure used to minimize possible impacts <strong>of</strong> futures market on cash market, thus<br />
maintaining the stability <strong>of</strong> the cash market, when the price <strong>of</strong> the most active futures<br />
contract continues to change 5 % or more than the base price for one minute, execution <strong>of</strong> all<br />
program trading orders in the cash market is delayed for 5 minutes.<br />
Trading Halt<br />
In order to protect investors, when, due to rumors or reports on the matters (e.g., bank<br />
defaults, bankruptcy, corporate restructure, etc.) that have major implication on corporate<br />
management, sudden and drastic change <strong>of</strong> trading value and volume is anticipated, the<br />
trading <strong>of</strong> such issues may be halted. In such a case, the concerned corporation is asked to<br />
make an inquiry into such rumors or reports and disclose findings.<br />
Hong Kong <strong>Stock</strong> Exchange<br />
Though a circuit-breaker has not been adopted yet, a two-tier circuit-breaker is being<br />
considered, under which trading would stop for half an hour in the event <strong>of</strong> a 15% fluctuation<br />
over the previous day’s close, and for one hour in the event <strong>of</strong> a 25% fluctuation. Another<br />
option being considered is an individual circuit-breaker per stock, which would cause a ten-<br />
minute open-outcry auction to be initiated every time a stock price varied more than 10% over<br />
last day’s close.<br />
Trading and Settlement Cycle<br />
This segment takes care <strong>of</strong> the efficiency issue <strong>of</strong> the said stock exchange. It basically looks<br />
into the speed at which any <strong>of</strong> the numerous transactions affected in the market gets settled.<br />
This is especially crucial given the volume. We see that <strong>Indian</strong> exchanges are at par <strong>with</strong> the<br />
best in the world when it comes to efficient settlement. It can even go one up if the proposed<br />
‘T+1’system is put in place.<br />
©<strong>Great</strong> <strong>Lakes</strong> Herald – April 2007 Volume 1, Issue 1 by <strong>Great</strong> <strong>Lakes</strong> Institute <strong>of</strong> Management, Chennai
55<br />
Below are the various settlement cycles for the stock exchanges.<br />
Quantitative <strong>Analysis</strong>.<br />
The hypothesis that the exchanges impact each other has been tested through various<br />
statistical methods <strong>with</strong> data on price, returns collected from the exchanges. Mainly the<br />
correlation analysis, exponential trend analysis and the risk-return analysis has been used to<br />
validate the hypothesis.<br />
Price Relationship<br />
Correlation is a numerical summary measure that indicates the strength <strong>of</strong> relationships<br />
between the pairs <strong>of</strong> variables. A correlation is very useful but it has its limitations. That is, it<br />
can only measure the strength <strong>of</strong> a linear relationship. The numerator <strong>of</strong> the above formula is<br />
also a measure <strong>of</strong> association between two variables X and Y which is called the covariance<br />
between X and Y. Similar to correlation, a covariance is a single number that measures the<br />
strength <strong>of</strong> the linear relationship between the two variables. It is by looking at the sign <strong>of</strong> the<br />
correlation or the covariance, i.e. positive or negative, that we can tell whether the two<br />
variables are positively or negatively related.<br />
Therefore the correlation is better because, unlike the covariance, the correlations are not<br />
affected by the units in which the variables are measured. All the correlations are between +1<br />
and -1, inclusive. The sign determines whether the relationship is positive or negative. The<br />
strength <strong>of</strong> the relationship is measured by the absolute value or the magnitude <strong>of</strong> the<br />
correlation. The closer it is to +1 the stronger the relationship is and the closer to zero<br />
indicates that there is practically no linear relationship. At the extreme a correlation equal to1<br />
-1 or +1 occurs only when the linear relationship is perfect. In this part the price data <strong>of</strong> the<br />
various exchanges are collected and subjected to a correlation test in order to find out the<br />
influence that they have on each other. In other words, an effort has been made to gain insight<br />
into how far the price movements <strong>of</strong> the exchanges are related <strong>with</strong> one another.<br />
©<strong>Great</strong> <strong>Lakes</strong> Herald – April 2007 Volume 1, Issue 1 by <strong>Great</strong> <strong>Lakes</strong> Institute <strong>of</strong> Management, Chennai
NSE vs. Russian <strong>Stock</strong> Exchange<br />
Fig 1.1<br />
In the above figure, during period 1, the two stock exchanges have moved in a very narrow<br />
range. The volatility is much higher in the NSE than in the Russian stock exchange. There<br />
seemed to be low connectivity between the two exchanges. In period 2, The Russian stock<br />
exchange had seen a peak and also a very heavy drop. But at the same time, NSE did not show<br />
so much variation as shown by Russian stock exchange. The Russian stock exchange was<br />
awarded as the best performing stock exchange in the year 1997. But the very next year it<br />
crashed. The event started <strong>with</strong> collapse <strong>of</strong> one <strong>of</strong> the largest bank in Russia and, for the first<br />
time ever, a country defaulted on its government securities. Then the political environment<br />
became volatile, which led to the ouster <strong>of</strong> Boris Yeltsin and then Putin came to power. NSE<br />
again moved in a range but showed much higher volatility than the previous period. The<br />
Russian market showed the characteristics <strong>of</strong> a ‘grave yard’ market wherein there is so much<br />
wealth loss due to decline <strong>of</strong> the indices that those who are in the market cannot sell <strong>of</strong>f and<br />
come out as no one is willing to buy and get into the market at that current scenario. Period 3<br />
saw reversal <strong>of</strong> roles <strong>of</strong> earlier period. NSE went up and reached a peak and then came down<br />
whereas the Russian stock exchange remained stagnant. NSE rose because <strong>of</strong> tech boom till mid<br />
<strong>of</strong> 2000. Subsequently it collapsed and went back to its level <strong>of</strong> 1998 in the year 2001. Till<br />
2003, NSE remained at the level that it attained in the year 1998. But volatility was much<br />
higher in this period. Russian stock suffered from the period <strong>of</strong> stagnation in this period. The<br />
stock exchange did not respond at all to the tech boom. After the bubble collapse this<br />
exchange started to move up slowly. NSE moved up very sharply responding to the favorable<br />
interest rate regimes and other macroeconomic factors. Growth was very sharp in this period<br />
56<br />
©<strong>Great</strong> <strong>Lakes</strong> Herald – April 2007 Volume 1, Issue 1 by <strong>Great</strong> <strong>Lakes</strong> Institute <strong>of</strong> Management, Chennai<br />
`
for NSE. Russian stock exchange also rose but marginally. But the volatility is higher which<br />
shows that the trading activity has started to pick up. During period 4, both the exchanges rose<br />
sharply and moved in an almost identical fashion. Correlation is also very high during this<br />
period. This shows a lot more integration <strong>of</strong> two markets <strong>with</strong> each other.<br />
NSE vs. Hang Seng<br />
Fig 1.2<br />
In Fig1.2, period 1 shows that there is almost no correlation between these two exchanges.<br />
Hang Seng was rising very sharply because <strong>of</strong> the East Asian miracle. Whereas India, not part <strong>of</strong><br />
this success story, remained almost untouched by this boom. NSE is almost constant during this<br />
period. During period 2, Hang Seng crashed 50 percent and then rose back 100 percent. Thus, it<br />
showed very high volatility during this period. NSE also rose during this period because <strong>of</strong><br />
pervasive tech boom but the rise was not as spectacular as Hang Seng. Hang Seng might also<br />
have risen sharply because <strong>of</strong> its previous low levels. Period 3, Hang Seng was falling steadily;<br />
showing a downward trend. This might be due to the fear <strong>of</strong> global recession. But the NSE was<br />
not much affected. During Period 4, NSE was rising in almost identical manner <strong>with</strong> the Hang<br />
Seng. This shows the larger integration <strong>of</strong> the <strong>Indian</strong> economy in the foreign market. This might<br />
also be due to the fact that this boom was led by FII and other foreign investors. Hence, NSE is<br />
showing higher correlation during this period.<br />
57<br />
©<strong>Great</strong> <strong>Lakes</strong> Herald – April 2007 Volume 1, Issue 1 by <strong>Great</strong> <strong>Lakes</strong> Institute <strong>of</strong> Management, Chennai
NSE vs. NYSE<br />
Fig 1.3<br />
58<br />
Here, NYSE was a success story in this period. Led by the tech companies, the US economy<br />
was at its pink which is reflected in the NYSE. But the NSE did not appreciate much. In the<br />
NYSE the tech boom was saturating. The NYSE did not appreciate much in the initial period.<br />
But in the year 1999 and mid <strong>of</strong> 2000, NSE was rising <strong>with</strong> the NYSE because India had benefited<br />
much from the tech boom in this period along <strong>with</strong> the NYSE. The high dependence <strong>of</strong> India on<br />
the US in trade was reflected by the two stock exchanges. During this period, both the stock<br />
exchanges has risen sharply. Although the percentage change in the NSE was much larger, but<br />
the manner in which they were moving was highly correlated.<br />
©<strong>Great</strong> <strong>Lakes</strong> Herald – April 2007 Volume 1, Issue 1 by <strong>Great</strong> <strong>Lakes</strong> Institute <strong>of</strong> Management, Chennai
NSE vs. Korean stock exchange<br />
Fig 1.4<br />
59<br />
The above diagram shows that, during 1995, both the stock exchanges were at the same<br />
level. But due to East Asian crisis, Korean stock exchange was much more affected because its<br />
economy was more integrated <strong>with</strong> those East Asian economies. During period 2, both the stock<br />
exchanges moved in almost identical manner. The returns were almost nearly equal during this<br />
period, since both the stock exchanges rose very sharply. But, the rise in the NSE was much<br />
sharper. Still, we can say that the two exchanges were moving more or less in same fashion.<br />
We have tried to take a look at the impact <strong>of</strong> various stock exchanges on each other in this<br />
section. Therefore, we have divided our time period from 1995-2006 June into sub-sets<br />
depending on the happening <strong>of</strong> certain changes caused by events or policy decisions. This has<br />
the purpose <strong>of</strong> finding out the extent <strong>of</strong> impact that the markets have on each other.<br />
©<strong>Great</strong> <strong>Lakes</strong> Herald – April 2007 Volume 1, Issue 1 by <strong>Great</strong> <strong>Lakes</strong> Institute <strong>of</strong> Management, Chennai
Table 1<br />
<strong>Stock</strong> Price Correlation among <strong>Stock</strong> Exchanges<br />
Table 1:<br />
60<br />
Year/variables Korean Russian Hong Kong New York NSE<br />
1995-1997<br />
Korean 1.000<br />
Russian -0.663 1.000<br />
Hong Kong -0.868 0.837 1.000<br />
New York -0.878 0.873 0.933 1.000<br />
NSE -0.277 0.386 0.421 0.355 1.000<br />
1998-2000<br />
Korean 1.000<br />
Russian 0.367 1.000<br />
Hong Kong 0.603 0.629 1.000<br />
New York 0.628 0.282 0.657 1.000<br />
NSE 0.826 0.548 0.810 0.631 1.000<br />
2001-2003<br />
Korean 1.000<br />
Russian 0.586 1.000<br />
Hong Kong 0.171 0.171 1.000<br />
New York -0.031 -0.296 0.566 1.000<br />
NSE 0.395 0.427 0.789 0.467 1.000<br />
2004-2006<br />
Korean 1.000<br />
Russian 0.910 1.000<br />
Hong Kong 0.156 0.399 1.000<br />
New York 0.952 0.909 0.242 1.000<br />
NSE 0.925 0.941 0.336 0.931 1.000<br />
The period 1995-97, characterized by the South East Asian currency crisis and other<br />
economic events, did not have integration <strong>of</strong> different markets at high levels. This is especially<br />
true in case <strong>of</strong> India. Our country was in its inception stage as a globalized economy and hence<br />
distinctly protected from foreign exposure. The capital market was slowly evolving at that<br />
point <strong>of</strong> time, putting systems in place. That is to say, India had only limited foreign exposure<br />
which somewhat insulated the country’s economy from foreign economic upheavals. This is<br />
©<strong>Great</strong> <strong>Lakes</strong> Herald – April 2007 Volume 1, Issue 1 by <strong>Great</strong> <strong>Lakes</strong> Institute <strong>of</strong> Management, Chennai
clearly reflected in the following table <strong>of</strong> correlations which clearly shows that, in that period,<br />
very little correlation was existent among the exchanges. This signifies that the impact <strong>of</strong> other<br />
exchanges was negligible on the <strong>Indian</strong> capital markets. The almost non-existent effect <strong>of</strong> the<br />
South Asian Currency crisis, which affected Korea, on the <strong>Indian</strong> market validates our<br />
observation. The correlation shows negative for Korean exchange. During the period 1998-2000,<br />
<strong>Indian</strong> economy faced a recession as well as a period <strong>of</strong> heightened business activity. Mainly,<br />
the capital market started to consolidate across the globe. This is reflected by increasing<br />
impact <strong>of</strong> various exchanges on the NSE. The point to note is that it is mainly the Asian markets<br />
that have started impacting the NSE. The Korean market started to cast its effect along <strong>with</strong><br />
the Hong Kong market. This maybe because a lot <strong>of</strong> MNCs made their Asian base in those two<br />
countries and they also operated in India, hence the impact.<br />
61<br />
The period 2001-03 faced another major economic dampener in the form <strong>of</strong> the 9/11<br />
attacks in USA. This left the world economy in a state <strong>of</strong> shock. As could be expected, the<br />
economies across the globe faced recessionary situation. However, this time also, except for<br />
the Hong Kong bourses, none else had any significant impact on the <strong>Indian</strong> counterpart. 2004-<br />
06 is termed as the period when the various world markets started to converge. In the global<br />
scenario also, we find that the economies facing downturn were making a comeback – Japan<br />
and USA. Our expectation to find high level <strong>of</strong> impact <strong>of</strong> other markets on <strong>Indian</strong> market gets<br />
validated as shown by the significant correlation figures in the table. However, one thing to<br />
notice is the lessened impact <strong>of</strong> the Hong Kong market on the <strong>Indian</strong> market which, going by<br />
the past trend, comes as a surprise. This maybe due to easing <strong>of</strong> restrictions which previously<br />
insulated the economy from foreign exposures. The increased cross border flow <strong>of</strong> capital also<br />
contributed to this phenomenon.<br />
Exponential Trend<br />
In contrast to a linear trend, an exponential trend is appropriate when the time series<br />
changes by a constant percentage (as opposed to a constant amount) each period. One<br />
important characteristic <strong>of</strong> exponential trend is that, if a time series exhibits an exponential<br />
trend, a plot <strong>of</strong> its logarithm should be appropriately linear. This equation can be interpreted<br />
that the coefficient b is approximately the percentage change per period.<br />
Whenever there is a time series that is increasing at an increasing rate or decreasing at a<br />
decreasing rate, an exponential trend model proves apt.<br />
In this context, the method has been used to understand the trend existing in the<br />
movement <strong>of</strong> the exchanges and whether the trends have commonality. In other words, an<br />
attempt has been made to find whether two or more exchanges follow the same pattern in<br />
their movements <strong>of</strong> price and, if so, to what extent they are related.<br />
©<strong>Great</strong> <strong>Lakes</strong> Herald – April 2007 Volume 1, Issue 1 by <strong>Great</strong> <strong>Lakes</strong> Institute <strong>of</strong> Management, Chennai
Fig 2.1<br />
Fig 2.2<br />
62<br />
©<strong>Great</strong> <strong>Lakes</strong> Herald – April 2007 Volume 1, Issue 1 by <strong>Great</strong> <strong>Lakes</strong> Institute <strong>of</strong> Management, Chennai
Fig 2.3<br />
Fig 2.4<br />
63<br />
©<strong>Great</strong> <strong>Lakes</strong> Herald – April 2007 Volume 1, Issue 1 by <strong>Great</strong> <strong>Lakes</strong> Institute <strong>of</strong> Management, Chennai
Fig 2.5<br />
64<br />
In the above figures, it can be seen that NSE seemed to follow the exponential trend quite<br />
reasonably before the technology boom had hit the <strong>Indian</strong> stock market in the year 2003. After<br />
that NSE has much larger rise which could not be captured in the exponential trend. Russian<br />
stock exchange has also been explained by the exponential trend method quite reasonably<br />
before year 2003. Exponential trend has been able to capture the trend quite well the changes<br />
in NYSE. R-square value is around 0.6135. This shows that the model is able to explain the 60%<br />
<strong>of</strong> the variations <strong>of</strong> the index. For, both the stock exchanges <strong>of</strong> Korea and Honk Kong have<br />
shown very high volatility over this period and have not risen consistently enough. Thus<br />
exponential trend line is not able to explain the price behavior <strong>of</strong> these exchanges<br />
satisfactorily. The R-square values are very low 0.07 and 0.13 for Korean and Hang Sang<br />
respectively.<br />
Risk and Return<br />
This section tries to compare the various exchanges on the basis <strong>of</strong> returns and the<br />
corresponding risks associated <strong>with</strong> it, returns being, perhaps, the single most important factor<br />
affecting the performance <strong>of</strong> any index. While risk can be termed as the major factor<br />
underlying all activity, it becomes imperative to compare the exchanges based on this<br />
parameter. Table 2 exhibits the historical risk-return figures <strong>of</strong> the exchanges. From the return<br />
perspective, NYSE seems to be most stable among all <strong>of</strong> these stock exchanges. There are only<br />
two years when NYSE has given the negative returns, i.e. in the years 2001 and 2002. Russian<br />
stock exchange is the most volatile <strong>of</strong> all these and has given returns from 108% to -194%. NSE<br />
seems to have followed or moved in tandem <strong>with</strong> the NYSE more after year 2000. Hang Seng<br />
©<strong>Great</strong> <strong>Lakes</strong> Herald – April 2007 Volume 1, Issue 1 by <strong>Great</strong> <strong>Lakes</strong> Institute <strong>of</strong> Management, Chennai
Year /<br />
exchange follows long cycles. If returns turn negative, they remain negative for two or three<br />
years. Similarly if return turns positive, then they remain so again for two or more years.<br />
variables<br />
Russian stock exchange has shown the least variation and hence appears to be least risky. But<br />
actually there is very less trading in the Russian stock market during the period <strong>of</strong> 1999 to 2003<br />
due to stagnation and political instability and uncertainties about economy.<br />
Risk Return Comparison<br />
Table 2:<br />
Korean stock market is also very stable form the standard deviation angle. But this market has<br />
also not much appreciated over these years and it remains more or less range- bound. Hang<br />
Seng has shown the highest volatility as it is a much traded stock exchange. Also, the events<br />
like East Asian crisis have also affected the volatility <strong>of</strong> this exchange. But, nevertheless, the<br />
volatility has reduced in the recent years than it has in the period 1997-1999. Yet, it is more<br />
volatile than the other stock exchanges that we have compared. NYSE is a mature and most<br />
stable market <strong>of</strong> all these. The volatility has remained more or less constant over the years.<br />
The volatility <strong>of</strong> the NSE has risen steadily over these years as the trading and market<br />
capitalization <strong>of</strong> the companies has increased. Now the volatility <strong>of</strong> NSE is almost at par <strong>with</strong><br />
the other exchanges.<br />
65<br />
NSE Hong<br />
Kong<br />
New<br />
York<br />
Korean RSE<br />
risk return risk return Risk return risk Return risk return<br />
1995 60.1 -26% 323.5 20% 240.4 27% 40 -14% 10.1 -19%<br />
1996 100.4 -1% 418.7 30% 193 17% 71.4 -31% 47 83%<br />
1997 82.4 14% 905.1 -20% 411 27% 108.3 -55% 93.5 62%<br />
1998 115.4 -20% 637.9 -20% 328.4 15% 88.2 38% 114 -194%<br />
1999 184.0 51% 784.0 54% 220 9% 156.8 56% 24.7 108%<br />
2000 157.2 -23% 521.8 -18% 218.2 3% 143.8 -74% 24.5 -22%<br />
2001 129.2 -17% 659.8 -21% 374.9 -8% 48.1 29% 23.9 69%<br />
2002 67.7 4% 336.5 -17% 560 -22% 80.0 -14% 32.4 29%<br />
2003 254.2 54% 654.9 36% 480.3 22% 84.2 24% 81.3 45%<br />
2004 159.0 8% 371.2 9% 229.5 12% 53.1 9% 55.6 -14%<br />
2005 263.5 29% 278.3 7% 230.7 8% 136.3 43% 155.0 62%<br />
2006 252.3 10% 335.0 15% 182.2 5% 60.3 -3% 128.9 31%<br />
©<strong>Great</strong> <strong>Lakes</strong> Herald – April 2007 Volume 1, Issue 1 by <strong>Great</strong> <strong>Lakes</strong> Institute <strong>of</strong> Management, Chennai
Conclusions<br />
66<br />
The study brings forth some distinct conclusions many <strong>of</strong> which validate popular beliefs.<br />
The objective <strong>of</strong> the whole research was to try and compare the various stock exchanges based<br />
on certain parameters in order to understand the impact <strong>of</strong> integration <strong>of</strong> the financial world<br />
on the various entities <strong>with</strong>in it especially in the context <strong>of</strong> globalization and increased interest<br />
in the capital markets fuelled by surging growth.<br />
The various research papers that have been studied traced the gradual ‘coming <strong>of</strong> age’ <strong>of</strong><br />
the <strong>Indian</strong> stock market over the past decade <strong>with</strong>out actually arriving at any conclusive<br />
evidence on the comparative position <strong>of</strong> our stock exchange <strong>with</strong> that <strong>of</strong> other global ones. The<br />
studies mainly looked at various aspects <strong>of</strong> efficiency in the stock market on a stand alone basis<br />
and tried to draw conclusion regarding the state <strong>of</strong> our maturity. However, we have tried to<br />
use the comparison method to benchmark the performance <strong>of</strong> our stock market <strong>with</strong> that <strong>of</strong> a<br />
selection <strong>of</strong> global stock exchanges on the basis <strong>of</strong> their diversity <strong>with</strong> respect to geo-socio-<br />
politico-economy.<br />
With regard to the initial hypothesis <strong>of</strong> this study, it is clearly found that the stock markets<br />
do impact each other, more so in the recent times, i.e. post-2000. This has been due to the<br />
fact that ‘cross holdings’ are increasingly becoming common wherein the geographical barrier<br />
is dissolving <strong>with</strong> respect to investing. In India also, deliberations are on to ‘cross list’ <strong>Indian</strong><br />
shares in Asian exchanges to start <strong>of</strong>f. This will increase the degree <strong>of</strong> integration manifold.<br />
Moreover, the automation <strong>of</strong> the exchanges has played a vital role in making the financial<br />
markets integrated. In this context, the pioneer is the Swiss exchange, followed by Brussels as<br />
an early adapter. The spate <strong>of</strong> ‘ADR’s and ‘GDR’s, along <strong>with</strong> the increased opening up <strong>of</strong><br />
various economies, increasing foreign trade and the rise <strong>of</strong> the ‘MNC’s have contributed<br />
immensely to the integration process. It leaves us <strong>with</strong> the conclusion that the strategy <strong>of</strong><br />
globally diversifying investments is slowly losing its pr<strong>of</strong>itability. Especially after 2000, the<br />
markets are fast converging. It has now become a global market operating 24 hours, <strong>with</strong><br />
opening <strong>of</strong> markets in different time zones at various points <strong>of</strong> time appearing to be seamless.<br />
Thus, in hindsight, it would not be an exaggeration to say that the impact <strong>of</strong> the South East<br />
Asian currency crisis, if happened today, would have much more drastic effect on India, as the<br />
country is more in sync <strong>with</strong> the global markets. Actually, it can be said that, in the current<br />
scenario, any apprehension about stocks in one country can escalate into a panic selling.<br />
However, a caveat needs to be put here <strong>with</strong> respect <strong>of</strong> the attractiveness <strong>of</strong> the global<br />
diversification strategy. In a way, though the attractiveness <strong>of</strong> the strategy is gradually<br />
diminishing, it can still be pr<strong>of</strong>itably used for investing in countries whose stock exchanges do<br />
not yet have high correlation amongst each other. Moreover, although the stocks listed in the<br />
stock exchanges <strong>of</strong> the sample in this study do impact each other and move in tandem, the<br />
©<strong>Great</strong> <strong>Lakes</strong> Herald – April 2007 Volume 1, Issue 1 by <strong>Great</strong> <strong>Lakes</strong> Institute <strong>of</strong> Management, Chennai
magnitude <strong>of</strong> that movement as a result <strong>of</strong> reacting to global cues varies and, to that limited<br />
extent <strong>of</strong> variation, the global diversification strategy can prove useful. In short, the<br />
‘transaction cost’ for investment is coming down as is ‘informational cost’.<br />
67<br />
Qualitatively, the comparison showed that <strong>Indian</strong> stock exchange has the governance<br />
system and an efficient mechanism in place to be a world class institute, specially the<br />
requirements <strong>of</strong> Clause 49 promulgated by SEBI and the advanced trading and settlement<br />
mechanism <strong>of</strong> NSE, respectively. However, unfortunately our implementation <strong>of</strong> the same<br />
remains a problem area <strong>with</strong> almost 15-20% <strong>of</strong> the listed companies yet to align their<br />
operations as required under the law.<br />
Moreover, there are also issues regarding the extent to which the sophisticated systems <strong>of</strong><br />
the stock exchanges (NSE, BSE) are utilized in terms <strong>of</strong> the volume and frequency <strong>of</strong><br />
transactions and the range <strong>of</strong> instruments traded. The commodity segment, derivatives and<br />
such other segments are yet to see activities like the equity segment <strong>of</strong> the market. The<br />
reasons that can be attributed to this is the fact that it has been only 5 years (derivatives<br />
started in 2000) that the various segments, apart from equity and debt, have started operating<br />
and hence it is reasonably nascent compared to its global counterparts. It would, therefore,<br />
not be unjustified to say that the system is still evolving and it would take some time not only<br />
to attain efficiency <strong>of</strong> operation, but also to generate increased interest and awareness about<br />
the various other segments <strong>of</strong> the market. Then only can we expect the operations to match its<br />
global counterparts in terms <strong>of</strong> volumes, frequency and variety <strong>of</strong> instruments traded.<br />
One more reason that can be attributed for the lag between a global benchmark like NYSE<br />
and BSE or NSE can be the fact that, in our country, listing <strong>of</strong> foreign companies are still not<br />
allowed on the lines <strong>of</strong> ADRs or GDRs. This can be due to lack <strong>of</strong> depth and breadth <strong>of</strong> the<br />
market. Again, as this study points out, the listing criteria differ in terms <strong>of</strong> size as well as<br />
their disclosure norms. This implies that the depth <strong>of</strong> the market judged by the total<br />
capitalization is less for the <strong>Indian</strong> markets compared to its counterparts. Moreover, the<br />
disclosure norms affect the governance aspect as also the information availability.<br />
Innovative financial instruments like CAT Bonds, or dealing in Junk Bonds as a cheap<br />
source <strong>of</strong> finance or sophisticated derivative instruments are yet to catch up in our country.<br />
This is partly because <strong>of</strong> the regulations that are gradually being eased out and also due to the<br />
risk appetite <strong>of</strong> the investors in this country. The opening up <strong>of</strong> the economy and its<br />
subsequent impact on the financial sector has only started barely in the last six years and,<br />
hence, the ‘teething problems’ <strong>of</strong> initial skepticism, lack <strong>of</strong> awareness and interest exist,<br />
besides cautious approach towards bringing about changes <strong>with</strong> keenly monitored impact <strong>of</strong><br />
those changes.<br />
If we go to the specifics, then we find that the Clause 49, our counterpart <strong>of</strong> the famed<br />
Sarbannes-Oxley Act <strong>of</strong> USA, has brought us to the global standards. But, because <strong>of</strong> the early<br />
©<strong>Great</strong> <strong>Lakes</strong> Herald – April 2007 Volume 1, Issue 1 by <strong>Great</strong> <strong>Lakes</strong> Institute <strong>of</strong> Management, Chennai
stages (only a year), the implementation is causing a hindrance in attaining the requisite level<br />
<strong>with</strong> regard to governance. Again the risk management system in our country is very elaborate<br />
and the mechanism in place is very efficient as also effective. It actually matches the level <strong>of</strong> a<br />
well established benchmark like NYSE. However, the only difference is in terms <strong>of</strong> risk appetite<br />
<strong>of</strong> the investors which causes the level and operation <strong>of</strong> ‘circuit breakers’ to vary.<br />
68<br />
However, <strong>Indian</strong> stock market is very much at the same pedestal and, in fact, better than<br />
most <strong>of</strong> its Asian counterparts especially the emerging economies. <strong>Indian</strong> system enjoys<br />
creditability even when compared <strong>with</strong> a stock exchange like Nikkei (Japan).<br />
If we look at the efficiency <strong>of</strong> trading captured by the ‘trading and settlement’ mechanism,<br />
then we have found that the <strong>Indian</strong> mechanism is faster than the NYSE and at par <strong>with</strong> the best<br />
in the world. In fact, it is one <strong>of</strong> the fastest.<br />
One problem area that came out as a possible barrier in the path <strong>of</strong> <strong>Indian</strong> stock exchanges<br />
attaining global level is the fact that India has a very low rank in terms <strong>of</strong> market capitalization<br />
(ranked 14 th ). All other stock exchanges that we used in our study rank above <strong>Indian</strong> stock<br />
exchange. This is in spite <strong>of</strong> the fact that <strong>Indian</strong> stock exchanges have the highest number <strong>of</strong><br />
companies listed (around 9000) and BSE accounting for almost 75%. Therefore, volume-wise,<br />
<strong>Indian</strong> market is still pretty small.<br />
One more aspect that we have tried to look at in this study is the extent <strong>of</strong> influence the<br />
various stock markets cast on each other, specifically the impact <strong>of</strong> other stock exchanges on<br />
their <strong>Indian</strong> counterpart. In order to understand, we divided our study period in parts based on<br />
certain events that had economic implications. Here, we found the results validating popular<br />
belief that the markets in general and <strong>Indian</strong> market in particular became more integrated <strong>with</strong><br />
other global exchanges from 2002-03. This can very well be seen since the South Asian crisis <strong>of</strong><br />
the mid-late nineties barely affected us, particularly because we were insulated due to<br />
government policies and were just making the transition. However, in the later time periods,<br />
the influence <strong>of</strong> other stock markets increased on BSE or NSE but at a very low - almost<br />
insignificant - level. At the time <strong>of</strong> crucial 9/11, NYSE had started to exert its influence on us<br />
but at lower levels and, though the economic downturn impacted, it did not last long. The<br />
increased trend <strong>of</strong> <strong>Indian</strong> companies going for ADR and GDR issues has also contributed as a<br />
channel for information transfer between the exchanges where the particular company is<br />
listed. This has not only facilitated the integration process, but also increased the sensitivity <strong>of</strong><br />
the home country’s stock exchange to the movements <strong>of</strong> various other exchanges especially<br />
where the home company is listed.<br />
©<strong>Great</strong> <strong>Lakes</strong> Herald – April 2007 Volume 1, Issue 1 by <strong>Great</strong> <strong>Lakes</strong> Institute <strong>of</strong> Management, Chennai
To sum up:<br />
69<br />
Finally, we can sum up <strong>with</strong> the following observations:<br />
• The markets have indeed started to integrate and <strong>Indian</strong> market is no exception<br />
especially after 2002-03.<br />
• The regulatory authorities must remove any ambiguity that may be existing when<br />
compared to the regulations <strong>of</strong> other exchanges before they can actually make the<br />
grade.<br />
• Lastly, although it has to be accepted that the market is evolving but the <strong>Indian</strong> system<br />
has already attained the minimum level <strong>of</strong> robustness and efficiency to be counted<br />
among the best in the world and stand equipped to attain higher sophistication as well<br />
as heightened activities. As for the existence <strong>of</strong> any signals or patterns among the stock<br />
exchanges, it can safely be said that the markets do react to global cues and any<br />
happening in the global scenario be it macro economic or country specific (foreign<br />
trade channel) affect the various markets.<br />
In short, the <strong>Indian</strong> exchanges are ready to make the transition should the government<br />
decides to further relax the regulations and open up. The financial sector as a whole, <strong>with</strong> the<br />
stock markets as its indicator, has indeed come a long way and are ready for the next level<br />
<strong>with</strong> regards to efficient trading and variety in the instruments traded.<br />
Thus this study validates the popular belief that the markets in general and <strong>Indian</strong> market<br />
in particular is more integrated <strong>with</strong> other global exchanges from 2002-03 onwards. This can<br />
very well be seen since the South Asian crisis <strong>of</strong> the mid- late nineties barely affected us<br />
particularly because we were insulated due to government policies and was just making the<br />
transition. However, in the later time periods, the influence <strong>of</strong> other stock markets increased<br />
on our BSE or NSE, but at a very low almost insignificant level. At the time <strong>of</strong> 9/11 incident,<br />
NYSE had started to exert its influence on us but at lower levels and hence the economic<br />
downturn did not impact for long. The increased trend <strong>of</strong> <strong>Indian</strong> companies going for ADR and<br />
GDR issues has also contributed as a channel for information transfer between the exchanges<br />
where the particular company is listed. This has not only facilitated the integration process but<br />
also increased the sensitivity <strong>of</strong> the home country’s stock exchange to the movements <strong>of</strong><br />
various other exchanges especially where the home company is listed. As for the existence <strong>of</strong><br />
any signals or patterns among the stock exchanges, it can safely be said that the markets do<br />
react to global cues and any happening in the global scenario be it macro economic or country<br />
specific (foreign trade channel) affect the various markets.<br />
©<strong>Great</strong> <strong>Lakes</strong> Herald – April 2007 Volume 1, Issue 1 by <strong>Great</strong> <strong>Lakes</strong> Institute <strong>of</strong> Management, Chennai
REFERENCES<br />
Articles<br />
70<br />
Masih, A. M. M. & Masih, R. (1997). A comparative analysis <strong>of</strong> the propagation <strong>of</strong> stock<br />
market fluctuations in alternative models <strong>of</strong> dynamic causal linkages. Applied Financial<br />
Economics, 7 (1), 59-74.<br />
Agarwal, R N (2000): ‘Financial Integration and Capital <strong>Market</strong>s in Developing<br />
Countries: A Study <strong>of</strong> Growth, Volatility and Efficiency in the <strong>Indian</strong> Capital <strong>Market</strong>’,<br />
mimeo, Institute <strong>of</strong> Economic Growth, Delhi.<br />
Bae, K, Cha, B, & Cheung, Y (1999): ‘The Transmission <strong>of</strong> Pricing Information <strong>of</strong> Dually-<br />
Listed <strong>Stock</strong>s’, Journal <strong>of</strong> Business Finance and Accounting, 26 (5) and (6),<br />
June/July,709-23.<br />
Becker, K, Finnerty, J., & Gupta, M. (1990): ‘The Intertemporal Relation between the<br />
US and Japanese <strong>Stock</strong> <strong>Market</strong>s’, Journal <strong>of</strong> Finance, 45, 1297-1306.<br />
Bennett, P., & Keller, J. (1988): ‘The International Transmission <strong>of</strong> <strong>Stock</strong> Price<br />
Disruption in October 1987’, Federal Reserve Bank <strong>of</strong> New York Quarterly Review,<br />
Summer, 17-33.<br />
Froot, K., & Dabora, E. (1999): ‘How are <strong>Stock</strong> Prices Affected by the Location <strong>of</strong><br />
Trade?’, Journal <strong>of</strong> Financial Economics, 53, 189- 216.<br />
Hansda, S. K., & Ray, P. (2002): ‘BSE and Nasdaq: Globalisation, Information<br />
Technology and <strong>Stock</strong> Prices’, Economic and Political Weekly, 37 (5), February 2, 459-<br />
468.<br />
Howe, J S., & Madura, J. (1990): ‘The Impact <strong>of</strong> International Listings on Risk: The<br />
Implications for Capital <strong>Market</strong> Integration’, Journal <strong>of</strong> Banking and Finance, 14, 1133-<br />
42.<br />
Lau, S T., & Diltz, J.D. (1994): ‘<strong>Stock</strong> Returns and the Transfer <strong>of</strong> Information Between<br />
the New York and Tokyo <strong>Stock</strong> Exchanges’, Journal <strong>of</strong> International Money and<br />
Finance, 13 (2), 211-22.<br />
©<strong>Great</strong> <strong>Lakes</strong> Herald – April 2007 Volume 1, Issue 1 by <strong>Great</strong> <strong>Lakes</strong> Institute <strong>of</strong> Management, Chennai
71<br />
Yakob, N. A., Beal, D., & Delpachitra, S. (2005) Seasonality in the Asia Pacific stock<br />
markets. Journal <strong>of</strong> Asset Management, 6 (4), 298-318.<br />
Poshakwale, S. (2002). The Random Walk Hypothesis in the Emerging <strong>Indian</strong> <strong>Stock</strong><br />
<strong>Market</strong>. Journal <strong>of</strong> Business Finance & Accounting, 29 (9&10), 1275-1299.<br />
Websites Referred<br />
www.bseindia.com<br />
www.nse-india.com<br />
www.ebsco.com<br />
www.tse.or.jp/english/index.shtml<br />
www.hkex.com.hk/<br />
www.krx.co.kr/webeng/index.jsp<br />
www.tse.or.jp/english/index.shtml<br />
www.nyse.com<br />
www.rts.ru<br />
www.kse.or.kr<br />
©<strong>Great</strong> <strong>Lakes</strong> Herald – April 2007 Volume 1, Issue 1 by <strong>Great</strong> <strong>Lakes</strong> Institute <strong>of</strong> Management, Chennai