Comparative Analysis of Indian Stock Market with ... - Great Lakes
Comparative Analysis of Indian Stock Market with ... - Great Lakes
Comparative Analysis of Indian Stock Market with ... - Great Lakes

Create successful ePaper yourself
Turn your PDF publications into a flip-book with our unique Google optimized e-Paper software.
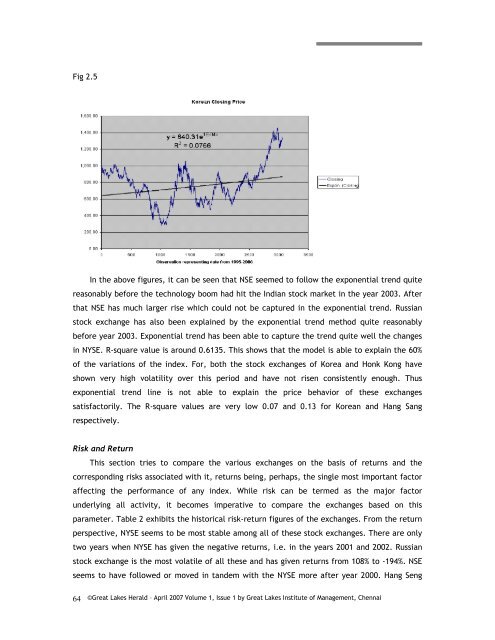
Fig 2.5<br />
64<br />
In the above figures, it can be seen that NSE seemed to follow the exponential trend quite<br />
reasonably before the technology boom had hit the <strong>Indian</strong> stock market in the year 2003. After<br />
that NSE has much larger rise which could not be captured in the exponential trend. Russian<br />
stock exchange has also been explained by the exponential trend method quite reasonably<br />
before year 2003. Exponential trend has been able to capture the trend quite well the changes<br />
in NYSE. R-square value is around 0.6135. This shows that the model is able to explain the 60%<br />
<strong>of</strong> the variations <strong>of</strong> the index. For, both the stock exchanges <strong>of</strong> Korea and Honk Kong have<br />
shown very high volatility over this period and have not risen consistently enough. Thus<br />
exponential trend line is not able to explain the price behavior <strong>of</strong> these exchanges<br />
satisfactorily. The R-square values are very low 0.07 and 0.13 for Korean and Hang Sang<br />
respectively.<br />
Risk and Return<br />
This section tries to compare the various exchanges on the basis <strong>of</strong> returns and the<br />
corresponding risks associated <strong>with</strong> it, returns being, perhaps, the single most important factor<br />
affecting the performance <strong>of</strong> any index. While risk can be termed as the major factor<br />
underlying all activity, it becomes imperative to compare the exchanges based on this<br />
parameter. Table 2 exhibits the historical risk-return figures <strong>of</strong> the exchanges. From the return<br />
perspective, NYSE seems to be most stable among all <strong>of</strong> these stock exchanges. There are only<br />
two years when NYSE has given the negative returns, i.e. in the years 2001 and 2002. Russian<br />
stock exchange is the most volatile <strong>of</strong> all these and has given returns from 108% to -194%. NSE<br />
seems to have followed or moved in tandem <strong>with</strong> the NYSE more after year 2000. Hang Seng<br />
©<strong>Great</strong> <strong>Lakes</strong> Herald – April 2007 Volume 1, Issue 1 by <strong>Great</strong> <strong>Lakes</strong> Institute <strong>of</strong> Management, Chennai