This is a test of Andrew Klein's New Document Formt
This is a test of Andrew Klein's New Document Formt
This is a test of Andrew Klein's New Document Formt

Create successful ePaper yourself
Turn your PDF publications into a flip-book with our unique Google optimized e-Paper software.
-1-<br />
Lab Exerc<strong>is</strong>e<br />
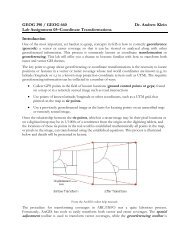
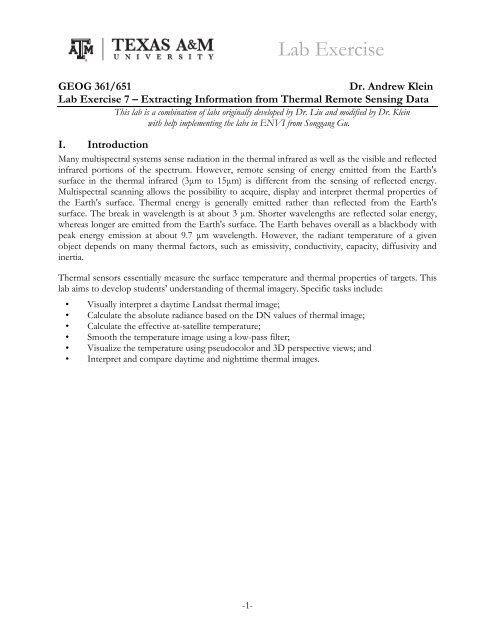
GEOG 361/651 Dr. <strong>Andrew</strong> Klein<br />
Lab Exerc<strong>is</strong>e 7 – Extracting Information from Thermal Remote Sensing Data<br />
<strong>Th<strong>is</strong></strong> lab <strong>is</strong> a combination <strong>of</strong> labs originally developed by Dr. Liu and modified by Dr. Klein<br />
with help implementing the labs in ENVI from Songgang Gu.<br />
I. Introduction<br />
Many mult<strong>is</strong>pectral systems sense radiation in the thermal infrared as well as the v<strong>is</strong>ible and reflected<br />
infrared portions <strong>of</strong> the spectrum. However, remote sensing <strong>of</strong> energy emitted from the Earth's<br />
surface in the thermal infrared (3μm to 15μm) <strong>is</strong> different from the sensing <strong>of</strong> reflected energy.<br />
Mult<strong>is</strong>pectral scanning allows the possibility to acquire, d<strong>is</strong>play and interpret thermal properties <strong>of</strong><br />
the Earth's surface. Thermal energy <strong>is</strong> generally emitted rather than reflected from the Earth's<br />
surface. The break in wavelength <strong>is</strong> at about 3 μm. Shorter wavelengths are reflected solar energy,<br />
whereas longer are emitted from the Earth's surface. The Earth behaves overall as a blackbody with<br />
peak energy em<strong>is</strong>sion at about 9.7 μm wavelength. However, the radiant temperature <strong>of</strong> a given<br />
object depends on many thermal factors, such as em<strong>is</strong>sivity, conductivity, capacity, diffusivity and<br />
inertia.<br />
Thermal sensors essentially measure the surface temperature and thermal properties <strong>of</strong> targets. <strong>Th<strong>is</strong></strong><br />
lab aims to develop students’ understanding <strong>of</strong> thermal imagery. Specific tasks include:<br />
• V<strong>is</strong>ually interpret a daytime Landsat thermal image;<br />
• Calculate the absolute radiance based on the DN values <strong>of</strong> thermal image;<br />
• Calculate the effective at-satellite temperature;<br />
• Smooth the temperature image using a low-pass filter;<br />
• V<strong>is</strong>ualize the temperature using pseudocolor and 3D perspective views; and<br />
• Interpret and compare daytime and nighttime thermal images.
II. Quantitative Analys<strong>is</strong> <strong>of</strong> Landsat Thermal Imagery<br />
I. Conversion <strong>of</strong> DN values to Absolute Radiance<br />
ETM+ images are acquired in either a low or high gain state (Figure 1). The science goal in<br />
switching gain states <strong>is</strong> to maximize the instrument's 8-bit radiometric resolution without saturating<br />
the detectors. <strong>Th<strong>is</strong></strong> requires matching the gain state for a given scene to the expected brightness<br />
conditions. For all bands, the low gain dynamic range <strong>is</strong> approximately 1.5 times the high gain<br />
dynamic range. It makes sense, therefore, to image in low gain mode when surface brightness <strong>is</strong> high<br />
and in high gain mode when surface brightness <strong>is</strong> lower.<br />
Figure 1 Design ETM+ Reflective Band High and Low gain Dynamic Ranges<br />
http://landsathandbook.gsfc.nasa.gov/handbook/handbook_htmls/chapter6/chapter6.html<br />
The per-band sensitivity <strong>of</strong> the instrument <strong>is</strong> set by adjusting the gain to conditions expected for that<br />
time <strong>of</strong> year. Bands 1, 2 and 3 are set to high or low gain as a group. Gain settings for bands 5 and 7<br />
are set similarly. Band 6 acquired in both high and low gain mode, while bands 4 and 8 are set<br />
individually according to land surface brightness conditions. Band gains are set on a month by<br />
month bas<strong>is</strong>. The DN values <strong>of</strong> each Landsat image band were scaled from the absolute radiance<br />
measure to byte values prior to media output using the gain and bias (<strong>of</strong>fset) values given for each<br />
band. The DN values can be converted back to the radiance units using the following equation:<br />
Which can also be expressed as:<br />
Radiance = gain*DN + <strong>of</strong>fset (1)<br />
Radiance = ((L MAX-L MIN)/(Q CALMAX-Q CALMIN))*(Q CAL-Q CALMIN) + L MIN (2)<br />
Where: Q CALMIN=0, Q CALMAX=255 and Q CAL=Digital Number<br />
- 2 -
The L MINs and L MAXs are the spectral radiances for each band at digital numbers <strong>of</strong> Q CALMIN and<br />
Q CALMAX (for example, Q CALMIN = 0 and Q CALMAX = 255). The L MINs and L MAXs are a representation <strong>of</strong><br />
how the output Landsat ETM+ Level 1G data products are scaled in radiance units. The L MIN<br />
corresponds to the radiance at the minimum quantized and calibrated data digital number, Q CALMIN,<br />
and L MAX corresponds to the radiance at the maximum quantized and calibrated data digital number,<br />
Q CALMAX. That <strong>is</strong>, Q CALMIN <strong>is</strong> the minimum number and Q CALMAX <strong>is</strong> the maximum number <strong>of</strong> each<br />
band.<br />
Table 1 L<strong>is</strong>ts two sets <strong>of</strong> L MINs and L MAXs. The first set should be used for 1G products created<br />
before July 1, 2000 and the second set for 1G products created after July 1, 2000. Use <strong>of</strong> the<br />
appropriate L MINs and L MAXs will ensure accurate conversion to radiance units. For the band 6, a bias<br />
was found in the pre-launch calibration by a team <strong>of</strong> independent investigators post launch. For data<br />
processed before th<strong>is</strong>, the image radiances given by the above transform are 0.31<br />
w/(m2*sterandian*μm) too high. You have to subtract th<strong>is</strong> value after the conversion.<br />
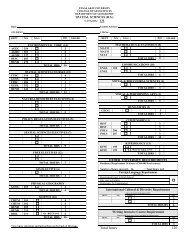
Table 1 ETM+ Spectral Radiance Range in watts/(meter squared * ster * μm)<br />
Before July 1, 2000 After July 1, 2000<br />
Band Low Gain High Gain Low Gain High Gain<br />
Number L MIN L MAX L MIN L MAX L MIN L MAX L MIN L MAX<br />
1 -6.2 297.5 -6.2 194.3 -6.2 293.7 -6.2 191.6<br />
2 -6.0 303.4 -6.0 202.4 -6.4 300.9 -6.4 196.5<br />
3 -4.5 235.5 -4.5 158.6 -5.0 234.4 -5.0 152.9<br />
4 -4.5 235.0 -4.5 157.5 -5.1 241.1 -5.1 157.4<br />
5 -1.0 47.70 -1.0 31.76 -1.0 47.57 -1.0 31.06<br />
6 0.0 17.04 3.2 12.65 0.0 17.04 3.2 12.65<br />
7 -0.35 16.60 -0.35 10.932 -0.35 16.54 -0.35 10.80<br />
8 -5.0 244.00 -5.0 158.40 -4.7 243.1 -4.7 158.3<br />
- 3 -
2. Conversion <strong>of</strong> Radiance to Temperature<br />
ETM+ Band 6 imagery can also be converted from spectral radiance (as described above) to a more<br />
physically useful variable. <strong>Th<strong>is</strong></strong> <strong>is</strong> the effective at-satellite temperature <strong>of</strong> the viewed Earthatmosphere<br />
system under an assumption <strong>of</strong> unity em<strong>is</strong>sivity and using pre-launch calibration<br />
constants l<strong>is</strong>ted in Table 2. The conversion formula <strong>is</strong>:<br />
K 2<br />
T =<br />
⎛ K2<br />
⎞<br />
ln⎜<br />
⎟<br />
⎜<br />
+ 1<br />
⎟<br />
⎝ Lλ<br />
⎠<br />
Where:<br />
T = Effective at-satellite temperature in Kelvin<br />
K2 = Calibration constant 2 from Table 2<br />
K1 = Calibration constant 1 from Table 2<br />
L λ = Spectral radiance in watts/(meter squared * ster * μm)<br />
Table 2. ETM+ Thermal Constants and Constant Value Units<br />
K1 666.09 W m -2 ster -1 μm -1<br />
K2 1282.71 °K<br />
- 4 -<br />
(3)
III. Instructions<br />
Task 1: The thermal image etm6_1999 and panchromatic image etm_pan1999 are located in the<br />
ETM subdirectory on the class shared drive for lab07. These two Landsat 7 ETM+ image bands<br />
were acquired over the Houston area at 16:43:32 in September 20, 1999. The sun elevation <strong>is</strong> 54.88<br />
degree, and sun azimuth <strong>is</strong> 140.69 degree. V<strong>is</strong>ually interpret and compare the thermal image with the<br />
panchromatic image, and answer the following questions:<br />
Question 1. What <strong>is</strong> the spectral range <strong>of</strong> thermal image etm6_1999 in terms <strong>of</strong> wavelength?<br />
Question 2. How does th<strong>is</strong> wavelength differ from the non-thermal bands <strong>of</strong> Landsat ETM+ in<br />
terms <strong>of</strong> the recorded radiation energy?<br />
Question 3. Do you expect strong correlation between DN values in the thermal band and other<br />
non-thermal image bands? Why or why not? Please explain.<br />
Question 4. What <strong>is</strong> the spatial resolution <strong>of</strong> the thermal image? Why <strong>is</strong> the spatial resolution <strong>of</strong> the<br />
thermal image much lower than that <strong>of</strong> non-thermal bands?<br />
Question 5. Compare the panchromatic and thermal band images, and explain the tonal differences<br />
between the v<strong>is</strong>ible (panchromatic) and thermal images. What types <strong>of</strong> surface features generally<br />
have high or low em<strong>is</strong>sion in the thermal band (assuming surface temperatures are the same across<br />
the image)?<br />
- 5 -
Task 2. The thermal image band that we have <strong>is</strong> low gain representation. Given a subset <strong>of</strong> Landsat<br />
ETM+ band 6 image sub_etm6, you are required to perform the following quantitative analys<strong>is</strong>:<br />
Question 6. Determine the L MAX, L MIN, Q CALMAX, Q CALMIN values for the low gain representation <strong>of</strong><br />
ETM+ band6, and construct the correct formula for converting the DN values in band 6 to the<br />
absolute radiance.<br />
Question 7. Now apply (using band math) th<strong>is</strong> formula to the entire image to calculate the<br />
absolute radiance for each pixel, and determine the range <strong>of</strong> radiance values for th<strong>is</strong> sub image using<br />
the compute stat<strong>is</strong>tics function.<br />
Question 8. Determine average radiance values for typical pixels <strong>of</strong> water, grass, forest, buildings<br />
and roads.<br />
Question 9. Write out the formula to convert the absolute radiance to temperature. Using band<br />
math apply th<strong>is</strong> formula to each pixel in the image to calculate the effective at-satellite temperatures,<br />
and find out the temperature range for th<strong>is</strong> sub image and also determine the temperatures for the<br />
typical pixels <strong>of</strong> water, grass, forest, buildings and roads you analyzed in Question 8.<br />
Question 10. Smooth the temperature image using a low-pass filter and d<strong>is</strong>play the temperature<br />
image using the pseudo-color mode and select an appropriate color table to d<strong>is</strong>play surface<br />
temperature. Make a hardcopy map to show the spatial d<strong>is</strong>tribution <strong>of</strong> the temperature.<br />
- 6 -
Tips<br />
Much <strong>of</strong> what <strong>is</strong> required here you have done before so you should try to remember how to do th<strong>is</strong><br />
again.<br />
1. To convert the DN values to at-satellite radiance, you first need to construct a formula <strong>of</strong> the<br />
type l<strong>is</strong>ted in equation (1). You can then apply th<strong>is</strong> formula using either band math or the<br />
gain/<strong>of</strong>fset preprocessing function. [To do a log use the alog function and be sure to use your parentheses<br />
correctly].<br />
2. You can use ROI tool to determine both the at-satellite radiance and at-satellite temperatures<br />
for the different surface features.<br />
3. You can use Basic Tools Stat<strong>is</strong>tics Compute Stat<strong>is</strong>tics to compute the stat<strong>is</strong>tics for an<br />
image.<br />
4. To do pseudocolor mapping <strong>of</strong> temperature on the Image menu select Tools Color<br />
Mapping ENVI Color Tables to set a pseudo-color for d<strong>is</strong>playing a temperature image.<br />
Select an appropriate color table that makes sense to correctly d<strong>is</strong>play temperatures.<br />
5. To smooth the temperature image suing a low-pass filter, which can be found in Filter <br />
Convolutions and morphology on the ENVI main menu bar. You should select the<br />
Convolutions and Morphology Tool window, and use a Low Pass with a 3×3 Kernel Size. Click<br />
Quick Apply; select the appropriate input band Notice that the temperature image <strong>is</strong> smoothed.<br />
Make a hard copy <strong>of</strong> th<strong>is</strong> image and include it in your lab report.<br />
- 7 -
Task 3. Under the DAEDALUS subdirectory, there are two image files aerial.jpg and thermal.jpg.<br />
These two images were acquired in November 1976 over Brookhaven National Laboratory on Long<br />
Island, <strong>New</strong> York. The panchromatic aerial photograph aerial.jpg includes an overlay <strong>of</strong> buried<br />
steam and condensate lines and manholes that was provided by the Brookhaven maintenance staff.<br />
The night thermal image thermal.jpg was acquired in the spectral band 8-14 μm by Daedalus<br />
Enterpr<strong>is</strong>es, Inc. V<strong>is</strong>ually interpret the thermal images and answer the following questions:<br />
Question 12. What features are located in the regions H and F? Explain why these regions appear<br />
bright in the nighttime thermal image.<br />
Question 13. Some light spots can be seen on the ro<strong>of</strong>tops <strong>of</strong> buildings D and E. What are these<br />
features? Explain why they appear light on the thermal image.<br />
Question 14. What do the pavement (G) and the lawn grass look like in the nighttime thermal<br />
image?<br />
Question 15. Can you observe the buried heating lines and manholes on the nighttime thermal<br />
image?<br />
Question 16. The Brookhaven maintenance staff suspects that the steam lines were leaking the heat<br />
because pipe insulation had deteriorated. V<strong>is</strong>ually interpret the thermal image and identify the<br />
possible locations for major leaks. Please print out a hardcopy map and identify possible leaks using<br />
the annotation tool<br />
- 8 -
Task 4. Under the ATLAS subdirectory, there are two thermal atlanta0.jpg and atlanta1.jpg. They<br />
are ATLAS channel 13 imagery (9.6-10.2 μm) with 10m spatial resolution (original images) over<br />
Atlanta central business d<strong>is</strong>trict (CBD), one during the day and one at night. Both images are<br />
oriented with north at the top. V<strong>is</strong>ually interpret the images and answer the following questions:<br />
Question 17. Which image <strong>is</strong> the daytime thermal image and which <strong>is</strong> the nighttime image? Explain<br />
why?<br />
Question 18. Why do the lakes appear dark in the daytime thermal infrared image and light in the<br />
nighttime thermal infrared image?<br />
Question 19. Can you observe the shadows from tall building on the daytime thermal image?<br />
Explain why the Georgia Dome (round shaped object) appears dark in both images?<br />
Question 20. Several objects appear very dark in the nighttime image while are relatively bright in<br />
the daytime image. What are these objects?<br />
II. Lab Report<br />
The lab report must be typed, as hand-written work will not be accepted. You should put your name<br />
and lab session number on the cover page. The lab report should contain:<br />
1) Short answers to each question in your own words; and<br />
2) The required maps.<br />
- 9 -