This is a test of Andrew Klein's New Document Formt
This is a test of Andrew Klein's New Document Formt
This is a test of Andrew Klein's New Document Formt

Create successful ePaper yourself
Turn your PDF publications into a flip-book with our unique Google optimized e-Paper software.
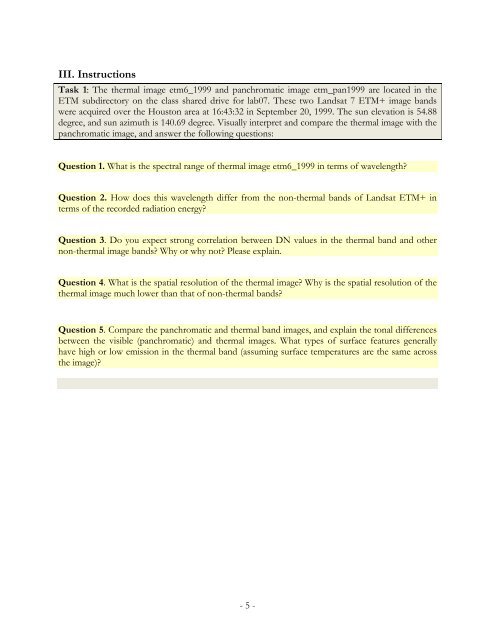
III. Instructions<br />
Task 1: The thermal image etm6_1999 and panchromatic image etm_pan1999 are located in the<br />
ETM subdirectory on the class shared drive for lab07. These two Landsat 7 ETM+ image bands<br />
were acquired over the Houston area at 16:43:32 in September 20, 1999. The sun elevation <strong>is</strong> 54.88<br />
degree, and sun azimuth <strong>is</strong> 140.69 degree. V<strong>is</strong>ually interpret and compare the thermal image with the<br />
panchromatic image, and answer the following questions:<br />
Question 1. What <strong>is</strong> the spectral range <strong>of</strong> thermal image etm6_1999 in terms <strong>of</strong> wavelength?<br />
Question 2. How does th<strong>is</strong> wavelength differ from the non-thermal bands <strong>of</strong> Landsat ETM+ in<br />
terms <strong>of</strong> the recorded radiation energy?<br />
Question 3. Do you expect strong correlation between DN values in the thermal band and other<br />
non-thermal image bands? Why or why not? Please explain.<br />
Question 4. What <strong>is</strong> the spatial resolution <strong>of</strong> the thermal image? Why <strong>is</strong> the spatial resolution <strong>of</strong> the<br />
thermal image much lower than that <strong>of</strong> non-thermal bands?<br />
Question 5. Compare the panchromatic and thermal band images, and explain the tonal differences<br />
between the v<strong>is</strong>ible (panchromatic) and thermal images. What types <strong>of</strong> surface features generally<br />
have high or low em<strong>is</strong>sion in the thermal band (assuming surface temperatures are the same across<br />
the image)?<br />
- 5 -