2-D wavelength demultiplexer with potential for >= 1000 channels in ...
2-D wavelength demultiplexer with potential for >= 1000 channels in ...
2-D wavelength demultiplexer with potential for >= 1000 channels in ...

You also want an ePaper? Increase the reach of your titles
YUMPU automatically turns print PDFs into web optimized ePapers that Google loves.
4. Experiments<br />
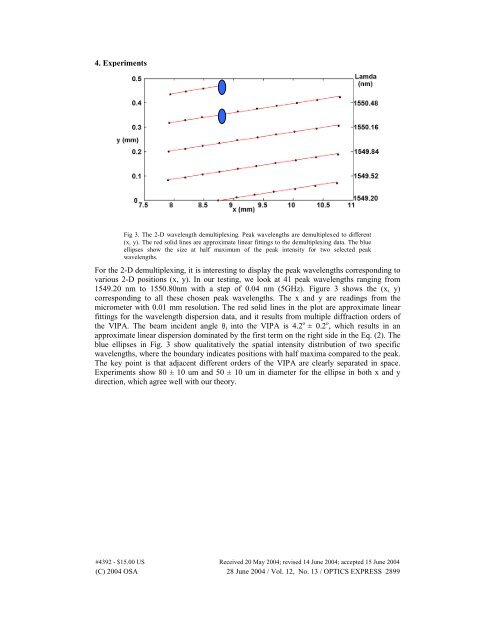
Fig 3. The 2-D <strong>wavelength</strong> demultiplex<strong>in</strong>g. Peak <strong>wavelength</strong>s are demultiplexed to different<br />
(x, y). The red solid l<strong>in</strong>es are approximate l<strong>in</strong>ear fitt<strong>in</strong>gs to the demultiplex<strong>in</strong>g data. The blue<br />
ellipses show the size at half maximum of the peak <strong>in</strong>tensity <strong>for</strong> two selected peak<br />
<strong>wavelength</strong>s.<br />
For the 2-D demultiplex<strong>in</strong>g, it is <strong>in</strong>terest<strong>in</strong>g to display the peak <strong>wavelength</strong>s correspond<strong>in</strong>g to<br />
various 2-D positions (x, y). In our test<strong>in</strong>g, we look at 41 peak <strong>wavelength</strong>s rang<strong>in</strong>g from<br />
1549.20 nm to 1550.80nm <strong>with</strong> a step of 0.04 nm (5GHz). Figure 3 shows the (x, y)<br />
correspond<strong>in</strong>g to all these chosen peak <strong>wavelength</strong>s. The x and y are read<strong>in</strong>gs from the<br />
micrometer <strong>with</strong> 0.01 mm resolution. The red solid l<strong>in</strong>es <strong>in</strong> the plot are approximate l<strong>in</strong>ear<br />
fitt<strong>in</strong>gs <strong>for</strong> the <strong>wavelength</strong> dispersion data, and it results from multiple diffraction orders of<br />
the VIPA. The beam <strong>in</strong>cident angle θi <strong>in</strong>to the VIPA is 4.2 o ± 0.2 o , which results <strong>in</strong> an<br />
approximate l<strong>in</strong>ear dispersion dom<strong>in</strong>ated by the first term on the right side <strong>in</strong> the Eq. (2). The<br />
blue ellipses <strong>in</strong> Fig. 3 show qualitatively the spatial <strong>in</strong>tensity distribution of two specific<br />
<strong>wavelength</strong>s, where the boundary <strong>in</strong>dicates positions <strong>with</strong> half maxima compared to the peak.<br />
The key po<strong>in</strong>t is that adjacent different orders of the VIPA are clearly separated <strong>in</strong> space.<br />
Experiments show 80 ± 10 um and 50 ± 10 um <strong>in</strong> diameter <strong>for</strong> the ellipse <strong>in</strong> both x and y<br />
direction, which agree well <strong>with</strong> our theory.<br />
#4392 - $15.00 US Received 20 May 2004; revised 14 June 2004; accepted 15 June 2004<br />
(C) 2004 OSA 28 June 2004 / Vol. 12, No. 13 / OPTICS EXPRESS 2899