MVNO services Policy implications for promoting MVNO diffusion
MVNO services Policy implications for promoting MVNO diffusion
MVNO services Policy implications for promoting MVNO diffusion

You also want an ePaper? Increase the reach of your titles
YUMPU automatically turns print PDFs into web optimized ePapers that Google loves.
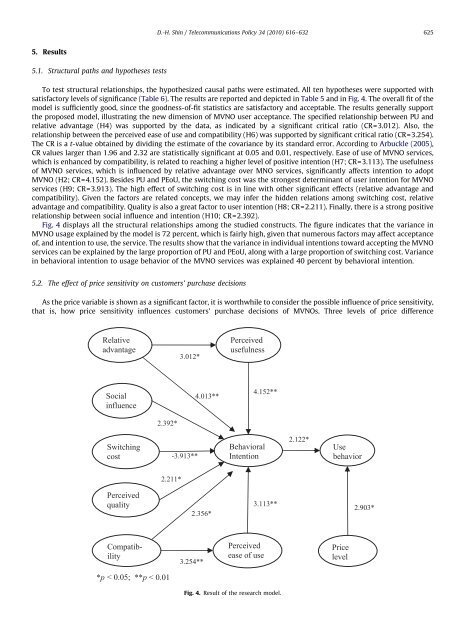
5. Results<br />
5.1. Structural paths and hypotheses tests<br />
To test structural relationships, the hypothesized causal paths were estimated. All ten hypotheses were supported with<br />
satisfactory levels of significance (Table 6). The results are reported and depicted in Table 5 and in Fig. 4.Theoverallfitofthe<br />
model is sufficiently good, since the goodness-of-fit statistics are satisfactory and acceptable. The results generally support<br />
the proposed model, illustrating the new dimension of <strong>MVNO</strong> user acceptance. The specified relationship between PU and<br />
relative advantage (H4) was supported by the data, as indicated by a significant critical ratio (CR=3.012). Also, the<br />
relationship between the perceived ease of use and compatibility (H6) was supported by significant critical ratio (CR=3.254).<br />
The CR is a t-value obtained by dividing the estimate of the covariance by its standard error. According to Arbuckle (2005),<br />
CR values larger than 1.96 and 2.32 are statistically significant at 0.05 and 0.01, respectively. Ease of use of <strong>MVNO</strong> <strong>services</strong>,<br />
which is enhanced by compatibility, is related to reaching a higher level of positive intention (H7; CR=3.113). The usefulness<br />
of <strong>MVNO</strong> <strong>services</strong>, which is influenced by relative advantage over MNO <strong>services</strong>, significantly affects intention to adopt<br />
<strong>MVNO</strong> (H2; CR=4.152). Besides PU and PEoU, the switching cost was the strongest determinant of user intention <strong>for</strong> <strong>MVNO</strong><br />
<strong>services</strong> (H9; CR=3.913). The high effect of switching cost is in line with other significant effects (relative advantage and<br />
compatibility). Given the factors are related concepts, we may infer the hidden relations among switching cost, relative<br />
advantage and compatibility. Quality is also a great factor to user intention (H8; CR=2.211). Finally, there is a strong positive<br />
relationship between social influence and intention (H10; CR=2.392).<br />
Fig. 4 displays all the structural relationships among the studied constructs. The figure indicates that the variance in<br />
<strong>MVNO</strong> usage explained by the model is 72 percent, which is fairly high, given that numerous factors may affect acceptance<br />
of, and intention to use, the service. The results show that the variance in individual intentions toward accepting the <strong>MVNO</strong><br />
<strong>services</strong> can be explained by the large proportion of PU and PEoU, along with a large proportion of switching cost. Variance<br />
in behavioral intention to usage behavior of the <strong>MVNO</strong> <strong>services</strong> was explained 40 percent by behavioral intention.<br />
5.2. The effect of price sensitivity on customers’ purchase decisions<br />
As the price variable is shown as a significant factor, it is worthwhile to consider the possible influence of price sensitivity,<br />
that is, how price sensitivity influences customers’ purchase decisions of <strong>MVNO</strong>s. Three levels of price difference<br />
Relative<br />
advantage<br />
Social<br />
influence<br />
Switching<br />
cost<br />
Perceived<br />
quality<br />
Compatib-<br />
ility<br />
*p < 0.05; ** p < 0.01<br />
D.-H. Shin / Telecommunications <strong>Policy</strong> 34 (2010) 616–632 625<br />
2.392*<br />
2.211*<br />
3.012*<br />
-3.913**<br />
2.356*<br />
3.254**<br />
4.013**<br />
Perceived<br />
usefulness<br />
Behavioral<br />
Intention<br />
4.152**<br />
3.113**<br />
Perceived<br />
ease of use<br />
Fig. 4. Result of the research model.<br />
2.122*<br />
Use<br />
behavior<br />
Price<br />
level<br />
2.903*