Henkel Annual Report 2011 - Henkel AG & Co. KGaA Annual Report ...
Henkel Annual Report 2011 - Henkel AG & Co. KGaA Annual Report ...
Henkel Annual Report 2011 - Henkel AG & Co. KGaA Annual Report ...

You also want an ePaper? Increase the reach of your titles
YUMPU automatically turns print PDFs into web optimized ePapers that Google loves.
<strong>Annual</strong> <strong>Report</strong> <strong>2011</strong>
How we performed in <strong>2011</strong><br />
Highlights<br />
15,605 million euros<br />
sales<br />
Key financials<br />
in million euros 2010 <strong>2011</strong> +/–<br />
Sales 15,092 15,605 3.4 %<br />
Operating profit (EBIT) 1,723 1,857 7.8 %<br />
Adjusted ¹ operating profit (EBIT) 1,862 2,029 9.0 %<br />
Return on sales (EBIT) in % 11.4 11.9 0.5 pp<br />
Adjusted ¹ return on sales (EBIT) in % 12.3 13.0 0.7 pp<br />
Net income 1,143 1,283 12.2 %<br />
– attributable to non-controlling interests 25 30 20.0 %<br />
– attributable to shareholders of <strong>Henkel</strong> <strong>AG</strong> & <strong>Co</strong>. <strong>KGaA</strong> 1,118 1,253 12.1 %<br />
Earnings per preferred share in euros 2.59 2.90 12.0 %<br />
Adjusted ¹ earnings per preferred share in euros 2.82 3.14 11.3 %<br />
Return on capital employed (ROCE) in % 14.9 16.6 1.7 pp<br />
Capital expenditures on property, plant and equipment 240 384 60.0 %<br />
Research and development expenses 391 410 4.9 %<br />
Number of employees (December 31) 47,854 47,265 –1.2 %<br />
Dividend per ordinary share in euros 0.70 0.78 2 11.4 %<br />
Dividend per preferred share in euros 0.72 0.80 2 11.1 %<br />
¹ Adjusted for one-time charges/gains and restructuring charges.<br />
² Proposal to shareholders for the <strong>Annual</strong> General Meeting on April 16, 2012.<br />
pp = percentage points<br />
Sales by business sector<br />
1 %<br />
<strong>Co</strong>rporate<br />
50 %<br />
Adhesive<br />
Technologies<br />
<strong>Co</strong>rporate = sales and services not assignable<br />
to the individual business sectors.<br />
13.0 %<br />
adjusted ¹ return on<br />
sales (EBIT): up<br />
0.7 percentage points<br />
27 %<br />
Laundry &<br />
Home Care<br />
22 %<br />
<strong>Co</strong>smetics/<br />
Toiletries<br />
3.14 euros<br />
adjusted ¹ earnings per<br />
preferred share (EPS):<br />
up 11.3 percent<br />
Sales by region<br />
4 %<br />
Japan / Australia /<br />
New Zealand<br />
17 %<br />
North America<br />
36 %<br />
Western Europe<br />
1 %<br />
<strong>Co</strong>rporate<br />
¹ Eastern Europe, Africa/Middle East, Latin America,<br />
Asia (excluding Japan).<br />
0.80 euros<br />
dividend per preferred<br />
share ²<br />
42 %<br />
Emerging markets ¹
Laundry & Home Care<br />
Leading market positions worldwide.<br />
Achieving profitable growth<br />
through appealing innovations<br />
under strong brands, aligned to<br />
exacting customer demands.<br />
Expanding our strong market position<br />
in Europe and extending our<br />
presence in North America and –<br />
selectively – in the emerging markets.<br />
<strong>Co</strong>smetics / Toiletries<br />
Leading market positions worldwide.<br />
Achieving profitable growth<br />
through appealing innovations<br />
under strong brands, aligned to<br />
exacting customer demands.<br />
Expanding our strong market position<br />
in Europe and extending our<br />
presence in North America and –<br />
selectively – in the emerging markets.<br />
Adhesive Technologies<br />
Leading our markets worldwide.<br />
Achieving profitable growth<br />
through innovations under strong<br />
brands, efficient processes and a<br />
firm focus on our customers.<br />
Developing new applications and<br />
growth potential in all regions of<br />
the world.<br />
Key financials<br />
Top brands<br />
in million euros 2010 <strong>2011</strong> +/–<br />
Sales 4,319 4,304 –0.3 %<br />
Operating profit (EBIT)<br />
Adjusted ¹ operating<br />
542 511 –5.8 %<br />
profit (EBIT) 562 570 1.4 %<br />
Return on sales (EBIT) 12.6 % 11.9 % –0.7 pp<br />
Adjusted ¹ return on sales (EBIT) 13.0 % 13.2 % 0.2 pp<br />
pp = percentage points<br />
¹ Adjusted for one-time charges/gains and<br />
restructuring charges.<br />
Key financials<br />
Top brands<br />
in million euros 2010 <strong>2011</strong> +/–<br />
Sales 3,269 3,399 4.0 %<br />
Operating profit (EBIT)<br />
Adjusted ¹ operating<br />
411 471 14.6 %<br />
profit (EBIT) 436 482 10.5 %<br />
Return on sales (EBIT) 12.6 % 13.8 % 1.2 pp<br />
Adjusted ¹ return on sales (EBIT) 13.3 % 14.2 % 0.9 pp<br />
pp = percentage points<br />
¹ Adjusted for one-time charges/gains and<br />
restructuring charges.<br />
Key financials<br />
Top brands<br />
in million euros 2010 <strong>2011</strong> +/–<br />
Sales 7,306 7,746 6.0 %<br />
Operating profit (EBIT)<br />
Adjusted ¹ operating<br />
878 1,002 14.1 %<br />
profit (EBIT) 938 1,075 14.7 %<br />
Return on sales (EBIT) 12.0 % 12.9 % 0.9 pp<br />
Adjusted ¹ return on sales (EBIT) 12.8 % 13.9 % 1.1 pp<br />
pp = percentage points<br />
¹ Adjusted for one time charges/gains and<br />
restructuring charges.<br />
+2.9 %<br />
organic<br />
sales growth<br />
Sales<br />
in million euros<br />
2010 4,319<br />
<strong>2011</strong> 4,304<br />
+5.4 %<br />
organic<br />
sales growth<br />
Sales<br />
in million euros<br />
2010 3,269<br />
<strong>2011</strong> 3,399<br />
+8.3 %<br />
organic<br />
sales growth<br />
Sales<br />
in million euros<br />
2010 7,306<br />
<strong>2011</strong> 7,746<br />
At a glance
<strong>Co</strong>ntents<br />
The <strong>Co</strong>mpany<br />
2 Foreword<br />
6 <strong>Report</strong> of the Supervisory Board<br />
12 Management Board<br />
14 Excellence is our Passion<br />
24 Shares and bonds<br />
Group management report<br />
28 Group management report subindex<br />
29 <strong>Co</strong>rporate governance<br />
45 Operational activities<br />
45 Strategy and financial targets for 2012<br />
51 Value-based management and control system<br />
53 Business performance<br />
60 Net assets and financial position<br />
64 Employees<br />
67 Procurement<br />
68 Production<br />
70 Research and development<br />
74 Marketing and distribution<br />
76 Business sector performance<br />
88 Risk report<br />
93 Forecast<br />
95 Subsequent events<br />
<strong>Co</strong>nsolidated financial statements<br />
96 <strong>Co</strong>nsolidated financial statements subindex<br />
98 <strong>Co</strong>nsolidated statement of financial position<br />
100 <strong>Co</strong>nsolidated statement of income<br />
101 <strong>Co</strong>nsolidated statement of comprehensive<br />
income<br />
101 <strong>Co</strong>nsolidated statement of changes in equity<br />
102 <strong>Co</strong>nsolidated statement of cash flows<br />
103 Notes to the consolidated financial statements<br />
153 Independent Auditor’s <strong>Report</strong><br />
155 Responsibility statement by the Personally<br />
Liable Partner<br />
156 <strong>Co</strong>rporate management of <strong>Henkel</strong> <strong>AG</strong> & <strong>Co</strong>. <strong>KGaA</strong><br />
Further information<br />
161 Quarterly breakdown of key financials<br />
162 Multi-year summary<br />
163 Glossary<br />
Credits / Financial calendar<br />
Our Vision<br />
A global leader<br />
in brands<br />
and technologies.<br />
Our Values<br />
We put our customers at the<br />
center of what we do.<br />
We value, challenge and reward<br />
our people.<br />
We drive excellent sustainable<br />
fi nancial performance.<br />
We are committed to leadership<br />
in sustainability.<br />
We build our future on our<br />
family business foundation.
<strong>Henkel</strong> <strong>Annual</strong> <strong>Report</strong> <strong>2011</strong> 1<br />
Our commitment<br />
“Excellence is our Passion”<br />
is a commitment that unites<br />
all of us who work at <strong>Henkel</strong>.<br />
It represents a performance<br />
challenge to ourselves and<br />
a performance promise to<br />
our customers – day by<br />
day, around the world.<br />
Learn more about how more than 47,000 <strong>Henkel</strong> employees around<br />
the globe live up to this commitment in the section starting on page 14.<br />
Further information<br />
You will notice a number of<br />
cross-references within this<br />
<strong>Annual</strong> <strong>Report</strong>. We also indicate<br />
the availability of supplementary<br />
information relating to specific<br />
subject areas in our Sustainability<br />
<strong>Report</strong> and on the internet.<br />
<strong>Annual</strong> <strong>Report</strong><br />
Sustainability <strong>Report</strong><br />
Internet
2<br />
Foreword<br />
Kasper Rorsted<br />
Chairman of the Management Board<br />
+5.9 %<br />
organic sales growth.<br />
13.0 %<br />
adjusted 1 return<br />
on sales.<br />
+11.3 %<br />
adjusted 1 earnings<br />
per preferred share.<br />
<strong>2011</strong> was a successful year for <strong>Henkel</strong> – despite<br />
major challenges and uncertainties within the<br />
economic environment. We made considerable<br />
progress in further developing our company,<br />
based on our vision, aligned with our values and<br />
driven by three strategic priorities: achieve<br />
our full business potential, focus more on our<br />
customers, and strengthen our global team.<br />
<strong>Henkel</strong> <strong>Annual</strong> <strong>Report</strong> <strong>2011</strong><br />
Excellent results in a challenging environment<br />
The progress made in the implementation of our<br />
strategic priorities is reflected in our key financials.<br />
In a persistently challenging environment marked<br />
by intense competition, we achieved organic sales<br />
growth of 5.9 percent, significantly outperforming<br />
global GDP growth of 2.6 percent. <strong>Henkel</strong> Group
<strong>Henkel</strong> <strong>Annual</strong> <strong>Report</strong> <strong>2011</strong> Foreword 3<br />
revenues rose to 15,605 million euros. Adjusted 1<br />
return on sales rose to 13.0 percent compared to<br />
12.3 per cent in the previous year, while adjusted<br />
earnings per preferred share increased by 11.3 percent<br />
to 3.14 euros. All our business sectors<br />
contributed to this successful performance with<br />
profitable growth and further expansion of their<br />
market shares.<br />
We will be proposing to the <strong>Annual</strong> General<br />
Meeting approval of a dividend payout of 0.80 euros<br />
per preferred share, an increase of 11.1 percent<br />
compared to the 0.72 euros in the previous year,<br />
in line with our established dividend payout policy.<br />
The excellent business performance and solid<br />
finances of <strong>Henkel</strong> were recognized in the financial<br />
markets. In the course of <strong>2011</strong>, both Standard &<br />
Poor’s and Moody’s increased <strong>Henkel</strong>’s credit rating<br />
to our target level, highlighting in particular our<br />
strong cash flow and our disciplined reduction of<br />
net debt – down to a level below 2 billion euros –<br />
since the acquisition of the National Starch businesses.<br />
We fully delivered on our ambitious targets in <strong>2011</strong>.<br />
Sales, profits and market shares in nearly all our<br />
business segments reached new highs. Based on<br />
this solid foundation and strong performance, we<br />
are very confident of achieving our 2012 targets<br />
set in 2008.<br />
On behalf of the Management Board, I would like<br />
to extend my sincere thanks to all our employees<br />
for their outstanding contributions in this difficult<br />
economic environment. Their commitment and<br />
their ambition to be the best in everything they<br />
do provide the foundation for <strong>Henkel</strong>’s success,<br />
as has consistently been the case during the last<br />
135 years.<br />
We are well aware of our responsibility toward our<br />
employees. Following the tsunami and the subsequent<br />
reactor incident in Japan, and also during<br />
the flood disaster in Thailand and the political<br />
unrest in the Middle East and North Africa, we<br />
made great efforts to ensure the safety and welfare<br />
of our employees and their families, providing<br />
a broad range of supportive measures.<br />
1 Adjusted for one-time charges/gains and restructuring charges.<br />
Excellence is our Passion<br />
Since the beginning of <strong>2011</strong>, our commitment to<br />
be the best in everything we do has been reflected<br />
in our new claim, “Excellence is our Passion.”<br />
We regard this as a performance challenge to ourselves<br />
and a performance promise to our customers.<br />
In this report we introduce selected examples<br />
of how more than 47,000 <strong>Henkel</strong> employees live<br />
up to this commitment – day by day, around<br />
the world.<br />
Growth through globalization<br />
Our vision, “a global leader in brands and technologies,”<br />
is reflected in our business strategy.<br />
A major success factor in our performance in <strong>2011</strong><br />
was the further expansion of our position in the<br />
emerging markets, where we generate 42 percent<br />
of our sales and employ 54 percent of our people.<br />
It is a key element of our longterm strategy to<br />
continuously strengthen our position in these<br />
markets characterized by aboveaverage growth.<br />
For example, in <strong>2011</strong> we began construction<br />
of our largest adhesives plant in Shanghai. Over<br />
recent years, <strong>Henkel</strong> has been benefiting from<br />
the increasing globalization of our businesses. This<br />
shift generates new growth momentum and<br />
enables us to better market our technologies<br />
to industrial customers on a global scale while<br />
growing our strong brands in local markets.<br />
Focus on strong brands<br />
We further strengthened our top brands in <strong>2011</strong><br />
and now generate 42 percent of total sales with<br />
our top 10 brands. Thanks to aboveaverage<br />
margins, these brands contribute significantly to<br />
our profitable growth. Our top 10 brands in the<br />
<strong>Co</strong>smetics/Toiletries business sector generate<br />
90 percent of its sales, in Laundry & Home Care<br />
the figure is 81 percent and in the Adhesive Technologies<br />
business sector the share is 54 percent.<br />
In our industrial adhesives business we will be<br />
further focusing our portfolio on established,<br />
global brands.<br />
42 %<br />
of our sales generated<br />
in the emerging markets.<br />
42 %<br />
of our sales generated<br />
by our top 10 brands.
4<br />
Foreword<br />
Around 30 %<br />
of our managers<br />
are women.<br />
<strong>Co</strong>ntinuous change to drive success<br />
<strong>2011</strong> provided a number of striking examples of<br />
how important flexibility and adaptability to<br />
changing business conditions can be. The unrest<br />
in North Africa and the Middle East, the natural<br />
disaster in Japan and the financial crises in Europe<br />
and the USA were still unforeseeable at the beginning<br />
of the year. These events had considerable<br />
impact on the economic landscape. In addition,<br />
significant raw material price increases and<br />
volatility in a market environment characterized<br />
by tough competition affected all our businesses.<br />
Against this background, it was vital to continue<br />
making <strong>Henkel</strong> more flexible, faster and more<br />
efficient.<br />
Our response included expansion of our shared<br />
services, further simplifying, standardizing and<br />
automating our processes. Having successfully<br />
introduced the shared services model for corporate<br />
functions such as Finance, Purchasing and<br />
Human Resources, we are now extending it to<br />
business unit processes as well. In addition to our<br />
existing shared service centers in Bratislava<br />
(Slovakia) and Manila (Philippines), in <strong>2011</strong> we<br />
opened a third center in Mexico City serving<br />
the Latin America region. By the end of <strong>2011</strong>, we<br />
had about 1,000 employees in our shared services<br />
organization, and we are planning to further<br />
increase this number in the coming years.<br />
Diversity – an asset for a global company<br />
We are convinced that the commitment and diversity<br />
of our employees are critical success drivers for<br />
<strong>Henkel</strong>. For both our consumer goods and our<br />
industrial businesses, the variety of backgrounds,<br />
knowledge and expertise of our diverse employee<br />
base makes the difference in a com petitive environment.<br />
In promoting diversity at <strong>Henkel</strong>, we<br />
focus on three dimensions: gender, internationality,<br />
and age combined with professional experience.<br />
<strong>Henkel</strong> employs people from more than<br />
120 countries and there are 26 nations represented<br />
among our top 180 managers.<br />
<strong>Henkel</strong> <strong>Annual</strong> <strong>Report</strong> <strong>2011</strong><br />
“ In <strong>2011</strong>, we established<br />
a strong platform<br />
for <strong>Henkel</strong>’s future.”<br />
In <strong>2011</strong>, the focus in Germany and other countries<br />
was on the topic of women in management. At<br />
<strong>Henkel</strong>, we have been able to raise the proportion<br />
of female managers by one percentage point as<br />
an annual average over the last six years. The figure<br />
currently stands at approximately 30 percent,<br />
putting <strong>Henkel</strong> among the leading corporations<br />
listed in the DAX. Going forward, we are committed<br />
to steadily raising this ratio by one to two percentage<br />
points per year.<br />
As part of our effort to strengthen our global team,<br />
we expanded our worldwide career and development<br />
activities in <strong>2011</strong>. We now evaluate and<br />
differentiate the performance levels and development<br />
potential of our 9,000 managers and leaders<br />
around the world using a standard process. From<br />
the results, we derive their longterm career and<br />
development requirements.<br />
At <strong>Henkel</strong>, we prefer to promote talent from within,<br />
but without compromising on quality. I am<br />
particularly pleased that, in the course of <strong>2011</strong>,<br />
we promoted three senior managers with longstanding<br />
experience within <strong>Henkel</strong> to our Management<br />
Board. And, as already announced, in<br />
July of 2012 we will be appointing a new Chief<br />
Financial Officer from our ranks. This ensures<br />
a high degree of continuity and competence<br />
within the company.<br />
Leadership in sustainability<br />
“We are committed to leadership in sustainability”<br />
is one of our five company values. <strong>Henkel</strong> holds<br />
a top international position in this field. For the<br />
fifth consecutive year, we were acknowledged<br />
as the global leader in our industry by the Dow<br />
Jones Sustainability Index; and we are also at the<br />
top of other recognized, independent rankings.
<strong>Henkel</strong> <strong>Annual</strong> <strong>Report</strong> <strong>2011</strong> Foreword<br />
5<br />
We intend to maintain and further extend this<br />
leading position in the future, not least because<br />
our customers in the industrial business and also<br />
retail partners and consumers are placing increasing<br />
emphasis on sustainable products and<br />
processes.<br />
Well ahead of schedule, by the end of 2010 we<br />
achieved our sustainability targets originally<br />
formulated for 2012. <strong>Co</strong>nsequently, in <strong>2011</strong> we<br />
developed a new, longterm sustainability strategy<br />
for <strong>Henkel</strong>, incorporating the insights from external,<br />
international experts. At the heart of this<br />
strategy lies the ambition to achieve more with<br />
less. We aim to triple our resource efficiency by<br />
the year 2030. As an interim objective, we want to<br />
improve our efficiency by 30 percent by the end<br />
of 2015. Our <strong>Annual</strong> <strong>Report</strong> details a number of<br />
important contributions that have been made<br />
in the implementation of this strategy. Detailed<br />
information relating to this strategy, our specific<br />
targets and our progress can be found in our<br />
Sustainability <strong>Report</strong> and on the internet.<br />
2012 outlook and long-term strategic alignment<br />
We are very confident of meeting our targets for<br />
fiscal 2012: We aim to achieve organic sales growth<br />
of 3 to 5 percent. For our consumer goods businesses<br />
we expect growth in the low singledigit<br />
percentage range, and for our Adhesive Technologies<br />
business, we are targeting sales growth<br />
in the mid singledigit percentage range. Building<br />
on our strong <strong>2011</strong> results, we intend to increase<br />
adjusted return on sales (EBIT) to 14 percent for<br />
the <strong>Henkel</strong> Group, coupled with a rise in adjusted<br />
earnings per preferred share (EPS) of at least<br />
10 percent.<br />
In <strong>2011</strong>, we were able to achieve significant<br />
milestones in our development, making progress<br />
in many key areas and establishing a strong platform<br />
for the future. In the course of the year, the<br />
Management Board analyzed major trends which<br />
will be affecting <strong>Henkel</strong> in the future, as well as<br />
various scenarios for the potential development<br />
of our business environment. These analyses will<br />
inform the strategic direction and focus of our<br />
company in the future, as will be communicated<br />
at the end of this year.<br />
In addition to our appreciation of our employees,<br />
I would like on behalf of the entire Management<br />
Board to extend our special thanks to our supervisory<br />
bodies. And in the name of the entire<br />
company I thank you, our shareholders, for your<br />
continued trust and support. We also thank our<br />
customers throughout the world for the confidence<br />
they have shown in <strong>Henkel</strong>, in our brands and<br />
in our technologies.<br />
Düsseldorf, January 27, 2012<br />
Sincerely,<br />
Kasper Rorsted<br />
Chairman of the Management Board
6<br />
<strong>Report</strong> of the Supervisory Board<br />
Dr. Simone Bagel-Trah<br />
Chairwoman of the Shareholders’ <strong>Co</strong>mmittee and the Supervisory Board,<br />
pictured here in <strong>Henkel</strong>’s “Forscherwelt”, a research center created especially for children.<br />
<strong>2011</strong> was again a successful year for <strong>Henkel</strong>. We<br />
were able to significantly increase both sales and<br />
profits in all our business units while further<br />
strengthening our position in many markets.<br />
This was an excellent achievement, particularly<br />
in view of the difficult business environment.<br />
The natural disasters in Japan and Thailand, and<br />
political unrest in the Middle East and North<br />
Africa coincided with major challenges and<br />
uncertainties in our markets arising from the<br />
debt crisis. We also had to deal with significantly<br />
<strong>Henkel</strong> <strong>Annual</strong> <strong>Report</strong> <strong>2011</strong><br />
rising raw material prices and persistently intense<br />
competition. Despite these challenges, our company<br />
performed very well in fiscal <strong>2011</strong>.<br />
On behalf of the Supervisory Board, I thank all<br />
employees for their hard work and commitment.<br />
Without their contribution this outcome would<br />
not have been possible. I would also like to thank<br />
the members of the Management Board for their<br />
successful and effective leadership of the company<br />
through this difficult period, and the employee
<strong>Henkel</strong> <strong>Annual</strong> <strong>Report</strong> <strong>2011</strong> <strong>Report</strong> of the Supervisory Board<br />
7<br />
representatives and Works <strong>Co</strong>uncils for their<br />
constructive support in <strong>Henkel</strong>’s development.<br />
In particular, I would like to extend our gratitude<br />
to you, our shareholders, for the confidence you<br />
continue to show in our company, its management,<br />
its employees, and its products and<br />
services.<br />
Ongoing dialogue with the Management Board<br />
Again in fiscal <strong>2011</strong>, we as the Supervisory Board<br />
diligently discharged our duties in accordance<br />
with the legal statutes, Articles of Association<br />
and rules of procedure governing our actions. We<br />
carefully and regularly monitored the work of the<br />
Management Board, advising and supporting it in<br />
its stewardship, in the strategic further development<br />
of the company and in decisions relating to<br />
matters of major importance.<br />
<strong>Co</strong>operation between the Management Board<br />
and the Supervisory Board takes place through<br />
extensive dialogue based on mutual trust and<br />
confidence. Throughout fiscal <strong>2011</strong>, the Management<br />
Board kept us fully informed of all major<br />
issues affecting the company and its Group<br />
companies with prompt, detailed written and<br />
oral reports. Specifically, the Management Board<br />
provided explanations of the business situation,<br />
operational development, business policy, profitability<br />
issues, and our shortterm and longterm<br />
corporate, financial and personnel planning, as<br />
well as capital expenditures and organizational<br />
measures. In the course of preparing the quarterly<br />
reports, moreover, details were given of the sales<br />
and profits of the <strong>Henkel</strong> Group as a whole, with<br />
further analysis by business sector and region.<br />
Outside Supervisory Board meetings, I as<br />
Chairwoman remained in regular contact with<br />
the Chairman of the Management Board; this<br />
ensured that the Supervisory Board was constantly<br />
kept informed of current business developments<br />
and major occurrences.<br />
The Supervisory Board and the Audit <strong>Co</strong>mmittee<br />
each held four regular meetings in <strong>2011</strong>. Attendance<br />
of the Supervisory Board meetings during<br />
the year averaged 94 percent. No member of the<br />
Supervisory Board participated in fewer than<br />
half the meetings. All Audit <strong>Co</strong>mmittee meetings<br />
were fully attended apart from one.<br />
There were no conflicts of interest involving<br />
Management Board or Supervisory Board<br />
members which had to be disclosed to the<br />
Supervisory Board and reported to the <strong>Annual</strong><br />
General Meeting.<br />
Major issues discussed at Supervisory Board<br />
meetings<br />
In all our meetings, we discussed the reports<br />
provided by the Management Board, consulting<br />
with its members on the development of the corporation<br />
and strategic issues. We also discussed<br />
the overall economic situation and <strong>Henkel</strong>’s<br />
business development.<br />
The main items on the agenda for our meeting<br />
of February 22, <strong>2011</strong> were approval of the annual<br />
and consolidated financial statements for 2010,<br />
including the risk report and the corporate governance<br />
report, the <strong>2011</strong> Declaration of <strong>Co</strong>mpliance,<br />
and our proposed resolutions for the <strong>Annual</strong><br />
General Meeting, relevant details of which were<br />
published in our last <strong>Annual</strong> <strong>Report</strong>. During<br />
the same meeting, we further dealt with specifics<br />
relating to <strong>Henkel</strong>’s market appearance and<br />
questions pertaining to the presentation of<br />
<strong>Henkel</strong> as an attractive employer.<br />
At our meeting of April 11, <strong>2011</strong>, which was held<br />
straight after the <strong>Annual</strong> General Meeting, the<br />
main topics discussed – aside from the general<br />
performance of the individual business sectors<br />
– centered on current developments in Japan,<br />
Egypt and Tunisia. We also consulted on the<br />
effects of the increases in raw material prices,<br />
discussed in detail the importance of the North<br />
American market for <strong>Henkel</strong>’s branded consumer<br />
goods business and our development in general,<br />
and issues relating to the implementation of our<br />
new vision and values.<br />
In addition to operational developments in<br />
the first eight months of the financial year, our<br />
meeting held on September 27, <strong>2011</strong> also focused<br />
on strategic issues. We consulted on the further<br />
development of our sustainability strategy, formulated<br />
under the heading “Achieving more with<br />
less.” We considered the status and structure of<br />
our shared service centers, and also the efficiency<br />
improvements accompanying the further standardization<br />
of our processes and the associated
8<br />
<strong>Report</strong> of the Supervisory Board<br />
transfer of duties and responsibilities. We likewise<br />
consulted on the future strategic direction<br />
of <strong>Henkel</strong> and on our information technology<br />
strategy and its alignment to our future<br />
requirements.<br />
At our meeting of December 13, <strong>2011</strong>, we extensively<br />
discussed – on the basis of comprehensive<br />
documentation – our assets and financial planning,<br />
including our statement of income and the<br />
detailed budgets of our business sectors.<br />
In our meetings, we also discussed compliance<br />
issues, focusing particularly on antitrust infringements<br />
and the related decisions both of the<br />
EU <strong>Co</strong>mmission dated April 13, <strong>2011</strong>, and of the<br />
French antitrust authority dated December 8, <strong>2011</strong>.<br />
Supervisory Board committees<br />
In order to efficiently comply with the duties<br />
incumbent upon us according to legal statute<br />
and our Articles of Association, we assign certain<br />
activities to two separate committees: an Audit<br />
<strong>Co</strong>mmittee and a Nominations <strong>Co</strong>mmittee. For<br />
more details on the responsibilities and composition<br />
of these committees, please refer to the corporate<br />
governance section and the membership lists<br />
on pages 32 and 33, and page 157 respectively.<br />
<strong>Co</strong>mmittee activities<br />
The Audit <strong>Co</strong>mmittee met four times in the year<br />
under review. The meetings and resolutions were<br />
prepared through the provision of reports and<br />
other information by the Management Board.<br />
The Chair of the <strong>Co</strong>mmittee reported promptly<br />
and in full to the plenary Supervisory Board on<br />
the content and results of each of the <strong>Co</strong>mmittee<br />
meetings.<br />
The focus at all the Audit <strong>Co</strong>mmittee meetings<br />
was on the company and consolidated Group<br />
accounts, including the interim financial reports,<br />
with all matters being duly discussed with the<br />
Management Board. The three meetings at which<br />
we discussed and approved the interim financial<br />
reports were attended by the auditor. The latter<br />
reported on the results of the respective reviews<br />
and on all the main issues and occurrences<br />
relevant to the work of the Audit <strong>Co</strong>mmittee.<br />
<strong>Henkel</strong> <strong>Annual</strong> <strong>Report</strong> <strong>2011</strong><br />
There were no objections raised in response to<br />
these reports.<br />
The Audit <strong>Co</strong>mmittee also scrutinized the<br />
accounting process and the efficacy and further<br />
development of the internal Groupwide control<br />
and risk management system. The <strong>Co</strong>mmittee<br />
received the status reports of the Chief <strong>Co</strong>mpliance<br />
Officer and the Head of Internal Audit, and<br />
approved the audit plan put forward by Internal<br />
Audit, which extends to examining the functional<br />
efficiency and efficacy of the Internal <strong>Co</strong>ntrol<br />
System and our compliance organization.<br />
The Audit <strong>Co</strong>mmittee mandated the external<br />
auditor, pursuant to the latter’s appointment by<br />
the <strong>2011</strong> <strong>Annual</strong> General Meeting, to audit the<br />
annual financial statements and the consolidated<br />
financial statements for fiscal <strong>2011</strong>, and also to<br />
review the interim financial reports for fiscal<br />
<strong>2011</strong>. The audit fee was also established. The Audit<br />
<strong>Co</strong>mmittee obtained the necessary validation<br />
of auditor independence for the performance of<br />
these tasks. The auditor has informed the Audit<br />
<strong>Co</strong>mmittee that there are no circumstances that<br />
might give rise to a conflict of interest in the<br />
execution of its duties.<br />
At its meeting of March 5, 2012, attended by<br />
the auditor, the Audit <strong>Co</strong>mmittee discussed the<br />
annual and consolidated financial statements<br />
for fiscal <strong>2011</strong>, including the audit reports, the<br />
associated proposal for the appropriation of profits,<br />
and the risk report, and submitted to the Supervisory<br />
Board corresponding proposals for<br />
resolution by the <strong>Annual</strong> General Meeting. The<br />
<strong>Co</strong>mmittee further made its recommendation to<br />
the Supervisory Board regarding the latter’s proposal<br />
for resolution to be presented before the<br />
<strong>Annual</strong> General Meeting relating to the appointment<br />
of the external auditor for fiscal 2012.<br />
A declaration from the auditor asserting its<br />
independence was again duly received, accompanied<br />
by details pertaining to nonaudit services<br />
rendered in fiscal <strong>2011</strong> and those envisaged for<br />
fiscal 2012. There was no evidence of any bias or<br />
partiality on the part of the auditor. Other members<br />
of the Supervisory Board also took part as<br />
guests in this specifically auditrelated meeting<br />
of the Audit <strong>Co</strong>mmittee.
<strong>Henkel</strong> <strong>Annual</strong> <strong>Report</strong> <strong>2011</strong> <strong>Report</strong> of the Supervisory Board<br />
9<br />
“ We look forward with<br />
confidence to the further<br />
development of our<br />
company.”<br />
On the basis of the objectives agreed within the<br />
Supervisory Board with respect to its future<br />
composition, the members of the Nominations<br />
<strong>Co</strong>mmittee made appropriate recommendations<br />
in preparation for the resolutions to be formulated<br />
by the Supervisory Board and placed before the<br />
2012 <strong>Annual</strong> General Meeting with respect to the<br />
upcoming election of shareholderrepresentative<br />
members.<br />
Efficiency audit<br />
The Supervisory Board and the Audit <strong>Co</strong>mmittee<br />
regularly examine the efficiency with which<br />
they perform their duties. This is done through<br />
discussion in the Supervisory Board plenary<br />
meetings and within the Audit <strong>Co</strong>mmittee, based<br />
on a comprehensive, companyspecific checklist.<br />
This deals with relevant major aspects such as<br />
preparation and conduct of meetings, scope and<br />
content of documentation and information<br />
(particularly with respect to financial reporting<br />
and auditing tasks), performance management<br />
and cost control, and risk management. Questions<br />
relating to corporate governance and<br />
possible improvements are also dealt with.<br />
The results of these selfassessment audits were<br />
discussed in detail at the meeting of the Audit<br />
<strong>Co</strong>mmittee on March 5, 2012, and that of the<br />
Supervisory Board on March 6, 2012. The efficiency<br />
of the Audit <strong>Co</strong>mmittee and the Supervisory<br />
Board, and also the requisite independence of<br />
their members, were duly confirmed.<br />
<strong>Co</strong>rporate governance and declaration of<br />
compliance<br />
Again in <strong>2011</strong>, we consulted on issues relating<br />
to corporate governance, details of which are<br />
available in the corporate governance report on<br />
pages 29 to 36, with which we fully acquiesce.<br />
At the meeting of March 6, 2012, we discussed<br />
and approved the joint Declaration of <strong>Co</strong>mpliance<br />
of the Management Board, the Shareholders’<br />
<strong>Co</strong>mmittee and the Supervisory Board with respect<br />
to the German <strong>Co</strong>rporate Governance <strong>Co</strong>de (Kodex)<br />
for 2012. The full wording of the current and previous<br />
declarations of compliance can be found<br />
on the company website.<br />
<strong>Annual</strong> and consolidated financial statements /<br />
Audit<br />
The annual financial statements of <strong>Henkel</strong> <strong>AG</strong> &<br />
<strong>Co</strong>. <strong>KGaA</strong> and the management report have been<br />
prepared by the Management Board in accordance<br />
with the provisions of the German <strong>Co</strong>mmercial<br />
<strong>Co</strong>de [HGB]. The consolidated financial statements<br />
and the Group management report have<br />
been prepared by the Management Board in<br />
accordance with International Financial <strong>Report</strong>ing<br />
Standards (IFRS) as endorsed by the European<br />
Union, and in accordance with the supplementary<br />
German statutory provisions pursuant to<br />
Section 315a (1) HGB. The consolidated financial<br />
statements in their present form exempt us from<br />
the requirement to prepare consolidated financial<br />
statements in accordance with German law.<br />
The auditor appointed for <strong>2011</strong> by the last <strong>Annual</strong><br />
General Meeting – KPMG <strong>AG</strong> Wirtschaftsprüfungsgesellschaft<br />
(KPMG) – has examined the <strong>2011</strong><br />
annual financial statements of <strong>Henkel</strong> <strong>AG</strong> & <strong>Co</strong>.<br />
<strong>KGaA</strong> and the <strong>2011</strong> consolidated financial statements,<br />
including the management reports. The<br />
annual financial statements and the consolidated<br />
financial statements have been issued with an<br />
unqualified opinion.<br />
KPMG reports that the annual financial statements<br />
give a true and fair view of the net assets,<br />
financial position and results of operations of<br />
<strong>Henkel</strong> <strong>AG</strong> & <strong>Co</strong>. <strong>KGaA</strong> in accordance with German<br />
generally accepted accounting principles, and<br />
that the consolidated financial statements give a<br />
true and fair view of the net assets, financial<br />
position and results of operations of the Group in<br />
compliance with International Financial <strong>Report</strong>ing<br />
Standards and the supplementary German<br />
statutes pursuant to Section 315a (1) HGB.
10<br />
<strong>Report</strong> of the Supervisory Board<br />
The annual financial statements and management<br />
report, consolidated financial statements and<br />
Group management report, the audit reports of<br />
KPMG and the recommendations by the Management<br />
Board for the appropriation of the profit<br />
made by <strong>Henkel</strong> <strong>AG</strong> & <strong>Co</strong>. <strong>KGaA</strong> were duly laid<br />
before all members of the Supervisory Board. We<br />
examined these documents and discussed them<br />
at our meeting of March 6, 2012. This was attended<br />
by the auditor, which reported on its main<br />
audit findings. We received the audit reports and<br />
voiced our acquiescence therewith. The Chair of<br />
the Audit <strong>Co</strong>mmittee provided the plenary session<br />
of the Supervisory Board with a detailed account<br />
of the treatment of the annual and the consolidated<br />
financial statements by the Audit <strong>Co</strong>mmittee.<br />
Having received the final results of the<br />
review conducted by the Audit <strong>Co</strong>mmittee and<br />
concluded our own examination, we see no<br />
reason for objection to the aforementioned<br />
documents. The assessment by the Management<br />
Board of the position of the company and the<br />
Group coincides with our own appraisal. At our<br />
meeting of March 6, 2012, we concurred with the<br />
recommendations of the Audit <strong>Co</strong>mmittee and<br />
therefore approved the annual financial statements,<br />
the consolidated financial statements<br />
and the management reports as prepared by the<br />
Management Board.<br />
We also discussed and approved the proposal<br />
by the Management Board to pay out of the<br />
unappropriated profit of <strong>Henkel</strong> <strong>AG</strong> & <strong>Co</strong>. <strong>KGaA</strong> a<br />
dividend of 0.78 euros per ordinary share and of<br />
0.80 euros per preferred share, and to carry the<br />
amount attributable to the treasury shares held<br />
by the company at the time of the <strong>Annual</strong> General<br />
Meeting forward to the following year. This proposal<br />
takes into account the financial and earnings<br />
position of the corporation, its mediumterm<br />
financial and investment planning, and the<br />
interests of our shareholders. We consider the<br />
proposed dividends to be reasonable and appropriate.<br />
Also at this meeting, we ratified our<br />
proposal for resolution to be presented before the<br />
<strong>Annual</strong> General Meeting relating to the appointment<br />
of the external auditor for the next financial<br />
year, based on the recommendations of the Audit<br />
<strong>Co</strong>mmittee.<br />
Risk management<br />
<strong>Henkel</strong> <strong>Annual</strong> <strong>Report</strong> <strong>2011</strong><br />
Risk management issues were examined not<br />
only by the Audit <strong>Co</strong>mmittee but also the plenary<br />
Supervisory Board. The emphasis was on the risk<br />
management system in place at <strong>Henkel</strong> and any<br />
major individual risks of which we needed to be<br />
notified. There were no identifiable risks that<br />
might jeopardize the continued existence of the<br />
corporation as a going concern. The structure<br />
and function of the risk management system were<br />
also integral to the audit performed by KPMG,<br />
which found no cause for reservation. It is our<br />
considered opinion that the risk management<br />
system corresponds to the statutory requirements<br />
and is fit for the purpose of early identification<br />
of developments that could endanger the continuation<br />
of the corporation as a going concern.<br />
Changes in the Supervisory Board and<br />
Management Board<br />
Mr. Ulf Wentzien, Senior Staff Representative<br />
on the Supervisory Board, resigned his seat as of<br />
December 31, <strong>2011</strong>, and we would like to extend<br />
to him our sincere thanks for his service and<br />
contribution. Dr. Martina Seiler was appointed<br />
by the District <strong>Co</strong>urt to take his place.<br />
The Management Board underwent a number of<br />
changes in the course of the year, some of which<br />
were already reported last year. Effective January 1,<br />
<strong>2011</strong>, Mr. JanDirk Auris joined the Management<br />
Board as Executive Vice President for Adhesive<br />
Technologies. Mr. Bruno Piacenza assumed<br />
responsibility for the Laundry & Home Care business<br />
sector on March 1, <strong>2011</strong>. He takes over from<br />
Dr. Friedrich Stara who has retired and to whom<br />
we extend our sincere thanks for his many years<br />
of successful service. On October 1, <strong>2011</strong>, Mrs.<br />
Kathrin Menges was appointed to the Management<br />
Board as a new member and Executive Vice<br />
President Human Resources, and we wish her<br />
every success in this role. After more than thirty<br />
years with <strong>Henkel</strong>, Dr. Lothar Steinebach will be<br />
retiring at the end of June 2012; his successor will<br />
be Mr. Carsten Knobel, due to take up his new<br />
duties as of July 2012. We are particularly pleased<br />
that we have been able to fill all these positions
<strong>Henkel</strong> <strong>Annual</strong> <strong>Report</strong> <strong>2011</strong> <strong>Report</strong> of the Supervisory Board<br />
11<br />
on the Management Board by promoting senior<br />
managers with longstanding experience within<br />
<strong>Henkel</strong>.<br />
As in the previous year, fiscal 2012 is expected to<br />
bring major challenges for our company, its employees<br />
and its management. Many of the issues<br />
and changes that characterized <strong>2011</strong> will remain<br />
with us in 2012. Building on the significant progress<br />
that our company has made in recent years,<br />
we are convinced that <strong>Henkel</strong> is in excellent<br />
shape and we look forward with confidence to<br />
the further development of our company.<br />
We thank you for your ongoing trust and support.<br />
Düsseldorf, March 6, 2012<br />
On behalf of the Supervisory Board<br />
Dr. Simone Bagel-Trah<br />
(Chairwoman)
12<br />
Management Board<br />
Our Management Board<br />
Dr. Lothar Steinebach<br />
Executive Vice President<br />
Finance (CFO) / Purchasing /<br />
IT / Legal<br />
Born in Wiesbaden,<br />
Germany,<br />
on January 25, 1948;<br />
with <strong>Henkel</strong> since 1980.<br />
Kathrin Menges<br />
Executive Vice President<br />
Human Resources<br />
Born in Pritzwalk,<br />
Germany,<br />
on October 16, 1964;<br />
with <strong>Henkel</strong> since 1999.<br />
<strong>Henkel</strong> <strong>Annual</strong> <strong>Report</strong> <strong>2011</strong><br />
Kasper Rorsted<br />
Chairman of the<br />
Management Board<br />
Born in Aarhus,<br />
Denmark,<br />
on February 24, 1962;<br />
with <strong>Henkel</strong> since 2005.
<strong>Henkel</strong> <strong>Annual</strong> <strong>Report</strong> <strong>2011</strong> Management Board 13<br />
Jan-Dirk Auris<br />
Executive Vice President<br />
Adhesive Technologies<br />
Born in <strong>Co</strong>logne,<br />
Germany,<br />
on February 1, 1968;<br />
with <strong>Henkel</strong> since 1984.<br />
Bruno Piacenza<br />
Executive Vice President<br />
Laundry & Home Care<br />
Born in Paris,<br />
France,<br />
on December 22, 1965;<br />
with <strong>Henkel</strong> since 1990.<br />
Hans Van Bylen<br />
Executive Vice President<br />
<strong>Co</strong>smetics/Toiletries<br />
Born in Berchem,<br />
Belgium,<br />
on April 26, 1961;<br />
with <strong>Henkel</strong> since 1984.
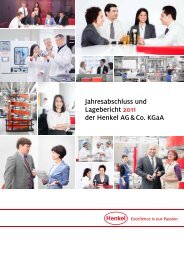
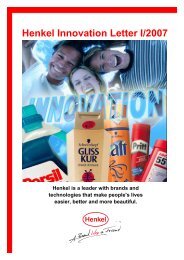
Innovative brands –<br />
successful in local markets<br />
In highly competitive markets, new products only succeed when they combine innovation with<br />
a deep understanding of the regionally varied expectations and requirements of our customers<br />
and consumers. The example of Persil Black, successful in both the Arab region and in European<br />
markets, proves that <strong>Henkel</strong> knows how to get the combination right.<br />
DÜSSELDORF<br />
GERMANY<br />
Ashraf El Afifi<br />
Regional President and <strong>Co</strong>rporate Senior Vice President<br />
for Laundry & Home Care in Africa/Middle East,<br />
in conversation with Dr. Dagmar Preis-Amberger,<br />
Head of Laundry Detergent Production in Düsseldorf.<br />
Left: Maria Lancellotti.
<strong>Henkel</strong> <strong>Annual</strong> <strong>Report</strong> <strong>2011</strong> Excellence is our Passion 15<br />
Formulated especially for black and dark<br />
apparel, we initially launched Persil in<br />
the Africa/Middle East region five years<br />
ago under the name Persil Abaya. The<br />
abaya is the predominantly black overgarment<br />
worn by most Arab women.<br />
The liquid detergent combines true<br />
cleaning power with special color protection<br />
for black and dark garments –<br />
particularly important if these are washed<br />
frequently. Since June <strong>2011</strong>, Persil Black<br />
has also been available in Germany,<br />
Austria and Switzerland – catching the<br />
crest of a fashion wave. While black is<br />
the traditional shade for women in the<br />
Africa/Middle East region, the popularity<br />
of black and dark clothing has also<br />
steadily risen in Western European<br />
markets over recent years.<br />
“Persil Black or Persil Abaya is a perfect<br />
example of what our mix of global technology<br />
and local market expertise can<br />
achieve,” says Ashraf El Afifi, Regional<br />
President and <strong>Co</strong>rporate Senior Vice<br />
President for Laundry & Home Care in<br />
the Africa/Middle East region.<br />
Cultural and regional knowledge transfer<br />
He and his team regularly meet with<br />
colleagues at headquarters in Düsseldorf<br />
to discuss cultural specifics and provide<br />
local expertise for the development of<br />
consumertailored products. With<br />
Dr. Dagmar PreisAmberger, Head of<br />
Laundry Production in Düsseldorf, for<br />
example, El Afifi reviews both commonalities<br />
and differences impacting the<br />
production of Persil Black. “It’s great to<br />
know that, with Persil Black, we can<br />
build on the experience of our colleagues<br />
from the Gulf States – their insights are<br />
invaluable for the entire process, from<br />
production to marketing,” says Preis<br />
Amberger.<br />
DÜSSELDORF<br />
GERMAnY<br />
SHANGHAI<br />
CHInA<br />
ROCKY HILL<br />
COnnECTICUT, USA<br />
In the Düsseldorf liquid detergent factory, Maria Lancellotti monitors the filling<br />
of Persil Black.<br />
The formulations in Africa/Middle East<br />
and Europe have some common attributes,<br />
while the fragrances are tailored<br />
to cultural preferences. Package appearance<br />
and consumer communications are<br />
also regionally aligned. Persil Abaya was<br />
launched in the Gulf States through a<br />
mix of TV commercials and a very successful<br />
viral online marketing campaign.<br />
An interactive website was set up and<br />
there was also a designer competition,<br />
the abaya having transcended from<br />
traditional garment to individual fashion<br />
statement. In the Western European<br />
markets, the consumer campaign relied<br />
mainly on classic TV advertising, complemented<br />
by social media activities<br />
such as a game on Facebook.<br />
“Thanks to our expertise in different<br />
regions, we are able to launch global<br />
innovations successfully in diverse<br />
local markets. This is a special strength<br />
of <strong>Henkel</strong>,” says El Afifi.<br />
MANILA<br />
PHILIPPInES<br />
MOSCOw<br />
RUSSIA<br />
Similar formulations, regionally tailored<br />
product marketing, strong performance:<br />
Persil Black and Persil Abaya for black<br />
and dark apparel.<br />
www.persilabayaworld.com<br />
www.persil.de<br />
“ Persil Black is a<br />
perfect example of<br />
global technology<br />
combined with<br />
local market<br />
expertise.”<br />
Ashraf El Afifi<br />
Regional President and <strong>Co</strong>rporate Senior<br />
Vice President for Laundry & Home Care<br />
in Africa/Middle East.
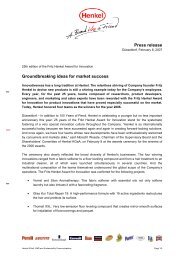
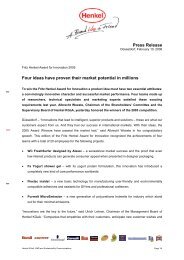
Diversity –<br />
an asset for a global company<br />
Mixed teams are simply more successful. One example is the crossborder cooperation put in place<br />
for the development and international marketing of Gliss Kur Ultimate Repair, a product range<br />
specifically created for damaged and dry hair, successfully launched around the world in <strong>2011</strong>.<br />
SHANGHAI<br />
CHINA<br />
Aida Rizvo<br />
Head of <strong>Co</strong>smetics/<br />
Toiletries Marketing for<br />
the Asia-Pacific region.
<strong>Henkel</strong> <strong>Annual</strong> <strong>Report</strong> <strong>2011</strong> Excellence is our Passion 17<br />
After just six months on the market, the<br />
Ultimate Repair line for damaged and<br />
dry hair had become the most successful<br />
launch in the brand history of Gliss<br />
Kur, leading to substantial market share<br />
gains worldwide. In order to be able to<br />
develop and market such globally successful<br />
innovations, the international<br />
marketing experts from the <strong>Co</strong>smetics/<br />
Toiletries business sector regularly and<br />
extensively share knowledge with their<br />
counterparts in the different regions.<br />
Internationality as an innovation driver<br />
“The key to our success lies in the international<br />
mix of our teams,” says Aida<br />
Rizvo, Head of <strong>Co</strong>smetics/Toiletries<br />
Marketing for the AsiaPacific region,<br />
who is located in Shanghai. A Bosnian<br />
by birth, Rizvo has been in Shanghai<br />
since June <strong>2011</strong>. She speaks five languages<br />
and now she is learning Mandarin. “For<br />
me, interacting with international colleagues<br />
in closeknit teams is an integral<br />
part of my work at <strong>Henkel</strong>,” she adds.<br />
Gliss Kur Ultimate Repair, which is<br />
marketed under the name Extra Care<br />
Ultimate Repair in China, was developed<br />
in the strategic business unit in Düsseldorf<br />
– with the involvement of Jasmin<br />
Goller, Head of International Marketing<br />
for the Gliss Kur brand. She also kept in<br />
close contact with Rizvo and other regional<br />
marketing experts such as Enis<br />
Toksoez representing Africa/Middle East,<br />
and Juan Pablo Molina, responsible for<br />
Peru and Ecuador.<br />
“Our colleagues in other countries know<br />
their local market, its consumers and<br />
their preferences, better than anyone,”<br />
explains Jasmin Goller. “<strong>Co</strong>nsequently,<br />
interaction with them is vital for the<br />
successful development and smooth<br />
international launch of any innovation.”<br />
DÜSSELDORF<br />
GERMAnY<br />
SHANGHAI<br />
CHInA<br />
ROCKY HILL<br />
COnnECTICUT, USA<br />
Pursuing the international exchange of ideas for the successful development of<br />
innovations (from the left): Enis Toksoez, Regional Marketing Manager for Africa/<br />
Middle East, Jasmin Goller, Head of International Marketing for the Gliss Kur brand,<br />
Aida Rizvo, Head of <strong>Co</strong>smetics/Toiletries Marketing for the Asia-Pacific region, and<br />
Juan Pablo Molina, <strong>Co</strong>untry Manager for Peru and Ecuador.<br />
They all agree that international cooperation<br />
in diverse teams is what makes the<br />
difference: the variety of knowledge of<br />
consumer needs and marketing concepts<br />
provides such teams with insights and<br />
perspectives which are critical for the<br />
successful launch of new and innovative<br />
products in competitive markets.<br />
Not just contact with international<br />
colleagues but also working in other<br />
countries provides invaluable experience.<br />
For instance, Jasmin Goller, who<br />
has Pakistani and German roots, has<br />
already worked for <strong>Henkel</strong> in India. Enis<br />
Toksoez is currently working in Dubai,<br />
but has also gained experience in Russia.<br />
And <strong>Co</strong>lombian Juan Pablo Molina has<br />
been working in Peru since the beginning<br />
of <strong>2011</strong>.<br />
“By working abroad, you learn how to<br />
adjust to the mentalities, needs and<br />
demands of other people,” comments<br />
Rizvo. “This is a highly valuable skill to<br />
acquire – both for the individual personally<br />
and for the success of our global<br />
brands.”<br />
MANILA<br />
PHILIPPInES<br />
MOSCOw<br />
RUSSIA<br />
Successful in European and Asian<br />
markets: Gliss Kur Ultimate Repair and<br />
Extra Care Ultimate Repair are the result<br />
of internationally coordinated insights<br />
into consumer needs and preferences.<br />
www.schwarzkopf-retail.com.cn<br />
www.glisskur.schwarzkopf.de<br />
“ Interacting with<br />
international<br />
colleagues is an<br />
integral part of my<br />
work at <strong>Henkel</strong>.”<br />
Aida Rizvo<br />
Head of <strong>Co</strong>smetics/Toiletries Marketing<br />
for the Asia-Pacific region.
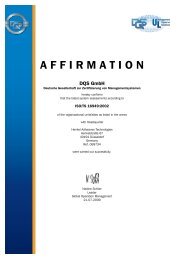
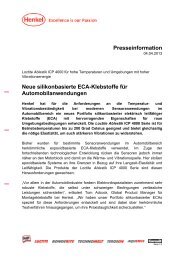
High-performance products<br />
for advanced customer needs<br />
Sales of smartphones and tablet computers are increasing rapidly. And consumer expectations for<br />
these mobile devices are rising just as fast. They expect them to become ever more portable, yet<br />
more robust and reliable. <strong>Henkel</strong>’s Adhesive Technologies business sector helps manufacturers to<br />
meet these challenges by developing materials for handheld device assembly and semiconductor<br />
packaging.<br />
ROCKY HILL<br />
CONNECTICUT, USA<br />
Andrew J. Bardon<br />
Senior Application Engineer in Technical<br />
Customer Service, North America. Far left:<br />
Karl Gabrielson and Susan Levandoski.
<strong>Henkel</strong> <strong>Annual</strong> <strong>Report</strong> <strong>2011</strong> Excellence is our Passion 19<br />
<strong>Henkel</strong> Adhesive Technologies manufactures<br />
materials for a wide range of<br />
applications – from inside the chip to<br />
the outside of the mobile device. Underfills,<br />
for example, help ensure that if<br />
your mobile device is dropped, it will<br />
still work. Electrically conductive solders<br />
are used to secure semiconductor<br />
devices to circuit boards and establish<br />
the electrical connections so that data<br />
and information can be processed and<br />
transmitted by mobile electronic devices.<br />
Structural adhesives bond the device<br />
housing, buttons, connectors and displays.<br />
“<strong>Henkel</strong> adhesives can be found<br />
in most smartphones and tablets around<br />
the globe,” says Andrew J. Bardon, Senior<br />
Application Engineer in Technical Customer<br />
Service.<br />
Customized global solutions<br />
<strong>Henkel</strong> has several development laboratories<br />
located around the globe, each set<br />
up to validate our materials in equipment<br />
similar to what our customers use.<br />
Working in our labs in Rocky Hill, <strong>Co</strong>nnecticut,<br />
USA, Bardon states: “We test<br />
our materials in the same way as our<br />
customers, which gives us great insight<br />
on how to improve our formulations.”<br />
<strong>Henkel</strong>’s adhesives are dispensed using<br />
special equipment, including an innovative<br />
Loctite 4530 HC dispensing robot.<br />
This unit was developed by <strong>Henkel</strong><br />
specifically for dispensing structural<br />
ad hesives, not only for testing but also<br />
for highvolume manufacturing at<br />
customers. Andrew Bardon continually<br />
checks that the robot is dispensing the<br />
adhesive correctly – applying an ultrafine<br />
strand with a diameter of just 0.35 millimeters<br />
at a speed of 50 millimeters per<br />
second. The Loctite 4530 HC is offered to<br />
customers together with <strong>Henkel</strong> adhesives<br />
as a complete system solution that<br />
perfectly matches their advanced needs.<br />
DÜSSELDORF<br />
GERMAnY<br />
SHANGHAI<br />
CHInA<br />
ROCKY HILL<br />
COnnECTICUT, USA<br />
The handheld devices team in Shanghai conducts processing tests to ensure top<br />
quality parts made with adhesives from <strong>Henkel</strong> Adhesive Technologies. From the left:<br />
Howard Qin Zhu, Dr. John Ouyang and Jessica Zhou.<br />
<strong>Henkel</strong> teams comprised of researchers,<br />
engineers and sales managers support<br />
manufacturers throughout the product<br />
design and production process. “We test<br />
our products on prototypes and often<br />
participate in the design of nextgeneration<br />
mobile devices,” states Bardon.<br />
“After we complete development with<br />
our customers’ design centers, we hand<br />
off the materials for production testing<br />
and implementation in Asia, where the<br />
handheld devices are generally produced<br />
on a large scale.”<br />
Rapid response, technological expertise,<br />
and timely customer interaction are<br />
essential for successful collaboration<br />
in fastpaced markets, like electronics.<br />
Thus, we have strategically located our<br />
<strong>Henkel</strong> material design and test laboratories<br />
close to customers. For example,<br />
the site in Irvine, California, USA, is<br />
closely located to customer design<br />
centers, while our Shanghai design<br />
center is close to the manufacturing<br />
hubs in China. This way, products can<br />
be engineered and tested around the<br />
clock.<br />
MANILA<br />
PHILIPPInES<br />
MOSCOw<br />
RUSSIA<br />
Speed and precision in the bonding of<br />
electronic components – with the innovative<br />
Loctite 4530 HC dispensing robot.<br />
www.henkel.com/electronics<br />
www.loctite.com<br />
“ We offer our<br />
customers tailormade<br />
solutions for<br />
nextgeneration<br />
mobile devices.”<br />
Andrew J. Bardon<br />
Senior Application Engineer in Technical<br />
Customer Service, north America.
Process excellence –<br />
through global shared services<br />
Shared service centers offer greater efficiency, transparency and global standardization in a<br />
broad range of administrative and business processes. In addition to providing services for corporate<br />
functions such as Human Resources, Purchasing and Finance, teams in <strong>Henkel</strong>’s shared<br />
service centers are now also being assigned to support processes serving our three business<br />
sectors.<br />
MANILA<br />
PHILIPPINES<br />
Catherene <strong>Co</strong>nde<br />
Staff member of the Shared Service<br />
Center in Manila, Philippines.
<strong>Henkel</strong> <strong>Annual</strong> <strong>Report</strong> <strong>2011</strong> Excellence is our Passion 21<br />
Catherene <strong>Co</strong>nde is one of around 400<br />
<strong>Henkel</strong> employees working in our Shared<br />
Service Center in Manila’s Makati financial<br />
district. The site was established in<br />
2003 as the first of three global <strong>Henkel</strong><br />
shared service centers. These centers are<br />
already managing numerous processes<br />
and providing extensive services for<br />
<strong>Henkel</strong>, from invoice accounting to<br />
capturing and updating product and<br />
customer data. The teams in Manila<br />
primarily support the regions of Asia<br />
Pacific and North America, although<br />
they also have global responsibility for<br />
certain processes.<br />
“My colleagues and I are fully committed<br />
to working toward a common objective:<br />
We aim to constantly improve our service<br />
level day by day so that we can become<br />
ever more reliable, faster and more efficient,”<br />
says <strong>Co</strong>nde. “We started out supporting<br />
the functions of Finance, Purchasing,<br />
Human Resources and Information<br />
Technology. Since <strong>2011</strong>, however, we have<br />
also been working for Market Research<br />
and supporting the management of<br />
master data for different business units.<br />
It’s an exciting development.”<br />
Faster and more efficient<br />
Around the world there are about 1,000<br />
employees – located in Manila (Philippines),<br />
Bratislava (Slovakia) and Mexico<br />
City (Mexico) – making an important<br />
contribution to the steady improvement<br />
in efficiency at <strong>Henkel</strong>.<br />
The three shared service centers perform<br />
a number of different tasks which can be<br />
globally standardized because they do<br />
not require indepth local expertise –<br />
unlike the development of new products<br />
or marketing in specific segments and<br />
geographic areas. Each year, for example,<br />
the centers handle around 1 million invoices<br />
and make 750,000 payments,<br />
they process 44,000 purchase orders<br />
DÜSSELDORF<br />
GERMAnY<br />
SHANGHAI<br />
CHInA<br />
ROCKY HILL<br />
COnnECTICUT, USA<br />
Team meeting at the Shared Service Center in Manila: Catherene <strong>Co</strong>nde (right) with<br />
Head of SSC Barbara Elaine Kunkle and her colleague Martin Roger Daquer.<br />
and enter the details of more than<br />
10,000 new customers into their systems.<br />
Shared service centers offer a range of<br />
support activities for different organizational<br />
units – based entirely on standardized<br />
processes and IT tools. Since the<br />
establishment of these service centers,<br />
<strong>Henkel</strong> has been able to reduce its number<br />
of SAP systems. However, the fewer<br />
systems we now have are more wideranging<br />
and integrated, which in turn<br />
promotes the further standardization<br />
and optimization of our processes.<br />
“Within the shared service centers, we<br />
see ourselves as a global process network<br />
working for <strong>Henkel</strong>’s overall benefit. In<br />
this role we not only exchange expertise<br />
across the SSC organization but also work<br />
very closely with the local administrative<br />
units,” <strong>Co</strong>nde explains. “Previously, many<br />
similar – if not identical – activities needed<br />
to be carried out by different colleagues<br />
at various locations, each using their own<br />
systems and processes. We help to ensure<br />
that such processes are clearly defined so<br />
that they can then be executed by our<br />
specialist teams on an integrated basis,<br />
faster and more costefficient. And for our<br />
colleagues in the markets, this ultimately<br />
means more time dedicated to further<br />
strengthening customer relationships.”<br />
MANILA<br />
PHILIPPInES<br />
MOSCOw<br />
RUSSIA<br />
Established in <strong>2011</strong>, the Shared Service<br />
Center in Mexico City has about 100<br />
employees supporting financial processes<br />
aligned to the Latin America<br />
region.<br />
“ To become<br />
consistently more<br />
reliable, faster<br />
and more cost<br />
efficient – that’s<br />
our aim.”<br />
Catherene <strong>Co</strong>nde<br />
Staff member of the Manila Shared<br />
Service Center in the Philippines.
Employee development –<br />
challenging and rewarding talents<br />
In a highly competitive environment, a strong commitment to high performance is vital for <strong>Henkel</strong>’s<br />
success. By applying globally uniform talent management and development processes, and a compensation<br />
system based on our “Development Round Table” meetings, we ensure that our managerial staff<br />
of about 9,000 receive clear and differentiated feedback, as well as recognition for outperformance.<br />
MOSCOw<br />
RUSSIA<br />
Dr. Zuzana Schütz-Halkova<br />
Vice President Human Resources for Central and Eastern<br />
Europe, with Ildar Akbaev, Head of General Industry in the<br />
Adhesive Technologies business sector, discussing the<br />
development of his team.
<strong>Henkel</strong> <strong>Annual</strong> <strong>Report</strong> <strong>2011</strong> Excellence is our Passion 23<br />
As VP Human Resources for Central<br />
and Eastern Europe, Dr. Zuzana Schütz<br />
Halkova consults with our toplevel<br />
managers in the region during their<br />
“Development Round Tables” (DRTs).<br />
In the course of these highly interactive<br />
annual meetings, line managers discuss<br />
the performance, the potential, and<br />
the career opportunities and related<br />
development requirements of their<br />
employees.<br />
“Each year, we hold about 50 DRT<br />
meetings covering the entire Central<br />
and Eastern Europe region. These are<br />
our forum for discussing the performance<br />
of our managers within their<br />
spheres of responsibility, and also<br />
possible areas where we can further<br />
support their development,” explains<br />
SchützHalkova. The employees concerned<br />
subsequently receive comprehensive<br />
feedback from their line managers<br />
in an appraisal meeting. The two<br />
participants then agree on the individual<br />
development measures required. “I’m<br />
particularly proud of the fact that these<br />
annual DRT meetings provide all our<br />
managers around the world with the<br />
same career development opportunities,”<br />
says SchützHalkova. “My HR colleagues<br />
conduct the process in exactly<br />
the same way in all the countries and<br />
regions in which <strong>Henkel</strong> operates.”<br />
Enhancing our performance-based<br />
feedback culture<br />
The measures derived from the DRT<br />
meetings help to identify, further develop<br />
and effectively deploy talent within<br />
<strong>Henkel</strong>. In the Central and Eastern Europe<br />
region (CEE), for example, more than<br />
160 employees were identified for assignment<br />
to international postings in <strong>2011</strong>. As<br />
well as organizing numerous specialist<br />
and management seminars – often using<br />
our “CEE Academy” platform – we also<br />
DÜSSELDORF<br />
GERMAnY<br />
SHANGHAI<br />
CHInA<br />
ROCKY HILL<br />
COnnECTICUT, USA<br />
A meeting of the <strong>Co</strong>smetics/Toiletries team for Central and Eastern Europe:<br />
Dr. Zuzana Schütz-Halkova (second from the right) advises Vice President <strong>Co</strong>smetics/<br />
Toiletries Georg Höbenstreit (fourth from the right) and his team at a DRT that she<br />
and Monika Rauscher (standing) organized.<br />
supported the advancement of around<br />
100 managerial staff in our eight development<br />
centers.<br />
An important aspect of the DRT system<br />
is the identification of performance<br />
differentials among our employees<br />
through indepth discussion and evaluation<br />
by a group of supervising managers.<br />
Based on this differentiated assessment,<br />
we are able to offer aboveaverage<br />
rewards for excellent performance.<br />
“At <strong>Henkel</strong>, we have established a culture<br />
that promotes open feedback combined<br />
with a strong focus on performance,”<br />
explains SchützHalkova. And the<br />
example set by managers is important<br />
for further extending its reach. For<br />
management means not only assembling<br />
and further developing good teams, it<br />
also means dealing with all employees<br />
fairly on the basis of mutual trust and<br />
respect. It is essential that we encourage<br />
each member of the <strong>Henkel</strong> team to take<br />
full responsibility for their contribution,<br />
clearly identifying areas for improvement<br />
and appropriately rewarding success.<br />
MANILA<br />
PHILIPPInES<br />
MOSCOw<br />
RUSSIA<br />
“ Our aim is to<br />
properly assess<br />
performance,<br />
identify potential<br />
and provide the<br />
best development.”<br />
Dr. Zuzana Schütz-Halkova<br />
Vice President HR for <strong>Henkel</strong><br />
Central and Eastern Europe
24 Shares and bonds<br />
<strong>Henkel</strong> <strong>Annual</strong> <strong>Report</strong> <strong>2011</strong><br />
Shares and bonds<br />
• <strong>Henkel</strong> shares track higher than overall market<br />
• <strong>Henkel</strong> preferred share’s DAX 30 weighting increased<br />
• <strong>Henkel</strong>’s position in leading sustainability indices con rmed<br />
• International, widely diversi ed shareholder structure<br />
Key data on <strong>Henkel</strong> shares 2007 to <strong>2011</strong><br />
in euros 2007 ¹ 2008 2009 2010 <strong>2011</strong><br />
Earnings per share<br />
Ordinary share 2.12 2.81 1.38 2.57 2.88<br />
Preferred share 2.14 2.83 1.40 2.59 2.90<br />
Share price at year-end ²<br />
Ordinary share 34.95 18.75 31.15 38.62 37.40<br />
Preferred share 38.43 22.59 36.43 46.54 44.59<br />
High for the year ²<br />
Ordinary share 37.50 34.95 31.60 40.30 41.10<br />
Preferred share 41.60 38.43 36.87 48.40 49.81<br />
Low for the year ²<br />
Ordinary share 29.96 16.68 16.19 30.31 30.78<br />
Preferred share 33.70 19.30 17.84 35.21 36.90<br />
Dividends<br />
Ordinary share 0.51 0.51 0.51 0.70 0.78 ³<br />
Preferred share 0.53 0.53 0.53 0.72 0.80 ³<br />
Market capitalization ² in bn euros 15.9 8.9 14.6 18.3 17.6<br />
Ordinary share in bn euros 9.1 4.9 8.1 10.0 9.7<br />
Preferred share in bn euros 6.8 4.0 6.5 8.3 7.9<br />
¹ <strong>Co</strong>mparable based on share split (1:3) of June 18, 2007.<br />
² Closing share prices, Xetra trading system.<br />
³ Proposal to shareholders for <strong>Annual</strong> General Meeting on April 16, 2012.<br />
<strong>Henkel</strong> share performance versus market<br />
January through December <strong>2011</strong><br />
in euros<br />
50 50<br />
40<br />
30<br />
20<br />
10<br />
Dec. 31, 2010:<br />
46.54 euros<br />
Dec. 30, <strong>2011</strong>:<br />
44.59 euros<br />
<strong>Henkel</strong> share performance versus market<br />
2002 through <strong>2011</strong><br />
in euros<br />
0 0<br />
Jan. Feb. Mar. Apr. May June July Aug. Sept. Oct. Nov. Dec. 2002 2003 2004 2005 2006 2007 2008 2009 2010 <strong>2011</strong><br />
<strong>Henkel</strong> preferred share <strong>Henkel</strong> preferred share<br />
<strong>Henkel</strong> ordinary share (indexed) <strong>Henkel</strong> ordinary share (indexed)<br />
DJ Euro Stoxx <strong>Co</strong>nsumer Goods (indexed) DJ Euro Stoxx <strong>Co</strong>nsumer Goods (indexed)<br />
DAX (indexed) DAX (indexed)<br />
40<br />
30<br />
20<br />
10<br />
Dec. 28, 2001:<br />
21.17 euros<br />
Dec. 30, <strong>2011</strong>:<br />
44.59 euros
<strong>Henkel</strong> <strong>Annual</strong> <strong>Report</strong> <strong>2011</strong> Shares and bonds<br />
25<br />
Overall, the price of <strong>Henkel</strong> shares decreased<br />
slightly in the course of <strong>2011</strong>. In the wake of the<br />
growing severity of the debt crisis and the associated<br />
recession fears, the DAX experienced a<br />
decline of 14.7 percent compared to the closing<br />
figure for the preceding year. The industry benchmark<br />
in the form of the Dow Jones Euro Stoxx<br />
<strong>Co</strong>nsumer Goods Index decreased 9.6 percent.<br />
Within this market environment, the price of<br />
<strong>Henkel</strong> preferred shares fell to 44.59 euros, closing<br />
the year 4.2 percent below the prior-year level.<br />
Our ordinary share prices likewise declined slightly,<br />
ending the year 3.1 percent down at 37.40 euros.<br />
This means our shares withstood the general<br />
decline better than both the DAX and the shares<br />
representing the consumer goods sector.<br />
In the course of the year, <strong>Henkel</strong> shares tended<br />
to track the overall market, although generally<br />
performing somewhat better. In the first quarter,<br />
a period characterized by worldwide political<br />
upheavals, natural disasters and a mixed set of<br />
share price developments on the stock exchanges,<br />
<strong>Henkel</strong> share prices declined. In the more positive<br />
market environment of the second quarter,<br />
<strong>Henkel</strong>’s shares increased significantly in value,<br />
reaching historic highs in May of 49.81 euros for<br />
the preferred share and 41.10 euros for the ordinary<br />
share. In the third quarter, rendered particularly<br />
difficult by the debt crises in Europe and the USA,<br />
<strong>Henkel</strong>’s shares suffered double-digit price declines,<br />
although still tracking somewhat better<br />
than the overall market. In the fourth quarter,<br />
<strong>Henkel</strong>’s shares once again rose appreciably in<br />
value, concluding fiscal <strong>2011</strong> slightly down but<br />
substantially outperforming comparative<br />
indices.<br />
The preferred share premium versus the ordinary<br />
share in <strong>2011</strong> averaged 20.8 percent.<br />
The trading volume of preferred shares was slightly<br />
below the prior-year level. Each trading day<br />
saw an average of 0.9 million preferred shares<br />
changing hands (previous year: 1.0 million). The<br />
average volume in the case of our ordinary shares<br />
decreased to 120,000 per trading day (previous<br />
year: 130,000). Due to price movements, the mar-<br />
ket capitalization of our ordinary and preferred<br />
stock combined decreased from 18.3 billion euros<br />
to 17.6 billion euros.<br />
For long-term investors, <strong>Henkel</strong>’s shares remain<br />
an attractive investment. Shareholders who invested<br />
the equivalent of 1,000 euros when <strong>Henkel</strong>’s<br />
preferred shares were issued in 1985, and then<br />
re-invested the dividends received (before tax<br />
deduction) in the stock, would have had a portfolio<br />
value of about 13,974 euros by the end of <strong>2011</strong>.<br />
This represents an investment growth of 1,297 percent<br />
or an average yield of 10.6 percent per year.<br />
Over the same period, DAX tracking would have<br />
provided an annual yield of 6.4 percent. Over the<br />
last five and ten years, <strong>Henkel</strong> preferred shares<br />
have shown an average yield of 5.6 and 9.6 percent<br />
per year respectively, offering a significantly<br />
higher return than the DAX’s 2.7 percent and<br />
1.3 percent in the same respective periods.<br />
<strong>Henkel</strong> represented in all major indices<br />
<strong>Henkel</strong> shares are traded on the Frankfurt Stock<br />
Exchange, predominantly on the Xetra electronic<br />
trading platform. <strong>Henkel</strong> is also represented on<br />
all the other regional stock exchanges in Germany.<br />
In the USA, investors are able to acquire <strong>Henkel</strong><br />
prefer red and ordinary shares by way of stock ownership<br />
certificates obtained through the Sponsored<br />
Level I ADR (American Depositary Receipt)<br />
program. The number of ADRs representing<br />
ordinary and preferred shares outstanding at the<br />
end of the year was about 3.7 million (end of 2010:<br />
4.1 million).<br />
Share data<br />
Preferred Ordinary<br />
Security code no. 604843 604840<br />
ISIN code DE0006048432 DE0006048408<br />
Stock exch. symbol HEN3.ETR HEN.ETR<br />
Number of shares 178,162,875 259,795,875<br />
ADR data<br />
Preferred Ordinary<br />
CUSIP 42550U208 42550U109<br />
ISIN code US42550U2087 US42550U1097<br />
ADR symbol HENOY HENKY<br />
17.6 bn euros<br />
market capitalization.
26<br />
Shares and bonds<br />
Shareholder structure:<br />
Institutional investors<br />
holding <strong>Henkel</strong><br />
preferred shares<br />
24% USA<br />
23% UK<br />
17% Germany<br />
10% France<br />
18% Rest of Europe<br />
8 % Rest of world<br />
Source: Thomson Reuters.<br />
The international importance of <strong>Henkel</strong> preferred<br />
shares derives not least from their inclusion in<br />
major indices that serve as important indicators<br />
for the capital markets and as benchmarks for<br />
fund managers. Particularly noteworthy in this<br />
respect are the MSCI World, the Dow Jones Euro<br />
Stoxx, and the FTSE World Europe indices. <strong>Henkel</strong><br />
is also listed in the Dow Jones Titans 30 Personal &<br />
Household Goods Index, confirming our position<br />
as one of the 30 most important listed corporations<br />
operating in the personal and household<br />
goods sectors worldwide. And as a DAX stock,<br />
<strong>Henkel</strong> counts as one of the 30 most important<br />
listed companies in Germany.<br />
Once again our advances and achievements on<br />
the sustainable development front likewise<br />
impressed the independent experts in <strong>2011</strong>.<br />
<strong>Henkel</strong>’s position in various national and international<br />
sustainability ratings and indices was<br />
further confirmed. The Dow Jones Sustainability<br />
Index (World and Europe) listed <strong>Henkel</strong> for the<br />
fifth consecutive year as industry leader in the<br />
market sector “Nondurable Household Goods.”<br />
Our place in the FTSE4Good Ethical Index was<br />
likewise confirmed, as was our continued membership<br />
of the Ethibel Sustainability Index. In<br />
the latter, <strong>Henkel</strong> is one of just 200 corporations<br />
included from around the world. <strong>Henkel</strong> was also<br />
inducted into the Stoxx Global ESG Leaders index<br />
family newly launched in <strong>2011</strong> by Deutsche Börse<br />
(German Stock Exchange), and is thus listed as a<br />
“sustainable security” in the associated information<br />
portal. Since April <strong>2011</strong>, the portal has acted<br />
as a funnel combining all the sustainable securities<br />
listed for trading on the German stock exchange.<br />
As of year-end <strong>2011</strong> the market capitalization of<br />
the DAX-relevant preferred shares was 7.9 billion<br />
euros, placing <strong>Henkel</strong> 20th among DAX companies<br />
(2010: 21st). In terms of trading volumes, <strong>Henkel</strong><br />
was ranked 27th on the list (2010: 26th). Our DAX<br />
weighting rose to 1.52 percent (2010: 1.32 percent).<br />
International shareholder structure<br />
The ownership structure of our preferred shares –<br />
the significantly more liquid class of stock – shows<br />
a free float of 100 percent. A large majority of<br />
these shares are owned by institutional investors<br />
with globally distributed shareholdings.<br />
According to notices of disclosure received by the<br />
company, members of the <strong>Henkel</strong> family own<br />
a majority of the ordinary shares amounting to<br />
53.21 percent. We have received no further notices<br />
of disclosure from other shareholders indicating a<br />
shareholding in excess of 3 percent of the voting<br />
shares (noti fiable ownership).<br />
In the period up to 2007, <strong>Henkel</strong> repurchased<br />
around 7.5 million preferred shares to fund the<br />
Stock Incentive Plan operated for our senior<br />
executive personnel. As of December 31, <strong>2011</strong>,<br />
this treasury stock amounted to 3.8 million<br />
preferred shares.<br />
Employee share program<br />
Since 2001, <strong>Henkel</strong> has been operating an employee<br />
share program (ESP). For each euro invested<br />
in <strong>2011</strong> by an employee (limited to 4 percent of<br />
salary up to a maximum of 5,000 euros per year),<br />
<strong>Henkel</strong> added an additional 33 eurocents. Around<br />
11,000 employees in 54 countries purchased<br />
<strong>Henkel</strong> preferred shares under this program in<br />
<strong>2011</strong>. At year-end, some 14,500 employees held a<br />
total of around 3 million shares within the ESP,<br />
re presenting roughly 1.7 percent of total preferred<br />
shares outstanding. The vesting period<br />
for newly acquired ESP shares is three years.<br />
<strong>Henkel</strong> bonds<br />
<strong>Henkel</strong> is represented in the international bond<br />
markets by three bonds with a total nominal<br />
volume of 3.3 billion euros:<br />
Bond data<br />
<strong>Henkel</strong> <strong>Annual</strong> <strong>Report</strong> <strong>2011</strong><br />
Senior bond Senior bond Hybrid bond<br />
Due date June 10, 2013 Mar. 19, 2014 Nov. 25, 2104 1<br />
Volume<br />
Nominal<br />
1.0 bn euros 1.0 bn euros 1.3 bn euros<br />
coupon<br />
<strong>Co</strong>upon<br />
payment<br />
4.25 % 4.625 % 5.375 %<br />
date<br />
June 10 March 19 Nov. 25<br />
Listing<br />
Security<br />
Frankfurt Luxembourg Luxembourg<br />
code no. 664196 A0AD9Q A0JBUR<br />
ISIN code DE0006641962 XS0418268198 XS0234434222<br />
1 First call option for <strong>Henkel</strong> on November 25, 2015.<br />
Further detailed information regarding these bonds,<br />
current developments in their respective prices<br />
and the associated risk premium (credit margin)<br />
can be found on our website<br />
www.henkel.com/bonds
<strong>Henkel</strong> <strong>Annual</strong> <strong>Report</strong> <strong>2011</strong> Shares and bonds 27<br />
Pro-active capital market communication<br />
<strong>Henkel</strong> is covered by numerous financial analysts,<br />
primarily in the UK, Germany and the USA.<br />
Over 35 equity and debt analysts regularly publish<br />
reports and commentaries on the performance<br />
of the company.<br />
<strong>Henkel</strong> places great importance on meaningful<br />
dialogue with both investors and analysts. In <strong>2011</strong>,<br />
institutional investors and financial analysts<br />
were afforded the opportunity to talk directly with<br />
our top management in more than 25 capital<br />
market conferences and road shows held in Europe<br />
and North America.<br />
The two highlights of the year were our Analyst<br />
and Investor <strong>Co</strong>nference held in Düsseldorf on<br />
February 24, <strong>2011</strong>, and our Investor Day for the<br />
<strong>Co</strong>smetics/Toiletries business sector, which took<br />
place on May 17, <strong>2011</strong>. At this latter conference<br />
the <strong>Co</strong>smetics/Toiletries management team presented<br />
the strategy and new developments of the<br />
business sector to some 50 investors and analysts<br />
from around the world. Outside such events,<br />
we conducted numerous telephone conferences<br />
and one-on-one meetings.<br />
Retail investors are able to receive all relevant<br />
information through telephone enquiry or via the<br />
Investor Relations website at www.henkel.com/ir.<br />
This also serves as the portal for the live broadcast<br />
of telephone and analyst conferences, and the<br />
part-transmission of the <strong>Annual</strong> General Meeting.<br />
The <strong>AG</strong>M offers all shareholders the possibility of<br />
obtaining extensive information directly from<br />
<strong>Henkel</strong>’s management.<br />
The quality of our capital market communication<br />
was again evaluated in <strong>2011</strong> by various independent<br />
rankings. Our Investor Relations team garnered<br />
a number of top positions in various comparisons<br />
with European corporations in the Home & Personal<br />
Care category, as well as with other DAX<br />
companies – including second place in the Household<br />
Products & Personal Care sector in the<br />
ThomsonExtel Pan-European Awards ranking.<br />
And in the Institutional Investor ranking, <strong>Henkel</strong><br />
was voted by financial analysts as having the best<br />
Investor Relations Team in the European Household<br />
& Personal Care Products sector. Following<br />
a study by the research institute “Media Tenor,”<br />
<strong>Henkel</strong> took first place for the best media image<br />
of all DAX 30 corporations in <strong>2011</strong>.<br />
The quality of our reporting of our non-financial<br />
performance indicators (environmental, social<br />
and governance [ESG] issues) was once again<br />
acknowledged by financial market participants.<br />
In the study “Entrepreneurial Responsi bility in<br />
the Age of Transparency” carried out by the<br />
auditing and business consultancy company<br />
Pricewaterhouse<strong>Co</strong>opers (PwC), the <strong>Henkel</strong><br />
Sustainability <strong>Report</strong> received the best overall<br />
score of 95 percent. The UK agency Two Tomorrows<br />
placed <strong>Henkel</strong> in the second highest investment<br />
category (AA) in recognition of our transparent<br />
reporting. In a sustainability rating<br />
published in March <strong>2011</strong> by the German business<br />
weekly “WirtschaftsWoche” in tandem with<br />
“Börse Online,” <strong>Henkel</strong> was voted sector leader<br />
and best German company out of a total of<br />
around 3,000 entities analyzed. And as a participant<br />
in the Carbon Disclosure Project Germany,<br />
<strong>Henkel</strong> was once again listed in the Carbon<br />
Disclosure Leadership Index.<br />
You will find a financial calendar with all our<br />
earnings release and announcement dates on<br />
the inside back cover of this <strong>Annual</strong> <strong>Report</strong>.<br />
Analyst recommendations<br />
41% Buy<br />
44% Hold<br />
15 % Sell<br />
At December 31, <strong>2011</strong>.<br />
Basis: 32 equity analysts.
28 Group management report<br />
Subindex<br />
<strong>Henkel</strong> <strong>Annual</strong> <strong>Report</strong> <strong>2011</strong><br />
Group management report<br />
Subindex<br />
29 <strong>Co</strong>rporate governance<br />
29 I. <strong>Co</strong>rporate governance/<br />
<strong>Co</strong>rporate management report<br />
36 II. Remuneration report<br />
45 Operational activities<br />
45 Overview<br />
45 Organization and business sectors<br />
45 Strategy and financial targets for 2012<br />
46 Strategic priorities and progress in fiscal <strong>2011</strong><br />
47 Progress in fiscal <strong>2011</strong><br />
47 Financial targets 2012<br />
48 Sustainability strategy 2030<br />
51 Value-based management and control system<br />
52 EVA ® and ROCE<br />
53 Statutory and regulatory situation<br />
53 Business performance<br />
53 World economy<br />
55 Management Board review of business<br />
performance<br />
56 Sales and profits<br />
58 <strong>Co</strong>mparison between actual business<br />
performance and guidance<br />
58 Expense items<br />
59 Other operating income and charges<br />
59 Financial result<br />
59 Net income<br />
59 Dividends<br />
59 Earnings per share (EPS)<br />
60 Net assets and financial position<br />
60 Acquisitions and divestments<br />
60 Capital expenditures<br />
61 Net assets<br />
62 Financing and capital management<br />
63 Financial position<br />
63 Key financial ratios<br />
64 Employees<br />
67 Procurement<br />
68 Production<br />
70 Research and development<br />
74 Marketing and distribution<br />
76 Business sector performance<br />
76 Laundry & Home Care<br />
80 <strong>Co</strong>smetics/Toiletries<br />
84 Adhesive Technologies<br />
88 Risk report<br />
88 Risks and opportunities<br />
88 Risk management system<br />
89 Major risk categories<br />
93 Overall risk – Management Board appraisal<br />
93 Forecast<br />
93 Macroeconomic development<br />
93 Sector development<br />
94 Opportunities: Emerging markets and<br />
innovative products with plenty of potential<br />
94 Outlook for the <strong>Henkel</strong> Group in 2012<br />
95 Post-2012 outlook<br />
95 Subsequent events
<strong>Henkel</strong> <strong>Annual</strong> <strong>Report</strong> <strong>2011</strong> Group management report<br />
<strong>Co</strong>rporate governance<br />
29<br />
<strong>Co</strong>rporate governance<br />
at <strong>Henkel</strong> <strong>AG</strong> & <strong>Co</strong>. <strong>KGaA</strong><br />
The Management Board, the Shareholders’ <strong>Co</strong>mmittee<br />
and the Supervisory Board are committed<br />
to ensuring that the management and stewardship<br />
of the corporation are conducted in a responsible<br />
and transparent manner aligned to achieving<br />
a long-term increase in shareholder value. In<br />
keeping with this undertaking, they have pledged<br />
themselves to the following three principles:<br />
• Value creation as the foundation of our<br />
management approach.<br />
• Sustainability achieved through the application<br />
of socially responsible management principles.<br />
• Transparency supported by an active and<br />
open information policy.<br />
I. <strong>Co</strong>rporate governance / <strong>Co</strong>rporate management<br />
report<br />
The German <strong>Co</strong>rporate Governance <strong>Co</strong>de (Kodex)<br />
was introduced in order to promote confidence<br />
in the management and oversight of listed German<br />
corporations. It sets out the regulations and also<br />
the internationally and nationally recognized<br />
standards of responsible corporate management<br />
as applicable to the situation in Germany. The<br />
Kodex, which is aligned to the statutory provisions<br />
applicable to a German joint stock corporation<br />
(“Aktiengesellschaft” [<strong>AG</strong>]), is applied analogously<br />
by <strong>Henkel</strong> <strong>AG</strong> & <strong>Co</strong>. <strong>KGaA</strong>. For a better understanding<br />
of the situation at <strong>Henkel</strong>, this report<br />
describes the principles underlying the management<br />
and control structure of the corporation<br />
together with the special features, distinguishing<br />
us from an <strong>AG</strong>, that derive from our specific legal<br />
form and our Articles of Association. Also explained<br />
in the following are the main rights granted to shareholders<br />
of <strong>Henkel</strong> <strong>AG</strong> & <strong>Co</strong>. <strong>KGaA</strong>. The report takes<br />
into account the recommen dations of the Kodex<br />
and contains all the disclosures and explanations<br />
required according to Sections 289 (4), 289a and<br />
315 (4) of the German <strong>Co</strong>mmercial <strong>Co</strong>de [HGB].<br />
Legal form / Special statutory features of<br />
<strong>Henkel</strong> <strong>AG</strong> & <strong>Co</strong>. <strong>KGaA</strong><br />
<strong>Henkel</strong> is a “Kommanditgesellschaft auf Aktien”<br />
(<strong>KGaA</strong>). A <strong>KGaA</strong> is a company with its own legal<br />
personality (i.e. it is a legal entity) in which at<br />
least one partner assumes unlimited liability in<br />
respect of the company’s creditors (personally<br />
liable partner). The other partners participate in<br />
the capital stock, which is split into shares, and<br />
their liability is limited by these shares; they are<br />
thus not liable for the company’s debts (limited<br />
partners per Section 278 (1) German Stock <strong>Co</strong>rporation<br />
Act [AktG]).<br />
• In terms of its legal structure, a <strong>KGaA</strong> is a<br />
mixture of a joint stock corporation (<strong>AG</strong>) and a<br />
limited partnership (KG), with the bias toward<br />
stock corporation law. The differences with<br />
respect to an <strong>AG</strong> are essentially as follows: The<br />
duties of the executive board of an <strong>AG</strong> are performed<br />
at <strong>Henkel</strong> <strong>AG</strong> & <strong>Co</strong>. <strong>KGaA</strong> by <strong>Henkel</strong><br />
Management <strong>AG</strong> – acting through its Management<br />
Board – as the sole Personally Liable<br />
Partner (Sections 278 (2) and 283 AktG in conjunction<br />
with Article 11 of our Articles of Association).<br />
• The rights and duties of the supervisory board<br />
of a <strong>KGaA</strong> are more limited compared to those<br />
of the supervisory board of an <strong>AG</strong>. In particular,<br />
the supervisory board is not authorized to<br />
appoint personally liable partners, to preside<br />
over the associated contractual arrangements,<br />
to impose procedural rules on the management<br />
board or to rule on business transactions. A<br />
<strong>KGaA</strong> is not required to appoint a director of<br />
labor affairs, even if, like <strong>Henkel</strong>, the company<br />
is bound to abide by Germany’s <strong>Co</strong>determination<br />
Act of 1976.<br />
• The general meeting of a <strong>KGaA</strong> essentially has<br />
the same rights as the shareholders’ meeting<br />
of an <strong>AG</strong>. In addition, it votes on the adoption<br />
of the annual financial statements of the<br />
corporation; it further formally approves the<br />
actions of the personally liable partner(s). In<br />
the case of <strong>Henkel</strong>, it also elects and approves<br />
the actions of the members of the Shareholders’<br />
<strong>Co</strong>mmittee. Resolutions passed in general<br />
meeting require the approval of the personally<br />
liable partner where they involve matters<br />
which, in the case of a partnership, require the<br />
authorization of the personally liable partners<br />
and also that of the limited partners (Section 285<br />
(2) AktG) or relate to the adoption of annual<br />
financial statements (Section 286 (1) AktG).<br />
According to our Articles of Association, in addition<br />
to the Supervisory Board, <strong>Henkel</strong> also has a<br />
standing Shareholders’ <strong>Co</strong>mmittee comprising a<br />
minimum of five and a maximum of ten members,<br />
all of whom are elected by the <strong>Annual</strong> General<br />
Meeting (<strong>AG</strong>M) (Article 27 of the Articles of Association).<br />
The Shareholders’ <strong>Co</strong>mmittee is required<br />
in particular to perform the following functions:<br />
• It acts in place of the <strong>AG</strong>M in guiding the business<br />
activities of the corporation.<br />
• It decides on the appointment and dismissal<br />
of the personally liable partner(s).<br />
www.corporategovernance-code.com
30<br />
Group management report<br />
<strong>Co</strong>rporate governance<br />
• It holds both the power of representation and<br />
executive powers over the legal relationships<br />
prevailing between the corporation and <strong>Henkel</strong><br />
Management <strong>AG</strong>, the Personally Liable Partner.<br />
• It exercises the voting rights of the corporation in<br />
the General Meeting of <strong>Henkel</strong> Management <strong>AG</strong>.<br />
• It issues rules of procedure incumbent upon<br />
<strong>Henkel</strong> Management <strong>AG</strong> (Section 278 (2) AktG) in<br />
conjunction with Sections 114 and 161 HGB and<br />
Articles 8, 9 and 26 of the Articles of Association.<br />
Capital stock denominations / Shareholder rights<br />
The capital stock of the corporation amounts<br />
to 437,958,750 euros. It is divided into a total of<br />
437,958,750 bearer shares of no par value, of<br />
which 259,795,875 are ordinary bearer shares<br />
(nominal proportion of capital stock: 259,795,875<br />
euros or 59.3 percent) and 178,162,875 are preferred<br />
bearer shares (nominal proportion of capital<br />
stock: 178,162,875 euros or 40.7 percent). All the<br />
shares are fully paid up.<br />
Each ordinary share grants to its holder one vote.<br />
The preferred shares accord to their holders all<br />
shareholder rights apart from the right to vote.<br />
Unless otherwise resolved in General Meeting,<br />
the profit attributable to shareholders of <strong>Henkel</strong><br />
<strong>AG</strong> & <strong>Co</strong>. <strong>KGaA</strong> is distributed as follows: First,<br />
the holders of preferred shares receive a preferred<br />
dividend in the amount of 0.04 euros per preferred<br />
share. The holders of ordinary shares then<br />
receive a preliminary dividend of 0.02 euros per<br />
ordinary share, with the residual amount being<br />
distributed to the holders of ordinary and<br />
preferred shares in accordance with the proportion<br />
of the capital stock attributable to them<br />
(Art. 35 (2) of the Articles of Association). If the<br />
preferred dividend is not paid out either in part<br />
or in whole in a year, and the arrears are not paid<br />
off in the following year together with the full<br />
preferred share dividend for that second year, the<br />
holders of preferred shares are accorded voting<br />
rights until such arrears are paid (Section 140 (2)<br />
AktG). Cancellation or limitation of this preferred<br />
dividend requires the consent of the holders of<br />
preferred shares (Section 141 (1) AktG).<br />
There are no shares bearing cumulative/plural<br />
voting rights, preferential voting rights or maximum<br />
voting rights (voting restrictions).<br />
The shareholders exercise their rights in General<br />
Meeting as per the relevant statutory provisions<br />
and the Articles of Association of <strong>Henkel</strong> <strong>AG</strong> &<br />
<strong>Co</strong>. <strong>KGaA</strong>. In particular, they may exercise their<br />
<strong>Henkel</strong> <strong>Annual</strong> <strong>Report</strong> <strong>2011</strong><br />
right to vote – either personally, by postal vote,<br />
through a legal representative or through a proxyholder<br />
nominated by the company – and are also<br />
entitled to speak on agenda items, ask relevant<br />
questions and propose reasonable motions.<br />
Unless otherwise required by mandatory provisions<br />
of statute or the Articles of Association, the<br />
resolutions of the General Meeting are adopted<br />
by simple majority of the votes cast and, inasmuch<br />
as a majority of shares is required by statute, by<br />
simple majority of the voting stock represented<br />
(Art. 24 of the Articles of Association). This also<br />
applies to changes in the Articles of Association.<br />
However, modifications to the object of the<br />
company require a three-quarters’ majority<br />
(Section 179 (2) AktG).<br />
Approved capital / Share buy-back<br />
According to Art. 6 (5) of the Articles of Association,<br />
there is an authorized capital limit. Acting within<br />
this limit, the Personally Liable Partner is<br />
authorized, subject to the approval of the Supervisory<br />
Board and of the Shareholders’ <strong>Co</strong>mmittee,<br />
to increase the capital stock of the corporation<br />
in one or several acts until April 18, 2015, by up to<br />
a total of 25,600,000 euros through the issue<br />
for cash of new preferred shares with no voting<br />
rights. All shareholders are essentially assigned<br />
pre-emptive rights. However, these may be<br />
set aside in three cases: (1) in order to dispose<br />
of fractional amounts; (2) to grant to creditors/<br />
holders of bonds with warrants or conversion<br />
rights or a conversion obligation issued by the<br />
corporation or one of the companies dependent<br />
upon it, pre-emptive rights corresponding to<br />
those that would accrue to such creditors/bondholders<br />
following exercise of their warrant or<br />
conversion rights or on fulfillment of their conversion<br />
obligations; or (3) if the issue price of the<br />
new shares is not significantly below the quoted<br />
market price at the time of issue price fixing.<br />
In addition, the Personally Liable Partner is<br />
authorized to purchase ordinary and/or preferred<br />
shares of the corporation at any time until April<br />
18, 2015, up to a maximum nominal proportion of<br />
the capital stock of 10 percent. This authorization<br />
can be exercised for any legal purpose. To the<br />
exclusion of the pre-emptive rights of existing<br />
shareholders, treasury shares may, in particular,<br />
be transferred to third parties for the purpose<br />
of acquiring entities or participating interests<br />
in entities. Treasury shares may also be sold<br />
for cash, provided that the purchase price is not
<strong>Henkel</strong> <strong>Annual</strong> <strong>Report</strong> <strong>2011</strong> Group management report<br />
<strong>Co</strong>rporate governance<br />
31<br />
materially below the quoted market price at the<br />
time of share disposal. The shares may likewise<br />
be used to satisfy warrants or conversion rights<br />
granted by the corporation. The Personally Liable<br />
Partner has also been authorized – with the<br />
approval of the Shareholders’ <strong>Co</strong>mmittee and of<br />
the Supervisory Board – to cancel treasury stock<br />
without further resolution in General Meeting<br />
being required.<br />
Inasmuch as shares may be issued or used to the<br />
exclusion of pre-emptive rights, the proportion<br />
of capital stock represented by such shares shall<br />
not exceed 10 percent.<br />
Major shareholders<br />
According to notifications received by the company<br />
on October 21, 2010, a total of 53.21 percent<br />
of the voting rights are held by parties to the<br />
<strong>Henkel</strong> family’s share-pooling agreement. This<br />
agreement was concluded between members<br />
of the families of the descendants of company<br />
founder Fritz <strong>Henkel</strong>; it contains restrictions<br />
with respect to transfers of the ordinary shares<br />
covered (Art. 7 of the Articles of Association).<br />
Interaction between Management Board, Supervisory<br />
Board, Shareholders’ <strong>Co</strong>mmittee and other<br />
committees<br />
The Management Board, the Shareholders’ <strong>Co</strong>mmittee<br />
and the Supervisory Board are committed<br />
to ensuring that the management and stewardship<br />
of the corporation are conducted in a responsible<br />
and transparent manner aligned to achieving<br />
a long-term increase in shareholder value. In<br />
keeping with this undertaking, they have pledged<br />
themselves to the following three principles:<br />
The members of the Management Board are responsible<br />
for managing <strong>Henkel</strong>’s business operations<br />
in their entirety. To this end, the individual<br />
Management Board members are assigned – in<br />
accordance with a business distribution plan –<br />
areas of competence for which they bear lead<br />
responsibility. The members of the Management<br />
Board cooperate closely as colleagues, informing<br />
one another of all major occurrences within their<br />
areas of competence and conferring on all actions<br />
that may affect several such areas. Further<br />
details relating to cooperation and the division<br />
of operational responsibilities are regulated by<br />
rules of procedure issued by the Supervisory<br />
Board of <strong>Henkel</strong> Management <strong>AG</strong>. The Management<br />
Board reaches its decisions by a simple ma-<br />
jority of the votes cast. In the event of a tie, the<br />
Chairperson has the casting vote.<br />
The Management Board agrees with the Shareholders’<br />
<strong>Co</strong>mmittee the strategic alignment of<br />
the corporation and discusses with the Shareholders’<br />
<strong>Co</strong>mmittee at regular intervals the status<br />
of implementation of said strategy.<br />
In keeping with good corporate management<br />
practice, the Management Board informs the Supervisory<br />
Board and the Shareholders’ <strong>Co</strong>mmittee<br />
regularly, and in a timely and comprehensive<br />
fashion, of all issues of relevance to the corporation<br />
concerning business policy, corporate planning,<br />
profitability, the business development of the<br />
corporation and of major Group companies, and<br />
also matters relating to risk exposure and risk<br />
management.<br />
For transactions of fundamental significance,<br />
the Shareholders’ <strong>Co</strong>mmittee has established<br />
a right of veto in the procedural rules governing<br />
the actions of <strong>Henkel</strong> Management <strong>AG</strong> in its<br />
function as sole Personally Liable Partner (Art. 26<br />
of the Articles of Association). This covers, in<br />
particular, decisions or measures that materially<br />
change the net assets, financial position or results<br />
of operations of the corporation. The Management<br />
Board complies with these rights of<br />
consent of the Shareholders’ <strong>Co</strong>mmittee and also<br />
duly submits to the spheres of authority of the<br />
corporation’s General Meeting.<br />
The Shareholders’ <strong>Co</strong>mmittee passes its resolutions<br />
on the basis of a simple majority of the votes cast.<br />
It has established a Finance Subcommittee and a<br />
Human Resources Subcommittee, each of which<br />
comprises five members of the Shareholders’<br />
<strong>Co</strong>mmittee. The Finance Subcommittee deals<br />
principally with the financial matters, accounting<br />
issues including external auditing, taxation<br />
planning and accounting policies, and the internal<br />
auditing and risk management of the corporation.<br />
It also carries out the necessary preparatory work<br />
for decisions to be taken by the Shareholders’<br />
<strong>Co</strong>mmittee in such affairs. The Human Resources<br />
Subcommittee principally discusses personnel<br />
matters relating to the members of the Management<br />
Board, human resources strategy, and<br />
remuneration. It is further concerned with succession<br />
planning and identifying management<br />
potential within the individual business sectors,<br />
taking into account relevant diversity aspects.<br />
53.21%<br />
of voting rights held by<br />
members of the <strong>Henkel</strong><br />
share-pooling agreement.
32<br />
Group management report<br />
<strong>Co</strong>rporate governance<br />
It is the responsibility of the Supervisory Board<br />
to advise and supervise the Management Board<br />
in the performance of its business management<br />
duties. The Supervisory Board also reviews the<br />
annual financial statements of <strong>Henkel</strong> <strong>AG</strong> & <strong>Co</strong>.<br />
<strong>KGaA</strong> and the consolidated financial statements,<br />
taking into account the audit reports submitted<br />
by the auditor. It further submits to the <strong>Annual</strong><br />
General Meeting a proposal indicating its recommendation<br />
for the appointment of the external<br />
auditor.<br />
As a rule, the Supervisory Board meets four times<br />
per year. It passes resolutions by a simple majority<br />
of votes cast. In the event of a tie, the Chairperson<br />
has the casting vote. The Supervisory Board has<br />
established an Audit <strong>Co</strong>mmittee and a Nominations<br />
<strong>Co</strong>mmittee. The Audit <strong>Co</strong>mmittee is made up of<br />
three shareholder- and three employee-representative<br />
members of the Supervisory Board, each<br />
elected by the Supervisory Board based on proposals<br />
of their fellow shareholder or fellow employee<br />
representatives on the Supervisory Board. The<br />
Chairperson of the Audit <strong>Co</strong>mmittee is elected by<br />
the shareholder representative members on the<br />
Supervisory Board. It is a statutory requirement<br />
that the Audit <strong>Co</strong>mmittee includes an independent<br />
member of the Supervisory Board with expertise<br />
in the fields of accounting and auditing. The Chairperson<br />
of the Audit <strong>Co</strong>mmittee, Dr. Bernhard<br />
Walter, who is not the Chairperson of the Supervisory<br />
Board or a former member of the Management<br />
Board, satisfies these requirements. The<br />
Audit <strong>Co</strong>mmittee, which generally meets four<br />
times a year, prepares the proceedings and resolutions<br />
of the Supervisory Board relating to the<br />
adoption of the annual financial statements and<br />
the consolidated financial statements, and also<br />
the auditor appointment proposal to be made<br />
to the <strong>Annual</strong> General Meeting. It issues audit<br />
mandates to the auditor and defines the focal<br />
areas of the audit or review, as well as dealing with<br />
questions of audit fee and other advisory services<br />
provided by the auditor. It monitors the independence<br />
and qualifications of the auditor, requiring<br />
the latter to submit a declaration of independence<br />
which it then evaluates. The Audit <strong>Co</strong>mmittee<br />
monitors the accounting process and assesses the<br />
effectiveness of the internal control system, the<br />
risk management system and the internal auditing<br />
and review system, as well as being involved in<br />
compliance issues. It also discusses with the<br />
Management Board, with the external auditor in<br />
attendance, the quarterly reports and the financial<br />
report for the half-year prior to their publication.<br />
<strong>Henkel</strong> <strong>Annual</strong> <strong>Report</strong> <strong>2011</strong><br />
The Nominations <strong>Co</strong>mmittee comprises the<br />
Chairperson of the Supervisory Board and two<br />
further shareholder representatives elected by the<br />
shareholder representatives on the Supervisory<br />
Board; the Chairperson of the Supervisory Board is<br />
also Chairperson of the Nominations <strong>Co</strong>mmittee.<br />
The Nominations <strong>Co</strong>mmittee prepares the proposals<br />
to be submitted by the Supervisory Board<br />
to the <strong>Annual</strong> General Meeting for the election of<br />
members to the Supervisory Board (shareholder<br />
representatives).<br />
At regular intervals, the Supervisory Board and<br />
the Shareholders’ <strong>Co</strong>mmittee hold an internal<br />
review to determine the efficiency with which<br />
they and their committees/subcommittees carry<br />
out their duties. This self-assessment is performed<br />
on the basis of an extensive checklist, whereupon<br />
points relating to corporate governance and improvement<br />
opportunities are also discussed.<br />
Pursuant to the German <strong>Co</strong>rporate Governance<br />
<strong>Co</strong>de (Kodex), conflicts of interest must be disclosed<br />
in an appropriate manner to the Supervisory<br />
Board or Shareholders’ <strong>Co</strong>mmittee, particularly<br />
those that may arise as the result of a<br />
consultancy or committee function performed in<br />
the service of customers, suppliers, lenders or<br />
other business partners. Members encountering<br />
material conflicts of interest that are more than<br />
just temporary are required to resign their mandate.<br />
Some members of the Supervisory Board and of<br />
the Shareholders’ <strong>Co</strong>mmittee are or were in past<br />
years holders of senior managerial positions<br />
in other companies. Inasmuch as <strong>Henkel</strong> pursues<br />
business activities with these companies, the<br />
same arm’s length principles apply as those<br />
applicable to transactions with and between unrelated<br />
third parties.<br />
For more details on the composition of the Management<br />
Board, the Supervisory Board and the<br />
Shareholders’ <strong>Co</strong>mmittee, the committees established<br />
within the Supervisory Board and the<br />
subcommittees of the Shareholders’ <strong>Co</strong>mmittee,<br />
please refer to pages 156 to 159. Details of<br />
compensation can be found in the remuneration<br />
report on pages 36 to 44.<br />
Objectives regarding Supervisory Board composition<br />
Taking into account the specific situation of the<br />
corporation, in December 2010 the Supervisory<br />
Board passed a resolution detailing the objectives<br />
for its composition as detailed below. These
<strong>Henkel</strong> <strong>Annual</strong> <strong>Report</strong> <strong>2011</strong> Group management report<br />
<strong>Co</strong>rporate governance<br />
33<br />
objectives, to be reviewed at regular intervals,<br />
will be taken into account by the Supervisory Board<br />
when proposing election candidates to the <strong>Annual</strong><br />
General Meeting for all re-electable and ad-hoc<br />
replacement Supervisory Board positions:<br />
• The members of the Supervisory Board should,<br />
generally speaking, offer the knowledge, skills<br />
and relevant experience necessary in order<br />
to properly perform their duties. Particularly<br />
required are experience and expertise in one<br />
or several of the fields of corporate management,<br />
book-keeping and accountancy, financial<br />
control/risk management, corporate governance/compliance,<br />
research and development,<br />
production/technology, and marketing/sales/<br />
distribution, as is knowledge of the industrial<br />
or consumer business in the primary markets<br />
in which <strong>Henkel</strong> is active. Members of the<br />
Supervisory Board should also have sufficient<br />
time at their disposal in order to carry out<br />
their mandate.<br />
• The international activities of the corporation<br />
should be appropriately reflected in the composition<br />
of the Supervisory Board. <strong>Co</strong>nsequently,<br />
efforts will be made to retain those current<br />
members with an international background.<br />
The mix of candidates proposed for election<br />
should also contain an appropriate number of<br />
women. Here, a proportion of 25 percent is<br />
essentially regarded as appropriate. Efforts will<br />
therefore be made to maintain or, if possible,<br />
increase this proportion for upcoming new<br />
and ad-hoc replacement elections.<br />
• In addition, the Supervisory Board should have<br />
a sufficient number of independent members.<br />
In future, therefore, the Supervisory Board is<br />
to contain not more than two former members<br />
of the Management Board, no persons who<br />
perform board or committee functions or act<br />
as consultants for major competitors, and no<br />
persons whose relationship with the corporation<br />
or members of the Management Board<br />
could give rise to conflicts of interest. Further,<br />
no persons shall be proposed for election<br />
who, at the time of the election, have already<br />
reached their 70th birthday.<br />
Objectives attainment status<br />
Generally, the Supervisory Board has at its disposal<br />
the knowledge, skills and technical abilities<br />
needed to properly and effectively perform its<br />
duties. In particular, the Supervisory Board<br />
counts among its number several members offering<br />
international business experience or other<br />
international expertise. No-one sitting on the<br />
Supervisory Board exceeds the specified maximum<br />
age.<br />
In accordance with the proposal put forward by<br />
the Executive Staff Representation <strong>Co</strong>mmittee of<br />
<strong>Henkel</strong> <strong>AG</strong> & <strong>Co</strong>. <strong>KGaA</strong>, Düsseldorf District <strong>Co</strong>urt<br />
appointed Dr. Martina Seiler as member of the<br />
Supervisory Board to replace Mr. Ulf Wentzien, who<br />
resigned from the Supervisory Board as the Representative<br />
of the Senior Staff of <strong>Henkel</strong> <strong>AG</strong> & <strong>Co</strong>.<br />
<strong>KGaA</strong> on December 31, <strong>2011</strong>. This means that<br />
currently five of the 16 members of the Supervisory<br />
Board are female, and the proportion of women<br />
on the Supervisory Board stands at around 31 percent.<br />
In keeping with the objective of, where<br />
possible in new elections, increasing the proportion<br />
of seats occupied by women, the Supervisory<br />
Board proposes to the 2012 <strong>Annual</strong> General Meeting<br />
that, for the scheduled re-election of the<br />
shareholder representatives, two women – instead<br />
of one as has previously been the case – be elected<br />
to the Supervisory Board. Subject to the proposed<br />
candidates being elected, this would increase the<br />
proportion of female representatives on the Supervisory<br />
Board to around 38 percent.<br />
Transparency / <strong>Co</strong>mmunications<br />
An active and open communication policy ensuring<br />
prompt and continuous information dissemination<br />
is a major component of the value-based<br />
management approach at <strong>Henkel</strong>. Hence shareholders,<br />
shareholder associations, participants in<br />
the capital market, financial analysts, the media<br />
and the public at large are kept informed of the<br />
current situation and major business changes<br />
relating to the <strong>Henkel</strong> Group, with all stakeholders<br />
being treated equally. All such information is<br />
also promptly made available on the internet.<br />
Up-to-the-minute information is also incorporated<br />
in the regular financial reporting undertaken<br />
by the corporation. The dates of the major recurring<br />
publications, including the dates for the<br />
press conference on the preceding fiscal year and<br />
the <strong>Annual</strong> General Meeting, are announced in<br />
our financial calendar, which is also available on<br />
the internet.<br />
The corporation’s advancements and targets in<br />
relation to the environment, safety, health and<br />
social responsibility are published annually in<br />
our Sustainability <strong>Report</strong>. Shareholders, the<br />
media and the public at large are provided with<br />
Around 31%<br />
Supervisory Board<br />
membership female.
34<br />
Group management report<br />
<strong>Co</strong>rporate governance<br />
comprehensive information through press releases<br />
and information events, while occurrences<br />
with the potential to materially affect the price of<br />
<strong>Henkel</strong> shares are communicated in the form of<br />
ad-hoc announcements.<br />
Further details relating to corporate governance can<br />
be found on our website at www.henkel.com/ir<br />
Principles of corporate management / <strong>Co</strong>mpliance<br />
The members of the Management Board conduct<br />
the corporation’s business with the care of a prudent<br />
and conscientious business director in accordance<br />
with the requirements stipulated in<br />
law, in the Articles of Association of <strong>Henkel</strong> Management<br />
<strong>AG</strong> and the Articles of Association of<br />
<strong>Henkel</strong> <strong>AG</strong> & <strong>Co</strong>. <strong>KGaA</strong>, the rules of procedure<br />
governing the actions of the Management Board,<br />
the provisions contained in the individual contracts<br />
of employment and also the compliance<br />
guidelines and resolutions adopted by and within<br />
the Management Board.<br />
<strong>Co</strong>rporate management principles which go beyond<br />
the statutory requirements are derived<br />
from our vision and our values. For our company<br />
to be successful, it is essential that we share<br />
a common approach to entrepreneurship. The<br />
company’s vision provides its management and<br />
employees worldwide with both direction and<br />
a primary objective. It reaffirms our ambition to<br />
meet the highest standards in everything we do.<br />
Our vision:<br />
• A global leader in brands and technologies.<br />
Our vision provides the foundation for building<br />
a company with a common ethic: “One <strong>Henkel</strong>.”<br />
The company’s values guide its employees in all<br />
the day-to-day decisions they make, providing<br />
a compass for their conduct and actions.<br />
Our values:<br />
• We put our customers at the center of what we do.<br />
• We value, challenge and reward our people.<br />
• We drive excellent sustainable financial performance.<br />
• We are committed to leadership in sustainability.<br />
• We build our future on our family business<br />
foundation.<br />
<strong>Henkel</strong> is committed to ensuring that all business<br />
transactions are conducted in an ethically irreproachable,<br />
legal fashion. <strong>Co</strong>nsequently, <strong>Henkel</strong><br />
<strong>Henkel</strong> <strong>Annual</strong> <strong>Report</strong> <strong>2011</strong><br />
expects all its employees not only to respect the<br />
company’s internal rules and all relevant laws,<br />
but also to avoid conflicts of interest, to protect<br />
<strong>Henkel</strong>’s assets and to respect the customs, traditions<br />
and social values of the countries and cultural<br />
environments in which the company does<br />
business. The Management Board has therefore<br />
issued a series of Group-wide codes, standards<br />
and guidelines with binding precepts. These regulatory<br />
instruments are regularly reviewed and<br />
amended as appropriate, evolving in step with<br />
the changing legal and commercial conditions<br />
that affect <strong>Henkel</strong> as a globally active corporation.<br />
Our <strong>Co</strong>de of <strong>Co</strong>nduct supports our employees in<br />
dealing with ethical and legal issues; our <strong>Co</strong>de of<br />
Teamwork and Leadership defines the approach,<br />
actions and attitudes to be adopted by management<br />
and employees in their interpersonal dealings;<br />
and the <strong>Co</strong>de of <strong>Co</strong>rporate Sustainability<br />
describes the principles that underlie our approach<br />
to sustainable, socially responsible development.<br />
These codes also enable <strong>Henkel</strong> to meet the<br />
commitments derived from the Global <strong>Co</strong>mpact<br />
of the United Nations.<br />
Ensuring compliance in the sense of obeying<br />
laws and adhering to regulations is an integral<br />
component of our business processes. <strong>Henkel</strong><br />
has established a Group-wide compliance organization<br />
with locally and regionally responsible<br />
compliance officers led by a globally responsible<br />
Chief <strong>Co</strong>mpliance Officer. The CCO manages and<br />
controls compliance-related activities undertaken<br />
at the corporate level, coordinates training courses,<br />
oversees fulfillment of both internal and external<br />
regulations, and supports the corporation in the<br />
further development and implementation of the<br />
associated standards. He is assisted in this capacity<br />
by Internal Audit, and also by a <strong>Co</strong>mpliance<br />
<strong>Co</strong>mmittee of interdisciplinary composition.<br />
The remit of the local and regional compliance<br />
officers includes organizing and overseeing the<br />
training activities and implementation measures<br />
tailored to the specific requirements of their<br />
locations. They report through the locally or<br />
regionally responsible presidents to the Chief<br />
<strong>Co</strong>mpliance Officer. The CCO and the head of<br />
Internal Audit report regularly to the Management<br />
Board and also the Audit <strong>Co</strong>mmittee of the Supervisory<br />
Board on identified compliance violations.<br />
The issue of compliance is also a permanent item<br />
in the target agreements signed by all managerial
<strong>Henkel</strong> <strong>Annual</strong> <strong>Report</strong> <strong>2011</strong> Group management report<br />
<strong>Co</strong>rporate governance<br />
35<br />
staff in the Group. Because of their seniority, it is<br />
particularly incumbent on them to set the right<br />
example for their subordinates, to effectively<br />
communicate the compliance rules and to ensure<br />
that these are obeyed through the implementation<br />
of suitable organizational measures.<br />
The procedures to be adopted in the event of<br />
complaints or suspicion of malpractice also constitute<br />
an important element of the compliance<br />
regime. In addition to our internal reporting<br />
system and complaint registration channels,<br />
employees may also, for the purpose of reporting<br />
serious violations to the CCO, anonymously use<br />
a <strong>Co</strong>mpliance Hotline operated by an external<br />
service-provider. The CCO is mandated to initiate<br />
the necessary follow-up procedures.<br />
Our corporate compliance activities are focused<br />
on the fields of safety, health and the environment,<br />
antitrust law and the fight against corruption.<br />
In our <strong>Co</strong>de of <strong>Co</strong>nduct, last revised in 2009, in<br />
the corporate guidelines based upon this, and in<br />
other publications, the Management Board clearly<br />
expresses its rejection of all contraventions of<br />
the principles of compliance, particularly antitrust<br />
violations and corruption. For <strong>Henkel</strong>, bribery<br />
and anticompetitive agreements are no way to do<br />
business. We do not tolerate such violations of<br />
the law.<br />
A further compliance-relevant area relates to<br />
capital market law. Supplementing the legal provisions,<br />
internal codes of conduct have been put<br />
in place to regulate the treatment of information<br />
that has the potential to affect share prices. The<br />
company has an Ad-hoc <strong>Co</strong>mmittee comprising<br />
representatives of various departments. In order<br />
to ensure that all insider information is handled<br />
as required by law, this reviews developments<br />
and events for their possible effect on share prices,<br />
determining the need to issue reports to the<br />
capital markets on an ad-hoc basis. There are also<br />
rules that go beyond the legal requirements, governing<br />
the behavior of the members of the Board<br />
of Management, the Supervisory Board and the<br />
Shareholders’ <strong>Co</strong>mmittee, and also employees of<br />
the corporation who, due to their function or<br />
involvement in projects, have access to insider<br />
information. An insider register is kept, listing<br />
the people involved.<br />
For further information relating to the principles<br />
guiding our corporate stewardship, please go to<br />
our website at www.henkel.com/ir<br />
Application of the German <strong>Co</strong>rporate<br />
Governance <strong>Co</strong>de<br />
Taking into account the special features arising<br />
from our legal form and Articles of Association,<br />
<strong>Henkel</strong> <strong>AG</strong> & <strong>Co</strong>. <strong>KGaA</strong> complies with the recommendations<br />
(“shall” provisions) of the German<br />
<strong>Co</strong>rporate Governance <strong>Co</strong>de (Kodex), with two<br />
exceptions: (1) The executive contracts concluded<br />
in 2008 with respect to those members of the<br />
Management Board who were appointed in conjunction<br />
with the establishment of <strong>Henkel</strong> Management<br />
<strong>AG</strong> as the Personally Liable Partner in<br />
2008 and whose mandate since that time has not<br />
yet been extended for a period of more than two<br />
years, contain no severance pay cap in the event<br />
of premature termination of their tenure as executives<br />
of the corporation without good cause or<br />
reason, i.e. severance payouts may exceed the<br />
formal maximum of two years’ emoluments.<br />
Newly concluded post-2008 executive contracts<br />
and executive contracts extended for a period of<br />
more than two years do contain a severance pay<br />
cap. (2) In order to protect the legitimate interests<br />
and private spheres of the members of the corporate<br />
management bodies who are also members<br />
of the <strong>Henkel</strong> family, their individual shareholdings<br />
are not disclosed unless required by law.<br />
The Kodex requires disclosure of shareholdings<br />
upward of 1 percent.<br />
<strong>Henkel</strong> also complies with all the suggestions<br />
(“may/should” provisions) of the Kodex in keeping<br />
with our legal form and the special statutory<br />
features anchored in our Articles of Association.<br />
In accordance with Section 15 a of the Securities<br />
Trading Act [WpHG] (Directors’ Dealings), members<br />
of the Management Board, the Supervisory<br />
Board and the Shareholders’ <strong>Co</strong>mmittee, and<br />
parties related to same, are obliged to disclose<br />
transactions involving shares in <strong>Henkel</strong> <strong>AG</strong> & <strong>Co</strong>.<br />
<strong>KGaA</strong> or their derivative financial instruments<br />
where the value of such transactions attains or<br />
exceeds 5,000 euros in a calendar year. In fiscal<br />
<strong>2011</strong> <strong>Henkel</strong> was informed of a total of 23 transactions.<br />
In ten transactions conducted by members<br />
of the Shareholders’ <strong>Co</strong>mmittee and the Supervisory<br />
Board, or parties related to same, a total<br />
of 16,000 preferred shares were purchased and<br />
431,327 preferred shares were sold. One member<br />
of the Shareholders’ <strong>Co</strong>mmittee conducted a total<br />
of eight new put and call option transactions<br />
involving a total of 785,717 preferred shares and<br />
505,509 ordinary shares, and in 2010 completed<br />
five put and call option deals involving a total of
36<br />
Group management report<br />
<strong>Co</strong>rporate governance<br />
605,000 preferred shares. Further details in<br />
this regard can be found on our website at<br />
www.henkel.com/ir<br />
In accordance with the Declaration of <strong>Co</strong>mpliance,<br />
the following details are reported in relation<br />
to notifiable shareholdings: The aggregate<br />
holdings of the members of the Supervisory<br />
Board and of the members of the Shareholders’<br />
<strong>Co</strong>mmittee exceed in each case 1 percent of the<br />
shares issued by the company. The members of<br />
the Management Board together hold less than<br />
1 percent of the shares issued by the company.<br />
The corresponding declarations of compliance<br />
together with the reasons for deviations from<br />
recommendations can be found on our website<br />
at www.henkel.com/ir<br />
II. Remuneration report<br />
This remuneration report provides an outline of<br />
the compensation system for the Management<br />
Board, <strong>Henkel</strong> Management <strong>AG</strong> as the Personally<br />
Liable Partner, the Supervisory Board and the<br />
Shareholders’ <strong>Co</strong>mmittee of <strong>Henkel</strong> <strong>AG</strong> & <strong>Co</strong>.<br />
<strong>KGaA</strong>, and the Supervisory Board of <strong>Henkel</strong> Management<br />
<strong>AG</strong>; it also explains the level and structure<br />
of the remuneration paid.<br />
This remuneration report takes into account<br />
the recommendations of the German <strong>Co</strong>rporate<br />
Governance <strong>Co</strong>de and contains all the disclosures<br />
and explanations required pursuant to Section<br />
285 sentence 1 no. 9, Section 289 (2) no. 5, Section<br />
314 (1) no. 6 and Section 315 (2) no. 4 of the German<br />
<strong>Co</strong>mmercial <strong>Co</strong>de [HGB]. The associated<br />
information has not therefore been additionally<br />
disclosed in the notes to the consolidated financial<br />
statements at the back of this <strong>Annual</strong> <strong>Report</strong>.<br />
1. Remuneration of the Management Board<br />
The remuneration system described in the following,<br />
which meets the requirements of the Act<br />
on the Appropriateness of Management Board<br />
Remuneration [Vorst<strong>AG</strong>] and was approved by<br />
the 2010 <strong>Annual</strong> General Meeting of shareholders<br />
of <strong>Henkel</strong> <strong>AG</strong> & <strong>Co</strong>. <strong>KGaA</strong> with a majority of<br />
99.93 percent of the votes cast, applies uniformly<br />
as from fiscal 2010 with respect to the compensation<br />
payable to all members of the Management<br />
Board regardless of the duration of their individual<br />
executive contracts or previous, now superseded<br />
regulations.<br />
<strong>Henkel</strong> <strong>Annual</strong> <strong>Report</strong> <strong>2011</strong><br />
Regulation, structure and amounts<br />
The compensation for members of the Management<br />
Board of <strong>Henkel</strong> Management <strong>AG</strong> is regulated<br />
by the Supervisory Board of <strong>Henkel</strong> Management<br />
<strong>AG</strong> in consultation with the Human<br />
Resources Subcommittee of the Shareholders’<br />
<strong>Co</strong>mmittee. The Supervisory Board of <strong>Henkel</strong><br />
Management <strong>AG</strong> is comprised of three members<br />
of the Shareholders’ <strong>Co</strong>mmittee.<br />
The structure and amounts of the emoluments<br />
accruing to the Management Board are aligned to<br />
the size and international activities of the corporation,<br />
its economic and financial position, its<br />
performance and future prospects, the normal<br />
levels of remuneration encountered in comparable<br />
companies and also the general compensation<br />
structure within the <strong>Henkel</strong> organization.<br />
The compensation package is further determined<br />
on the basis of the functions, responsibilities and<br />
performance of the individual executives and the<br />
performance of the Management Board as a<br />
whole. The variable annual remuneration components<br />
have been devised such that they take<br />
into account both positive and negative developments.<br />
The overall remuneration mix is designed<br />
to be internationally competitive while also providing<br />
an incentive for ongoing business development<br />
and a sustainable increase in shareholder<br />
value within a dynamic operating environment.<br />
The Supervisory Board of <strong>Henkel</strong> Management<br />
<strong>AG</strong> regularly reviews the compensation arrangements<br />
applied to the Management Board.<br />
The remuneration of the members of the Management<br />
Board is based on a so-called target<br />
compensation amount (total remunerations excluding<br />
other ancillary emoluments and pension<br />
entitlements) which accrues to a member of the<br />
Management Board in the event of 100 percent<br />
achievement of the underlying performance targets,<br />
this “at-target” amount coming in at around<br />
2.1 million euros in total per financial year, assuming<br />
reasonable similarity of the range of responsibilities<br />
involved. Of this target compensation,<br />
around 30 percent is in fixed salary, some<br />
35 percent is performance-related over the short<br />
term and about 35 percent is performance-related<br />
over the long term. In addition, the Supervisory<br />
Board may, at its discretion, grant a special payment<br />
in recognition of exceptional achievements.
<strong>Henkel</strong> <strong>Annual</strong> <strong>Report</strong> <strong>2011</strong> Group management report<br />
<strong>Co</strong>rporate governance<br />
37<br />
Remuneration structure<br />
Fixed salary:<br />
30 percent<br />
Short-term<br />
components:<br />
35 percent<br />
35 percentage<br />
points in variable<br />
annual remuneration<br />
(cash component)<br />
Long-term<br />
components:<br />
35 percent<br />
25 percentage points<br />
in variable annual<br />
remuneration (own<br />
investment in <strong>Henkel</strong><br />
preferred shares)<br />
10 percentage<br />
points in long-term<br />
incentive<br />
This target compensation amount is supplemented<br />
by other emoluments and pension benefits.<br />
The components in detail:<br />
Fixed salary<br />
The annual non-performance-related fixed<br />
salary accounts for around 30 percent of the<br />
target compensation amount. It is paid in twelve<br />
monthly installments. The amount paid reflects<br />
both the function and responsibilities of the<br />
position and relevant market conditions.<br />
Variable annual remuneration<br />
Overall, the variable annual remuneration accounts<br />
for around 60 percent of the target compensation<br />
amount. The variable annual remuneration is<br />
made up of annual performance-related components<br />
which account for around 35 percent of the<br />
target compensation amount, and a long-term<br />
variable incentive which accounts for around<br />
25 percent of the target compensation amount and<br />
takes the form of an investment by the recipient<br />
(own investment) in <strong>Henkel</strong> preferred shares with<br />
a minimum vesting period of three years.<br />
Determination of variable annual remuneration<br />
The performance criteria governing the variable<br />
annual remuneration are primarily return on<br />
capital employed (ROCE) and earnings per preferred<br />
share (EPS) in the relevant fiscal year,<br />
adjusted in each case for exceptional items. The<br />
application of these performance parameters<br />
ensures that profitable growth is duly rewarded<br />
by <strong>Henkel</strong>. The further factors used in establishing<br />
the variable annual remuneration payable to<br />
the Management Board members are: the Group<br />
results and the results of the relevant business<br />
sector or corporate function, the quality of<br />
management demonstrated in those functions,<br />
and the individual contribution made by the<br />
Management Board member concerned.<br />
The target amount is adjusted on the basis of a<br />
performance factor related to the degree of target<br />
achievement. In determining the variable annual<br />
remuneration, the Supervisory Board of <strong>Henkel</strong><br />
Management <strong>AG</strong> also takes into due account the<br />
apparent sustainability of the economic success,<br />
and the performance levels of the Management<br />
Board members.<br />
Variable annual remuneration is also subject<br />
to an overall cap, with the result that the amount<br />
paid may only range between 0 percent and<br />
250 percent of the target amount.<br />
Short-term and long-term components of the<br />
variable annual remuneration<br />
The variable annual remuneration is paid annually<br />
in arrears once the corporation’s annual financial<br />
statements have been approved by the <strong>Annual</strong><br />
General Meeting. Of the variable annual remuneration,<br />
around 60 percent is paid in cash,<br />
which in turn corresponds to a proportion of the<br />
target compensation of around 35 percent. For the<br />
remaining 40 percent – corresponding to 25 percent<br />
of the target compensation – the members<br />
of the Management Board acquire <strong>Henkel</strong> preferred<br />
shares (own investment) at the price prevailing<br />
at the time of acquisition. These shares<br />
are placed in a blocked custody account with a<br />
three-year drawing restriction. This own investment<br />
ensures that the members of the Management<br />
Board participate through a portion of their<br />
compensation in the long-term performance of<br />
the corporation.<br />
Therefore, around 35 percent of the target compensation<br />
amount is short-term performance-<br />
related and – due to the own investment portion<br />
and the long-term incentive described below –<br />
a further 35 percent is aligned to components<br />
of a long-term performance-related nature.<br />
Long-term incentive (LTI)<br />
The long-term incentive, which accounts for<br />
10 percent of the target compensation amount, is<br />
a variable cash payment based on the long-term<br />
performance of the corporation, the amount payable<br />
being dependent on the future increase registered<br />
in earnings per preferred share (EPS) over<br />
three consecutive years (the performance period).<br />
Together with the recipient’s own investment<br />
from the variable annual remuneration, performance-related<br />
components aligned to the long<br />
term make up 35 percent of the target compensation<br />
amount.
38<br />
Group management report<br />
<strong>Co</strong>rporate governance<br />
On completion of the performance period, the<br />
degree of target achievement is ascertained by<br />
the Supervisory Board of <strong>Henkel</strong> Management <strong>AG</strong><br />
on the basis of the increase in EPS achieved. The<br />
amounts included in the calculation of the increase<br />
are, in each case, the earnings per preferred share<br />
adjusted for exceptional items, as disclosed in<br />
the certified and approved consolidated financial<br />
statements of the relevant financial years.<br />
Depending on the level of target achievement ascertained<br />
by the Supervisory Board of <strong>Henkel</strong><br />
Management <strong>AG</strong>, the target amount is adjusted by<br />
a performance multiplier. The long-term incentive<br />
is also subject to an overall cap, with the result<br />
that the amount paid may only range between<br />
0 percent and 250 percent of the target amount.<br />
Pension benefits<br />
The retirement pension for members joining the<br />
Management Board of the former <strong>Henkel</strong> <strong>KGaA</strong><br />
before January 1, 2005, amounts to a certain percentage<br />
of the last paid fixed salary (defined benefit).<br />
Effective January 1, 2005, we changed the pension<br />
entitlement for new members of the Management<br />
Board to a defined contribution scheme. Once<br />
a covered event occurs, the beneficiaries receive<br />
a superannuation lump-sum payment combined<br />
with a continuing basic annuity. The superannuation<br />
lump-sum payment comprises the total<br />
of annual contributions calculated on the basis<br />
of a certain percentage of the target compensation<br />
amount, this percentage being the same for all<br />
members of the Management Board. The annual<br />
contributions depend to a certain degree on<br />
developments in the actual total cash compensation<br />
paid in the financial year in question. Any<br />
vested pension rights earned within the corporation<br />
prior to the executive’s joining the Management<br />
Board are taken into account as start-up units.<br />
The defined contribution pension system ensures<br />
appropriate retirement and welfare benefits while<br />
also incorporating a performance-related element.<br />
An entitlement to pension and welfare benefits<br />
arises on retirement, on termination of the<br />
employment relationship on or after attainment<br />
of the statutory retirement age, or in the event of<br />
incapacity for work. If a member of the Management<br />
Board (executive) receives no pension<br />
benefits prior to their death, the superannuation<br />
lump sum accumulated up to time of death is<br />
paid out to the surviving spouse or surviving<br />
children. In addition, the executive’s surviving<br />
<strong>Henkel</strong> <strong>Annual</strong> <strong>Report</strong> <strong>2011</strong><br />
spouse receives pension payments amounting to<br />
60 percent and each dependant child benefit payments<br />
amounting to 15 percent – up to a maximum<br />
of 100 percent for all beneficiaries – of the<br />
executive’s pension entitlement. The surviving<br />
child’s benefit is generally paid until the child’s<br />
18th birthday or, if longer, until completion of<br />
their professional training, but only up to their<br />
27th birthday.<br />
Other emoluments<br />
The members of the Management Board also<br />
receive other emoluments in the form of benefits<br />
arising out of standard commercial insurance<br />
policies and the provision of a company car.<br />
Other regulatory provisions<br />
In the event of retirement being taken by members<br />
of the Management Board who were first appointed<br />
prior to 2009, they are entitled to continued payment<br />
of their fixed salary for a further six months,<br />
but not beyond the month of their 65th birthday.<br />
In the event of a member’s position on the Management<br />
Board being terminated without good<br />
cause or reason, the executive contract provides<br />
for a severance settlement amounting to the remuneration<br />
for the remaining contractual term<br />
in the form of a discounted lump-sum payment.<br />
Since the 2008 <strong>AG</strong>M, however, severance payments<br />
have been limited to two years’ compensation<br />
(severance payment cap) with respect to<br />
newly concluded contracts of employment or<br />
contract extensions of more than two years. Such<br />
severance settlements must not, however, cover<br />
more than the remuneration payable for the remaining<br />
period of the executive contract. In addition,<br />
the executive contracts include a postcontractual<br />
non-competition clause with a term<br />
of up to two years. The associated discretionary<br />
payment can be up to 50 percent of annual compensation<br />
after allowing for any severance payments<br />
and earnings from any new extra-contractual<br />
activities. No entitlements exist in the event<br />
of premature termination of executive duties<br />
resulting from a change in control.<br />
The corporation maintains on behalf of members<br />
of the corporate management bodies and employees<br />
of <strong>Henkel</strong> a third-party group insurance<br />
policy (D&O insurance) protecting against consequential<br />
loss, which policy also covers members<br />
of the Management Board. For members of the<br />
Management Board there is an own-risk deductible<br />
amounting to 10 percent per loss event up to
<strong>Henkel</strong> <strong>Annual</strong> <strong>Report</strong> <strong>2011</strong> Group management report<br />
<strong>Co</strong>rporate governance<br />
39<br />
Structure of Management Board remuneration<br />
a maximum of one-and-a-half times their fixed<br />
salary for loss events occurring within a financial<br />
year.<br />
Remuneration for <strong>2011</strong><br />
The total compensation paid to members of the<br />
Management Board for the performance of their<br />
duties for and on behalf of <strong>Henkel</strong> <strong>AG</strong> & <strong>Co</strong>. <strong>KGaA</strong><br />
and its subsidiaries during the year under review,<br />
including the cumulative savings reserve for<br />
Special Incentive 2012, amounted to 21,992,191 euros<br />
(previous year: 18,297,607 euros including severance<br />
compensation payments). Of the total cash<br />
emoluments of 17,089,049 euros (previous year:<br />
13,865,940 euros) paid in respect of <strong>2011</strong>, 3,774,500<br />
Long-term remuneration components<br />
Fixed Short-term Long-term Long-term Other emolu-<br />
Total<br />
salary component of component of incentive ments remuneration<br />
variable an- variable annualremunenualremune-<br />
in euros<br />
rationration Total <strong>2011</strong> 3,774,500 7,854,368 5,236,245 1,258,142 223,936 18,347,191<br />
20.6 % 42.8 % 28.5 % 6.9 % 1.2 % 100.0 %<br />
Total 2010 3,531,000 6,121,615 4,081,075 963,000 132,250 14,828,940<br />
23.8 % 41.2 % 27.6 % 6.5 % 0.9 % 100.0 %<br />
Management Board remuneration<br />
in euros<br />
Fixed<br />
salary<br />
Cash components<br />
Variable annualremuneration<br />
euros was in fixed salary (previous year:<br />
3,531,000 euros), 13,090,613 euros for the STI (previous<br />
year: 10,202,690 euros) and 223,936 euros in<br />
other emoluments (previous year: 132,250 euros).<br />
Also included in the total compensation is the<br />
long-term incentive granted for <strong>2011</strong> which – depending<br />
on the achievement of the performance<br />
targets – will only become payable in 2014. It is<br />
a legal requirement that a value be disclosed in<br />
the year of grant. This value is determined on the<br />
basis of an “at target” calculation, i.e. assuming<br />
the achievement of an increase in EPS over the<br />
performance period of 30 percent, giving an imputed<br />
amount of 1,258,142 euros (previous year:<br />
963,000 euros).<br />
Other emoluments<br />
Total cash<br />
emoluments<br />
Value of<br />
long-term<br />
incentive1<br />
Total<br />
remuneration<br />
Kasper Rorsted <strong>2011</strong> 963,000 3,423,549 87,391 4,473,940 321,000 4,794,940<br />
2010 963,000 2,834,370 42,078 3,839,448 321,000 4,160,448<br />
Jan-Dirk Auris <strong>2011</strong> 642,000 2,199,033 57,189 2,898,222 214,000 3,112,222<br />
(since Jan. 1, <strong>2011</strong>) 2010 – – – – – –<br />
Thomas Geitner 2<br />
(until Dec. 31,<br />
<strong>2011</strong> – – – – – –<br />
2010)<br />
2010 642,000 1,819,580 19,093 2,480,673 – 2,480,673<br />
Kathrin Menges <strong>2011</strong> 136,500 482,669 3,033 622,202 45,475 667,677<br />
(since Oct. 1, <strong>2011</strong>) 2010 – – – – – –<br />
Bruno Piacenza <strong>2011</strong> 642,000 2,199,033 28,472 2,869,505 214,000 3,083,505<br />
(since Jan. 1, <strong>2011</strong>) 2010 – – – – – –<br />
Dr. Friedrich Stara<br />
(until Feb. 28,<br />
<strong>2011</strong> 107,000 308,263 2,466 417,729 35,667 453,396<br />
<strong>2011</strong>)<br />
2010 642,000 1,849,580 21,337 2,512,917 214,000 2,726,917<br />
Dr. Lothar<br />
<strong>2011</strong> 642,000 2,239,033 24,327 2,905,360 214,000 3,119,360<br />
Steinebach<br />
2010 642,000 1,849,580 25,846 2,517,426 214,000 2,731,426<br />
Hans Van Bylen <strong>2011</strong> 642,000 2,239,033 21,058 2,902,091 214,000 3,116,091<br />
2010 642,000 1,849,580 23,896 2,515,476 214,000 2,729,476<br />
Total <strong>2011</strong> 3,774,500 13,090,613 223,936 17,089,049 1,258,142 18,347,191<br />
2010 3,531,000 10,202,690 132,250 13,865,940 963,000 14,828,940<br />
1 <strong>2011</strong> LTI payout in 2014; these figures will only be attained in the event of EPS increasing by 30 percent in the performance period.<br />
2 LTI for 2010 included in Thomas Geitner’s severance package.
40<br />
Group management report<br />
<strong>Co</strong>rporate governance<br />
Defined benefit pension<br />
Retirement pension p.a. on onset Change in pension provisions for<br />
in euros<br />
of pension as of reporting date<br />
<strong>2011</strong><br />
Dr. Lothar Steinebach 398,040 46,907<br />
Defined contribution pension<br />
Superannuation lump sum Basic annuity<br />
Total lump sum Addition to Total basic Addition to<br />
lump sum <strong>2011</strong> annuity (p.a.) basic annuity<br />
in euros<br />
<strong>2011</strong><br />
Kasper Rorsted 2,490,300 543,645 1,681 177<br />
Jan-Dirk Auris 104,220 104,220 229 229<br />
Kathrin Menges 21,735 21,735 48 48<br />
Bruno Piacenza 104,220 104,220 201 201<br />
Dr. Friedrich Stara 1,534,695 59,775 762 17<br />
Hans Van Bylen 1,830,914 358,650 1,528 169<br />
The remuneration of the individual members of<br />
the Management Board for the year under review<br />
is indicated in the table on the previous page,<br />
together with a breakdown according to the individual<br />
components referred to above.<br />
No member of the Management Board was granted<br />
by the company non-standard benefits in the<br />
event of premature termination of their tenure,<br />
nor were any such entitlements or arrangements<br />
modified. No member of the Management Board<br />
was pledged payments from third parties in respect<br />
of their duties as executives of the company,<br />
nor were any such payments granted in the<br />
year under review.<br />
Special Incentive 2012<br />
In order to underpin <strong>Henkel</strong>’s strategic priorities<br />
and the ambitious 2012 financial targets announced<br />
in this regard, the Supervisory Board<br />
of <strong>Henkel</strong> Management <strong>AG</strong> has, in consultation<br />
with and on the recommendation of the HR<br />
Subcommittee of the Shareholders’ <strong>Co</strong>mmittee,<br />
resolved that an additional cash bonus should<br />
be payable to the members of the Management<br />
Board on the primary condition that the adjusted<br />
return on sales for 2012 is at least 14 percent<br />
(Special Incentive 2012). Achievement of the governing<br />
thresholds (indicated below) shall be<br />
based on the certified and approved consolidated<br />
financial statements, with relevant margins<br />
having been adjusted for exceptional items.<br />
The volume of the Special Incentive 2012 is<br />
50 percent of the ensuing variable annual<br />
remuneration for 2012.<br />
The special incentive will be paid as follows:<br />
Subject to achievement of an adjusted return on<br />
sales of at least 14 percent in 2012, 60 percent of<br />
the special incentive will be paid out following<br />
the 2013 <strong>AG</strong>M. The remaining 40 percent will be<br />
paid out following the 2014 <strong>AG</strong>M provided that,<br />
in 2013, the adjusted return on sales achieved<br />
amounts to at least 13.8 percent. This staggered<br />
arrangement adequately satisfies the criterion of<br />
sustainable performance improvement.<br />
Because this represents a conditional claim to<br />
deferred payment, a savings reserve has to be<br />
created for the Special Incentive, which is then<br />
amortized in subsequent years. The additions to<br />
the savings reserve made for qualifying members<br />
of the Management Board are indicated in the<br />
following table:<br />
Special Incentive 2012<br />
<strong>Henkel</strong> <strong>Annual</strong> <strong>Report</strong> <strong>2011</strong><br />
in euros<br />
Addition to savings reserve<br />
in <strong>2011</strong><br />
Kasper Rorsted 702,000<br />
Jan-Dirk Auris 1 800,000<br />
Kathrin Menges 2 425,000<br />
Bruno Piacenza 1 800,000<br />
Dr. Friedrich Stara 3 182,000<br />
Dr. Lothar Steinebach 4 268,000<br />
Hans Van Bylen 468,000<br />
Total 3,645,000<br />
1 Member of the Management Board since Jan. 1, <strong>2011</strong>;<br />
first addition made in <strong>2011</strong>.<br />
2 Member of the Management Board since Oct. 1, <strong>2011</strong>;<br />
first addition made in <strong>2011</strong>.<br />
3 Member of the Management Board until Feb. 28, <strong>2011</strong>.<br />
4 Member of the Management Board until June 30, 2012.
<strong>Henkel</strong> <strong>Annual</strong> <strong>Report</strong> <strong>2011</strong> Group management report<br />
<strong>Co</strong>rporate governance<br />
41<br />
Pension benefits<br />
The pension benefits accruing to the members of<br />
the former and latter Management Boards as of<br />
the reporting date and also the contributions to<br />
the pension scheme made in <strong>2011</strong> are shown in<br />
the tables on the previous page.<br />
A total of 80,208,248 euros (previous year:<br />
78,758,710 euros) has been provided for pension<br />
obligations to former members of the former and<br />
latter Management Boards and the former directors<br />
of the legal predecessor of the company, and<br />
their surviving dependants. Amounts paid to such<br />
recipients during the year under review totaled<br />
6,332,108 euros (previous year: 6,430,106 euros).<br />
2. Remuneration of <strong>Henkel</strong> Management <strong>AG</strong> for<br />
assumption of liability, and reimbursement of<br />
expenses to same<br />
For assumption of the liability and management<br />
of the businesses of the corporation, <strong>Henkel</strong><br />
Management <strong>AG</strong> in its function as Personally<br />
Liable Partner shall receive an annual payment of<br />
50,000 euros (= 5 percent of its capital stock) plus<br />
any value-added tax (VAT) due, said fee being<br />
payable irrespective of any profit or loss made.<br />
<strong>Henkel</strong> Management <strong>AG</strong> may also claim reimbursement<br />
from or payment by the corporation of all<br />
expenses incurred in connection with the management<br />
of the latter’s businesses including the emoluments<br />
and pensions paid to its management bodies.<br />
3. Remuneration of the Supervisory Board and of<br />
the Shareholders’ <strong>Co</strong>mmittee of <strong>Henkel</strong> <strong>AG</strong> &<br />
<strong>Co</strong>. <strong>KGaA</strong><br />
Regulation, structure and amounts<br />
The remuneration for the Supervisory Board and<br />
the Shareholders’ <strong>Co</strong>mmittee has been approved<br />
in General Meeting; the corresponding provisions<br />
are contained in Articles 17 and 33 of the<br />
Articles of Association.<br />
The structure and amount of the remunerations<br />
are commensurate with the size of the corporation,<br />
its economic success and the functions<br />
performed by the Supervisory Board and the<br />
Shareholders’ <strong>Co</strong>mmittee respectively.<br />
The remuneration package comprises three components:<br />
a fixed fee, a variable dividend-related<br />
bonus and an annual, variable, performance-<br />
related, long-term incentive (LTI) based on the<br />
company’s performance. The components in detail:<br />
Fixed fee<br />
Each member of the Supervisory Board and of the<br />
Shareholders’ <strong>Co</strong>mmittee receives a fixed fee of<br />
20,000 euros and 50,000 euros per year respectively.<br />
The higher fixed fee in the latter case is<br />
due to the fact that, as required by the Articles of<br />
Association, the Shareholders’ <strong>Co</strong>mmittee is involved<br />
in business management activities.<br />
Dividend bonus<br />
Each member of the Supervisory Board and of<br />
the Shareholders’ <strong>Co</strong>mmittee further receives<br />
an annual bonus of 2,400 euros for every full<br />
0.02 euros by which the preferred dividend paid<br />
out for the prior year exceeds 0.25 euros.<br />
Long term incentive<br />
As a long-term incentive, each member of the Supervisory<br />
Board and of the Shareholders’ <strong>Co</strong>mmittee<br />
receives an additional cash payment each year,<br />
the amount of which depends on the increase in<br />
earnings per preferred share (EPS) over a threeyear<br />
reference period. The EPS of the financial<br />
year preceding the year of payment is compared<br />
to the EPS of the second financial year following<br />
the year of payment. If the increase is at least<br />
15 percent, an amount of 600 euros is paid for each<br />
full percentage point of the total achieved increase.<br />
If the increase reaches a minimum of 21 percent,<br />
the amount paid per percentage point is 700 euros,<br />
and if the increase is a minimum of 30 percent,<br />
the amount paid per percentage point is 800 euros.<br />
The calculation is based on the certified and<br />
approved consolidated financial statements of<br />
the respective financial years, with EPS having<br />
been adjusted for exceptional items.<br />
The total of the dividend bonus and the long-term<br />
incentive is, however, limited to 50,000 euros (cap).<br />
Remuneration for chairpersons/vice-chairpersons/(sub)committee<br />
members<br />
The Chairperson of the Supervisory Board and<br />
the Chairperson of the Shareholders’ <strong>Co</strong>mmittee<br />
each receives double the amount, and the Vice-<br />
Chairperson in each case one-and-a-half times<br />
the amount accruing to an ordinary member.<br />
Members of the Shareholders’ <strong>Co</strong>mmittee who<br />
are also members of one or more subcommittees<br />
of the Shareholders’ <strong>Co</strong>mmittee each additionally<br />
receive remuneration equivalent to the initial<br />
amount; if they are the Chairperson of one or<br />
more subcommittees, they receive double.
42<br />
Group management report<br />
<strong>Co</strong>rporate governance<br />
Members of the Supervisory Board who are also<br />
members of the Audit <strong>Co</strong>mmittee shall each additionally<br />
receive a fee of 50 percent of the cash<br />
amount accruing to a member of the Supervisory<br />
Board (fixed fee plus dividend bonus); the Chairperson<br />
of the Audit <strong>Co</strong>mmittee receives an additional<br />
fee of 100 percent of this amount. Activity<br />
in the Nominations <strong>Co</strong>mmittee is not remunerated<br />
separately.<br />
Other regulatory provisions<br />
The members of the Supervisory Board or a committee<br />
receive an attendance fee amounting to<br />
500 euros for each meeting in which they participate.<br />
If several meetings take place on one day,<br />
the attendance fee shall only be paid once. In<br />
addition, the members of the Supervisory Board<br />
and of the Shareholders’ <strong>Co</strong>mmittee are reimbursed<br />
expenses arising from the pursuit of their<br />
mandates. The members of the Supervisory<br />
Board are also reimbursed the value-added tax<br />
(VAT) payable on their total remunerations and<br />
reimbursed expenses.<br />
The corporation maintains on behalf of members of<br />
the corporate management bodies and employees<br />
of <strong>Henkel</strong> a third-party group insurance policy<br />
(D&O insurance) protecting against consequential<br />
loss, which policy also covers members of the<br />
Supervisory Board and of the Shareholders’ <strong>Co</strong>mmittee.<br />
For members of the Supervisory Board and<br />
Shareholders’ <strong>Co</strong>mmittee there is an own-risk<br />
deductible amounting to 10 percent per loss event<br />
up to a maximum of one-and-a-half times their<br />
fixed annual fee for loss events occurring within<br />
a financial year.<br />
Remuneration for <strong>2011</strong><br />
Total remuneration paid to the members of the<br />
Supervisory Board for the year under review (fixed<br />
fee, dividend bonus, attendance fee, components<br />
payable for committee activity and long-term<br />
incentive for <strong>2011</strong>) amounted to 1,515,500 euros<br />
plus VAT (previous year: 1,516,000 euros plus<br />
VAT). Of the total cash emoluments paid for <strong>2011</strong><br />
(fixed fee, dividend bonus, components payable<br />
for committee activity and attendance fees)<br />
amounting to 1,515,500 euros plus VAT of 246,620<br />
euros (previous year: 1,516,000 euros plus VAT of<br />
247,000 euros), 350,000 euros was in fixed fees,<br />
875,000 euros in dividend bonus, 34,500 euros in<br />
attendance fees and 256,000 euros in components<br />
payable for committee activity (including<br />
relevant additional attendance fees).<br />
<strong>Henkel</strong> <strong>Annual</strong> <strong>Report</strong> <strong>2011</strong><br />
Total remuneration paid to the members of the<br />
Shareholders’ <strong>Co</strong>mmittee for the year under review<br />
(fixed fee, dividend bonus, remuneration<br />
payable for subcommittee activity and long-term<br />
incentive for <strong>2011</strong>) amounted to 2,295,205 euros<br />
(previous year: 2,209,180 euros). Of the total cash<br />
emoluments paid for <strong>2011</strong> (fixed fee and dividend<br />
bonus, including the above-mentioned components<br />
payable for subcommittee activity) amounting to<br />
2,295,205 euros (previous year: 2,209,180 euros),<br />
561,301 euros was in fixed fee, 561,301 euros in<br />
dividend bonus and 1,172,603 euros in components<br />
payable for subcommittee activity (excluding the<br />
LTI amount due).<br />
In accordance with the proposal put forward by<br />
the Management Board, the dividend bonus in<br />
each case was based on a dividend of 0.80 euros<br />
per preferred share.<br />
Pursuant to Article 17 (3) and Article 33 (3) of the<br />
Articles of Association, the above dividend would<br />
yield a dividend bonus of 64,800 euros per member.<br />
However, as according to Article 17 (5) and<br />
Article 33 (5) of the Articles of Association, the<br />
amount of dividend bonus and LTI payable to a<br />
simple member cannot exceed 50,000 euros (cap)<br />
in a financial year, the dividend bonus for the<br />
year under review was capped at 50,000 euros<br />
and there will be no LTI payment for <strong>2011</strong>.<br />
In the year under review, no compensation or<br />
benefits were paid or granted for personally performed<br />
services, including in particular advisory<br />
or intermediation services.<br />
The emoluments of the individual members of<br />
the Supervisory Board and of the Shareholders’<br />
<strong>Co</strong>mmittee, broken down according to the abovementioned<br />
components, are presented in the<br />
tables on the following pages.<br />
4. Remuneration of the Supervisory Board of<br />
<strong>Henkel</strong> Management <strong>AG</strong><br />
According to Article 14 of the Articles of Association<br />
of <strong>Henkel</strong> Management <strong>AG</strong>, the members of<br />
the Supervisory Board of <strong>Henkel</strong> Management <strong>AG</strong><br />
are each entitled to receive an annual fee of<br />
10,000 euros. However, those members of said<br />
Supervisory Board who are also and simultaneously<br />
members of the Supervisory Board or the<br />
Shareholders’ <strong>Co</strong>mmittee of <strong>Henkel</strong> <strong>AG</strong> & <strong>Co</strong>.<br />
<strong>KGaA</strong> do not receive this fee.
<strong>Henkel</strong> <strong>Annual</strong> <strong>Report</strong> <strong>2011</strong> Group management report<br />
<strong>Co</strong>rporate governance<br />
43<br />
Supervisory Board remuneration<br />
Cash components<br />
Fixed fee Dividend Atten- Fee for Total cash Value of Total<br />
bonus dance fee committee emolu- long-term remuner-<br />
in euros<br />
activity 1 ments incentive2 ation3<br />
Dr. Simone Bagel-Trah 4, <strong>2011</strong> 40,000 100,000 2,000 36,500 178,500 – 178,500<br />
Chair<br />
2010 40,000 100,000 2,500 36,500 179,000 – 179,000<br />
Winfried Zander 4,<br />
<strong>2011</strong> 30,000 75,000 2,000 37,000 144,000 – 144,000<br />
Vice-chair<br />
2010 30,000 75,000 2,500 36,500 144,000 – 144,000<br />
Jutta Bernicke <strong>2011</strong> 20,000 50,000 2,500 – 72,500 – 72,500<br />
2010 20,000 50,000 2,500 – 72,500 – 72,500<br />
Dr. Kaspar von Braun <strong>2011</strong> 20,000 50,000 2,500 – 72,500 – 72,500<br />
(since April 19, 2010) 2010 14,082 35,205 1,000 – 50,287 – 50,287<br />
Johann-Christoph Frey <strong>2011</strong> 20,000 50,000 2,500 – 72,500 – 72,500<br />
2010 20,000 50,000 2,000 – 72,000 – 72,000<br />
Birgit Helten-Kindlein 4 <strong>2011</strong> 20,000 50,000 2,000 37,000 109,000 – 109,000<br />
2010 20,000 50,000 2,500 36,500 109,000 – 109,000<br />
Bernd Hinz<br />
<strong>2011</strong> – – – – – – –<br />
(until July 31, 2010)<br />
2010 11,616 29,041 1,500 – 42,157 – 42,157<br />
Prof. Dr. Michael Kaschke <strong>2011</strong> 20,000 50,000 1,500 – 71,500 – 71,500<br />
2010 20,000 50,000 2,000 – 72,000 – 72,000<br />
Thomas Manchot <strong>2011</strong> 20,000 50,000 2,500 – 72,500 – 72,500<br />
2010 20,000 50,000 2,000 – 72,000 – 72,000<br />
Mayc Nienhaus <strong>2011</strong> 20,000 50,000 2,500 – 72,500 – 72,500<br />
2010 20,000 50,000 2,500 – 72,500 – 72,500<br />
Thierry Paternot <strong>2011</strong> 20,000 50,000 2,500 – 72,500 – 72,500<br />
2010 20,000 50,000 2,000 – 72,000 – 72,000<br />
Andrea Pichottka <strong>2011</strong> 20,000 50,000 2,500 – 72,500 – 72,500<br />
2010 20,000 50,000 2,500 – 72,500 – 72,500<br />
Prof. Dr. Theo Siegert 4 <strong>2011</strong> 20,000 50,000 2,000 36,500 108,500 – 108,500<br />
2010 20,000 50,000 2,500 36,500 109,000 – 109,000<br />
Edgar Topsch<br />
<strong>2011</strong> 20,000 50,000 2,500 – 72,500 – 72,500<br />
(since Aug. 1, 2010)<br />
2010 8,384 20,959 1,000 – 30,343 – 30,343<br />
Konstantin von Unger <strong>2011</strong> – – – – – – –<br />
(until April 18, 2010) 2010 5,918 14,795 1,000 – 21,713 – 21,713<br />
Michael Vassiliadis 4 <strong>2011</strong> 20,000 50,000 2,000 37,000 109,000 – 109,000<br />
2010 20,000 50,000 2,500 36,500 109,000 – 109,000<br />
Dr. Bernhard Walter 4 <strong>2011</strong> 20,000 50,000 1,500 72,000 143,500 – 143,500<br />
2010 20,000 50,000 2,000 71,500 143,500 – 143,500<br />
Ulf Wentzien<br />
<strong>2011</strong> 20,000 50,000 1,500 – 71,500 – 71,500<br />
(until Dec. 31, <strong>2011</strong>) 2010 20,000 50,000 2,500 – 72,500 – 72,500<br />
Total <strong>2011</strong> 350,000 875,000 34,500 256,000 1,515,500 – 1,515,500<br />
2010 350,000 875,000 37,000 254,000 1,516,000 – 1,516,000<br />
1 Fee for service on the Audit <strong>Co</strong>mmittee; there is no separate fee payable for service on the Nominations <strong>Co</strong>mmittee.<br />
2 The dividend bonus and LTI for a reference year is limited to 50,000 euros (cap) for a simple member. Therefore, the dividend<br />
bonus of 64,800 euros that mathematically results from a dividend of 0.80 euros per preferred share has been reduced to<br />
50,000 euros. With the cap coming into play for reference year <strong>2011</strong>, there is no LTI payable, hence the absence of an LTI figure.<br />
3 Figures do not include VAT.<br />
4 Member of the Audit <strong>Co</strong>mmittee chaired by Dr. Bernhard Walter.<br />
As the members of the Supervisory Board of<br />
<strong>Henkel</strong> Management <strong>AG</strong> are also members of the<br />
Shareholders’ <strong>Co</strong>mmittee, no fee was paid in<br />
respect of this Supervisory Board in the year<br />
under review.
44<br />
Group management report<br />
<strong>Co</strong>rporate governance<br />
Shareholders' <strong>Co</strong>mmittee remuneration<br />
<strong>Henkel</strong> <strong>Annual</strong> <strong>Report</strong> <strong>2011</strong><br />
Cash components<br />
Fixed fee Dividend Fee for sub- Total cash Value of Total<br />
bonus committeeemolu- long-term remuner-<br />
in euros<br />
activity1 ments incentive2 ation<br />
Dr. Simone Bagel-Trah,<br />
Chair (Chair HR<br />
<strong>2011</strong> 100,000 100,000 200,000 400,000 – 400,000<br />
Subcommittee)<br />
2010 100,000 100,000 200,000 400,000 – 400,000<br />
Dr. Christoph <strong>Henkel</strong>,<br />
Vice-chair (Chair Finance<br />
<strong>2011</strong> 75,000 75,000 200,000 350,000 – 350,000<br />
Subcommittee)<br />
2010 75,000 75,000 200,000 350,000 – 350,000<br />
Prof. Dr. Paul Achleitner<br />
(Member Finance<br />
<strong>2011</strong> 50,000 50,000 100,000 200,000 – 200,000<br />
Subcommittee)<br />
2010 50,000 50,000 100,000 200,000 – 200,000<br />
Boris Canessa (Member<br />
<strong>2011</strong> 50,000 50,000 100,000 200,000 – 200,000<br />
HR Subcommittee)<br />
2010 50,000 50,000 100,000 200,000 – 200,000<br />
Stefan Hamelmann<br />
(Vice-chair<br />
<strong>2011</strong> 50,000 50,000 100,000 200,000 – 200,000<br />
Finance Subcommittee)<br />
2010 50,000 50,000 100,000 200,000 – 200,000<br />
Dr. Ulrich Hartmann<br />
(until April 18, 2010)<br />
(Member Finance<br />
<strong>2011</strong> – – – – – –<br />
Subcommittee)<br />
2010 14,795 14,795 29,590 59,180 – 59,180<br />
Prof. Dr. Ulrich Lehner<br />
(Member Finance<br />
<strong>2011</strong> 50,000 50,000 100,000 200,000 – 200,000<br />
Subcommittee)<br />
2010 50,000 50,000 100,000 200,000 – 200,000<br />
Dr. Norbert Reithofer<br />
(since April 11, 2010)<br />
(Member Finance<br />
<strong>2011</strong> 36,301 36,301 72,603 145,205 – 145,205<br />
Subcommittee)<br />
2010 – – – – – –<br />
Konstantin von Unger<br />
(Vice-chair<br />
<strong>2011</strong> 50,000 50,000 100,000 200,000 – 200,000<br />
HR Subcommittee)<br />
2010 50,000 50,000 100,000 200,000 – 200,000<br />
Karel Vuursteen<br />
(Member HR<br />
<strong>2011</strong> 50,000 50,000 100,000 200,000 – 200,000<br />
Subcommittee)<br />
2010 50,000 50,000 100,000 200,000 – 200,000<br />
Werner Wenning<br />
(Member HR<br />
<strong>2011</strong> 50,000 50,000 100,000 200,000 – 200,000<br />
Subcommittee)<br />
2010 50,000 50,000 100,000 200,000 – 200,000<br />
Total <strong>2011</strong> 561,301 561,301 1,172,603 2,295,205 – 2,295,205<br />
2010 539,795 539,795 1,129,590 2,209,180 – 2,209,180<br />
1 Proportional fixed fee and dividend bonus.<br />
2 The dividend bonus and LTI for a reference year is limited to 50,000 euros (cap) for a simple member. Therefore, the dividend bonus<br />
of 64,800 euros that mathematically results from a dividend of 0.80 euros per preferred share has been reduced to 50,000 euros.<br />
With the cap coming into play for reference year <strong>2011</strong>, there is no LTI payable, hence the absence of an LTI figure.
<strong>Henkel</strong> <strong>Annual</strong> <strong>Report</strong> <strong>2011</strong> Group management report<br />
Operational activities / Strategy and fi nancial targets for 2012<br />
45<br />
Operational activities<br />
Overview<br />
<strong>Henkel</strong> was founded in 1876. <strong>Co</strong>nsequently, the<br />
year under review marks the 135th in our corporate<br />
history. Today, <strong>Henkel</strong> employs more than 47,000<br />
people worldwide, and we occupy globally leading<br />
market positions in the consumer and industrial<br />
businesses.<br />
Organization and business sectors<br />
<strong>Henkel</strong> <strong>AG</strong> & <strong>Co</strong>. <strong>KGaA</strong> is operationally active as<br />
well as being the parent company of the <strong>Henkel</strong><br />
Group. It is responsible for defining and pursuing<br />
<strong>Henkel</strong>’s corporate objectives and also for the<br />
management, control and stewardship of our Group-<br />
wide activities, including risk management<br />
and the allocation of resources. <strong>Henkel</strong> <strong>AG</strong> & <strong>Co</strong>.<br />
<strong>KGaA</strong> performs its tasks within the legal scope<br />
afforded to it as part of the <strong>Henkel</strong> Group, with the<br />
affiliated companies otherwise operating as<br />
legally independent entities.<br />
Operational management and control is the responsibility<br />
of the Management Board of <strong>Henkel</strong><br />
Management <strong>AG</strong> in its function as sole Personally<br />
Liable Partner. The Management Board is supported<br />
by corporate functions.<br />
<strong>Henkel</strong> is organized into three business sectors:<br />
• Laundry & Home Care<br />
• <strong>Co</strong>smetics/Toiletries<br />
• Adhesive Technologies<br />
Our product range in the Laundry & Home Care<br />
business sector comprises heavy-duty detergents,<br />
specialty detergents and cleaning products. The<br />
portfolio of the <strong>Co</strong>smetics/Toiletries business<br />
sector encompasses hair cosmetics, products for<br />
body, skin and oral care, and products for the<br />
hair salon business. The Adhesive Technologies<br />
business sector offers decoration and renovation<br />
products, adhesive and correction products for<br />
home and office, building adhesives and industrial<br />
and structural adhesives, sealants and surface<br />
treatment products.<br />
Our three business sectors are managed on the<br />
basis of globally operational strategic business<br />
units. These are supported by the corporate functions<br />
of <strong>Henkel</strong> <strong>AG</strong> & <strong>Co</strong>. <strong>KGaA</strong> in order to ensure<br />
optimum utilization of corporate network synergies.<br />
Implementation of the strategies at a country and<br />
<strong>Henkel</strong>’s brands and technologies around the world<br />
Scottsdale,<br />
Arizona, USA<br />
Regional Center<br />
Mexico City,<br />
Mexico<br />
Regional Center<br />
Rocky Hill,<br />
<strong>Co</strong>nnecticut, USA<br />
Regional Center<br />
São Paulo, Brazil<br />
Regional Center<br />
Düsseldorf, Germany<br />
Global Headquarters<br />
Vienna, Austria<br />
Regional Center<br />
regional level is the responsibility of the affiliated<br />
national companies. The executive bodies of<br />
these companies manage their businesses in line<br />
with the relevant statutory regulations, supplemented<br />
by their own articles of association, internal<br />
procedural rules and the principles incorporated<br />
in our globally applicable management standards,<br />
codes and guidelines.<br />
Strategy and financial targets<br />
for 2012<br />
Dubai, United<br />
Arab Emirates<br />
Regional Center<br />
Cairo, Egypt<br />
Regional Center<br />
We are continuing to expand our three business<br />
sectors Laundry & Home Care, <strong>Co</strong>smetics/Toiletries<br />
and Adhesive Technologies, each of which<br />
offers a strong and balanced portfolio of activities<br />
capable of significant growth in a positive market<br />
environment and ensuring relative stability in a<br />
downturn, as was clearly demonstrated throughout<br />
2009 to <strong>2011</strong>. Already today, we enjoy leading<br />
positions in all three segments in the mature<br />
markets of Western Europe and North America,<br />
and also in our emerging markets, which we intend<br />
to further expand going forward. It is essential<br />
for us to maintain strong or at least expandable<br />
market positions in the countries in which<br />
we have a presence. Already today, we generate<br />
42 percent of our total sales in our emerging markets.<br />
In 2004, the figure was just 26 percent.<br />
Shanghai, China<br />
Regional Center<br />
42%<br />
of our sales generated<br />
in the emerging markets.
46<br />
Group management report<br />
Strategy and financial targets for 2012<br />
24%<br />
of sales achieved with our<br />
top brands Schwarzkopf,<br />
Loctite and Persil.<br />
With our three growth-generating business sectors<br />
and the leading market positions we occupy, we<br />
have a strong basis for generating profitable growth<br />
in the future.<br />
Strategic priorities and progress in fiscal <strong>2011</strong><br />
In 2008, we set ourselves three strategic priorities:<br />
Focus<br />
more on<br />
our customers<br />
Achieve<br />
our full<br />
business potential<br />
Winning<br />
Culture<br />
Strengthen<br />
our global<br />
team<br />
Achieve our full business potential<br />
For this, we have identified the following drivers:<br />
1. Portfolio optimization<br />
Within the Laundry & Home Care business<br />
sector, we aim to increase our profitability in<br />
the mass categories such as heavy-duty detergents<br />
and hand-dishwashing products, and<br />
drive growth in the profitable specialty categories<br />
such as household cleaners and fabric<br />
softeners. In the <strong>Co</strong>smetics/Toiletries business<br />
sector, we intend to further enhance<br />
profitability by strengthening our innovation<br />
leadership and expanding our top brands.<br />
Within the Adhesive Technologies business<br />
sector we want to improve our profitability in<br />
the automotive segment, drive growth in specialty<br />
applications and utilize our economies<br />
of scale with innovations in the industrial<br />
adhesives business. In addition, we intend to<br />
increase our investments in order to achieve<br />
disproportionate growth in the emerging<br />
markets. We also want to further increase<br />
our market shares in the mature markets.<br />
<strong>Henkel</strong> <strong>Annual</strong> <strong>Report</strong> <strong>2011</strong><br />
2. Focus on our top brands<br />
Our focus is on fewer but stronger brands and<br />
further expansion of our strong regional and<br />
global brands. Brand awareness is to be further<br />
enhanced through extensive marketing<br />
investment and promotional activities. Our<br />
three top brands Schwarzkopf, Loctite and<br />
Persil already account for around 24 percent of<br />
our sales. Our objective is to grow organically<br />
faster with these and other top brands than<br />
<strong>Henkel</strong> overall, and therefore to further expand<br />
their share of total sales. At the same<br />
time, we are reducing the number of our<br />
brands by selling off or discontinuing the<br />
smaller and less important brands.<br />
3. Innovation and innovation rates<br />
With innovation rates 1 of 41 percent in the<br />
Laundry & Home Care business sector, 43 percent<br />
at <strong>Co</strong>smetics/Toiletries and around<br />
30 percent at Adhesive Technologies, we count<br />
among the strongest innovators in our fields<br />
of competence. We are helped in this respect<br />
by the proximity we have to our consumers<br />
and customers, actively incorporating both<br />
audiences in our product development activities<br />
where appropriate. We have also made it<br />
our principle only to launch a new product<br />
onto the market if it has a positive effect on<br />
gross margin and makes a contribution to<br />
sustainable development in at least one of our<br />
six focal areas (see page 49).<br />
4. Operational excellence<br />
In our purchasing activities, our aim is to create<br />
benefits through the further development of<br />
effective strategies. These include concentrating<br />
on fewer, more efficient suppliers and on<br />
procuring materials in lower-cost emerging<br />
countries. In production and our supply chain,<br />
our objective is to further optimize our production<br />
footprint. This will enable us to reduce<br />
the complexity of our structures and<br />
better utilize available capacities. We are also<br />
introducing improvements with respect to our<br />
administrative, selling and distribution expenses,<br />
by pooling within our shared service<br />
centers our standardized processes in the areas<br />
of finance, purchasing and human resources,<br />
plus certain activities from our business sectors,<br />
and by outsourcing non-core activities<br />
such as IT support. We expect such measures<br />
to yield further cost savings going forward.<br />
1 Percentage share of sales accounted for by new products<br />
launched onto the market in the last three years (five years for<br />
Adhesive Technologies).
<strong>Henkel</strong> <strong>Annual</strong> <strong>Report</strong> <strong>2011</strong> Group management report<br />
Strategy and financial targets for 2012<br />
47<br />
Focus more on our customers<br />
In order to place our customers right at the center<br />
of all we do, we have prioritized expanding our<br />
dialogue with them at the highest managerial<br />
level (top-to-top contacts), coupled with the<br />
further development of our customer partnership<br />
structures. Our aims are to establish a joint<br />
strategic approach to our markets, to expand<br />
services offering measurable added value for our<br />
customers, and to effectively leverage our own<br />
competences, such as our leadership in the field<br />
of sustainability.<br />
Strengthen our global team<br />
Our employees are our most important assets.<br />
With clear and unequivocal feedback, discernible<br />
rewards in recognition of individual performance,<br />
and tailored development plans, we ensure that<br />
our competent and motivated team can master<br />
the challenges with which they are confronted.<br />
We are keen to develop and promote our managers<br />
from within. At the same time, we are also aware<br />
of the need to bring in external talents, especially<br />
when their knowledge of their local markets<br />
is better than that of the established managerial<br />
staff within the company. Already today, there<br />
are people from more than 120 nations working<br />
for <strong>Henkel</strong>; and the proportion of female managers<br />
is around 30 percent worldwide, with the trend<br />
clearly rising. The diversity of our global team<br />
gives us a competitive advantage, one that we<br />
intend to further extend.<br />
Progress in fiscal <strong>2011</strong><br />
We made further substantial progress in the pursuit<br />
of our three strategic priorities in fiscal <strong>2011</strong>.<br />
The salient advancements were as follows:<br />
Achieve our full business potential<br />
• Despite major challenges and uncertainties<br />
in the economic environment, all three of our<br />
business sectors achieved very good results.<br />
• We have further expanded our shared service<br />
centers in Bratislava (Slovakia) and Manila<br />
(Philippines), and have opened a third in Mexico<br />
City (Mexico). In addition to increasing the<br />
level of usage of these facilities for corporate<br />
functions such as Finance, Purchasing and HR,<br />
we have also transferred to them a number of<br />
activities from our business sectors, for example<br />
aspects of market research and certain controlling<br />
functions.<br />
Focus more on our customers<br />
• We have further extended our partnerships<br />
with customers and regularly meet with their<br />
representatives at the highest management<br />
level in order to identify further possible joint<br />
projects.<br />
• We have developed a new sustainability strategy<br />
with goals extending through to 2030.<br />
Strengthen our global team<br />
• Throughout <strong>Henkel</strong>, there have been numerous<br />
activities implemented in order to establish<br />
the new vision and values introduced in 2010.<br />
Together with their teams, all our line managers<br />
have examined the implementation of the<br />
measures agreed in 2010 as applicable to their<br />
spheres of responsibility, and are continuing<br />
to drive such activities forward.<br />
• We have adapted our global short-term incentive<br />
on the basis of the globally standardized system<br />
developed in 2010 for differentiated assessment<br />
of the performance and development potential<br />
of our managerial staff.<br />
Financial targets 2012<br />
In 2008, we set ourselves financial targets for<br />
2012 which we intend to achieve through diligent<br />
pursuit of our strategic priorities.<br />
Financial targets 2012<br />
<strong>Annual</strong> organic sales growth (average):<br />
3–5 percent<br />
Adjusted 1 return on sales (EBIT):<br />
14 percent<br />
<strong>Annual</strong> growth in adjusted earnings per<br />
preferred share (average):<br />
> 10 percent<br />
Despite major challenges and uncertainties in<br />
the economic environment, <strong>2011</strong> was a successful<br />
year for us: We achieved strong organic sales<br />
growth of 5.9 percent and succeeded in increasing<br />
adjusted return on sales by 0.7 percentage points<br />
to 13.0 percent. Adjusted earnings per preferred<br />
share came in at 3.14 euros, an increase of 11.3 percent<br />
above the level of 2010.<br />
1 Adjusted for one-time charges/gains and restructuring charges.
48<br />
5 times<br />
sector leader in<br />
the Dow Jones<br />
Sustainability Index<br />
(see page 26).<br />
Group management report<br />
Strategy and financial targets for 2012<br />
Following on from the successes of the year under<br />
review, we are very confident that we will achieve<br />
our 2012 financial targets.<br />
Developments up to year-end <strong>2011</strong><br />
2010 <strong>2011</strong><br />
Organic sales growth + 7.0 % +5.9%<br />
Organic sales growth, average* +1.8% +3.1%<br />
Adjusted return on sales (EBIT) 12.3% 13.0%<br />
Adjusted earnings per preferred<br />
share in euros 2.82 3.14<br />
Growth + 47.6 % +11.3%<br />
Average growth** +13.5% +12.8%<br />
* Arithmetic mean 2009 through <strong>2011</strong>.<br />
** <strong>Co</strong>mpound annual growth rate (C<strong>AG</strong>R) 2008 through <strong>2011</strong>.<br />
In order to further promote achievement of our<br />
ambitious financial targets, a one-time payment<br />
(Special Incentive 2012) approximating to the value<br />
of the variable annual remuneration amount was<br />
put in place in 2010 for around 3,000 senior managerial<br />
staff of the <strong>Henkel</strong> Group (Management<br />
Circles 0 to IIb). This becomes payable on condition<br />
that the adjusted return on sales achieved<br />
in 2012 is at least 14 percent.<br />
Sustainability strategy 2030<br />
Our corporate value as the foundation<br />
<strong>Co</strong>mmitment to leadership in sustainability is<br />
one of our core corporate values. Maintaining a<br />
balance between economic success, protection of<br />
the environment, and social responsibility has<br />
been fundamental to our corporate culture for<br />
decades. As pioneers, we aim to develop new<br />
solutions for sustainable development while continuing<br />
to shape our business responsibly and<br />
increase our economic success. This ambition<br />
encompasses all of our company’s activities –<br />
along the entire value chain.<br />
Achieving more with less<br />
We are facing immense challenges: The global<br />
human footprint is already greater today than the<br />
planet’s resources can bear. By the year 2050, the<br />
world’s population is expected to grow to 9 billion.<br />
The accompanying acceleration in global<br />
economic activity will lead to rising consumption<br />
and resource depletion. The pressure on<br />
available resources will thus intensify in the<br />
coming decades. Since sacrificing quality of life<br />
and consumption is not a realistic solution in our<br />
<strong>Henkel</strong> <strong>Annual</strong> <strong>Report</strong> <strong>2011</strong><br />
view, we have adopted the Vision 2050 of the<br />
World Business <strong>Co</strong>uncil for Sustainable Development<br />
(WBCSD) as the basis for our strategy: “In<br />
2050, 9 billion people live well and within the<br />
resource limits of the planet.” This translates the<br />
abstract principle of sustainable development<br />
into a concrete vision for society in 2050.<br />
For us as a company, this means helping people<br />
to live well by generating value while using less<br />
resources and causing less emissions. This is the<br />
idea at the heart of our new sustainability strategy:<br />
Achieving more with less. We want to create<br />
more value – for our customers and consumers,<br />
for the communities we operate in, and for our<br />
company – while at the same time reducing our<br />
ecological footprint. To accomplish this, we need<br />
innovations, products and technologies that can<br />
enhance quality of life while using less input<br />
materials. Building on our decades of experience<br />
in sustainable development, we aim to work<br />
together with our suppliers, customers, and<br />
consumers to develop viable solutions for the<br />
future. By doing so, we will be contributing both<br />
to sustainable development and to our company’s<br />
economic success.<br />
Our goal for 2030: Triple our efficiency<br />
Our long-term goal reflects the global challenges<br />
of sustainability. We will have to significantly<br />
improve our efficiency in order to reconcile people’s<br />
desire to live well within the resource limits<br />
of the planet.<br />
Therefore, within the next 20 years we want to<br />
triple the value we create through our business<br />
operations in relation to the ecological footprint<br />
of our products and services. We call this ambition<br />
of becoming three times more efficient<br />
“Factor 3.” One way to achieve this is to triple the<br />
value we create while leaving the footprint at the<br />
Our goal is to become three times more efficient by 2030. We<br />
call this “Factor 3.” That means tripling the value we create<br />
through our business activities in relation to the ecological<br />
footprint made by our products and services.
<strong>Henkel</strong> <strong>Annual</strong> <strong>Report</strong> <strong>2011</strong> Group management report<br />
Strategy and financial targets for 2012<br />
49<br />
same level. Or we can reduce the ecological footprint<br />
to one third of today’s level, achieving our<br />
“Factor 3” improvement in efficiency by delivering<br />
the same value.<br />
To reach this ambitious 20-year goal, we will<br />
have to improve our efficiency by an average of<br />
5 to 6 percent each year. We have therefore set<br />
concrete 5-year targets for our focal areas (see<br />
chart). By 2015, we intend to improve the<br />
relationship between the value we create and<br />
the ecological footprint of our business activity<br />
by 30 percent overall.<br />
Our contributions in six focal areas<br />
To successfully implement our strategy, we are<br />
concentrating on six focal areas of activity that<br />
reflect the challenges of sustainable development<br />
as they relate to our operations. In each of<br />
Our focal areas and company-wide targets for 2015<br />
More value<br />
More social progress and<br />
better quality of life<br />
Less energy used and<br />
less greenhouse gases<br />
Reduced footprint<br />
Social<br />
Progress<br />
Energy<br />
and<br />
Climate<br />
these focal areas, we drive progress along the<br />
entire value chain through our products and processes.<br />
With our new strategy, we have added a<br />
sixth focal area to the previous five, namely that<br />
of “Performance.” This reflects not only our aims<br />
as a commercial enterprise, but also our core<br />
value contribution to society. At the same time,<br />
we have subdivided the focal areas into two dimensions:<br />
“more value” and “reduced footprint.”<br />
Three focal areas therefore represent the value<br />
we want to deliver to our customers, shareholders<br />
and our company, for example in the form of<br />
enhanced occupational safety and contributions<br />
to social progress. The three other focal areas<br />
describe the way in which we want to reduce<br />
our ecological footprint, for instance through<br />
reduced water and energy consumption and<br />
less waste.<br />
More value for our customers<br />
and more value for <strong>Henkel</strong><br />
Performance<br />
Deliver<br />
more value<br />
at a reduced<br />
footprint<br />
Materials<br />
and Waste<br />
Less resources used<br />
and less waste generated<br />
Safety<br />
and<br />
Health<br />
Water<br />
and<br />
Wastewater<br />
Safer workplaces and<br />
better health & hygiene<br />
Less water used and<br />
less water pollution<br />
+10%<br />
more net sales per<br />
production unit<br />
+20%<br />
safer per million<br />
hours worked<br />
–15%<br />
less water per<br />
production unit<br />
–15%<br />
less waste per<br />
production unit<br />
–15%<br />
less energy per<br />
production unit
50<br />
Group management report<br />
Strategy and financial targets for 2012<br />
Sustainability <strong>Report</strong> <strong>2011</strong><br />
Detailed information and<br />
background reading on the<br />
subject of sustainability can<br />
be found in our Sustainability<br />
<strong>Report</strong> which is available in<br />
both printed and online form.<br />
www.henkel.com/<br />
sustainabilityreport<br />
Our approach for sustainable business processes<br />
In order to successfully implement our strategy<br />
and reach our goal, both of these dimensions<br />
must be manifest in the minds and day-to-day<br />
actions of our more than 47,000 employees, and<br />
apparent in our business processes. We have defined<br />
three strategic principles to achieve this:<br />
products, partners, and people.<br />
Our products deliver more value for our customers<br />
and consumers. We achieve this through innovative<br />
solutions and education, and through<br />
products that offer better performance with a<br />
smaller footprint, thus saving resources and reducing<br />
other negative environmental impacts.<br />
Our partners are key to driving sustainability<br />
along our value chains and in all areas of business<br />
and life. We support them with our products<br />
and expertise. And we collaborate with selected<br />
vendors, so that they can supply us with raw<br />
materials that have an improved environmental<br />
footprint. At the other end of the chain, we help<br />
our customers and consumers to reduce their<br />
own environmental footprint.<br />
Our people make the difference – through their<br />
dedication, skills and knowledge. They make<br />
their own contributions to sustainable development,<br />
both in their day-to-day business and as<br />
members of society. They interface with our customers<br />
and consumers, make innovation possible,<br />
develop successful strategies, and give our<br />
company its unique identity.<br />
Organization<br />
The <strong>Henkel</strong> Management Board bears overall<br />
responsibility for our sustainability strategy and<br />
objectives, and hence the pursuit thereof within<br />
the corporation. <strong>Henkel</strong>’s Sustainability <strong>Co</strong>uncil<br />
steers our global sustainability activities in collaboration<br />
with the individual business sectors<br />
and functions, and our regional and national<br />
affiliated companies.<br />
Our understanding of socially responsible behavior<br />
has been specified and communicated to our<br />
employees throughout the entire Group in our<br />
<strong>Co</strong>de of <strong>Co</strong>rporate Sustainability and our <strong>Co</strong>de of<br />
<strong>Co</strong>nduct. From these codes are derived our more<br />
detailed internal standards governing safety,<br />
health and environmental protection, our social<br />
standards and our Group purchasing standards.<br />
<strong>Co</strong>mpliance with these rules and requirements is<br />
regularly monitored throughout the Group by<br />
<strong>Henkel</strong> <strong>Annual</strong> <strong>Report</strong> <strong>2011</strong><br />
internal audits performed at our production and<br />
administration sites, and also – increasingly –<br />
audits at our toll and contract manufacturers and<br />
logistics centers.<br />
By joining the United Nations Global <strong>Co</strong>mpact in<br />
July 2003, we also publicly underscored our commitment<br />
to respect human rights and fundamental<br />
labor standards, to promote environmental<br />
protection and to work against all forms of corruption.<br />
Stakeholder dialogue<br />
Viable solutions promoting sustainability can<br />
only be developed in dialogue with all the relevant<br />
social groups. These include our employees,<br />
shareholders, customers, suppliers, civil authorities,<br />
politicians, associations, governmental and<br />
non-governmental organizations, academia and<br />
the public at large. We view interaction with our<br />
stakeholders as an opportunity to identify the<br />
needs of our different markets at an early stage<br />
and to define the directions which our activities<br />
should take. Our dialogue with various stakeholder<br />
groups enables us to access new ideas for<br />
our company, which flow continuously into our<br />
strategy development and reporting.<br />
We deploy a wide range of communication instruments<br />
in order to meet the specific information<br />
requirements of our stakeholders, ranging<br />
from our own publications and technical articles<br />
to events and direct contact. More details and<br />
background reading on the subject of sustainability<br />
can be found in our Sustainability <strong>Report</strong>.<br />
With this, we document the high priority<br />
assigned to the pursuit of sustainable development<br />
by our company, at the same time satisfying<br />
the reporting obligations laid down in the<br />
United Nations Global <strong>Co</strong>mpact.<br />
Further information, reports, background details<br />
and the latest news on sustainable development<br />
at <strong>Henkel</strong> can be found on our website:<br />
www.henkel.com/sustainability
<strong>Henkel</strong> <strong>Annual</strong> <strong>Report</strong> <strong>2011</strong> Group management report<br />
Value-based management and control system<br />
51<br />
Value-based management and<br />
control system<br />
We align our corporate management and control<br />
activities to the overall objective of achieving a<br />
sustainable increase in shareholder value. To make<br />
achievement of our growth targets measurable,<br />
we have adopted a modern system of metrics<br />
with which we calculate value-added and return<br />
ratios in line with capital market practice.<br />
We use economic value added (EVA ® ) 1 to assess<br />
growth to date and to appraise future plans.<br />
EVA ® is a measure of the surplus financial value<br />
generated by a company over a certain period.<br />
A company creates economic value added if its<br />
operating profit exceeds its cost of capital, the<br />
latter being defined as the return on capital expected<br />
by the capital market.<br />
Operational business performance is measured<br />
on the basis of operating profit (EBIT) adjusted<br />
for any goodwill impairment losses. The capital<br />
employed figure is calculated from the assets side<br />
of the statement of financial position. A re conciliation<br />
of the year-end figures in that financial<br />
state ment to the average values used in determining<br />
capital employed can be found on page 147.<br />
The cost of capital employed is calculated as<br />
a weighted average of the cost of capital (WACC)<br />
comprising both equity and debt. In fiscal <strong>2011</strong><br />
we applied a WACC after tax of 6.5 percent. Before<br />
tax, the figure was 9.0 percent. We regularly review<br />
our cost of capital in order to reflect changing<br />
market conditions. Starting fiscal 2012, therefore,<br />
we have adopted a WACC of 9.5 percent before tax<br />
and 6.5 percent after tax.<br />
We further apply different WACC rates depending<br />
on the business sector involved. This is based<br />
on sector-specific beta factors taken from a peer<br />
group benchmark. In fiscal <strong>2011</strong>, this resulted in<br />
a WACC before tax of 9.0 percent (6.5 percent after<br />
tax) for both Laundry & Home Care and <strong>Co</strong>smetics/<br />
Toiletries, and of 10.5 percent before tax (7.5 percent<br />
after tax) for Adhesive Technologies. In 2012<br />
we are applying a WACC of 9.5 percent before tax<br />
(6.5 percent after tax) for the business sectors<br />
Laundry & Home Care and <strong>Co</strong>smetics/Toiletries,<br />
and 11.5 percent before tax (8.0 percent after tax)<br />
for Adhesive Technologies.<br />
1 EVA ® is a registered trademark of Stern Stewart & <strong>Co</strong>.<br />
Weighted average cost of capital (WACC)<br />
<strong>2011</strong> from 2012<br />
Risk-free interest rate 3.3 % 3.5 %<br />
Market risk premium 4.5 % 4.5 %<br />
Beta factor 0.8 0.8<br />
<strong>Co</strong>st of equity after tax 6.8% 7.1 %<br />
<strong>Co</strong>st of debt capital before tax 4.1 % 4.7 %<br />
Tax shield (30 %) – 1.2 % – 1.4 %<br />
<strong>Co</strong>st of debt capital after tax 2.9% 3.3 %<br />
Share of equity 1<br />
(peer group structure)<br />
Share of debt capital 1<br />
85 % 85 %<br />
(peer group structure) 15 % 15 %<br />
WACC after tax2 6.5% 6.5 %<br />
Tax rate 30 % 30 %<br />
WACC before tax2 9.0% 9.5 %<br />
1 At market values.<br />
2 Rounded.<br />
WACC before tax by business sector<br />
<strong>2011</strong> from 2012<br />
Laundry & Home Care 9.0 % 9.5 %<br />
<strong>Co</strong>smetics/Toiletries 9.0 % 9.5 %<br />
Adhesive Technologies 10.5 % 11.5 %<br />
9.0%<br />
Group WACC before tax in<br />
fiscal <strong>2011</strong>.
52<br />
Group management report<br />
Value-based management and control system<br />
848 million<br />
euros<br />
economic value added (EVA ® )<br />
in <strong>2011</strong>.<br />
EVA ® and ROCE<br />
EVA ® serves to promote value-added decisions<br />
and profitable growth in all our business sectors.<br />
Operations exhibiting negative value contributions<br />
with no prospect of positive EVA ® in the<br />
future are divested or otherwise discontinued.<br />
At <strong>Henkel</strong>, EVA ® is calculated as follows:<br />
EVA ® = EBIT * – (Capital Employed x WACC).<br />
In order to be better able to compare business<br />
units of varying size, we additionally apply return<br />
on capital employed, calculated as follows:<br />
ROCE = EBIT * ÷ Capital Employed.<br />
ROCE represents the return on average capital<br />
employed. We create value where this metric<br />
exceeds the cost of capital before tax.<br />
In fiscal <strong>2011</strong>, the <strong>Henkel</strong> Group posted positive<br />
economic value added (EVA ® ) amounting to<br />
EVA ® and ROCE 1<br />
848 million euros, an increase of 279 million euros<br />
(+49.0 percent) above the prior-year figure. This<br />
is attributable to both the very strong rise in operating<br />
profit and a decrease in capital employed.<br />
All our business sectors posted a positive EVA ® .<br />
At Laundry & Home Care, the figure was 303 million<br />
euros, 5.7 percent above the prior-year level,<br />
resulting from a very strong reduction in capital<br />
employed. <strong>Co</strong>smetics/Toiletries generated EVA ® of<br />
290 million euros, a major plus of 40.6 per cent versus<br />
2010 achieved thanks to a substantial increase<br />
in operating profit. At Adhesive Technologies, we<br />
increased our EVA ® to 282 million euros, a rise of<br />
209 million euros, due both to the significant<br />
improvement in operating profit and a reduction<br />
in capital employed compared to the previous<br />
year.<br />
ROCE increased from 14.9 percent to 16.6 percent.<br />
This is essentially due to the very strong development<br />
in operating profit and a reduction in the<br />
level of capital employed.<br />
Laundry & <strong>Co</strong>smetics/ Adhesive <strong>Henkel</strong> Group<br />
in million euros<br />
Home Care Toiletries Technologies<br />
EBIT * 511 471 1,002 1,857<br />
Capital employed 2,314 2,001 6,853 11,208<br />
<strong>Co</strong>st of capital2 208 180 720 1,0093<br />
EVA ® <strong>2011</strong> 303 290 282 8483<br />
EVA ® 2010 286 207 73 5694<br />
ROCE <strong>2011</strong> 22.1% 23.5% 14.6% 16.6%<br />
ROCE 2010 21.2 % 20.1 % 12.5 % 14.9%<br />
1 Calculated on the basis of units of 1,000 euros.<br />
2 Calculated on the basis of the different sector-specific WACC rates applied.<br />
3 Calculated on the basis of a WACC rate of 9.0 percent for the <strong>Henkel</strong> Group.<br />
4 Calculated on the basis of a WACC rate of 10.0 percent for the <strong>Henkel</strong> Group.<br />
* Adjusted for goodwill impairment losses.<br />
<strong>Henkel</strong> <strong>Annual</strong> <strong>Report</strong> <strong>2011</strong>
<strong>Henkel</strong> <strong>Annual</strong> <strong>Report</strong> <strong>2011</strong> Group management report<br />
Value-based management and control system / Business performance<br />
53<br />
Statutory and regulatory situation<br />
Our business is governed by national rules and<br />
regulations and – within the European Union<br />
(EU) – increasingly by harmonized pan-European<br />
laws. In addition, some of our operations are<br />
subject to rules and regulations derived from<br />
approvals, licenses, certificates or permits.<br />
Our manufacturing operations are bound by<br />
rules and regulations with respect to the usage,<br />
storage, transportation and handling of certain<br />
substances and also in relation to emissions,<br />
wastewater, effluent and other waste. The construction<br />
and operation of production facilities<br />
and other plant and equipment are likewise<br />
governed by framework rules and regulations –<br />
including those relating to the decontamination<br />
of soil.<br />
Product-specific regulations of relevance to us<br />
relate in particular to ingredients and input<br />
materials, safety of manufacture, the handling<br />
of products and their constituents, and the packaging<br />
and marketing of these items. The control<br />
mechanisms include statutory material-related<br />
regulations, usage prohibitions or restrictions,<br />
procedural requirements (test and inspection,<br />
identification marking, provision of warning<br />
labels, etc.), and product liability law.<br />
Our internal standards are geared to ensuring<br />
compliance with statutory regulations and<br />
the safety of our manufacturing facilities and<br />
products. The associated requirements have been<br />
incorporated within, and implemented through,<br />
our management systems, and are subject to a<br />
regular audit and review regime. This includes<br />
monitoring and evaluating relevant statutory and<br />
regulatory requirements and changes.<br />
One important statutory instrument affecting<br />
us is the European regulation on the registration,<br />
evaluation, authorization and restriction of<br />
chemicals – Regulation (EC) No. 1907/2006, abbreviation:<br />
REACH. This regulation primarily<br />
addresses <strong>Henkel</strong> as a user of chemical materials;<br />
however, it also affects us as an importer<br />
and manufacturer. In order to ensure the efficient<br />
implementation of the associated requirements,<br />
we have established a central REACH<br />
management team for handling and controlling<br />
the main REACH processes.<br />
Business performance<br />
World economy<br />
Overview:<br />
Global economic slow-down<br />
Following the semi-recovery in 2010, the world<br />
economy 1 cooled down again in <strong>2011</strong>. Global gross<br />
domestic product increased by 2.6 percent. While<br />
the emerging regions registered a rise of 5.4 percent,<br />
the industrialized countries exceeded the<br />
prior-year level by a mere 1.3 percent. Persistently<br />
high risks emanating from the debt crises in<br />
Europe and the USA, and the decline in growth<br />
in Asia resulting from the measures introduced<br />
to combat inflation, had an adverse effect on<br />
economic development and also increasingly<br />
dampened investor and private consumer<br />
confidence.<br />
Developments in <strong>2011</strong>:<br />
Declining dynamism as the year progressed<br />
After the rapid, strong recovery from the severe<br />
recession during the period from 2010 to the first<br />
quarter of <strong>2011</strong>, the global business environment<br />
exhibited a decrease in dynamism in the remainder<br />
of the year.<br />
Industry and consumption:<br />
Further increase in industrial output<br />
With growth of around 6 percent, industrial production<br />
again expanded faster than private<br />
consumption, the latter rising by about 3 percent.<br />
While the export-dependent industries in particular<br />
posted – in part – significant increases,<br />
developments in the consumer-related sectors<br />
were correspondingly sluggish.<br />
Regions:<br />
Mature markets restrained,<br />
emerging regions robust<br />
Expansion in Western Europe’s gross domestic<br />
product was generally weak. With a plus of 3 percent<br />
in Germany, however, the region was able<br />
to achieve growth of just over 1.5 percent. The<br />
North American economy likewise grew very<br />
little through the year as a whole. <strong>Co</strong>mpared to<br />
the previous year, the region registered an increase<br />
in economic output of just over 1.5 percent.<br />
High commodity prices and a high unemployment<br />
rate, combined with only moderate<br />
increases in disposable income, greatly inhibited<br />
private consumption as a growth driver. Japan’s<br />
economy contracted by around half a per cent as a<br />
result of its natural disaster. The emerging mar-<br />
1 Source of world economic data:<br />
Feri EuroRating Services, January 2012.
54<br />
Group management report<br />
Business performance<br />
kets of Eastern Europe, Asia (excluding Japan),<br />
Latin America and Africa/Middle East exhibited<br />
robust economic growth compared to the previous<br />
year. In Eastern Europe, economic recovery continued<br />
with growth of around 3 percent. Russia<br />
stood out as one of the more dynamic economies<br />
of the region, posting expansion of 4 percent.<br />
Latin America registered strong growth of about<br />
5 percent. The emerging countries of Asia increased<br />
their economic output by around 7 per cent, with<br />
India and China once again leading the way.<br />
Raw material prices:<br />
Strong increase across the board<br />
The high demand for raw materials, particularly in<br />
the emerging countries of Asia, led to a substantial<br />
rise in the associated prices in the course of<br />
the year under review. <strong>Co</strong>mmodities subject to<br />
these price developments included crude oil,<br />
ethylene, propylene, palm kernel oil, paper and<br />
metals. At around 110 US dollars per barrel, for<br />
example, the average price for crude oil for the<br />
year was almost 30 dollars above the level of the<br />
previous year. Raw material prices stabilized at a<br />
high level during the second half of the year due<br />
to the general global decline in economic growth<br />
rates.<br />
Currencies:<br />
Euro in the throes of the European financial crisis<br />
Taking the annual average for <strong>2011</strong>, the euro<br />
appreciated slightly against the US dollar, from<br />
1.33 to 1.39. However, there was no clear trend as<br />
the year progressed. At the beginning of <strong>2011</strong> the<br />
euro rose steadily, occasionally reaching levels<br />
above 1.46 US dollars around the middle of the<br />
year. By the end of the third quarter, however, the<br />
euro was again trending weaker, and at the end<br />
of the year it had hit a low of 1.29 US dollars, with<br />
the European debt crisis as the primary cause.<br />
Developments in the exchange rates of currencies<br />
important to <strong>Henkel</strong> are indicated in the following<br />
table:<br />
Average rates of exchange versus the euro<br />
<strong>Henkel</strong> <strong>Annual</strong> <strong>Report</strong> <strong>2011</strong><br />
2010 <strong>2011</strong><br />
Chinese yuan 8.98 8.99<br />
Mexican peso 16.75 17.31<br />
Polish zloty 4.00 4.13<br />
Russian ruble 40.26 40.91<br />
US dollar 1.33 1.39<br />
Inflation:<br />
Rise in global price levels<br />
Global inflation has risen from just under 3 to<br />
4 percent, due mainly to the strong increase in<br />
commodity prices. <strong>Co</strong>nsumer prices have risen<br />
in all regions, although developments were very<br />
mixed from one country to another. In North<br />
America and in Western Europe – and here particularly<br />
in Germany – inflation underwent a<br />
substantial rise. By contrast, developments in<br />
Japan were persistently deflationary. In China,<br />
inflation rose significantly, driven by strong<br />
growth coupled with high price increases,<br />
particularly for food products.<br />
Unemployment:<br />
Slight global decline to around 7 percent<br />
In the industrialized regions, unemployment<br />
decreased slightly to 8 percent. In North America,<br />
the figure has remained high at around 9 percent.<br />
The labor market in Germany developed<br />
positively with the unemployment rate falling<br />
to just under 7 percent, noticeably below the<br />
prior-year figure. In the emerging regions, unemployment<br />
rates remained stable at about 7 percent.<br />
Around the world, unemployment decreased<br />
slightly to approximately 7 percent.<br />
Developments by sector:<br />
Slight increase in consumption<br />
Growth in private consumer spending remained<br />
sluggish at around 3 percent. In the industrialized<br />
countries, consumers only spent 1 percent more<br />
in <strong>2011</strong> than in 2010. <strong>Co</strong>nsumers in North America<br />
increased their spend by about 2 percent. In<br />
Western Europe, consumer spending was only<br />
marginally above the prior-year level, with the
<strong>Henkel</strong> <strong>Annual</strong> <strong>Report</strong> <strong>2011</strong> Group management report<br />
Business performance<br />
55<br />
rise coming primarily from Germany’s increase of<br />
about 1 percent. The emerging regions exhibited a<br />
higher propensity to consume with a plus of<br />
around 5 percent, matching the overall rate of<br />
regional economic expansion.<br />
Industry shows robust growth<br />
With growth of 6 percent, industrial production<br />
continued to increase more rapidly than the<br />
economy as a whole. The primary drivers in this<br />
development were the export-dependent industries,<br />
and here particularly electrical and electronic<br />
engineering, the transport sector and metal processing,<br />
each of which saw output substantially<br />
rise, benefiting from the increase in investment<br />
activity in the industrialized nations, and brisk<br />
export activity.<br />
However, developments in industrial production<br />
were very mixed at the regional level. Manufacturing<br />
in Western Europe and North America<br />
expanded by something over 4 percent. Asia’s<br />
industrial output grew by around 8 percent.<br />
The contributions of the emerging countries of<br />
China, South Korea and India were particularly<br />
prominent in this regard, while Japanese manufacturing<br />
declined due to the natural and nuclear<br />
disasters suffered by that country.<br />
Our important customer industries of transport<br />
and electronics saw production expand considerably,<br />
by around 7 percent. Strong growth was also<br />
generated in the automotive industry. Within the<br />
electronics sector, growth of relevance to us in<br />
basic products such as microchips and printed<br />
circuit boards was only slightly positive. Growth<br />
in the metals industry was a robust 8 percent. However,<br />
expansion in the consumer-related sectors<br />
such as the global packaging industry was sluggish,<br />
joining food products, beverages, paper and<br />
printing with growth in the lower single-digit<br />
range. After several years of decline, construction<br />
avoided contraction in <strong>2011</strong>. While building<br />
activity in the emerging regions was extremely<br />
brisk, North America and Western Europe registered<br />
declines of 9 and 1 percent respectively.<br />
Review of overall business performance<br />
<strong>Henkel</strong>’s business performance was influenced<br />
by the challenging market environment outlined<br />
above. In the course of the year, the rate of world<br />
economic growth slackened. Despite persistent<br />
threats such as the debt crises in Europe and the<br />
USA, the consequences of the political unrest in<br />
North Africa, the environmental disaster in Japan<br />
and the decline in growth in Asia, we achieved an<br />
organic sales increase of 5.9 percent, exceeding our<br />
guidance of 3 to 5 percent. In all our business<br />
sectors we continued to outpace our relevant markets.<br />
We also increased the share of sales accounted<br />
for by our emerging markets to 42 percent.<br />
The prices for our total direct materials rose on<br />
our procurement markets in the course of the<br />
year, stabilizing at a high level during the second<br />
half. We were able to extensively mitigate the<br />
negative impact of this development, although not<br />
completely offset it, by introducing appropriate<br />
countermeasures such as increasing our own<br />
selling prices and implementing projects designed<br />
to achieve cost reductions in production and supply<br />
chain. Overall, adjusted 1 gross margin decreased<br />
by 1.3 percentage points to 45.8 percent.<br />
Nevertheless, with an adjusted return on sales<br />
figure of 13.0 percent, we were able to fulfill our<br />
guidance, improving our profitability compared<br />
to the previous year by 0.7 percentage points – a<br />
significant step in the direction of the 14 percent<br />
targeted for 2012. Reflected in these results are<br />
the savings successfully achieved from our accelerated<br />
initiatives to align our structures to our<br />
markets and customers. The expansion of our<br />
shared service centers with the opening of a<br />
third site in Mexico City further reduced the<br />
overheads component in our costs.<br />
We continued optimizing our portfolio through<br />
the sale of non-core businesses in <strong>2011</strong>: In the<br />
second quarter, we disposed of our branded consumer<br />
goods business in India and also the<br />
roofing membrane business operated by Adhesive<br />
Technologies. We have reduced the complexity<br />
of our brands portfolio from an original basket of<br />
over 1,000 to a current total of about 400. This<br />
enables us to focus more strongly on our top brands<br />
and fully exploit the opportunities available to<br />
us in our core businesses.<br />
1 Adjusted for one-time charges/gains and restructuring charges.
56<br />
Sales<br />
in million euros<br />
2007 13,074<br />
2008 14,131<br />
2009 13,573<br />
2010 15,092<br />
<strong>2011</strong> 15,605<br />
Group management report<br />
Business performance<br />
Sales by business<br />
sector *<br />
in million euros<br />
Laundry & Home Care<br />
2010 4,319<br />
<strong>2011</strong> 4,304<br />
2010<br />
<strong>Co</strong>smetics/Toiletries<br />
3,269<br />
<strong>2011</strong> 3,399<br />
2010<br />
Adhesive Technologies<br />
7,306<br />
<strong>2011</strong> 7,746<br />
* Excluding <strong>Co</strong>rporate.<br />
In response to our continuing good business<br />
performance and our improved financial profile,<br />
we also regained our target ratings of “A flat”<br />
(Standard & Poor’s) and “A2” (Moody’s) in the second<br />
quarter. Our financial ratios have improved<br />
significantly: Thanks to strong cash flows from<br />
operating activities, the net debt of the <strong>Henkel</strong><br />
Group decreased to 1.7 billion euros (–28 percent)<br />
in the course of the year. We also increased our<br />
operating debt coverage from 71 to 83 per cent.<br />
Overall, we have a solid long-term financing structure<br />
and sufficient liquidity reserves for us to<br />
exploit opportunities in value-creating external<br />
growth, provided that these do not jeopardize<br />
our regained target ratings in the long term.<br />
As a front-runner in sustainability, we intend<br />
to introduce new solutions to meet the challenges<br />
of sustainable development and to further<br />
develop our business by generating economic<br />
success based on responsibility. Having achieved<br />
our sustainability targets for 2012 ahead of<br />
schedule in 2010, we extended our sustainability<br />
strategy in the year under review through to the<br />
year 2030 with the adoption of our “Factor 3”<br />
objective: Within the next 20 years, we want to<br />
triple the value that we create with our business<br />
activities in relation to the ecological footprint<br />
caused by our products and services.<br />
The highly gratifying results of fiscal <strong>2011</strong> took<br />
us a further important step closer to achieving our<br />
ambitious financial targets for 2012.<br />
Sales and profits<br />
In a challenging economic environment, <strong>Henkel</strong><br />
Group sales grew to 15,605 million euros in <strong>2011</strong>,<br />
a rise of 3.4 percent versus prior year. After adjusting<br />
for foreign exchange, sales increased by<br />
5.3 percent. In organic terms (i.e. after adjusting<br />
for foreign exchange and acquisitions/divestments),<br />
sales improved by a high 5.9 percent. Half<br />
of this rise was attributable to the increase in our<br />
selling prices, particularly in the Adhesive Technologies<br />
business sector, reflected in a price<br />
effect of 3.0 percent.<br />
In the course of the financial year, the rate of our<br />
revenue increase declined somewhat against the<br />
backdrop of slowing world economic expansion.<br />
While organic growth in the first half of the year<br />
came in at 6.7 percent, in the second half it eased,<br />
albeit to a still substantial 5.2 percent.<br />
Sales development 1<br />
in percent <strong>2011</strong><br />
Change versus previous year 3.4<br />
Foreign exchange –1.9<br />
Adjusted for foreign exchange 5.3<br />
Acquisitions/divestments –0.6<br />
Organic 5.9<br />
of which price 3.0<br />
of which volume 2.9<br />
1 Calculated on the basis of units of 1,000 euros.<br />
We posted increases in organic sales in each of<br />
our business sectors, further expanding our share<br />
of relevant markets. Adhesive Technologies was<br />
able to increase organic sales by 8.3 percent to<br />
a new high of 7,746 million euros. The <strong>Co</strong>smetics/<br />
Toiletries business sector continued its positive<br />
revenue trend of recent years and, with growth<br />
of 5.4 percent, significantly outperformed a predominantly<br />
declining market. Laundry & Home<br />
Care achieved an increase in organic sales of<br />
2.9 percent within a slightly declining market.<br />
Price and volume effects<br />
in percent<br />
Organic<br />
sales<br />
growth<br />
<strong>Henkel</strong> <strong>Annual</strong> <strong>Report</strong> <strong>2011</strong><br />
of which<br />
price<br />
of which<br />
volume<br />
Laundry & Home<br />
Care<br />
<strong>Co</strong>smetics/<br />
2.9 1.6 1.3<br />
Toiletries<br />
Adhesive<br />
5.4 –0.3 5.7<br />
Technologies 8.3 5.3 3.0<br />
<strong>Henkel</strong> Group 5.9 3.0 2.9<br />
We were able to further grow revenues in almost<br />
all our regions, except for North America:<br />
In the highly competitive market environment<br />
of Western Europe, we increased sales by 2.8 percent<br />
to 5,624 million euros. Organic sales growth<br />
amounted to 2.3 percent, driven primarily by<br />
expansion in Germany and France. The share of<br />
sales accounted for by the region remained stable<br />
at 36 percent.<br />
We increased sales in Eastern Europe by 6.2 percent<br />
to 2,813 million euros. The organic sales<br />
growth of 10.3 percent was generated primarily as<br />
a result of business expansion in Turkey and the<br />
successes of our adhesives business in Russia.<br />
The region’s share of consolidated sales stayed<br />
at 18 percent.
<strong>Henkel</strong> <strong>Annual</strong> <strong>Report</strong> <strong>2011</strong> Group management report<br />
Business performance<br />
57<br />
Growth in the Africa/Middle East region was<br />
adversely affected by the political unrest in some<br />
countries. This meant that – unlike in previous<br />
years – we were unable to achieve the usual doubledigit<br />
nominal growth rates. In fact, revenues<br />
rose by 3.7 percent to 934 million euros, although<br />
organic sales growth did pass the double-digit<br />
mark with a 10.0 percent increase, achieved as<br />
a result of double-digit growth rates in the United<br />
Arab Emirates, Saudi Arabia and Algeria. The<br />
share of sales of the region was unchanged at<br />
6 percent.<br />
Due to foreign exchange factors, sales of the North<br />
America region decreased slightly, by 0.3 percent<br />
to 2,716 million euros. Despite a reluctant consumer<br />
climate in the USA, organic sales growth of the<br />
region came in at 4.4 percent. Even our Laundry<br />
& Home Care business sector, which underwent<br />
organic contraction at the beginning of the<br />
year due to declining markets and persistently<br />
tough compe titive pressures, saw organic sales<br />
slightly increase. The share of sales of the region<br />
decreased from 18 to 17 percent.<br />
The Latin America region continued to develop<br />
well, posting sales growth of 8.4 percent to<br />
1,065 million euros. The double-digit organic<br />
growth rate of 11.0 percent was driven in particular<br />
by our business performance in Mexico, Brazil<br />
and Venezuela. The share of sales of the region<br />
remained at the prior-year level of 7 percent.<br />
Within the Asia-Pacific region, the consequen ces<br />
of the natural disaster in Japan exerted a dampening<br />
influence on regional sales growth. This<br />
amounted to 5.9 percent, taking the total to<br />
2,296 million euros. With an organic growth rate<br />
of 8.6 percent, however, the region continued to<br />
exhibit positive development, driven particularly<br />
by double-digit rates of expansion in China,<br />
India and South Korea. Asia-Pacific increased its<br />
share of sales compared to the previous year<br />
from 14 to 15 percent.<br />
Sales in the emerging markets of Eastern Europe,<br />
Africa/Middle East, Latin America and Asia<br />
(excluding Japan) increased by 6.2 percent to<br />
6,512 million euros. Organic growth reached 10.8<br />
percent with contributions coming particularly<br />
from the business sectors Adhesive Technologies<br />
and <strong>Co</strong>smetics/Toiletries, both of which posted<br />
double-digit increases. The share of sales of our<br />
emerging markets rose from 41 to 42 percent.<br />
In our effort to continuously adapt our structures<br />
to our markets and customers, we increased our<br />
restructuring charges from 184 million euros to<br />
227 million euros, with the focus primarily on<br />
Western Europe. We further expanded our shared<br />
service centers, reorganized our Laundry & Home<br />
Care business sector for enhanced efficiency, and<br />
further optimized the production footprint serving<br />
our Adhesive Technologies business sector.<br />
To make the development of our underlying<br />
operating activities more transparent, in the following<br />
we discuss the earnings of our business<br />
sectors after adjusting for one-time charges/gains<br />
and restructuring charges:<br />
Adjusted operating profit (EBIT)<br />
in million euros 2010 <strong>2011</strong> %<br />
EBIT (as reported) 1,723 1,857 7.8<br />
One-time gains –59 –57<br />
One-time charges 14 2<br />
Restructuring charges 184 227<br />
Adjusted EBIT 1,862 2,029 9.0<br />
Our adjusted operating profit (adjusted EBIT)<br />
increased by 9.0 percent, from 1,862 million euros<br />
in 2010 to 2,029 million euros, with all our business<br />
sectors contributing. Despite the burdens<br />
arising from the substantial increase in prices on<br />
our procurement markets, the Group’s adjusted<br />
return on sales (adjusted EBIT margin) improved<br />
by 0.7 percentage points to 13.0 percent, thus<br />
reaching our guidance.<br />
The most significant improvement in margin was<br />
achieved by Adhesive Technologies with an increase<br />
from 12.8 to 13.9 percent. This was achieved<br />
on the back of both increases in our selling prices<br />
and the ongoing success of our cost management<br />
activities. The <strong>Co</strong>smetics/Toiletries business<br />
sector increased its adjusted return on sales by<br />
0.9 percentage points to 14.2 percent (previous<br />
year: 13.3 percent). This likewise reflects a combination<br />
of gratifying sales growth and efficiency<br />
enhancements. The Laundry & Home Care business<br />
sector saw its profitability grow despite strongly<br />
increased material prices, reaching 13.2 percent<br />
in <strong>2011</strong> (previous year: 13.0 percent).<br />
Further details relating to our business performance<br />
can also be found in the individual reports<br />
dealing with our business sectors, which begin<br />
on page 76.<br />
Sales by region *<br />
in million euros<br />
Western Europe<br />
2010 5,470<br />
<strong>2011</strong> 5,624<br />
2010<br />
Eastern Europe<br />
2,649<br />
<strong>2011</strong> 2,813<br />
2010<br />
Africa/Middle East<br />
901<br />
<strong>2011</strong> 934<br />
2010<br />
North America<br />
2,724<br />
<strong>2011</strong> 2,716<br />
Latin America<br />
2010 982<br />
<strong>2011</strong> 1,065<br />
2010<br />
Asia-Pacific<br />
2,168<br />
<strong>2011</strong> 2,296<br />
* Excluding <strong>Co</strong>rporate.<br />
EBIT by region *<br />
in million euros<br />
Western Europe<br />
2010 706<br />
<strong>2011</strong> 767<br />
2010<br />
Eastern Europe<br />
314<br />
<strong>2011</strong> 384<br />
2010<br />
Africa/Middle East<br />
81<br />
<strong>2011</strong> 79<br />
2010<br />
North America<br />
320<br />
<strong>2011</strong> 289<br />
2010<br />
Latin America<br />
104<br />
<strong>2011</strong> 105<br />
2010<br />
Asia-Pacific<br />
306<br />
<strong>2011</strong> 360<br />
* Excluding <strong>Co</strong>rporate.
58<br />
Group management report<br />
Business performance<br />
Guidance versus performance <strong>2011</strong><br />
Guidance <strong>2011</strong> Performance <strong>2011</strong><br />
Organic sales growth<br />
Outperform relevant market development<br />
Laundry & Home Care: +2.9 percent<br />
(relevant market: slight decline)<br />
<strong>Co</strong>smetics/Toiletries: +5.4 percent<br />
(relevant market: predominantly<br />
declining)<br />
Adhesive Technologies: +8.3 percent<br />
(relevant market: low single-digit growth)<br />
Adjusted return on sales Increase to around 13 percent Increase to 13.0 percent<br />
Adjusted earnings per preferred share Increase of around 10 percent Increase of 11.3 percent<br />
<strong>Co</strong>mparison between actual business performance<br />
and guidance<br />
In our report for fiscal 2010, we offered guidance<br />
for the coming financial year of <strong>2011</strong> indicating<br />
that we intended to once again outperform our<br />
relevant markets in terms of organic sales growth,<br />
expec ting an increase within the range of 3 to<br />
5 percent. Building on the figures of 2010, we<br />
anticipated adjusted return on sales (EBIT) to<br />
increase to around 13 percent, and adjusted earnings<br />
per preferred share to undergo a rise of<br />
around 10 percent.<br />
Although the price rises encountered for our total<br />
direct materials were higher than budgeted,<br />
we succeeded in delivering in full our sales and<br />
earnings guidance: With an organic growth rate<br />
of 5.9 percent, we actually exceeded the guidance<br />
corridor. In all three business sectors, we posted<br />
organic growth rates above those of the relevant<br />
markets. At Group level, we achieved a significant<br />
increase in adjusted return on sales from 12.3 to<br />
13.0 percent, and also an improvement in adjusted<br />
earnings per preferred share of 11.3 percent to<br />
3.14 euros (2010: 2.82 euros).<br />
In our 2010 annual report, moreover, we indicated<br />
that we expected the increase in the prices for<br />
raw materials, packaging, contract manufacturing<br />
and traded goods to be in the high single-digit<br />
percentage range. The actual price increase was<br />
in the low double-digit range and therefore higher<br />
than expected.<br />
Expense items<br />
<strong>Henkel</strong> <strong>Annual</strong> <strong>Report</strong> <strong>2011</strong><br />
In the following, we discuss our operating expenses<br />
adjusted for one-time charges/gains and<br />
restructuring charges. The reconciliation statement<br />
and also the allocation of the restructuring<br />
charges to the various items of the statement of<br />
income can be found on page 100.<br />
The cost of sales in <strong>2011</strong> outstripped the increase<br />
in revenues, coming in 5.9 percentage points<br />
higher at 8,455 million euros due to the rise in raw<br />
material prices. Gross profit rose to 7,150 million<br />
euros, while our gross margin decreased by<br />
–1.3 percentage points to 45.8 percent. The negative<br />
impact from the cost of sales rise was about<br />
80 percent offset by increases in our selling prices,<br />
savings from cost reduction measures, and<br />
efficiency improvements in both production and<br />
supply chain.<br />
At 4,081 million euros, marketing, selling and<br />
distribution expenses decreased by 3.5 percent<br />
compared to the figure for the previous year. We<br />
were able to make our sales and distribution processes<br />
more efficient. Lower marketing expenditures<br />
reflected a market environment characterized<br />
by a decline in general advertising<br />
expenditures.<br />
We spent a total of 396 million euros on research<br />
and development. Our R&D ratio (R&D expenses<br />
expressed as a proportion of sales) therefore remained<br />
constant versus prior year at 2.5 percent.
<strong>Henkel</strong> <strong>Annual</strong> <strong>Report</strong> <strong>2011</strong> Group management report<br />
Business performance<br />
59<br />
Reconciliation from sales to adjusted operating profit<br />
in million euros 2010 % <strong>2011</strong> % Change<br />
Sales 15,092 100.0 15,605 100.0 3.4%<br />
<strong>Co</strong>st of sales –7,983 –52.9 –8,455 –54.2 5.9 %<br />
Gross profit 7,109 47.1 7,150 45.8 0.6%<br />
Marketing, selling and distribution expenses –4,229 –28.1 –4,081 –26.2 –3.5 %<br />
Research and development expenses –383 –2.5 –396 –2.5 3.4 %<br />
Administrative expenses –711 –4.7 –706 –4.5 – 0.7 %<br />
Other operating income/charges 76 0.5 62 0.4 –18.4 %<br />
Adjusted operating profit (EBIT) 1,862 12.3 2,029 13.0 9.0%<br />
The share of administrative expenses related to<br />
sales decreased from 4.7 percent to 4.5 percent, a<br />
develop ment to which the expansion of our<br />
shared service centers significantly contributed.<br />
Other operating income and charges<br />
The balance of adjusted other operating income<br />
and charges decreased by 14 million euros to<br />
62 million euros. This was due to lower gains<br />
from the disposal of non-current assets and writeups,<br />
and also a decline in numerous individual<br />
gains from our operating activities, for example<br />
insurance payouts and similar income.<br />
Financial result<br />
Overall, our financial result improved by 16 million<br />
euros to –155 million euros, attributable primarily<br />
to the reduction in our net debt.<br />
Net income<br />
Income before tax increased by 150 million euros<br />
to 1,702 million euros. Taxes on income amounted<br />
to 419 million euros. The tax rate was 24.6 percent,<br />
a decrease of 1.8 percentage points compared to the<br />
previous year. This was due to positive one-time<br />
effects arising from successfully concluded tax<br />
audits relating to previous years. The adjusted tax<br />
rate was 26.0 percent (previous year: 26.6 percent).<br />
Net income for the year increased by 12.2 percent,<br />
from 1,143 million euros to 1,283 million euros.<br />
After deducting non-controlling interests of<br />
30 million euros, net income totaled 1,253 million<br />
euros (+12.1 percent). Adjusted net income after<br />
non-controlling interests rose by 11.4 percent to<br />
1,356 million euros. The annual financial statements<br />
of <strong>Henkel</strong> <strong>AG</strong> & <strong>Co</strong>. <strong>KGaA</strong>, parent of the<br />
<strong>Henkel</strong> Group, are summarized on page 152.<br />
Dividends<br />
According to our financial strategy, our dividend<br />
payout ratio should be around 25 percent of the<br />
net income attributable to shareholders of <strong>Henkel</strong><br />
<strong>AG</strong> & <strong>Co</strong>. <strong>KGaA</strong> after adjustment for exceptional<br />
items. We therefore intend to propose to the<br />
<strong>Annual</strong> General Meeting that the distribution<br />
should increase to 0.80 euros per preferred share<br />
and 0.78 euros per ordinary share, giving a payout<br />
ratio of 25.5 percent.<br />
Earnings per share (EPS)<br />
Basic earnings per preferred share increased<br />
from 2.59 euros to 2.90 euros, and earnings per<br />
ordinary share rose from 2.57 euros to 2.88 euros.<br />
Adjusted earnings per preferred share amounted<br />
to 3.14 euros (previous year: 2.82 euros). As of<br />
December 31, <strong>2011</strong>, the Stock Incentive Plan introduced<br />
in 2000 resulted in a dilution of earnings<br />
per ordinary and per preferred share of 1 eurocent<br />
each.<br />
Net income<br />
in million euros<br />
2007 941<br />
2008 1,233<br />
2009 628<br />
2010 1,143<br />
<strong>2011</strong> 1,283<br />
Preferred share dividends<br />
in euros<br />
2007 0.531<br />
2008 0.53<br />
2009 0.53<br />
2010 0.72<br />
<strong>2011</strong> 0.802<br />
1 <strong>Co</strong>mparable based on share<br />
split (1:3) of June 18, 2007.<br />
2 Proposal to shareholders for<br />
the <strong>Annual</strong> General Meet ing<br />
on April 16, 2012.
60<br />
Group management report<br />
Net assets and financial position<br />
Capital expenditures<br />
by business sector<br />
37% Laundry &<br />
Home Care<br />
25% <strong>Co</strong>smetics/<br />
Toiletries<br />
37% Adhesive<br />
Technologies<br />
1% <strong>Co</strong>rporate<br />
<strong>Co</strong>rporate = sales and services<br />
not assignable to the<br />
individual business sectors.<br />
Net assets and financial position<br />
Acquisitions and divestments<br />
Effective January 1, <strong>2011</strong>, we assumed control over<br />
Schwarzkopf Inc., Culver City, California, USA.<br />
Having a direct presence in the US hair salon<br />
seg ment enables us to better exhaust the potential<br />
of this market. The purchase price paid was<br />
42 million euros.<br />
As of April 1, <strong>2011</strong>, we now include in our consolidated<br />
financial statements Purbond Group,<br />
Hatfield, Great Britain, previously accounted for<br />
using the equity method. The purchase price<br />
paid amounted to 4 million euros.<br />
In the second half of <strong>2011</strong>, we spent 3 million euros<br />
acquiring outstanding non-controlling interests<br />
in Rilken <strong>Co</strong>smetics Industry S.A., Athens, Greece.<br />
Effective December 31, <strong>2011</strong>, we increased our<br />
shareholding from 50 to 78 percent at a cost of<br />
3 million euros, with the intention of acquiring<br />
100 percent of the shares in the future.<br />
At the end of January <strong>2011</strong>, we disposed of our<br />
non-core TAED bleach activator business in<br />
Ireland for 4 million euros.<br />
On May 31, <strong>2011</strong>, we sold our shares in <strong>Henkel</strong><br />
India Ltd., Chennai, India, for 29 million euros,<br />
generating a gain of 48 million euros.<br />
Effective June 30, <strong>2011</strong>, we divested our roofing<br />
membrane business under the Wolfin brand<br />
operated by Adhesive Technologies. The proceeds<br />
of the sale amounted to 13 million euros with a<br />
gain of 9 million euros.<br />
On December 9, <strong>2011</strong>, we also disposed of our noncore<br />
corrosion-protection business in the USA<br />
operated by the Adhesive Technologies business<br />
sector. The proceeds of the sale were 8 million<br />
euros, resulting in a gain of 4 million euros.<br />
On December 15, <strong>2011</strong>, we sold our 51 percent share<br />
in the joint venture Cemedine <strong>Henkel</strong> <strong>Co</strong>. Ltd.,<br />
Tokyo, Japan, generating proceeds of 6 million<br />
euros and a gain of 1 million euros.<br />
For further details relating to the acquisitions and<br />
divestments made, please refer to the Notes on<br />
pages 105 and 106.<br />
Neither the acquisitions and divestments made<br />
nor other measures undertaken resulted in<br />
any changes in our business and organizational<br />
structure. For further details relating to our<br />
organization and business activities, please refer<br />
to the corresponding passages on page 45.<br />
Thanks to continuing good business performance<br />
and our improved financial profile, we regained<br />
our target ratings of “A flat” (Standard & Poor’s)<br />
and “A2” (Moody’s) in the second quarter of <strong>2011</strong>.<br />
Looking forward, we intend not to jeopardize our<br />
target ratings in the long term when assessing<br />
possible acquisitions.<br />
Capital expenditures<br />
<strong>Henkel</strong> <strong>Annual</strong> <strong>Report</strong> <strong>2011</strong><br />
Capital expenditures (excluding financial assets)<br />
in fiscal <strong>2011</strong> amounted to 393 million euros.<br />
At 384 million euros, investments in property,<br />
plant and equipment for continuing operations<br />
returned to the level prevailing prior to the global<br />
financial and economic crisis of 2008/2009. The<br />
investment increase versus prior year amounted<br />
to 144 million euros. We spent 9 million euros<br />
on intangible assets (2010: 16 million euros). The<br />
main focal points were structural optimizations<br />
in production, and investments in plant for the<br />
manufacture of innovative, sustainable product<br />
lines (Laundry & Home Care and <strong>Co</strong>smetics/<br />
Toiletries). The emphasis within the Adhesive<br />
Technologies business sector was on efficiency<br />
improvements at our production sites and the<br />
expansion of production capacities in our<br />
emerging markets.<br />
The major individual projects of <strong>2011</strong> were as<br />
follows:<br />
• <strong>Co</strong>nstruction of a production facility for<br />
machine-dishwashing products (Somat tabs) in<br />
Düsseldorf, Germany (Laundry & Home Care)<br />
• Expansion of storage capacities for laundry<br />
detergents in Perm, Russia, and Ferentino, Italy<br />
(Laundry & Home Care)<br />
• <strong>Co</strong>nstruction of a production plant for liquid<br />
laundry detergents in dissolvable sachets in<br />
Körösladány, Hungary (Laundry & Home Care)<br />
• Efficiency enhancements at our production<br />
sites in Europe and Shanghai, China, and<br />
expansion of production capacity in Chengdu,<br />
China (Adhesive Technologies)<br />
• <strong>Co</strong>nsolidation of graphite product manufacturing<br />
in Delaware, Ohio, USA (Adhesive Technologies)<br />
• Packaging lines for new folding boxes for colorants<br />
in Viersen, Germany (<strong>Co</strong>smetics/Toiletries).
<strong>Henkel</strong> <strong>Annual</strong> <strong>Report</strong> <strong>2011</strong> Group management report<br />
Net assets and financial position<br />
61<br />
Financial structure<br />
in million euros<br />
Intangible assets/<br />
Property, plant and equipment<br />
Capital expenditures <strong>2011</strong><br />
<strong>Co</strong>ntinuing Acquisitions Total<br />
in million euros operations<br />
Intangible assets<br />
Property, plant<br />
9 50 59<br />
and equipment 384 – 384<br />
Total 393 50 443<br />
In regional terms, the major portion of the investments<br />
made in <strong>2011</strong> focused on Europe and North<br />
America. Around three-quarters of our capital<br />
expenditures went into expansion projects and<br />
rationalization measures.<br />
First-time consolidations and purchase price<br />
adjustments resulted in additions to intangible<br />
assets in the amount of 50 million euros. For<br />
further details, please refer to the Notes on<br />
pages 111 to 114.<br />
Net assets<br />
Other non-current assets<br />
Current assets 1<br />
Cash and cash equivalents<br />
1 Including assets held for sale.<br />
Assets<br />
of which in %<br />
17,525<br />
9<br />
2010<br />
18,579<br />
11<br />
<strong>2011</strong><br />
Total assets rose versus prior year by 1.1 billion<br />
euros to 18.6 billion euros. Under non-current<br />
assets, the increase in intangible assets was<br />
primarily due to currency translation from the<br />
stronger US dollar. The figure for property,<br />
plant and equipment remained roughly constant,<br />
capital expenditures of 384 million euros in our<br />
operating businesses being offset by depreciation<br />
of 302 million euros and disposals with a book<br />
value of 28 million euros. There was also a countervailing<br />
effect in the form of a positive currency<br />
translation balance of 4 million euros.<br />
62<br />
4<br />
59<br />
5<br />
25 25<br />
Liabilities<br />
of which in %<br />
18,579<br />
<strong>2011</strong><br />
47<br />
5<br />
19<br />
6<br />
2<br />
21<br />
17,525<br />
2010<br />
45<br />
3<br />
20<br />
6<br />
3<br />
23<br />
Equity<br />
Pension provisions<br />
Non-current borrowings<br />
Other non-current liabilities<br />
Current borrowings<br />
Other current liabilities<br />
Current assets increased from 5.9 billion euros<br />
to 6.7 billion euros. Inventories and trade accounts<br />
receivable both rose as a result of higher business<br />
volumes. Cash and cash equivalents increased<br />
by 465 million euros to 1,980 million euros, due<br />
primarily to our strong cash flow from operating<br />
activities in the third quarter.<br />
Equity including non-controlling interests rose<br />
by 812 million euros to 8,762 million euros. The<br />
changes are shown in detail in the consolidated<br />
statement of changes in equity on page 101.<br />
The equity ratio increased compared to the previous<br />
year by 1.8 percentage points to 47.2 percent.<br />
At 5.5 billion euros, non-current liabilities were<br />
above the level as of year-end 2010. The increase<br />
of 0.4 billion euros reflects developments in<br />
pension provisions. The decline in security prices<br />
adversely affected plan assets. Moreover, lower<br />
valuation discount rates had the effect of increasing<br />
calculated pension liabilities. As in the previous<br />
year, non-current borrowings include three<br />
bonds: two senior bonds with a redemption value<br />
of 1 billion euros each, and a hybrid bond with<br />
a redemption value of 1.3 billion euros.
62<br />
Group management report<br />
Net assets and financial position<br />
Net debt<br />
in million euros<br />
2,343<br />
at Dec. 31, 2010<br />
Net debt<br />
in million euros<br />
2007 1,702<br />
2008 3,881<br />
2009 2,799<br />
2010 2,343<br />
<strong>2011</strong> 1,677<br />
– 951<br />
Free cash<br />
flow<br />
323<br />
Dividends<br />
paid<br />
46<br />
Allocation<br />
to pension<br />
funds<br />
–84<br />
Other<br />
Current liabilities ended the year at 4.3 billion<br />
euros, slightly below the prior-year level. This<br />
reflects a decrease of 124 million euros in our<br />
current borrowings, offset by an increase in trade<br />
accounts payable of 103 million euros to 2,411 million<br />
euros.<br />
At December 31, <strong>2011</strong> our net debt 1 amounted<br />
to 1,677 million euros. <strong>Co</strong>mpared to the prior-year<br />
figure, therefore, we reduced the balance by<br />
666 million euros, bringing it below the 2 billion<br />
euro mark for the first time since the acquisition<br />
of the National Starch businesses.<br />
Financing and capital management<br />
1,677<br />
at Dec. 31, <strong>2011</strong><br />
The finances of the Group are centrally managed<br />
by <strong>Henkel</strong> <strong>AG</strong> & <strong>Co</strong>. <strong>KGaA</strong>. Financial funds<br />
are, as a rule, centrally procured and then allocated<br />
within the Group. We pursue a conservative<br />
borrowings policy aligned to flexibility and<br />
characterized by a balanced financing portfolio.<br />
The primary goals of financial management are<br />
to secure the liquidity and creditworthiness of<br />
the Group, together with ensuring access at all<br />
times to the capital market, and to generate a<br />
sustainable increase in shareholder value. Measures<br />
deployed in order to achieve these aims include<br />
ongoing optimization of our capital structure,<br />
adoption of an appropriate dividends policy,<br />
equity management, acquisitions, divestments<br />
and debt reduction. Our capital needs and capital<br />
procurement activities are coordinated to<br />
ensure that relevant requirements with respect<br />
to yield, liquidity, security and independence<br />
are taken into account and properly balanced.<br />
In the year under review, <strong>Henkel</strong> paid a higher<br />
dividend for both our ordinary and our preferred<br />
shares compared to the previous year. Cash flows<br />
1 Borrowings less cash and cash equivalents, minus any positive<br />
or plus any negative fair values of hedging contracts covering<br />
those borrowings, provided that the underlying borrowings<br />
are themselves subject to mark-to-market accounting.<br />
not required for capital expenditures, dividends<br />
and interest payments are used to reduce our net<br />
debt, for allocations to pension funds and in the<br />
financing of acquisitions. We cover our shortterm<br />
financing requirement primarily with<br />
commercial papers and bank loans. Our multicurrency<br />
commercial paper program is additionally<br />
secured by a syndicated credit facility.<br />
The outstanding bonds serve to cover long-term<br />
financing requirements. Our financial stewardship<br />
is aligned to the financial ratios defined in<br />
our financial strategy (see page 63). Due to<br />
the international alignment of our businesses,<br />
we have to comply with a variety of statutory and<br />
regulatory requirements, depending on the region<br />
concerned. The status and further development<br />
of these regulations are centrally monitored and<br />
any changes are taken into account in our capital<br />
management decision-making.<br />
Our creditworthiness is regularly checked by the<br />
two rating agencies Standard & Poor’s and Moody’s.<br />
We further improved our financial ratios in 2010<br />
and <strong>2011</strong>, thus meeting a major stipulation of the<br />
rating agencies for upgrading us to our target<br />
ratings of “A flat” (Standard & Poor’s) and “A2”<br />
(Moody’s). This success was due to our increased<br />
profitability and substantially reduced net debt.<br />
On May 15, <strong>2011</strong>, Standard & Poor’s raised its longterm<br />
rating for <strong>Henkel</strong> debt one notch, from “A–”<br />
to “A flat” and its short-term rating from “A–2”<br />
to “A–1.” Moody’s likewise raised its ratings for<br />
us by one notch on June 1, <strong>2011</strong>, from “A3” / “P2” to<br />
“A2” / “P1.” This means that both Standard & Poor’s<br />
and Moody’s continue to assign to <strong>Henkel</strong> an investment<br />
grade rating, the best possible category.<br />
Credit ratings<br />
Standard & Poor’s Moody’s<br />
Long-term A flat A2<br />
Outlook Stable Stable<br />
Short-term A–1 P1<br />
At Dec. 31, <strong>2011</strong>.<br />
<strong>Henkel</strong> <strong>Annual</strong> <strong>Report</strong> <strong>2011</strong><br />
At December 31, <strong>2011</strong>, our non-current borrowings<br />
amounted to 3,501 million euros. Included in<br />
this figure are the hybrid bond issued in November<br />
2005 with a nominal value of 1.3 billion euros,<br />
and the fixed-interest bonds issued in May 2003<br />
and March 2009, each with a volume of 1.0 bil-<br />
lion euros. Our current borrowings – i.e. those with<br />
matu rities of less than 12 months – amounted
<strong>Henkel</strong> <strong>Annual</strong> <strong>Report</strong> <strong>2011</strong> Group management report<br />
Net assets and financial position<br />
63<br />
to 412 million euros as of the reporting date.<br />
These essentially comprise interest-bearing loans<br />
and overdrafts from banks.<br />
We used our cash flow from operating activities<br />
to redeem current borrowings and to build<br />
up cash and cash equivalents, thus reducing our<br />
net debt. The hybrid bond is treated as 50 percent<br />
equity by Standard & Poor’s and – following<br />
a change in its evaluation method – now also by<br />
Moody’s. This treatment benefits the rating-specific<br />
debt ratios of the Group (see key financial<br />
ratios table below).<br />
For further information on our financial instruments,<br />
please refer to the Notes on pages 128<br />
to 138.<br />
Our financial risk management activities are<br />
explained in the financial instruments report<br />
in the Notes on pages 128 to 138 and also in<br />
the risk report on pages 90 and 91.<br />
Financial position<br />
In <strong>2011</strong>, cash flow from operating activities<br />
amounted to 1,562 million euros, a total of 289 million<br />
euros below the prior-year level. The cash<br />
inflow from the growth in operating profit was<br />
offset by the outflow arising from higher net<br />
working capital caused by an increase in inventories<br />
and trade accounts receivable. The increase<br />
in operating profit led to a rise in income taxes<br />
paid. The higher gains from asset disposals have<br />
been adjusted out of cash flow from operating<br />
activities. Where cash-relevant, they are disclosed<br />
instead in cash flow from investing activities/<br />
acquisitions.<br />
Cash outflow in cash flow from investing activities/acquisitions<br />
was 57 million euros higher<br />
than the prior-year level. The increase in investments<br />
in property, plant and equipment compared<br />
to previous year led to higher outflows,<br />
countervailed by increased proceeds from divestments,<br />
predominantly from the sale of our branded<br />
consumer goods business in India and our<br />
business involving roofing membrane under<br />
the Wolfin brand.<br />
With a net outflow of 802 million euros, cash flow<br />
from financing activities showed a significant<br />
improvement of 421 million euros compared to<br />
the previous year, despite a higher dividend payout.<br />
The transfer of liquid funds to other current<br />
financial assets effected in the previous year,<br />
and the use of liquid funds to further strengthen<br />
our pension plan assets, were also reported as<br />
outflows under this heading.<br />
Cash and cash equivalents increased by 465 million<br />
euros to 1,980 million euros as a result of<br />
the cash flow from operating activities.<br />
Free cash flow amounted to 951 million euros,<br />
a decrease of 557 million euros below the prioryear<br />
figure due to the lower cash flow from operating<br />
activities and higher capital expenditures.<br />
Key financial ratios<br />
With our reduced indebtedness, our operating debt<br />
coverage increased to 83.2 percent in <strong>2011</strong>, bringing<br />
it well above our target of 50 percent. Our<br />
interest coverage ratio, i.e. EBITDA divided by net<br />
interest expense, also improved further, aided by<br />
lower interest expense. And our equity ratio similarly<br />
reflects the high financial strength of the<br />
Group.<br />
Key financial ratios<br />
2010 <strong>2011</strong><br />
Operating debt coverage 1<br />
(Net earnings + Amortization and<br />
depreciation + interest element<br />
of pension provisions) ÷ Net borrowings<br />
and pension provisions<br />
Interest coverage ratio<br />
(EBITDA ÷ Net interest expense<br />
including interest element of<br />
71.4 % 83.2%<br />
pension provisions)<br />
Equity ratio<br />
12.8 14.6<br />
(Equity ÷ Total assets)<br />
45.4 % 47.2%<br />
1 Hybrid bond included on 50 percent debt basis only.<br />
Prior-year figures not adjusted.
64 Group management report<br />
Employees<br />
<strong>Henkel</strong> <strong>Annual</strong> <strong>Report</strong> <strong>2011</strong><br />
In <strong>2011</strong>, <strong>Henkel</strong> garnered the “European Diversity Leadership<br />
Honour” in the category “Multicultural Working Environment”<br />
in recognition of our commitment and transparency in the<br />
diversity domain.<br />
Employees<br />
by region in <strong>2011</strong><br />
32 % Western Europe<br />
19 % Eastern Europe<br />
11 % Africa/Middle East<br />
11 % North America<br />
8 % Latin America<br />
19 % Asia-Pacific<br />
Employees<br />
by business sector<br />
20 % Laundry &<br />
Home Care<br />
16 % <strong>Co</strong>smetics/<br />
Toiletries<br />
51 % Adhesive Technologies<br />
13 % Functions<br />
Employees<br />
The number of people employed at <strong>Henkel</strong> at the<br />
end of <strong>2011</strong> was 47,265 (annual average: 47,753),<br />
1 percent below the 2010 level. The year was<br />
characterized by our focus on the emerging<br />
markets, accompanied by efficiency enhancements<br />
in the mature markets, with our shared<br />
service centers covering a growing number of<br />
processes from around the world. Personnel<br />
growth was strongest in Eastern Europe with an<br />
increase in payroll of 3 percent, while Western<br />
Europe registered the highest decline of –3 percent.<br />
Sales per capita increased by 4 percent to<br />
326,766 eu ros. Personnel expenses came in at<br />
2,522 million euros.<br />
We rely on high-performing teams to attain our<br />
ambitious goals. We offer our employees attractive<br />
development opportunities within our global<br />
cor por ation and provide specific training opportuni<br />
ties in order for them to build on their skills<br />
and expertise. Such activities also strengthen our<br />
attractiveness for new recruits, whereby promoting<br />
the diversity of our teams in terms of nationality,<br />
gender and age/professional experience<br />
is a primary focus.<br />
In <strong>2011</strong> we were again able to position ourselves<br />
in the employer rankings of many countries as an<br />
attractive company – both for graduates and for<br />
candidates with professional experience. For the<br />
second consecutive year, the CRF Institute, one<br />
of the leading research organizations in the field<br />
of employer certification and employer branding,<br />
recognized <strong>Henkel</strong> with its “Top Employer Germany”<br />
award. We also took first place in the<br />
The purpose of a new employer branding campaign is to<br />
position <strong>Henkel</strong> specifically as an employer of choice. Its design<br />
elements serve as an effective eye-catcher in our information<br />
booths at graduate fairs.<br />
subcategories <strong>Co</strong>rporate Culture, Training and<br />
Development, and Work Life Balance. Our employer<br />
branding campaign launched in February<br />
<strong>2011</strong> was recognized by Batten & <strong>Co</strong>mpany with<br />
first place in its “Best Employer Brand Award<br />
<strong>2011</strong>.” By fall <strong>2011</strong>, we had disseminated our new<br />
employer brand in all the communication channels<br />
we use. These activities all contribute to positioning<br />
<strong>Henkel</strong> more effectively as an employer of<br />
choice, attracting new talent and retaining existing<br />
employees.<br />
<strong>Co</strong>inciding with the new employer branding<br />
campaign, we introduced a standard on-boarding<br />
program: through interactive online media – for<br />
example a comprehensive e-book and an intranet<br />
platform – new employees are provided with<br />
preparation for employment with <strong>Henkel</strong> several<br />
weeks before their first working day, helping<br />
them achieve a good start and familiarizing them<br />
with essential aspects of the company.<br />
We also launched the fifth edition of our global<br />
innovation competition for students, the “<strong>Henkel</strong><br />
Innovation Challenge,” to coincide with the start<br />
of the <strong>2011</strong>/2012 academic year. The competition<br />
has now been extended to 14 European countries<br />
and also the regions of Asia-Pacific, North<br />
America and Latin America. And for the first<br />
time, all our business sectors were involved. By<br />
extending the brief to include <strong>Henkel</strong> technologies<br />
and realigning the focus to ward sustainability<br />
in the innovation process, we were<br />
able to also attract engineers and scientists<br />
as contenders. We are making increasing use<br />
of social media such as Facebook in order to<br />
address students. The accompanying mentoring
<strong>Henkel</strong> <strong>Annual</strong> <strong>Report</strong> <strong>2011</strong><br />
program has led to a substantial increase in<br />
high-caliber job applicants. In Germany, <strong>Henkel</strong><br />
offers more than 20 apprentice ship professions, for<br />
which we took on 161 apprentices in <strong>2011</strong>. In all,<br />
we currently have 483 apprentices under contract.<br />
All our trainees successfully completed<br />
their final examination with the German Chamber<br />
of <strong>Co</strong>mmerce and Industry [IHK]. We again offered<br />
the dual study courses introduced in 2009.<br />
Here, students are able to combine a con ventional<br />
apprenticeship with a Bachelor degree at a university,<br />
allowing them to obtain an academic qualification<br />
while gathering professional experience. In<br />
all, the number of applicants for both kinds of<br />
training course was very encouraging, providing<br />
a good indication of the attractiveness of a<br />
<strong>Henkel</strong> apprenticeship scheme. In <strong>2011</strong>, we again<br />
conferred the Hugo <strong>Henkel</strong> Award under the patronage<br />
of Dr. Christoph <strong>Henkel</strong>. This recognizes<br />
projects and concepts in German schools designed<br />
to promote the teaching of science and technology<br />
to students in grade 5 and above.<br />
Once more, our worldwide talent management<br />
system was at the focus of our activities during<br />
the year. Through our globally established “Development<br />
Round Tables,” our managers ensure<br />
that our people are assessed on the basis of uniform<br />
principles and criteria. The annual assessments<br />
of individual performance and potential<br />
– based on the management competences revised<br />
in 2010 – were conducted with our employees in<br />
personal, open feedback discussions during the<br />
first quarter of <strong>2011</strong>, accompanied by agreement<br />
on individually aligned development measures.<br />
Effective January 1, <strong>2011</strong>, <strong>Henkel</strong> introduced a<br />
further developed global short-term incentive (STI).<br />
As a performance-based component of compensation,<br />
the new STI both encourages and rewards<br />
excellent performance. Managers can thus affect<br />
a major portion of their annual STI bonus through<br />
Employees 1<br />
their individual performance. This innovative<br />
concept ensures a transparent, differentiated and<br />
motivating compensation regime.<br />
Our comprehensive range of training and development<br />
offerings covers the requirements of different<br />
employee groupings. In addition to classic<br />
seminars and online training courses for all employees,<br />
we cooperate closely with internationally<br />
renowned business schools in order to further<br />
promote the development of our managerial staff.<br />
To achieve global uniformity in the provision<br />
and quality of our range of training and development<br />
tools, we prepared a new global learning<br />
concept in <strong>2011</strong> involving standardized course<br />
seminars. These are scheduled for content completion<br />
and introduction in the course of 2012.<br />
We also reviewed our international development<br />
and assessment centers for managerial staff in<br />
<strong>2011</strong> in terms of concept and methodology in order<br />
to ensure that, as an established component<br />
of our personnel development system, these can<br />
continue to deliver results in line with the increasing<br />
demands being placed on management.<br />
We successfully expanded our Executive Resource<br />
Program launched in 2010 for our high-performing,<br />
high-potential employees. To prepare these<br />
talents effectively for their future duties and<br />
responsibilities, they were invited to participate<br />
in a range of high-caliber events covering strategic<br />
issues, as well as projects with an international<br />
dimension. At a one-day event attended by members<br />
of the Management Board, participants in<br />
the program, devised by the Harvard Business<br />
School, presented the results of their work in<br />
the form of projects and analyses based on their<br />
course content. And several top management<br />
positions have now been filled with graduates<br />
of the Executive Resource Program.<br />
(at December 31) 2007 % 2008 % 2009 % 2010 % <strong>2011</strong> %<br />
Europe/Africa/Middle East 33,687 64.0 33,485 60.7 30,933 62.8 30,078 62.9 29,530 62.5<br />
North America 6,438 12.2 7,360 13.4 5,714 11.6 5,440 11.4 5,233 11.1<br />
Latin America 4,268 8.1 4,293 7.8 4,002 8.1 3,699 7.7 3,681 7.8<br />
Asia-Pacific 8,235 15.7 10,004 18.1 8,613 17.5 8,637 18.0 8,821 18.6<br />
Total 52,628 100.0 55,142 100.0 49,262 100.0 47,854 100.0 47,265 100.0<br />
1 Basis: permanent employees excluding apprentices.<br />
Group management report<br />
Employees<br />
Employees<br />
by activity<br />
49 % Production and<br />
engineering<br />
31 % Marketing, selling<br />
and distribution<br />
14 % Administration<br />
6 % Research and<br />
development<br />
Employees<br />
by age group<br />
18 % 16–29 years<br />
35 % 30–39 years<br />
29 % 40–49 years<br />
18 % 50–65 years<br />
65
66 Group management report<br />
Employees<br />
<strong>Henkel</strong> <strong>Annual</strong> <strong>Report</strong> <strong>2011</strong><br />
Around 30%<br />
of our managers<br />
are women.<br />
The diversity of our people with their different<br />
experiences and cultural backgrounds offers us<br />
a clear competitive advantage. Globally, our focus<br />
in this respect is on the dimensions of gender,<br />
internationality and age/professional experience.<br />
One key area involves encouraging women into<br />
managerial positions. As a result of a number of<br />
measures implemented in recent years, we have<br />
increased the proportion of women in management<br />
to around 30 percent – achieving an average<br />
growth rate of 1 percentage point per year.<br />
This makes <strong>Henkel</strong> a leader among the DAX 30<br />
corporations in Germany. We intend to extend<br />
this lead going forward and further increase<br />
the percentage of women at all levels. We have<br />
committed ourselves to this objective in a joint<br />
declaration signed by all DAX 30 companies.<br />
<strong>Henkel</strong> has set itself specific quantitative and<br />
qualitative targets and defined the measures<br />
necessary in order to achieve them. We intend to<br />
further increase the proportion of women in managerial<br />
positions right across the <strong>Henkel</strong> Group<br />
by an average of 1 to 2 percentage points per year.<br />
Measures implemented for enhancing the<br />
presence of women in the workplace focus both<br />
nationally and internationally on recruitment,<br />
personnel development and flexible working<br />
arrangements. During the recruitment process,<br />
<strong>Henkel</strong> endeavors to ensure a balanced range of<br />
candidates with the objective of achieving an<br />
equal distribution of women and men. Long-term<br />
career plans are put in place to ensure that professional<br />
needs can be reconciled with the demands<br />
of private life. Assignments abroad are<br />
introduced at an early stage in the career development<br />
program. Mentoring schemes have also<br />
been established to support the development<br />
of female managers. Major elements of flexible<br />
working arrangements include job-sharing models,<br />
part-time working opportunities, working at<br />
home, and the extensive use of mobile communications<br />
devices. With these offerings, we are able<br />
to move away from classic presence culture, shifting<br />
the focus to performance and contribution.<br />
<strong>Henkel</strong>, McKinsey & <strong>Co</strong>mpany and the German<br />
business magazine “WirtschaftsWoche” conferred<br />
the German Diversity Awards for the first time in<br />
<strong>2011</strong>. The purpose of this ranking is to recognize<br />
outstanding examples of practiced diversity as a<br />
means of highlighting the relevance of this issue<br />
and encouraging others to emulate best practice.<br />
The award is supported by the “Charta der Vielfalt”<br />
[Diversity Charter] organization, a publicprivate<br />
initiative designed to promote diversity<br />
in companies.<br />
Our employees play a key role in the implementation<br />
of our sustainability strategy: They interface<br />
with our customers and develop increasingly<br />
sustainable products. <strong>Co</strong>nsequently, in order to<br />
disseminate our new sustainability strategy, we<br />
have deliberately adopted a dialogue-based approach<br />
involving action plan meetings in which<br />
the strategy is jointly discussed and analyzed.<br />
Around the world, every top manager at <strong>Henkel</strong><br />
was required to have carried out an action plan<br />
meeting with their immediate team members by<br />
the end of <strong>2011</strong>. The process for the lower management<br />
levels is scheduled for completion by<br />
the middle of 2012. In addition to the action plan<br />
meeting as an implementation instrument, we<br />
continue to effectively integrate the topic of sustainability<br />
to a greater extent within other training<br />
and development courses and events.<br />
As a company aware of our responsibilities, the<br />
aspect of social engagement or “corporate citizenship”<br />
is also an important component of our corporate<br />
culture – one that has been firmly anchored<br />
in our corporate values since the company<br />
first came into being. We have divided our activities<br />
into three areas: support for employee and<br />
retiree volunteering activities, cor porate and<br />
brand partnerships aligned to the common good,<br />
and emergency aid for natural disaster relief.<br />
The private involvement of our employees and retirees<br />
is of key importance in this regard. The<br />
company has been supporting their volunteering<br />
activities since 1998 through our MIT initiative<br />
(Make an Impact on Tomorrow). We currently<br />
allocate around 53 percent of our global charitable<br />
funds to MIT projects, supporting activities<br />
aligned to social progress, education and science,<br />
fitness and health, culture and ecology.
<strong>Henkel</strong> <strong>Annual</strong> <strong>Report</strong> <strong>2011</strong><br />
Procurement<br />
In order to be able to produce our finished products,<br />
we need externally procured materials (raw materials,<br />
packaging, and traded goods) and services.<br />
These items all fall under the general category<br />
of direct materials. Examples include washingactive<br />
substances (surfactants), adhesive components,<br />
cardboard boxes or external filling services.<br />
The prices paid for total direct materials rose<br />
in <strong>2011</strong>, stabilizing at a high level in the second<br />
half of the year.<br />
In addition to the forces of supply and demand, the<br />
prices of raw materials, packaging, contract manufacturing<br />
and traded goods are essentially determined<br />
by the prices of the input materials used<br />
in their manufacture (feedstocks). And here we<br />
saw the extraordinary price fluctuations on the<br />
procurement markets of 2010 repeated through<br />
<strong>2011</strong>. The price upsurge with respect to petrochemical<br />
products continued, extending to other<br />
feedstocks such as oleochemicals, paper and<br />
metals. The situation was exacerbated by supply<br />
shortages due to demand rising in the wake of<br />
expanding economic development. And there<br />
were disruptions in the supply chains of external<br />
vendors caused by postponed maintenance and<br />
repair activities, and unforeseen failures in production<br />
facilities. These developments led to<br />
feedstock price levels which, taking the average<br />
for the year, were substantially above the 2010<br />
figure. A delayed increase in the purchase prices<br />
of the raw materials, packaging, contract manufacturing<br />
and traded goods procured by <strong>Henkel</strong><br />
then ensued.<br />
Our expenditures for total direct materials in the<br />
year under review amounted to 7.3 billion euros,<br />
0.6 billion euros more than in the previous year.<br />
This is primarily attributable to higher production<br />
volumes and increased prices for feedstocks.<br />
Through our global procurement strategy, we<br />
were able to cushion the effect on adjusted 1 gross<br />
margin exerted by the price increases for our<br />
direct materials. However, we were unable to<br />
compensate for them fully.<br />
In order to improve efficiency and secure material<br />
supplies, we consistently endeavor to optimize<br />
our value chain while maintaining quality levels.<br />
In addition to our diligence in negotiating new,<br />
competitive contractual conditions, our ongoing<br />
global program aligned to reducing overall procurement<br />
cost is a major factor in the success of<br />
1 Adjusted for one-time charges/gains and restructuring charges.<br />
our purchasing strategy. Working together with<br />
the three business sectors, Purchasing is permanently<br />
engaged in reducing product complexity,<br />
optimizing our raw material mix and promoting<br />
the standardization of packaging and raw materials.<br />
This gives us stronger negotiating positions and<br />
creates scope for further consolidation of our<br />
vendor base. In establishing long-term business<br />
relationships, we focus our efforts on vendors in<br />
which we see potential with respect to innovation,<br />
optimization of manufacturing cost and improving<br />
our logistics processes. One of our main concerns<br />
within this context is to limit the risk of<br />
supply shortages. We manage our preferred vendors<br />
on the basis of individual target agreements.<br />
Through these measures, we have succeeded<br />
in reducing the number of vendors we use by<br />
10 percent.<br />
We have been able to increase the processing and<br />
management efficiency of our purchasing activities<br />
by further standardizing, automating and<br />
centralizing our procurement processes. Large<br />
parts of our administrative work, for example<br />
purchase order processing and price management,<br />
have been pooled within our shared<br />
service center organization.<br />
The improvement in our net working capital is due<br />
particularly to the optimization of our terms and<br />
conditions of payment with respect to our suppliers.<br />
We have also succeeded in optimizing<br />
our raw material inventories through a process<br />
of continuous improvement in our supply chain<br />
processes.<br />
Given the uncertainties that exist with respect to<br />
material price development and supply shortages<br />
on the procurement markets, risk management<br />
constitutes an important aspect of our purchasing<br />
strategy, with the emphasis on reducing price<br />
and supply risks while maintaining uniformly<br />
high quality. In adopting an active price management<br />
approach, we deploy strategies aligned<br />
to safeguarding prices over the long term, both<br />
through contracts and – where appropriate and<br />
possible – by means of financial hedging instruments.<br />
In order to minimize the risks of delivery<br />
default, we put in place supply disruption clauses<br />
and perform detailed risk assessments of our<br />
vendors to determine their financial stability.<br />
With the aid of an external, independent financial<br />
services provider, we continuously monitor<br />
important suppliers whose financial situation<br />
is regarded as critical. If a high risk of vendor<br />
Group management report<br />
Procurement<br />
Material expenditures<br />
by business sector<br />
29 % Laundry &<br />
Home Care<br />
20 % <strong>Co</strong>smetics/Toiletries<br />
51 % Adhesive Technologies<br />
Material expenditures<br />
by type<br />
67<br />
63 % Raw materials<br />
18 % Packaging<br />
19 % <strong>Co</strong>ntract manufacturing<br />
and traded goods
68 Group management report<br />
Procurement / Production<br />
<strong>Henkel</strong> <strong>Annual</strong> <strong>Report</strong> <strong>2011</strong><br />
failure is identified, we systematically prepare<br />
back-up plans in order to ensure consistency<br />
of supply.<br />
We expect our suppliers and contractual partners<br />
to behave in a manner in keeping with our own<br />
corporate ethics and values. The basic requirements<br />
in this regard are set out in our purchasing<br />
standards, valid across the Group, and our safety,<br />
health and environmental standards formulated in<br />
1997, through which we have long acknowledged<br />
our responsibility for the entire supply chain.<br />
<strong>Co</strong>nsequently, when selecting and developing<br />
our vendors and contractual partners, we also<br />
consider their performance in relation to the<br />
requirements of sustainable development. We<br />
use the cross-industry <strong>Co</strong>de of <strong>Co</strong>nduct published<br />
by the German Federal Association of Materials<br />
Management, Purchasing and Logistics [BME] as<br />
a globally applicable vendor code and the basis<br />
for our multi-faceted “Responsible Supply Chain<br />
Process.” The objective of this process is to ensure<br />
compliance by our suppliers with these standards<br />
and to improve, together with our strategic vendors,<br />
the sustainability standards pertaining to<br />
our supply chain. A global training program further<br />
ensures that the requirements governing<br />
the sustainability profile of our vendors are understood<br />
and properly applied by our employees.<br />
Our five most important commodity groups are<br />
raw materials for use in hotmelt adhesives, washingactive<br />
substances (surfactants), raw materials for<br />
polyurethane-based adhesives, solvents and inorganic<br />
raw materials for use e.g. in detergents<br />
and surface treatment products. These account<br />
for around 34 percent of our total direct material<br />
expenditures. Our five largest suppliers account<br />
for around 14 percent of our direct material cost.<br />
Purchases made in the general category indirect<br />
materials and services are not directly linked<br />
to the production of our finished products.<br />
Examples include maintenance, repair and<br />
overhaul materials, and logistics, marketing<br />
and IT services. Through our global procurement<br />
strategy and structural cost reduction measures,<br />
we succeeded in reducing our procurement prices<br />
in these categories compared to the previous year.<br />
Due to positive business developments, the overall<br />
volume of indirect materials and services rose<br />
in <strong>2011</strong>. The related expenditures there fore increased<br />
compared to 2010, by 0.4 billion euros<br />
to 4.3 billion euros.<br />
Production<br />
We further optimized our production footprint in<br />
<strong>2011</strong>, with <strong>Henkel</strong> manufacturing products with a<br />
total weight of around 7.6 million metric tons at<br />
180 sites located in 56 countries around the world.<br />
Our largest production facility is in Düsseldorf, Germany.<br />
Here we manufacture not only detergents and<br />
household cleaners but also adhesives for consumers<br />
and craftsmen, and products for our industrial<br />
customers. <strong>Co</strong>operation with toll manufacturers is<br />
an integral component of our production strategy,<br />
enabling us to optimize our production and logistics<br />
structures when developing new markets or where<br />
volumes are still small. Each year we purchase<br />
around 10 percent in additional production tonnage<br />
from toll manufacturers based on current figures.<br />
Number of production sites<br />
2010 <strong>2011</strong><br />
Laundry & Home Care 31 29<br />
<strong>Co</strong>smetics/Toiletries 8 8<br />
Adhesive Technologies 149 143<br />
Total 188 180<br />
Our Düsseldorf facility is also the largest production<br />
site of the Laundry & Home Care business<br />
sector. Here we predominantly manufacture<br />
powder and liquid detergents, fabric softeners<br />
and liquid cleaning products. We have further<br />
upgraded our Germany-based production activities<br />
within our European manufacturing concept.<br />
Following the construction of a factory in Düsseldorf<br />
for the production of liquid laundry and<br />
home care detergents in 2010, we have now also<br />
constructed on the same site a new facility for<br />
the manufacture of machine-dishwashing tabs to<br />
be supplied to the markets of Germany, the rest<br />
of Europe and the Middle East region as from 2012.<br />
In <strong>2011</strong>, we further reduced the number of production<br />
sites around the world from 31 to 29. <strong>Co</strong>ncentrating<br />
our laundry and home care product
<strong>Henkel</strong> <strong>Annual</strong> <strong>Report</strong> <strong>2011</strong><br />
manufacturing activities on fewer, more efficient<br />
factories close to our customers has enabled us<br />
to continuously improve our performance. At the<br />
end of <strong>2011</strong>, our Ratibor site in Poland became the<br />
first <strong>Henkel</strong> factory around the world to be certified<br />
according to the international standard for<br />
energy management systems, ISO 50001. The<br />
Laundry & Home Care business sector is thus<br />
continuing its successful implemen tation of<br />
sustainability strategies in production.<br />
Through the implementation of a global management<br />
and control approach to the functions of<br />
production, planning and logistics, we are now<br />
able to centrally coordinate decision processes<br />
extending over the entire supply chain. In conjunction<br />
with optimized structures and processes,<br />
this leads to the faster commercialization of<br />
innovations, more efficient cost structures and,<br />
ultimately, a higher level of competitiveness<br />
throughout the supply chain.<br />
<strong>Co</strong>smetics/Toiletries is very efficiently structured<br />
with eight factories around the world. The largest<br />
of these, located in Wassertrüdingen, Germany,<br />
manufactures body care and hair care products.<br />
We further optimized production in Europe in<br />
<strong>2011</strong> by focusing on dedicated technologies in<br />
each of our production plants.<br />
<strong>2011</strong> also saw us successfully complete the rollout<br />
of our “Total Productive Management” (TPM<br />
Plus) program. This involves ensuring the all-encompassing<br />
and continuous optimization of our<br />
production and supply chain processes. Through<br />
it, we have been able to achieve improvements in<br />
productivity, quality and sustainability. For example,<br />
we have further reduced our energy consumption<br />
levels and waste and wastewater volumes at<br />
all our facilities. Our commitment to sustainable<br />
methods was underlined by the “Factory of the<br />
Year” award won by the Wassertrüdingen plant<br />
in the category “Excellent Resource Efficiency.”<br />
The award is jointly conferred by the business<br />
magazine “Produktion” and the management<br />
consultancy A.T. Kearney.<br />
The currently two largest sites for Adhesive<br />
Technologies are likewise located in Germany:<br />
in Düsseldorf – with a portfolio of high-quality<br />
specialty adhesives for industry and consumers –<br />
and in Heidelberg, where we manufacture a<br />
broad range of adhesives and sealants.<br />
However, in August <strong>2011</strong> we laid the foundations<br />
for our largest adhesives production facility. This<br />
is being built in Shanghai in order to serve rapidly<br />
rising demand for industrial adhesive technologies<br />
in China and the wider Asia- Pacific region.<br />
Through the further development of the production<br />
processes and technologies involved, water<br />
and energy consumption and carbon dioxide<br />
emissions will be state-of-the-art in this new,<br />
advanced facility. Hence our production operations<br />
will also be exemplary in terms of meeting<br />
sustainability criteria. This investment in China<br />
is a major step in the further expansion of our<br />
capacities in the emerging markets.<br />
As part of our ongoing efficiency enhancement<br />
program, we further consolidated our global production<br />
footprint in <strong>2011</strong>. Despite further expansion<br />
of our capacities in the emerging markets, we<br />
reduced the overall number of factories by six to<br />
143. With other efficiency improvements also<br />
having been put in place, we have therefore been<br />
able to further reduce our manufacturing cost.<br />
Sustainability performance 2007 to <strong>2011</strong>, <strong>Henkel</strong> Group<br />
Environmental indicators<br />
per metric ton of output<br />
Water consumption –33 %<br />
Energy consumption –29 %<br />
Waste footprint –25 %<br />
Occupational accidents 1 –35 %<br />
1 Per million hours worked.<br />
In all three business sectors, our optimization<br />
efforts are aligned to reducing the ecological<br />
footprint of our production activities. We focus<br />
particularly on cutting energy consumption, not<br />
least because of the climate protection benefits<br />
that this brings, on reducing our material input<br />
and waste volumes, and on limiting water<br />
consumption and wastewater pollution. New<br />
storage concepts and the manufacture of packaging<br />
materials directly at the filling site reduce<br />
transport costs and thus likewise make a contribution<br />
to climate protection.<br />
Group management report<br />
Production<br />
69
70 Group management report<br />
Production / Research and development<br />
<strong>Henkel</strong> <strong>Annual</strong> <strong>Report</strong> <strong>2011</strong><br />
R&D expenditures<br />
in million euros<br />
2007 350<br />
2008 429 1<br />
2009 396 1<br />
2010 391 1<br />
<strong>2011</strong> 410 1<br />
1 Includes restructuring charges<br />
of 52 million euros (2008),<br />
13 million euros (2009),<br />
8 million euros (2010),<br />
14 million euros (<strong>2011</strong>).<br />
R&D expenditures<br />
by business sector<br />
24 % Laundry &<br />
Home Care<br />
15 % <strong>Co</strong>smetics/Toiletries<br />
61 % Adhesive Technologies<br />
Our corporate-wide targets relating to occupational<br />
safety, resource conservation and emissions<br />
reduction for 2012 were achieved ahead of<br />
schedule by the end of 2010. Overall, our global<br />
programs for <strong>2011</strong> resulted in 61 percent of our<br />
sites reducing their energy consumption,<br />
67 percent cutting their water consumption and<br />
50 percent lowering their waste footprint. Building<br />
on this and with the further development of<br />
our strategy, we have set ourselves new sustainability<br />
targets for the period up to 2015:<br />
• 15 percent less energy per production unit.<br />
• 15 percent less water per production unit.<br />
• 15 percent less waste per production unit.<br />
• 20 percent increase in occupational safety per<br />
million hours worked.<br />
For further details relating to our sustainability<br />
targets, please go to page 49.<br />
Our standards governing safety, health and the<br />
environment, and also our social standards, apply<br />
to all our sites worldwide. Through a clearly defined<br />
process comprising communication, training<br />
courses and audits, we ensure compliance with<br />
these standards, particularly at the production level.<br />
We have our environmental management systems<br />
at our sites externally certified where this generates<br />
benefits within our markets. By the end of<br />
<strong>2011</strong>, around 70 percent of our production output<br />
was generated by factories certified according<br />
to the international standard for environmental<br />
management systems, ISO 14001.<br />
Research and development<br />
In <strong>2011</strong>, expenditures within the <strong>Henkel</strong> Group on<br />
research and development amounted to 410 million<br />
euros (adjusted for restructuring charges:<br />
396 million euros), compared to 391 million euros<br />
(adjusted: 383 million euros) in 2010. These<br />
figures demonstrate our continuing commitment<br />
to innovation as our primary driver of profitable<br />
growth. As in the previous year, R&D expenditure<br />
related to sales amounted to 2.6 percent (adjusted:<br />
2.5 percent).<br />
A major portion of this expenditure goes into<br />
the fields of polymer research, surface modification<br />
and innovative packaging. These are of major<br />
importance for all three business sectors.<br />
Around half the total R&D spend is accounted<br />
for by personnel expenses.<br />
Our research and development costs were<br />
completely expensed in the year under review –<br />
there were no development costs qualifying<br />
for capitalization pursuant to International<br />
Financial <strong>Report</strong>ing Standards.<br />
As an annual average, the number of employees<br />
working in research and development at our sites<br />
around the world was 2,654 (2010: 2,665), corresponding<br />
to 6 percent of the total workforce. The<br />
success of our R&D activities derives from the<br />
talents, skills and capabilities of our highly qualified<br />
employees. Our teams comprise scientists –<br />
predominantly chemists – but also material<br />
scientists, engineers and technicians; 18 percent<br />
of our staff hold doctorates.<br />
Key R&D figures<br />
R&D expenditures<br />
(million euros)<br />
R&D expenditures<br />
(in % of sales)<br />
Employees<br />
(annual average)<br />
2007 2008 2009 2010 <strong>2011</strong><br />
350 377 1<br />
2.7<br />
2,794<br />
2.7 1<br />
2,942<br />
1 Adjusted for restructuring charges.<br />
383 1<br />
2.8 1<br />
2,743<br />
383 1 3961<br />
2.5 1 2.51<br />
2,665 2,654
<strong>Henkel</strong> <strong>Annual</strong> <strong>Report</strong> <strong>2011</strong><br />
Major <strong>Henkel</strong> R&D sites around the world<br />
Bridgewater, USA<br />
Irvine, USA<br />
Scottsdale, USA<br />
Rocky Hill, USA<br />
Dublin, Ireland<br />
As part of our research and development strategy,<br />
we have further developed our “open innovation”<br />
approach involving greater collaboration with and<br />
integration of university teams, research institutes,<br />
suppliers and customers in our innovation<br />
processes. In order to ensure the market relevance<br />
of our developments, we have stepped up<br />
the inclusion of major customers in our R&D<br />
processes. The following examples illustrate the<br />
success we have achieved through this approach:<br />
• For a new generation of defoamers that we use<br />
throughout the world in all our powder detergents,<br />
we conferred on the company Dow<br />
<strong>Co</strong>rning our <strong>2011</strong> “Best Innovation <strong>Co</strong>ntributor”<br />
award. The patented technology permits particularly<br />
efficient control of the foaming properties<br />
as a decisive quality feature for the wash<br />
process, and also reduces the raw material<br />
input by up to 80 percent.<br />
• We also conferred our “Best Sustainability<br />
<strong>Co</strong>ntributor Award” for the first time in <strong>2011</strong>,<br />
recognizing partners in the supply chain that<br />
have been particularly supportive of our “Factor 3”<br />
sustainability objective, which involves<br />
tripling our resource efficiency (details of<br />
our 2030 sustain ability strategy can be found on<br />
page 48). The award went to BASF for its<br />
contribution in the development of the new<br />
machine-dishwashing tablets Somat 10 with<br />
their immediate-active formula. Somat 10 tabs<br />
Düsseldorf, Germany<br />
Hamburg, Germany<br />
Vienna, Austria<br />
Shanghai, China<br />
dissolve twice as fast as the predecessor product<br />
and are therefore able to deve lop their powerful<br />
cleaning performance in all dish washing programs,<br />
even at low temperatures.<br />
• In the hair styling field, our close cooperation<br />
with one of our main suppliers reached the level<br />
of technology transfer in product innovation.<br />
With the formulation developed through this<br />
alliance, we are now marketing a new generation<br />
of hair sprays which, in addition to impressive<br />
hold, also add exceptional luster to the hair.<br />
• Together with the University of Pennsylvania in<br />
the USA, our adhesive researchers have developed<br />
new acrylate-based block copolymers with a<br />
high performance profile. These offer flexible<br />
adaptability to the requirements profile of each<br />
application. The technology has led to the successful<br />
development of an initial range of sealants<br />
for the automotive industry offering outstanding<br />
oil resistance. The new polymers also<br />
form the basis for a new generation of hotmelt<br />
contact adhesives.<br />
Worldwide, growth and quality of life need to be<br />
decoupled from resource consumption and emissions.<br />
Our contribution as a company is to develop<br />
innovative products and processes that consume<br />
less resource while still offering the same or better<br />
performance. It is therefore both our duty and<br />
our desire to ensure that all products contribute<br />
Group management report<br />
Research and development<br />
71
72 Group management report<br />
Research and development<br />
<strong>Henkel</strong> <strong>Annual</strong> <strong>Report</strong> <strong>2011</strong><br />
to sustainable development in at least one of our<br />
six defined focal areas. These are systematically<br />
integrated within our innovation process. Hence,<br />
our researchers have to demonstrate the specific<br />
benefits that their project brings with respect to<br />
product performance and added value for our customers,<br />
resource efficiency and social progress.<br />
We therefore concentrate our R&D effort on innovations<br />
that combine product performance and<br />
quality with responsibility toward people and<br />
the environment. Life cycle analyses and our<br />
many years of experience in the field of sustainable<br />
development help us, right from the start of<br />
the product development process, to determine<br />
where in the various product categories the main<br />
environmental impact occurs and where appropriate<br />
improvement measures might be applied.<br />
Our scientists have made key contributions to<br />
both sustainability and our performance in<br />
many fields. The following examples provide a<br />
selection of major research work that they have<br />
carried out:<br />
Laundry & Home Care<br />
• Development of a new, modified protease<br />
through the optimization of enzyme/stain interaction<br />
as a means of improving the washing<br />
performance of liquid detergents, particularly<br />
at low wash temperatures starting at just 20 degrees<br />
Celsius.<br />
• Development of highly concentrated liquid<br />
laundry detergents in soluble, pre-dosed capsules<br />
which guarantee, with just half the usual<br />
dose, maximum performance per wash, while<br />
at the same time conserving resources –<br />
particularly with respect to packaging material.<br />
• Development of a new generation of glass<br />
cleaners using surfactants manufactured entirely<br />
from renewable raw materials.<br />
<strong>Co</strong>smetics/Toiletries<br />
• Use of treatment oils in a hair colorant offering<br />
noticeably improved care properties, and innovative<br />
hair care products for rebuilding the hair<br />
structure and reducing split ends.<br />
• Development of a body wash generation which,<br />
in addition to the usual cleaning action, also<br />
offers an optimized formula for extensive<br />
protection against body odor and a freshness<br />
feel that lasts up to 18 hours.<br />
• Formulation for hair gels with extreme hold<br />
on the basis of innovative polymer technology;<br />
also the development of styling powder products<br />
for the Branded <strong>Co</strong>nsumer Goods business.<br />
Adhesive Technologies<br />
• Global market launch of a new generation of<br />
polyolefin-based hotmelt adhesives for hygiene<br />
products, offering significantly reduced<br />
consumption per application and a low energy<br />
requirement.<br />
• New underfill materials for innovative<br />
applications in mobile electronic devices,<br />
fulfilling the requirements of advancing miniaturization<br />
in both the devices themselves and<br />
their components.<br />
• Development of the first gap-filling instant<br />
adhesive in the form of Loctite 3090. This<br />
patent-pending, gel-like two-component<br />
adhesive hardens after three to five minutes,<br />
is suitable for almost all materials, and offers<br />
ideal per formance even under difficult conditions,<br />
e. g. involving uneven, porous surfaces,<br />
repairs with missing parts, or overhead<br />
applications.<br />
Each year we select a number of outstanding<br />
developments for our Fritz <strong>Henkel</strong> Award for<br />
Innovation. In <strong>2011</strong>, this accolade went to three<br />
interdisciplinary project teams in recognition<br />
of their efforts in the realization and commercialization<br />
of the following concepts:<br />
• Innovative WC rim block Bref “Power Activ”<br />
– known in Germany as “Kraft-Aktiv” under the<br />
WC Frisch brand – offers patent-pending technology<br />
for all-round WC freshness. This is the<br />
first WC rim block with four functions to combat<br />
dirt and odor. The combination of actives<br />
comprises an anti-limescale formulation, a<br />
cleaning foam, a dirt repellent and a freshness<br />
intensifier. With four active pearls, each flush
<strong>Henkel</strong> <strong>Annual</strong> <strong>Report</strong> <strong>2011</strong><br />
Fritz <strong>Henkel</strong> Awards for Innovation <strong>2011</strong><br />
results in the WC undergoing a thorough clean<br />
and freshness boost. Available in three different<br />
fragrances, the innovation has convinced people<br />
in over 30 countries in Western and Eastern<br />
Europe of its powerful freshness effect.<br />
• Gliss Kur Ultimate Repair repairs extremely<br />
damaged hair with triple-concentrated humanidentical<br />
keratin components. The innovative<br />
technology of the new treatment series, developed<br />
in cooperation with our partners from industry,<br />
university teams and research institutes, is<br />
based on biomimetic reconstruction of the natural<br />
lipid protective layer of the hair fiber, combined<br />
with human-identical keratin components<br />
that also repair deep areas of damage within<br />
the hair. The formula with triple-concentrated<br />
liquid hair components provides the hair with<br />
resilience and renewed luster. Also included in<br />
this hair care range is the innovative treatment<br />
product Gliss Kur Oil Elixir: Based on innovative<br />
oil evaporation technology, it imparts to<br />
the hair full-bodied gloss and suppleness without<br />
making it over-heavy.<br />
• Aquence <strong>Co</strong>-Cure 90o Series is a coating that<br />
provides environmentally sound corrosion<br />
protection for metal substrates, combining the<br />
two operations of pre-treatment and coating.<br />
Unlike conventional surface treatment methods,<br />
waterborne Aquence technology inhibits corrosion<br />
through the action of a unique chemical<br />
process. Aquence <strong>Co</strong>-Cure also significantly<br />
reduces the number of operations required<br />
prior to painting. The patented Aquence process<br />
consumes less energy, generates lower carbon<br />
dioxide emissions, causes less waste and thus<br />
also sustainably reduces the capital outlay and<br />
process costs of our customers.<br />
We currently hold some 8,000 patents as protection<br />
for our technologies around the world. We also<br />
have more than 5,000 patent applications pending,<br />
and own approximately 2,000 registered<br />
designs safeguarding our intellectual property.<br />
Further information on our research and development<br />
activities can be found on our website:<br />
www.henkel.com/innovation<br />
Group management report<br />
Research and development<br />
www.bref.it www.wcfrisch.de www.glisskur.schwarzkopf.de www.henkel.com/aquenceautophoretic-12623.htm<br />
73
74 Group management report<br />
Marketing and distribution<br />
<strong>Henkel</strong> <strong>Annual</strong> <strong>Report</strong> <strong>2011</strong><br />
Marketing and distribution<br />
We put our customers at the center of what we do.<br />
Hence we align our marketing and distribution<br />
activities in each of our business sectors to the<br />
requirements of each specific audience and target<br />
group.<br />
At Laundry & Home Care we further centralized<br />
our marketing activities within the new organizational<br />
structure introduced in the third quarter,<br />
aligning it more effectively to our markets and<br />
customers. Central management of our global<br />
brands enables us to adopt more efficient decisionmaking<br />
processes, accelerate the market launch<br />
of our innovations and implement further improved<br />
cost structures. Through the close cooperation<br />
of our central marketing unit with our international<br />
organizational units, we also ensure that<br />
local market conditions are properly taken into<br />
account. We plan our distribution activities on<br />
a country-specific basis, while coordinating them<br />
at the international level. Introduction of the new<br />
organization has also allowed us to harmonize<br />
our processes on a global scale and improve the<br />
transfer of knowledge, experience and application<br />
know-how within the organization.<br />
In the <strong>Co</strong>smetics/Toiletries business sector, we<br />
develop marketing strategies for both our branded<br />
consumer goods and our hair salon businesses on<br />
a global scale, while implementing them locally.<br />
Here too, our distribution activities are managed<br />
on a national level while being increasingly coordinated<br />
at the international level. We communicate<br />
with consumers primarily through media<br />
advertising and point-of-sale campaigns. Addressing<br />
the market through the “new media” is also<br />
gaining in importance. <strong>Co</strong>nsumers purchase our<br />
products from retailers, primarily drug stores,<br />
grocery stores, supermarkets and department<br />
stores. We engage with our customers in the hair<br />
salon business through the activities of our sales<br />
force. Field sales representatives support the salons<br />
at the local level with, for example, product<br />
demonstrations and technical advice. As an addi-<br />
tional service, we also offer specialist seminars<br />
and training courses in our globally established<br />
Schwarzkopf academies.<br />
In our consumer goods businesses, marketing<br />
is focused on the needs of the consumer. Our marketing<br />
organization initiates innovation processes<br />
and effectively utilizes knowledge gained<br />
from market research and observation. Our marketing<br />
teams develop and execute media strategies<br />
and advertising formats that specifically<br />
address consumers. In order to support our major<br />
brands and continue to successfully market<br />
our innovations, we manage our marketing activities<br />
and investments on the basis of clear prioritization<br />
by category and region.<br />
Our primary direct customer grouping is the grocery<br />
retail trade with distribution channels in the form<br />
of supermarkets, mass merchandisers/hypermarkets<br />
and discount stores. In Europe, drug stores are<br />
also important, while in markets outside Europe<br />
and North America, a large proportion of our sales<br />
continues to be channeled via wholesalers and distributors.<br />
Our Sales unit offers a full range of competences<br />
in serving our trade customers.<br />
The Adhesive Technologies business sector serves<br />
a wide range of customers with different uses<br />
for our products. Client groups extend from large,<br />
internationally active corporations to small and<br />
medium-sized industrial businesses, craftsmen,<br />
do-it-yourselfers and private consumers.<br />
We mainly rely on our own sales personnel as the<br />
channel for addressing our customers. Our direct<br />
customers are industrial clients and retail companies;<br />
these latter are able to meet demand from<br />
private users, craftsmen and small industrial<br />
customers more efficiently than can be achieved<br />
through direct sales. Our most important customers<br />
are supported by our key-account management<br />
teams. As many of our products are characterized<br />
by their high technical complexity, our technical<br />
customer service and the training of users also<br />
play an important role.
<strong>Henkel</strong> <strong>Annual</strong> <strong>Report</strong> <strong>2011</strong><br />
For our industrial accounts, we have introduced<br />
a new standard system for customer relationship<br />
management, which more than 5,000 employees<br />
are already using in over 60 countries around<br />
the world. Its functionalities go far beyond those<br />
of previously applied sales management systems,<br />
enabling us to further improve on our ability to<br />
cover existing and future client requirements.<br />
Our strong, international brands, on which we<br />
intend to focus even more closely in the future,<br />
are of central importance to our portfolio.<br />
We develop our marketing strategy on both the<br />
global and regional level. The measures derived<br />
from our planning are then locally implemented.<br />
To communicate with private consumers, we rely<br />
on media advertising with supportive point-ofsale<br />
activities in the retail trade. Craftsmen and<br />
industrial consumers are addressed primarily<br />
by our sales organization through the provision<br />
of technical advice, product demonstrations and<br />
training courses, and also at industrial fairs.<br />
Electronic media are constantly growing in importance<br />
for communication with customers<br />
and users. In all three of our business sectors,<br />
therefore, we are focusing not only on constantly<br />
improving our existing website presence but<br />
also and increasingly on the use of digital and<br />
social media.<br />
The importance of sustainability has grown<br />
significantly in our relations with our customers<br />
and consumers. Customers increasingly expect<br />
from their suppliers demonstrable compliance with<br />
global environmental, safety and social standards.<br />
Our standards and management systems, our many<br />
years of experience in sustainability reporting,<br />
and excellent appraisals by external rating agencies<br />
all help us to convince our audience of our credentials<br />
in this domain. Moreover, the credible<br />
implementation of our sustainability strategy<br />
strengthens both our brands and the reputation<br />
of our company in the marketplace. With our<br />
decades of experience in aligning our activities<br />
to sustainable development, we are able to position<br />
ourselves as a leader in the field and as a partner<br />
capable of offering our customers future-viable<br />
solutions. And we cooperate closely with our<br />
customers in trade and industry in the development<br />
and implementation of viable concepts.<br />
In order to convey to our customers and consumers<br />
the added value of our innovations – best<br />
possible performance combined with responsibility<br />
toward people and the environment – we use<br />
direct product communication and detailed information<br />
in the new media, for example electronic<br />
newspapers or online platforms, as well as<br />
events.<br />
We intend to increase our involvement in the<br />
development of urgently needed appropriate<br />
measurement and assessment methods in order<br />
to facilitate effective, credible communication<br />
of our contributions to sustainability. We participate<br />
in related projects and working groups allied<br />
to, for example, the <strong>Co</strong>nsumer Goods Forum, the<br />
Sustainability <strong>Co</strong>nsortium and the Environmental<br />
Footprint Pilot Project of the <strong>Co</strong>mmission of<br />
the European Union.<br />
For further information on the products and<br />
brands of our three business sectors, please go to:<br />
www.henkel.com/brands-and-solutions<br />
Group management report<br />
Marketing and distribution<br />
75
76 Group management report<br />
Laundry & Home Care<br />
<strong>Henkel</strong> <strong>Annual</strong> <strong>Report</strong> <strong>2011</strong><br />
Laundry & Home Care<br />
• Organic sales growth of 2.9 percent<br />
• Adjusted 1 operating profit improved by 1.4 percent to 570 million euros<br />
• Adjusted 1 return on sales increased by 0.2 percentage points to 13.2 percent<br />
• Return on capital employed (ROCE) up 0.9 percentage points to 22.1 percent<br />
• Economic value added (EVA ® ) further improved to 303 million euros<br />
Top brands<br />
Innovations <strong>2011</strong><br />
Perwoll “Re-new Effect”<br />
The innovative “Re-new Effect” in<br />
the formulations of our delicates<br />
laundry detergents Perwoll<br />
“Brilliant <strong>Co</strong>lors,” “Intensive Black”<br />
and “Radiant White” smoothes<br />
roughened textile fibers and brings<br />
lustrous life to faded shades.<br />
www.perwoll.de<br />
Key financials *<br />
Persil Black<br />
Persil Black offers the best in Persil<br />
cleanness combined with special<br />
color protection for black and dark<br />
textiles. The liquid detergent is<br />
available for sale in Germany,<br />
Austria and Switzerland.<br />
www.persil.de<br />
in million euros 2010 <strong>2011</strong> +/–<br />
Sales 4,319 4,304 –0.3 %<br />
Proportion of <strong>Henkel</strong> sales 29 % 27 % –2 pp<br />
Operating profit (EBIT) 542 511 –5.8 %<br />
Adjusted operating profit (EBIT) 562 570 1.4 %<br />
Return on sales (EBIT) 12.6 % 11.9% –0.7 pp<br />
Adjusted return on sales (EBIT)<br />
Return on capital employed<br />
13.0 % 13.2% 0.2 pp<br />
(ROCE) 21.2 % 22.1% 0.9 pp<br />
Economic value added (EVA ® ) 286 303 5.7 %<br />
pp = percentage points<br />
* Calculated on the basis of units of 1,000 euros;<br />
figures commercially rounded.<br />
1 Adjusted for one-time charges/gains and restructuring charges.<br />
Sales development *<br />
Somat 10<br />
Thanks to its “immediate-active<br />
formula,” Somat 10 dissolves faster<br />
than ever, enabling it to release<br />
its cleaning performance right<br />
from the start. Somat 10 was<br />
launched onto the German market<br />
in mid-<strong>2011</strong>.<br />
www.somat.de<br />
in percent <strong>2011</strong><br />
Change versus previous year –0.3<br />
Foreign exchange –2.3<br />
Adjusted for foreign exchange 2.0<br />
Acquisitions/divestments –0.9<br />
Organic 2.9<br />
of which price 1.6<br />
of which volume 1.3<br />
* Calculated on the basis of units of 1,000 euros.
<strong>Henkel</strong> <strong>Annual</strong> <strong>Report</strong> <strong>2011</strong><br />
Economic environment and market position<br />
The world market for laundry and home care products<br />
was generally characterized in <strong>2011</strong> by further<br />
intensified competition and strong increases<br />
in raw material costs. After implementing substantial<br />
price decreases in 2010, manufacturers of<br />
branded pro ducts responded to these developments<br />
by moderately raising prices in <strong>2011</strong> in<br />
order to partially offset the pressure on margins.<br />
The consumer climate was dampened throughout<br />
the world by a high level of uncertainty regarding<br />
the further development of the debt<br />
crises in Europe and the USA. Similar to the<br />
previous year, our relevant markets declined<br />
slightly overall. Due to price increases introduced<br />
by brand manufacturers, suppliers of<br />
private labels were able to slightly expand their<br />
market share. This was predominantly due to<br />
the behavior of consumers in the countries of<br />
Southern Europe, particularly Italy, Spain, Greece<br />
and Portugal.<br />
Despite this challenging market environment,<br />
in <strong>2011</strong> we again succeeded in significantly outperforming<br />
our relevant markets. The increase in<br />
our market shares was predominantly due to<br />
favorable developments in Europe and a noticeable<br />
improvement of our business in North America.<br />
Again in <strong>2011</strong>, the mature markets of Western<br />
Europe and North America were characterized<br />
by a decline in growth and consumer reticence.<br />
By contrast, the German market grew slightly,<br />
faring better than all the other countries of Western<br />
Europe. Meanwhile, the US market declined<br />
significantly. We were, however, able to increase<br />
our shares in both the Western European and the<br />
North American markets. The market share gains<br />
in Germany were particularly noticeable. After<br />
the virtual stagnation of the previous year, the<br />
Eastern Europe region returned to moderate<br />
growth, with rapid expansion in the Russian and<br />
Turkish markets driving developments. In a<br />
highly competitive environment, we succeeded<br />
in further expanding our market position in<br />
Eastern Europe, reaching new highs in terms of<br />
market share. The Africa/Middle East region was<br />
hit by political unrest during the first half of the<br />
year, although recovered significantly in the<br />
course of the second half. The Latin American<br />
market recorded growth and we were able to<br />
consolidate our market shares here and in South<br />
Korea, our only market in the Asia-Pacific region.<br />
Business activity and strategy<br />
The business sector is globally active in the<br />
Laundry and Home Care branded consumer<br />
goods businesses. The Laundry business includes<br />
not only heavy-duty and specialty detergents<br />
but also fabric softeners, laundry performance<br />
enhancers and laundry care products. The portfolio<br />
of our Home Care business encompasses<br />
hand-dish washing and machine-dishwashing<br />
products, cleaners for bath and WC applications,<br />
and house hold, glass and specialty cleaners.<br />
We also have a market presence in selected<br />
regions with air fresheners and insecticides<br />
for household applications.<br />
Our aim is to continue generating profitable<br />
growth through the organic expansion of our<br />
continuing operations. We therefore intend to<br />
pursue both sustainable market share gains and<br />
further margin improvements. Based on our<br />
leading positions in the profitable mature markets<br />
of Western Europe and North America, we<br />
plan to further expand the share of sales of our<br />
emerging markets, particularly Eastern Europe,<br />
Africa/Middle East and Latin America. We intend<br />
to leverage the dynamics of these emerging<br />
markets in order to accelerate the growth of our<br />
portfolio. We also endeavor to further increase<br />
our market share in these regions and raise profitability<br />
to the higher level of the mature markets.<br />
Strong brands and innovations offering consumers<br />
added value provide the basis for our strategy<br />
of profitable growth. Last year showed once<br />
again that the launch of successful products can<br />
make a positive contribution, particularly under<br />
challenging economic and market conditions. It<br />
therefore remains our objective to maintain an<br />
innovation rate 1 of at least 40 per cent. In <strong>2011</strong>, we<br />
were able to increase it to 41 percent. Through<br />
central and even more efficient management of<br />
our innovation process and with deepened insights<br />
into the purchasing habits of consumers,<br />
we are able to quickly identify and respond to<br />
consumer trends and effectively convert these<br />
into new products. By prioritizing product categories<br />
and centrally steering our global brand<br />
portfolio, we are able to direct our investments<br />
toward those segments that offer growth and<br />
profitability, enabling us to generate disproportionately<br />
strong growth with our most important<br />
brands and market segments. In <strong>2011</strong>, we generated<br />
1 Percentage share of sales generated with new products<br />
launched onto the market within the last three years.<br />
Group management report<br />
Laundry & Home Care<br />
41%<br />
innovation rate.<br />
77
78 Group management report<br />
Laundry & Home Care<br />
<strong>Henkel</strong> <strong>Annual</strong> <strong>Report</strong> <strong>2011</strong><br />
Sales<br />
in million euros<br />
2007 4,148<br />
2008 4,172<br />
2009 4,129<br />
2010 4,319<br />
<strong>2011</strong> 4,304<br />
+2.9%<br />
organic sales growth in a<br />
slightly declining world<br />
market.<br />
81 percent of our sales with our top ten brand<br />
clusters 1.<br />
Sales and profits<br />
Nominally, sales declined slightly by 0.3 percent to<br />
4,304 million euros for the year. Organically – i.e.<br />
after adjusting for foreign exchange and acquisitions/divestments<br />
– we succeeded in increasing<br />
sales by 2.9 percent, significantly outstripping the<br />
slightly declining development of our relevant<br />
markets. Despite the difficulties presented by the<br />
market environment, we were able to implement<br />
price increases for our products, particularly in<br />
the second half of the year, thus offsetting a significant<br />
portion of the material price increases.<br />
Our average selling prices rose by 1.6 percent,<br />
while volume increase contributed 1.3 percent to<br />
the business sector’s organic growth. In determining<br />
the price effect, we do not account for the<br />
positive structural effect arising from the launch<br />
of new products, but instead include it under<br />
volume.<br />
All our regions contributed to the positive business<br />
performance achieved. Western Europe<br />
posted an increase in organic sales, benefiting<br />
significantly from our very good perfor mance<br />
in Germany. In North America, we were able to<br />
slightly increase sales in a highly competitive<br />
and appreciably declining market. Developments<br />
in our emerging markets were positive across the<br />
board. Supported in particular by rapid expansion<br />
in Russia and Turkey, sales in Eastern Europe<br />
significantly increased organically. In contrast,<br />
growth in some other core countries of<br />
Eastern Europe was hampered by market decline.<br />
While our business in the Africa/Middle East<br />
region was adversely affected by the political unrest<br />
in the first half of the year, we succeeded<br />
in significantly accelerating business expansion<br />
during the second half, enabling us to register<br />
good growth in the mid-single-digit range for the<br />
year as a whole. Our business in Latin America<br />
generated high single-digit growth, with the<br />
launch of our top brand Persil making a significant<br />
contribution and triggering our entry into<br />
the premium segment for laundry care products<br />
in Mexico. In Asia, organic sales were slightly up,<br />
despite the exit from our Philippines business in<br />
the previous year.<br />
1 A brand cluster comprises several individual local brands<br />
which, in terms of their positioning, are comparable to a large<br />
international brand. By adopting this approach, we are able to<br />
generate high synergies in our marketing mix.<br />
Operating profit (EBIT) decreased by 5.8 percent<br />
compared to the previous year, due in particular<br />
to significantly higher restructuring charges<br />
occurring in conjunction with the realignment<br />
of the business sector. In the course of streamlining<br />
our portfolio, we disposed of our branded<br />
consumer goods business in India in the second<br />
quarter of <strong>2011</strong>, generating a gain from the transaction.<br />
Adjusted operating profit rose by 1.4 percent<br />
and adjusted return on sales improved by<br />
0.2 percentage points, from 13.0 percent in 2010<br />
to 13.2 percent in <strong>2011</strong>.<br />
Fiscal <strong>2011</strong> was generally characterized by high raw<br />
material price increases. However, with price<br />
increases of our own, particularly in the second<br />
half of the year, and our ongoing measures to<br />
reduce costs and increase efficiency in both production<br />
and supply chain, we were able to extensively<br />
offset the negative impact on gross margin<br />
caused by the strong increase in material costs.<br />
We also continued our strict cost management<br />
approach in other areas, likewise contributing to<br />
an improvement in margin. A decline in advertising<br />
spend was another characteristic feature<br />
of the market in <strong>2011</strong>. Against this background,<br />
we kept our share of advertising/share of market<br />
ratio 2 constant.<br />
Return on capital employed (ROCE) rose by 0.9 percentage<br />
points to 22.1 percent. This improvement<br />
is due to a significant reduction of our capital<br />
employed. We continued our focus on managing<br />
net working capital. As a proportion of sales,<br />
this amounted to –2.4 percent and was thus<br />
below the already very low level of the previous<br />
year. Economic value added (EVA ® ) rose from<br />
286 million euros in 2010 to 303 million euros.<br />
Business areas<br />
Laundry<br />
The Laundry business posted strong sales performance<br />
in <strong>2011</strong>, with our strategically important<br />
category of heavy-duty detergents generating<br />
the greatest growth momentum. The major drivers<br />
behind this expansion included the launch<br />
of Persil in Mexico and in South Korea. Successful<br />
innovations likewise contributed greatly to<br />
the growth achieved. For instance, we introduced<br />
Persil Black in Germany, Austria and Switzerland.<br />
2 A company’s share of total advertising spend in relation to its<br />
market share, specific to <strong>Henkel</strong>’s active markets.
<strong>Henkel</strong> <strong>Annual</strong> <strong>Report</strong> <strong>2011</strong><br />
Due to its long-term black-boosting formula, this<br />
product offers not only optimum washing performance<br />
but also exceptional color protection for<br />
black and dark apparel. We also newly launched<br />
Mega-Caps in a number of core countries in<br />
Western Europe. Mega-Caps are water-soluble<br />
capsules filled with concentrated laundry liquid.<br />
Because they are pre-dosed, Mega-Caps are<br />
particularly easy to use and offer superb results<br />
with the usual <strong>Henkel</strong> quality. Plastics consumption<br />
with Persil Mega-Caps will significantly<br />
decrease compared to conventional detergent<br />
bottles, thanks to the use of resealable composite<br />
film packaging. We likewise launched a range<br />
of innovative specialty detergents for delicates<br />
under the Perwoll brand featuring a “Re-new<br />
Effect”: the formulations of Perwoll “Brilliant<br />
<strong>Co</strong>lors,” “Intensive Black” and “Radiant White”<br />
smooth roughened textile fibers, bringing<br />
lustrous life to faded shades.<br />
We succeeded in maintaining the positive trend<br />
with our fabric softeners, aided by the launch of<br />
Purex Crystals in the USA, and innovative product<br />
variants of Vernel in Europe aligned specifically<br />
to hygiene and purity. In some of the major<br />
countries of Western Europe, we introduced a<br />
range of heavy-duty liquid detergents that offer<br />
smaller doses for the same performance, thus<br />
improving environmental compatibility and<br />
reducing packaging and logistics costs.<br />
Home Care<br />
In the Home Care business, sales for <strong>2011</strong> were<br />
slightly below the prior-year figure. Although declining<br />
overall due to the market entry of new<br />
competitors, and a significant drop in demand,<br />
our air freshener business in North America registered<br />
an upward trend. <strong>Co</strong>nversely, we were<br />
able to generate significant revenue increases<br />
with our WC products in Europe, due in particular<br />
to the major success of Bref “Power Activ” –<br />
marketed in Germany under the brand WC Frisch.<br />
Our machine-dishwashing products likewise<br />
performed well, supported especially by the<br />
launch of Somat 10 in Germany. Somat 10 now<br />
dissolves twice as fast in the machine, enabling<br />
it to release its cleaning performance right from<br />
the start. The new “immediate-active formula”<br />
also works quickly and powerfully in short and<br />
low-temperature wash cycles.<br />
Capital expenditures<br />
The main focus of our investments was on innovations<br />
and cost optimization in our production<br />
and distribution processes. We also invested in<br />
plant safety and environmental systems. Overall,<br />
we spent 160 million euros on property, plant and<br />
equipment, compared to 83 million euros in<br />
2010. The increase in <strong>2011</strong> is due to a high volume<br />
of innovations, particularly in the field of<br />
pre-dosed liquid detergent capsules and in WC<br />
products.<br />
Outlook<br />
We are confident to continue our positive growth<br />
path in 2012 and generate sales growth in the low<br />
single-digit percentage range. We expect the rate<br />
of increase in raw material prices to decelerate<br />
compared to <strong>2011</strong>. We will remain firmly focused<br />
on main taining our strict cost discipline, particularly<br />
in administration. While increasing the<br />
quality of service to our customers, we can further<br />
improve our efficiency by grouping activities<br />
within our shared service centers. With these<br />
measures, we expect adjusted return on sales to<br />
increase significantly compared to the previous<br />
year (<strong>2011</strong> figure: 13.2 per cent).<br />
We see opportunities arising from a revival in<br />
demand in North America, while the successful<br />
launch of further innovations offers additional<br />
potential for our businesses. Currently unpredictable<br />
relief could also come from the raw<br />
materials side.<br />
We see risk arising from a further downturn in<br />
the macroeconomic conditions, particularly<br />
against the background of the currently uncertain<br />
outcome of the prevailing debt crises. Strongly<br />
rising unemployment, higher taxes and social<br />
contributions, and also the possibility of strikes<br />
could adversely affect the consumer climate.<br />
Due to uncertainties in relation to price developments<br />
on the commodity markets, material prices<br />
could rise significantly more than anticipated.<br />
We regard unrest in the Africa/Middle East<br />
region as a substantial political risk.<br />
Group management report<br />
Laundry & Home Care<br />
79
80 Group management report<br />
<strong>Co</strong>smetics/Toiletries<br />
<strong>Henkel</strong> <strong>Annual</strong> <strong>Report</strong> <strong>2011</strong><br />
<strong>Co</strong>smetics/Toiletries<br />
• Organic sales growth of 5.4 percent<br />
• Adjusted 1 operating profit improved by 10.5 percent to 482 million euros<br />
• Adjusted 1 return on sales increased by 0.9 percentage points to 14.2 percent<br />
• Return on capital employed (ROCE) up 3.4 percentage points to 23.5 percent<br />
• Economic value added (EVA ® ) improved by 83 million euros to 290 million euros<br />
Top brands<br />
Innovations <strong>2011</strong><br />
Gliss Kur Ultimate Repair<br />
This innovative hair repair series<br />
with triple-concentrated liquid hair<br />
components effectively repairs<br />
dry hair both internally and at the<br />
surface, making hair more supple,<br />
lustrous and resilient.<br />
www.glisskur.schwarzkopf.de<br />
Key financials *<br />
Fa NutriSkin<br />
Our first body care line to feature<br />
a unique combination of seven<br />
nourishing care ingredients for<br />
protecting the skin from dryness<br />
and generating an irresistibly soft<br />
skin feeling.<br />
www.fa.com<br />
in million euros 2010 <strong>2011</strong> +/–<br />
Sales 3,269 3,399 4.0 %<br />
Proportion of <strong>Henkel</strong> sales 22 % 22% –<br />
Operating profit (EBIT) 411 471 14.6 %<br />
Adjusted operating profit (EBIT) 436 482 10.5 %<br />
Return on sales (EBIT) 12.6 % 13.8% 1.2 pp<br />
Adjusted return on sales (EBIT)<br />
Return on capital employed<br />
13.3 % 14.2% 0.9 pp<br />
(ROCE) 20.1 % 23.5% 3.4 pp<br />
Economic value added (EVA ® ) 207 290 40.6 %<br />
pp = percentage points<br />
* Calculated on the basis of units of 1,000 euros;<br />
figures commercially rounded.<br />
1 Adjusted for one-time charges/gains and restructuring charges.<br />
Sales development *<br />
Bonacure Oil Miracle<br />
Our revolutionary finishing product<br />
for daily hair care features a<br />
luxuriant oil to intensively nourish<br />
the hair, instantly giving it a rich<br />
gloss without that heavy feel.<br />
Available as an intensive treatment<br />
with argan oil or with marula oil<br />
for lighter applications.<br />
www.schwarzkopf-professional.de<br />
in percent <strong>2011</strong><br />
Change versus previous year 4.0<br />
Foreign exchange –1.1<br />
Adjusted for foreign exchange 5.1<br />
Acquisitions/divestments –0.3<br />
Organic 5.4<br />
of which price –0.3<br />
of which volume 5.7<br />
* Calculated on the basis of units of 1,000 euros.
<strong>Henkel</strong> <strong>Annual</strong> <strong>Report</strong> <strong>2011</strong><br />
Economic environment and market position<br />
The world cosmetics market of relevance to us<br />
was characterized in <strong>2011</strong> by intense displacement<br />
competition and predominantly declining demand.<br />
Despite the persistently difficult and<br />
highly competitive environment, we were able to<br />
globally expand our market shares and therefore<br />
further strengthen our leading position in our<br />
relevant markets across the world.<br />
Our core markets in Western Europe and North<br />
America remained weak as a result of the difficult<br />
economic conditions and low consumer confidence<br />
prevailing. Increased promotional activities,<br />
growing price pressure and a decline in the<br />
pricing level were particularly noticeable in the<br />
Western European branded goods market for hair<br />
cosmetics and the US body care market. In numerous<br />
segments, volume expansion failed to<br />
compensate for these developments. Despite this<br />
challenging market background, however, we succeeded<br />
in maintaining our growth trend of recent<br />
years, again outstripping the market overall.<br />
As a result, we were able to further expand our<br />
market shares in Western Europe and extend our<br />
leading position in the hair cosmetics business.<br />
We also consolidated our position in our core<br />
segments in North America. The emerging markets<br />
of Africa/Middle East, Latin America and<br />
Asia (excluding Japan) continued their positive<br />
development. By contrast, our market in Eastern<br />
Europe failed for the first time to show any<br />
growth against the background of increasing<br />
displacement compe tition. Nevertheless, we<br />
were able to further expand our business in the<br />
emerging markets in general, generating disproportionate<br />
growth and, as a result, gaining significant<br />
market share.<br />
In the hair salon market, persistent customer<br />
reluctance led to a decline in overall demand. However,<br />
we were able to buck this trend, growing our<br />
Schwarzkopf Professional Hair Salon business and<br />
thus further consolidating our position as the<br />
world number three in this segment.<br />
Business activity and strategy<br />
The <strong>Co</strong>smetics/Toiletries business sector is active<br />
in the Branded <strong>Co</strong>nsumer Goods business area<br />
with Hair <strong>Co</strong>smetics, Body Care, Skin Care and<br />
Oral Care, as well as in the professional Hair<br />
Salon business.<br />
Expansion in the Branded <strong>Co</strong>nsumer Goods<br />
business in Western Europe and North America<br />
is focused on further increasing market share.<br />
The objective of our growth strategy is to extend<br />
our innovation leadership. To this end, we pursue<br />
a consistent, pro-active innovation strategy<br />
accompanied by strict cost management to allow<br />
us to step up our market investments and increase<br />
profitability. In Asia, the Middle East and other<br />
emerging markets, we further drive business<br />
development through the rapid expansion of our<br />
portfolio. In the Hair Salon business, we continue<br />
our strategy of globalization, generating growth<br />
momentum particularly in Asia, Latin America<br />
and the Middle East.<br />
Organic development is at the center of our growth<br />
strategy. In a market environment characterized<br />
by strong competition, we pursue this by focusing<br />
on our top brands, ensuring the rapid international<br />
launch of innovations with above-average profitability,<br />
and by selectively driving regional expansion.<br />
Further key success factors include<br />
strong support for our top brands through media<br />
advertising and promotional activities. We regularly<br />
analyze our businesses and brands as part<br />
of our pro-active portfolio management approach.<br />
In our Branded <strong>Co</strong>nsumer Goods business area,<br />
our focus is on the international expansion of<br />
our core businesses of Hair <strong>Co</strong>smetics, Body Care,<br />
Oral Care and Skin Care. Through targeted portfolio<br />
management and the associated marketing<br />
measures aimed at strengthening our top brands,<br />
our ten largest brands again grew substantially<br />
faster than the overall portfolio in <strong>2011</strong>. They<br />
now contribute more than 90 percent to the<br />
business sector’s sales revenues. In addition to<br />
strengthening our brand equities, we focus particularly<br />
on the growth potential available in our<br />
key accounts.<br />
We also endeavor to drive forward our Hair Salon<br />
business on the basis of efficient sales and distribution<br />
structures backed up by a steady flow of<br />
innovations. And we are constantly looking to<br />
develop new regional potential on a selective basis.<br />
Through our pro -active innovation strategy<br />
and the consistent further strengthening of our<br />
brand equities, we expect to continue generating<br />
dynamic, profitable growth. In <strong>2011</strong>, we further<br />
increased our innovation rate 1 to 43 percent. And<br />
we are developing additional growth potential<br />
through expansion of strategic partnerships<br />
with our customers.<br />
1 Percentage share of sales generated with new products<br />
launched onto the market within the last three years.<br />
Group management report<br />
<strong>Co</strong>smetics/Toiletries<br />
43%<br />
innovation rate.<br />
81
82 Group management report<br />
<strong>Co</strong>smetics/Toiletries<br />
<strong>Henkel</strong> <strong>Annual</strong> <strong>Report</strong> <strong>2011</strong><br />
Sales<br />
in million euros<br />
2007 2,972<br />
2008 3,016<br />
2009 3,010<br />
2010 3,269<br />
<strong>2011</strong> 3,399<br />
+5.4%<br />
organic sales growth in a predominantly<br />
declining world<br />
market.<br />
Sales and profits<br />
With a nominal sales increase of 4.0 percent in<br />
<strong>2011</strong>, we maintained the unbroken trend in profitable<br />
revenue growth of recent years. Organically<br />
– i.e. after adjusting for foreign exchange and<br />
acquisitions/divestments – we grew sales by an<br />
even stronger 5.4 percent. Our performance<br />
was therefore once again well above that of the<br />
overall market. As ever, the foundation for this<br />
success was provided by our strong innovation<br />
program. Due to the intensely com petitive market<br />
environment, we too found the need to increase<br />
our promotional activities for our existing<br />
portfolio. As a result, average prices were slightly<br />
below those of the previous year. In determining<br />
the price effect, we do not account for the positive<br />
structural effect arising from the launch of<br />
new products, but instead include it under volume.<br />
All our regions contributed to the significant<br />
increase in sales. The strongest rises were once<br />
again posted by the emerging markets of Africa/<br />
Middle East, Latin America and Asia (excluding<br />
Japan). As in previous years, we were able to<br />
generate double-digit growth here. Particularly<br />
Asia (excluding Japan) and Latin America developed<br />
very dynamically with our strong core<br />
business being supplemented by numerous new<br />
product launches. We also achieved strong growth<br />
in Eastern Europe. Sales likewise increased in<br />
all our mature markets, with the mature markets<br />
of the Asia-Pacific region even registering high<br />
single-digit growth. Western Europe and especially<br />
North America developed well compared to the<br />
previous year, with our businesses there generating<br />
growth above that of our relevant markets.<br />
We were able to increase operating profit (EBIT)<br />
to 471 million euros, 14.6 percent above the level<br />
of the previous year. The figure was positively<br />
impacted by a one-time gain from the disposal of<br />
our branded consumer goods business in India.<br />
We significantly increased adjusted operating<br />
profit (EBIT) versus prior year with a rise of<br />
10.5 percent to 482 million euros, our highest<br />
earnings figure to date. As a result, adjusted<br />
return on sales rose by 0.9 percentage points to<br />
14.2 per cent, likewise reaching a new high. The<br />
foundation for this was provided partly by our<br />
measures to reduce costs and increase efficiency<br />
in both production and supply chain. Through<br />
these, we were able to partially offset the negative<br />
impact on our gross margin caused by the<br />
increase in material costs. We also continued our<br />
strict cost management approach in other areas,<br />
likewise contributing to an improvement in margin.<br />
In an environment characterized by a slight<br />
decline in advertising spend, we maintained our<br />
share of advertising/share of market 1 ratio.<br />
Return on capital employed (ROCE) reached<br />
a new high of 23.5 percent, up 3.4 percentage<br />
points versus the previous year. Aside from our<br />
improved operating profit, further reductions in<br />
our capital base contributed to this high figure.<br />
Our economic value added (EVA ® ) rose from<br />
207 million euros in the previous year to 290 million<br />
euros in <strong>2011</strong>. As a proportion of sales, net<br />
working capital was a very low 3.2 percent.<br />
Business areas<br />
Branded <strong>Co</strong>nsumer Goods<br />
Our Branded <strong>Co</strong>nsumer Goods business generated<br />
a gratifying increase in overall sales in <strong>2011</strong>.<br />
The Hair <strong>Co</strong>smetics business in particular posted<br />
very strong organic sales growth. As a result,<br />
we were once again able to expand our market<br />
shares to new record levels, growth being driven<br />
by our successful innovations under the<br />
Schwarz kopf and Syoss brands.<br />
In the Hair Care business, we succeeded in further<br />
strengthening our market shares, with the internationally<br />
very successful launch of the new Gliss<br />
Kur line Ultimate Repair making a major contribution.<br />
Our Syoss brand was given a further<br />
boost by a relaunch involving the professional<br />
active ingredient, pro-cellium keratin. Aside<br />
from the introduction of the range-extending<br />
Syoss Men line, the launch of our highly successful<br />
Beauty Elixir Absolute Oil was particularly<br />
significant under the Syoss brand.<br />
We were once again able to grow market shares in<br />
our Hair <strong>Co</strong>lorants business to new record levels.<br />
Significant contributions came from the successful<br />
international launch of new, innovative subbrands<br />
such as Syoss Mixing <strong>Co</strong>lors, a product<br />
with two harmonized shades for self-mixing, and<br />
Palette Mousse <strong>Co</strong>lor, the first foam colorant in<br />
Europe that mixes in a shaker. Palette was able<br />
to expand its number-one position in the European<br />
market, thanks in particular to the successful<br />
relaunch of the Deluxe line which, with seven<br />
oils, offers enhanced care performance. The further<br />
roll-out of our exceptionally successful<br />
1 A company’s share of total advertising spend in relation to its<br />
market share, specific to <strong>Henkel</strong>’s active markets.
<strong>Henkel</strong> <strong>Annual</strong> <strong>Report</strong> <strong>2011</strong><br />
brands Perfect Mousse and Syoss <strong>Co</strong>lor additionally<br />
contributed to the growth achieved.<br />
Similarly, the Hair Styling business again posted<br />
new highs in market share. Drei Wetter Taft –<br />
Europe’s number one in the styling category – further<br />
strengthened its position with inno vations<br />
such as Taft Heidi’s Heat Styles and Taft Volume<br />
Powder. Our trend styling brand Got2b gained<br />
further market share, driven in particular by<br />
the successful innovations Got2b Powder’ful,<br />
the innovative styling powder line, and Got2b<br />
rockin’it.<br />
Our Body Care business was stimulated by a<br />
range of innovations, entry into new categories<br />
and product launches under the Fa, Dial and<br />
Right Guard brands. We expanded our successful<br />
Dial series NutriSkin, both with new variants in<br />
existing categories and in the newly developed<br />
body lotion category. In Europe we introduced<br />
the high-performance deodorants Right Guard<br />
Xtreme Dry and Xtreme Sports, two products that<br />
meet the needs of especially demanding customers.<br />
With Fa, the focus was on the launch of<br />
NutriSkin in the shower, deodorant and body<br />
lotion categories. As a result, Fa was able to significantly<br />
increase its market shares in Europe.<br />
In the Skin Care business, we continued to focus<br />
on the development of innovative anti-aging<br />
products. The innovative strength of Diadermine<br />
was once again underlined by, among other things,<br />
the launch of Dr. Caspari Hormoderm, the first<br />
care product from Diadermine countering the<br />
effects of menopause on the skin aging process.<br />
In the Oral Care business, we achieved good results<br />
with our new toothpaste series Denivit Dr. Philip.<br />
Hair Salon<br />
The Hair Salon business also substantially<br />
increased sales. Despite a persistently difficult<br />
market environment, we consolidated our position<br />
as the world number three. Innovative launches<br />
brought stimulus to the market. With its innovation<br />
[3D]Mension, Schwarzkopf Professional developed<br />
its first hair care series especially aligned to<br />
men. In the styling category, our top styling<br />
brand Osis was expanded by innovative products<br />
such as Osis Style Shifters. In the hair care field,<br />
the introduction of new Bonacure Oil Miracle in<br />
particular generated further growth momentum.<br />
Capital expenditures<br />
The emphasis of our investment activity in the<br />
year under review was on optimizing our production<br />
structures and processes. Expenditures on<br />
property, plant and equipment increased from<br />
40 million euros in 2010 to 66 million euros in<br />
<strong>2011</strong>. Among others we invested in further efficiency<br />
enhancements of our production, packaging<br />
tools for new products and expansion of our<br />
capacities.<br />
Outlook<br />
We are confident to continue our positive growth<br />
path in 2012 and generate sales growth in the low<br />
single-digit percentage range. We will remain<br />
firmly focused on main taining our strict cost<br />
discipline, particularly in administration. While<br />
increasing the quality of service to our customers,<br />
we can further improve our efficiency by<br />
grouping activities within our shared service<br />
centers. We foresee the rate of increase in raw<br />
material prices decelerating compared to <strong>2011</strong>. We<br />
expect adjusted return on sales to increase compared<br />
to prior year (<strong>2011</strong> figure: 14.2 percent).<br />
We see good prospects for the further expansion<br />
of our market positions in Europe and North<br />
America resulting from the continued diligent<br />
pursuit of our innovation offensive. There are<br />
also opportunities in the further utilization of<br />
the potential offered by our emerging markets.<br />
Currently unpredictable relief could also come<br />
from the raw materials side.<br />
Risks lie in the uncertainty of the overall economic<br />
development and the currently uncertain<br />
outcome of the debt crises in Europe and the<br />
USA, combined with a significant deterioration<br />
in the consumer climate and intensification of<br />
displacement competition. This would result in<br />
a further rise in already high promotional and<br />
price pressures, as well as increased advertising<br />
expenditures. Moreover, unexpectedly high raw<br />
material and packaging price rises could increase<br />
the pressure on our margins.<br />
Group management report<br />
<strong>Co</strong>smetics/Toiletries<br />
83
84 Group management report<br />
Adhesive Technologies<br />
<strong>Henkel</strong> <strong>Annual</strong> <strong>Report</strong> <strong>2011</strong><br />
Adhesive Technologies<br />
• Organic sales growth of 8.3 percent<br />
• Adjusted 1 operating profit improved significantly by 14.7 percent to 1,075 million euros<br />
• Adjusted 1 return on sales increased by 1.1 percentage points to 13.9 percent<br />
• Return on capital employed (ROCE) up 2.1 percentage points to 14.6 percent<br />
• Economic value added (EVA ® ) improved by 209 million euros to 282 million euros<br />
Top brands<br />
Innovations <strong>2011</strong><br />
Pattex 100%<br />
Pattex 100% is based on our<br />
patented “Flextec Technology”<br />
and is 100 percent solvent-free.<br />
The product offers high adhesive<br />
strength with easy usability and<br />
is universally suitable for projects<br />
both in and around the house.<br />
www.pattex.de<br />
Key financials *<br />
Loctite<br />
Loctite offers the first range of<br />
label-free anaerobic products<br />
covering all applications from<br />
fastener locking to thread and<br />
surface sealing.<br />
www.loctiteproducts.com<br />
in million euros 2010 <strong>2011</strong> +/–<br />
Sales 7,306 7,746 6.0 %<br />
Proportion of <strong>Henkel</strong> sales 48 % 50 % 2 pp<br />
Operating profit (EBIT) 878 1,002 14.1 %<br />
Adjusted operating profit (EBIT) 938 1,075 14.7 %<br />
Return on sales (EBIT) 12.0 % 12.9 % 0.9 pp<br />
Adjusted return on sales (EBIT)<br />
Return on capital employed<br />
12.8 % 13.9 % 1.1 pp<br />
(ROCE) 12.5 % 14.6 % 2.1 pp<br />
Economic value added (EVA ® ) 73 282 >100 %<br />
pp = percentage points<br />
* Calculated on the basis of units of 1,000 euros; figures<br />
commercially rounded.<br />
1 Adjusted for one-time charges/gains and restructuring charges.<br />
Sales development *<br />
Aquence <strong>Co</strong>-Cure 900 Series<br />
This award-winning, patented<br />
solution from Aquence combines<br />
several surface-coating operations<br />
performed in paint shops, leading<br />
to savings in energy costs and<br />
reducing production complexity<br />
for our customers.<br />
www.henkel.com/aquenceautophoretic-12623.htm<br />
in percent <strong>2011</strong><br />
Change versus previous year 6.0<br />
Foreign exchange –2.1<br />
Adjusted for foreign exchange 8.1<br />
Acquisitions/divestments –0.2<br />
Organic 8.3<br />
of which price 5.3<br />
of which volume 3.0<br />
* Calculated on the basis of units of 1,000 euros.
<strong>Henkel</strong> <strong>Annual</strong> <strong>Report</strong> <strong>2011</strong><br />
Economic environment and market position<br />
Set against the strong developments encountered<br />
in 2010, the growth rates of our markets underwent<br />
a slow-down in the year under review. While<br />
growth in almost all our industrial sectors flattened,<br />
particularly in the second half of the<br />
year, private consumption remained stable.<br />
Overall market volume increased in the low<br />
single-digit percentage range. However, developments<br />
in the various markets of relevance to<br />
our adhesives, sealants and surface treatment<br />
technologies were mixed. The construction sector<br />
saw a small degree of expansion, while<br />
growth rates in the steel, automotive and electronic<br />
industries were lower in <strong>2011</strong> compared to<br />
the significant gains made in 2010.<br />
All our regions registered growth in <strong>2011</strong>, with the<br />
upward trend in the emerging markets once<br />
again taking prominence. Working from a balanced<br />
business and regional platform, we were able<br />
once again to utilize our strong portfolio in<br />
accelerating growth past that of our markets. Our<br />
extensive presence in the emerging markets was<br />
a contributory factor in this regard. Overall, we<br />
were able to further consolidate our leading<br />
market position in the world and gain further<br />
market share.<br />
However, the substantial rise in prices for raw<br />
materials and packaging was a particular challenge.<br />
This was exacerbated by supply shortages<br />
with respect to various important raw materials<br />
resulting from persistent capacity limitations<br />
among some of our vendors.<br />
Looking forward, certain dominant trends will<br />
continue to provide growth momentum – for<br />
example, the ever-present need to increase energy<br />
efficiency and reduce carbon dioxide emissions,<br />
leading to higher demand for sustainable products<br />
and technologies. In addition, new areas of<br />
application for adhesives and sealants are constantly<br />
arising.<br />
Business activity and strategy<br />
The Adhesive Technologies business sector<br />
comprises five market- and customer-focused<br />
strategic business units.<br />
In the Adhesives for <strong>Co</strong>nsumers, Craftsmen and<br />
Building business, we market a wide range of<br />
brandname products for private and professional<br />
users. Based on our four international brand<br />
platforms, namely Loctite, Pritt, Pattex and<br />
Ceresit, we offer target group-aligned system<br />
solutions for applications in the household, in<br />
schools and offices, for do-it-yourselfers and<br />
craftsmen and also for the building industry.<br />
Our Transport and Metal business serves major<br />
international customers in the automotive and<br />
metal-processing industries, offering tailored<br />
system solutions and specialized technical services<br />
that cover the entire value chain – from steel<br />
coating to final vehicle assembly. With BASF<br />
<strong>Co</strong>atings GmbH, we have established a joint<br />
venture aligned to the development of innovative<br />
corrosion protection solutions for the automotive<br />
industry, which went operational in <strong>2011</strong>.<br />
Within the General Industry business, our<br />
customers comprise manufacturers from a multitude<br />
of industries, ranging from household<br />
appliance producers to the wind power industry.<br />
Our portfolio here encompasses Loctite products<br />
for industrial main tenance, repair and overhaul,<br />
as well as a wide range of sealants and system<br />
solutions for surface treatment applications, and<br />
specialty adhesives. Through our high-quality<br />
solutions, we help our customers strengthen<br />
their own competitiveness.<br />
The Packaging, <strong>Co</strong>nsumer Goods and <strong>Co</strong>nstruction<br />
Adhesives business serves major international<br />
customers as well as medium- and small-sized<br />
manufacturers of the consumer goods and furniture<br />
industries. Leveraging our economies of<br />
scale, we offer attractive solutions for standard<br />
and volume applications. Through our global technical<br />
customer service, we also provide innovative<br />
product ideas and technical advice, enabling<br />
our customers to become more efficient<br />
and achieve more with less material input.<br />
Our Electronics business offers customers from<br />
the worldwide electronics industry a comprehensive<br />
portfolio of innovative high-tech adhesives<br />
and soldering materials for the manu facture of<br />
microchips and printed circuit boards. Disproportionately<br />
high investments in research and development<br />
and cooperation with our customers help<br />
in engineering solutions for future product generations.<br />
Within the Adhesive Technologies business sector,<br />
we therefore cover the requirements of widely<br />
differing customer groups and industries<br />
Group management report<br />
Adhesive Technologies<br />
85
86 Group management report<br />
Adhesive Technologies<br />
<strong>Henkel</strong> <strong>Annual</strong> <strong>Report</strong> <strong>2011</strong><br />
Sales<br />
in million euros<br />
2007 5,711<br />
2008 6,700<br />
2009 6,224<br />
2010 7,306<br />
<strong>2011</strong> 7,746<br />
+8.3%<br />
organic sales growth in a<br />
world market with growth in<br />
the low single-digits.<br />
30%<br />
innovation rate.<br />
worldwide. We intend to further expand our leading<br />
market positions with high profitability in all<br />
our business segments and regions, endeavoring<br />
to grow faster than the respective markets. An<br />
important success factor in this regard is our<br />
specific application know-how in the relevant<br />
technical fields. Due to the close contact and the<br />
extensive cooperation existing between our sales<br />
personnel and our customers, we can deliver<br />
tailored products and services on a global scale.<br />
Through strict portfolio management and our<br />
focus on strengthening our top brands, we increased<br />
the proportion of sales accounted for by<br />
our top ten brands to 54 percent in the year under<br />
review.<br />
The close contact of our employees with customers<br />
and users is also an important source of innovation.<br />
We further see our commitment to developing<br />
sustainable solutions as a significant innovation<br />
driver and differentiator within the competitive<br />
environment. We have already attained an acknowledged<br />
leading position in the sustainability field<br />
within our markets. We will consistently extend<br />
this as we pursue the long-term sustainability<br />
strategy that <strong>Henkel</strong> has put in place.<br />
Through a range of measures, we are continually<br />
increasing our innovation rate: In <strong>2011</strong>, we generated<br />
around 30 percent of our sales with products<br />
successfully launched onto the market within<br />
the last five years.<br />
Our strong position in emerging markets is also<br />
an important engine for growth. We harness the<br />
high market dynamics and the disproportionate<br />
rise in demand for adhesives encountered in<br />
these markets to drive our business development.<br />
We will thus continue to increase our investments<br />
in these regions going forward.<br />
In the future, we intend to utilize our scale even<br />
more effectively in order to add to our competitiveness.<br />
As in recent years, we will further improve<br />
our structures. We are currently placing<br />
new emphasis on the global standardization of<br />
our business processes and the grouping of activities<br />
within our shared service centers. We also<br />
intend to generate further economies of scale by<br />
reducing complexity in our product ranges and<br />
our brands portfolio. We regularly review all components<br />
of our portfolio in terms of their contribution<br />
to achieving the long-term objectives of<br />
the business sector. Hence, in <strong>2011</strong> again we<br />
divested a number of small, non-core activities.<br />
Sales and profits<br />
The Adhesive Technologies business sector continued<br />
its profitable growth trend in <strong>2011</strong>. In an<br />
increasingly difficult general market environment,<br />
we improved sales by 6.0 percent nominally to<br />
a new high of 7,746 million euros. At 8.3 percent,<br />
organic growth – i.e. after adjusting for foreign<br />
exchange and acquisitions/divestments – was<br />
once again significantly higher than the rate by<br />
which our relevant markets expanded. This good<br />
performance was achieved through a mix of price<br />
and volume increases. With growth in the midsingle-digit<br />
percentage range, the mature markets<br />
of Western Europe and North America showed<br />
favorable expansion overall. In our emerging markets,<br />
we again generated disproportionate doubledigit<br />
growth, with our highest rates of increase<br />
occurring in the Eastern Europe region.<br />
As in recent years, we continued to pursue the<br />
long-term adaptation of our cost structures and<br />
capacities in <strong>2011</strong>. With an EBIT of 1,002 million<br />
euros for <strong>2011</strong>, we succeeded for the first time in<br />
posting an operating profit figure above the 1 billion<br />
euro mark. Adjusted operating profit for the<br />
year came in at 1,075 million euros. As a result,<br />
return on sales rose by 0.9 percentage points<br />
versus the previous year, to 12.9 percent. Adjusted<br />
return on sales once again reached a new high<br />
with 13.9 percent.<br />
The negative impact on gross margin emanating<br />
from the substantial rise in material costs was<br />
extensively offset by price increases in all our businesses<br />
and regions, as well as our ongoing measures<br />
to reduce costs and increase efficiency in<br />
both production and supply chain. Net working<br />
capital expressed as a proportion of sales amounted<br />
to 15.1 percent. Return on capital employed<br />
(ROCE) increased appreciably by 2.1 percentage<br />
points to 14.6 percent. Our economic value<br />
added (EVA ® ) improved by 209 million euros to<br />
282 million euros.
<strong>Henkel</strong> <strong>Annual</strong> <strong>Report</strong> <strong>2011</strong><br />
Business areas<br />
Adhesives for <strong>Co</strong>nsumers, Craftsmen and Building<br />
The Adhesives for <strong>Co</strong>nsumers, Craftsmen and<br />
Building business once again performed well.<br />
As a result of a slight recovery in the building<br />
sector, particularly in Eastern Europe, our<br />
business with the construction industry made<br />
a significant contribution to the rise in revenues.<br />
We achieved the highest growth versus prior<br />
year in Eastern Europe and Africa/Middle East.<br />
Industrial Adhesives<br />
We were also able to substantially increase sales in<br />
the Packaging, <strong>Co</strong>nsumer Goods and <strong>Co</strong>nstruction<br />
Adhesives business. Supply shortages with respect<br />
to certain important raw materials impacted<br />
particularly heavily on this business. Nevertheless,<br />
all our regions were able to contribute to<br />
its gratifying performance, with our emerging<br />
markets generating double-digit growth rates<br />
across the board.<br />
Following a further recovery in its sales markets,<br />
our Transport and Metal business was able to<br />
maintain its good sales performance from 2010<br />
also in <strong>2011</strong>. Our ongoing investments in research<br />
and development were rewarded with several<br />
customer awards, particularly in recognition of<br />
the contributions made by our products to increasing<br />
efficiency and improving quality.<br />
We posted our highest sales increase in the<br />
General Industry business. All our regions<br />
contributed to the strong growth, led by the<br />
emerging markets of Eastern Europe and Asia<br />
(excluding Japan). The mature markets of Western<br />
Europe and North America also showed a very<br />
pleasing development. Our Loctite brand business<br />
involving products for industrial maintenance,<br />
repair and overhaul made a vital contribution to<br />
this development.<br />
Following very strong growth in the previous year,<br />
demand for the products and services provided<br />
by our Electronics business weakened somewhat.<br />
Overall, sales in <strong>2011</strong> were slightly below the<br />
level of the previous year, due mainly to a decline<br />
in the Asia-Pacific region. This decrease is partially<br />
attributable to the natural disaster suffered<br />
in Japan. However, we were able to generate positive<br />
momentum with a range of new developments,<br />
particularly in relation to the rapidly growing<br />
market for mobile communication devices.<br />
Capital expenditures<br />
In <strong>2011</strong>, we invested primarily in improving the<br />
efficiency of our production facilities and in further<br />
expanding our capacities in the emerging markets.<br />
Overall, we increased our spend on property,<br />
plant and equipment from 109 million euros<br />
in 2010 to 154 million euros in the year under<br />
review.<br />
Outlook<br />
For 2012 we estimate organic sales growth in the<br />
mid-single-digit percentage range. We expect<br />
to once again develop significantly better in the<br />
emerging markets than in the mature markets.<br />
We see the prices for raw materials and packaging<br />
rising more slowly than in <strong>2011</strong>. Persistent capacity<br />
bottlenecks affecting our suppliers may once<br />
again lead to supply shortages. We will remain<br />
firmly focused on main taining our strict cost<br />
discipline. While increasing the quality of service<br />
to our customers, we can further improve<br />
our efficiency by grouping activities within our<br />
shared service centers. Also on the basis of our<br />
significantly improved cost structures, we expect<br />
adjusted return on sales to increase versus prior<br />
year (<strong>2011</strong> figure: 13.9 percent).<br />
We see opportunities for our business development<br />
primarily in expediting the launch of innovations<br />
and in the possibility that the market<br />
dynamics might be more positive than currently<br />
expected. Currently unpredictable relief could<br />
also come from the raw materials side.<br />
We see risks lying in the macroeconomic effects<br />
arising from the current debt crises and also, to<br />
a degree, in the development of our emerging<br />
markets. In key sectors such as the automotive<br />
and electronic industries, and also in the metalprocessing<br />
segment, lie not inconsiderable<br />
potential risks in case of declining demand.<br />
With a less dynamic demand, the competitive<br />
pressures would increase. Moreover, unexpectedly<br />
high increases in raw material and packaging<br />
prices could exacerbate the pressure on margins.<br />
Group management report<br />
Adhesive Technologies<br />
87
88 Group management report<br />
Risk report<br />
<strong>Henkel</strong> <strong>Annual</strong> <strong>Report</strong> <strong>2011</strong><br />
Risk report<br />
Risks and opportunities<br />
In the pursuit of our business activities, <strong>Henkel</strong><br />
becomes exposed to a multiplicity of risks inherent<br />
in the global market economy. We deploy an<br />
array of effective monitoring and control systems<br />
aligned to identifying risk at an early stage, evaluating<br />
the exposure and introducing effective<br />
countermeasures. We have incorporated these<br />
instruments within a uniform risk management<br />
system as described below.<br />
Entrepreneurial activity also involves identifying,<br />
developing and exploiting opportunities as a<br />
means of securing and extending the company’s<br />
competitiveness. The reporting aspect of our risk<br />
management system does not extend to entrepreneurial<br />
opportunity. Rather, we continuously<br />
examine and evaluate the opportunities available<br />
to us under the auspices of our business sectors,<br />
as an elementary component of our strategy.<br />
Major opportunities have been included in our<br />
forecast report on pages 93 to 95.<br />
Risk Management System<br />
The Risk Management System (RMS) at <strong>Henkel</strong><br />
is an integral component of the comprehensive<br />
planning, control and reporting regime practiced<br />
in the individual companies, in our business<br />
sectors and at corporate level. It encompasses<br />
the systematic identification, evaluation, management,<br />
documentation, communication and<br />
monitoring of risks. Risk control and monitoring<br />
combined with our Internal <strong>Co</strong>ntrol System (ICS)<br />
support our risk management capability within<br />
the corporate governance framework.<br />
We have defined the principles, processes and<br />
responsibilities relating to risk management in a<br />
corporate standard that is binding on the Group.<br />
New knowledge, intelligence and findings flow<br />
into our guidelines and systems as they are continuously<br />
developed. At <strong>Henkel</strong>, risk management<br />
is performed on a holistic, integrative basis<br />
involving the systematic assessment of our<br />
exposure. We understand risk as the likelihood<br />
of a negative deviation from a financial target or<br />
key performance indicator (KPI) resulting from<br />
an event or change in circumstances.<br />
Our annual risk reporting process begins with<br />
identifying major risks using checklists based on<br />
predefined operating risk categories (e.g. procurement<br />
and production) and predefined functional<br />
risk categories (e.g. information technology and<br />
human resources). We evaluate the risks in a<br />
two-stage process according to occurrence likelihood<br />
and potential loss. Included in the reporting<br />
remit are risks with a loss potential of at least<br />
1 million euros or 10 percent of the net external<br />
sales of a country, where the occurrence likelihood<br />
is considered greater than zero.<br />
We initially determine the gross risk and then,<br />
in a second stage, the net risk after taking into<br />
account our countermeasures. Initially, risks are<br />
recorded on a decentralized, per-country basis,<br />
with the assistance of regional coordinators. The<br />
locally collated risks are then analyzed by the<br />
experts in the business sectors and corporate<br />
functions, classified in the appropriate corporate<br />
management committees and finally assigned to<br />
a segment-specific risk inventory. <strong>Co</strong>rporate<br />
Accounting is responsible for coordinating the<br />
overall process and analyzing the inventoried<br />
exposure.<br />
All the risk management processes are supported<br />
by an intranet-resident database which ensures<br />
transparent communication throughout the<br />
entire corporation. Within the framework of its<br />
<strong>2011</strong> audit of our financial statements, the auditor<br />
examined the structure and function of our risk<br />
early warning system, confirming its adequacy<br />
and regulatory compliance.<br />
The following describes the main features of the<br />
internal control and risk management system in<br />
relation to our accounting processes in accordance<br />
with Section 315 (2) no. 5 of the German<br />
<strong>Co</strong>mmercial <strong>Co</strong>de [HGB] as amended by the<br />
German Accounting Law Reform Act [BilMoG]. In<br />
accordance with the definition of our Risk Management<br />
System, the objective of our accounting<br />
processes lies in the identification, evaluation<br />
and management of all those risks that jeopardize<br />
the regulatory preparation of our annual and<br />
consolidated financial statements. <strong>Co</strong>nsequently,<br />
it is the task of the Internal <strong>Co</strong>ntrol System implemented<br />
in order to combat such discrepancies, to<br />
put in place corresponding principles, procedures<br />
and controls that will ensure a regulatorily<br />
compliant process for the preparation of such<br />
financial statements.<br />
Within the organization of the Internal <strong>Co</strong>ntrol<br />
System, the Management Board assumes overrid-
<strong>Henkel</strong> <strong>Annual</strong> <strong>Report</strong> <strong>2011</strong><br />
ing responsibility at Group level. The duly coordinated<br />
subsystems of the Internal <strong>Co</strong>ntrol System<br />
lie within the spheres of responsibility of the<br />
functions Risk Management, <strong>Co</strong>mpliance, <strong>Co</strong>rporate<br />
Accounting, <strong>Co</strong>rporate Finance and Financial<br />
Operations. Within these functions, there<br />
are a number of integrated monitoring and control<br />
levels, ensuring multi-point stability of the<br />
internal control and risk management system.<br />
This is further attested by regular and comprehensive<br />
efficacy reviews performed by our<br />
Internal Audit function.<br />
Of the many and varied control processes incorporated<br />
into the accounting regime, some are<br />
worthy of particular mention. The basis for all<br />
our accounting processes is provided by our<br />
“Accounting” corporate standard, which contains<br />
detailed accounting and reporting instructions<br />
covering all major activities and material eventualities.<br />
It specifies, for example, the procedure to<br />
be adopted in inventory valuation, and how the<br />
transfer prices applicable for intra-group transactions<br />
are to be determined. This corporate<br />
standard is binding on the entire Group and is<br />
regularly reviewed and re-released by the CFO.<br />
In particular, further globally binding procedural<br />
instructions affecting our accounting practice<br />
are contained in our corporate standards “Treasury”<br />
and “Investments.”<br />
With appropriate organizational measures in<br />
conjunction with restrictive control of access to<br />
Major risk categories<br />
our information systems, we ensure the effective<br />
separation of responsibilities in our accounting<br />
systems between transaction entry on the one<br />
hand and checking/auditing and approval on the<br />
other. Documentation relating to the operational<br />
accounting and closure processes ensures that<br />
important tasks – such as the reconciliation of<br />
receivables and payables on the basis of balance<br />
statements and confirmations – are clearly assigned.<br />
Strict authorization regulations also exist<br />
governing the approval of contracts, credit notes<br />
and similar, and we practice the double-check<br />
security principle right across the board. This is<br />
also stipulated in our Group-wide corporate<br />
standards.<br />
We consider our systems to be fit for purpose<br />
and functionally efficient. They are regularly<br />
reviewed in order to determine their potential<br />
for further development and optimization. Once<br />
identified, such potential is duly utilized.<br />
Major risk categories<br />
Operating risks<br />
Procurement market risks<br />
On the procurement markets, we expect prices<br />
to rise further in 2012, albeit not to the same<br />
degree as encountered in <strong>2011</strong>. As uncertainties<br />
will continue to prevail in the development of<br />
raw material prices, we see additional price risks<br />
arising in relation to important raw materials<br />
Risk category<br />
Operating risks<br />
Likelihood Potential financial impact<br />
Procurement market risks Possible Major<br />
Production risks Unlikely Major<br />
Economic and sector-specific risks Likely Major<br />
Functional risks<br />
Financial risks<br />
Credit risks Unlikely Major<br />
Liquidity risks Unlikely Minor<br />
Currency risks Possible Major<br />
Interest rate risks Possible Minor<br />
Risks from pension obligations Possible Major<br />
Legal risks Unlikely Major<br />
IT risks Unlikely Major<br />
Personnel risks Possible Minor<br />
Environmental and safety risks Possible Major<br />
Business strategy risks Possible Moderate<br />
Group management report<br />
Risk report<br />
89
90 Group management report<br />
Risk report<br />
<strong>Henkel</strong> <strong>Annual</strong> <strong>Report</strong> <strong>2011</strong><br />
and packaging. Further price and supply risks<br />
ensue from the possibility of supply shortages in<br />
the procurement markets for reasons of demand<br />
or production restrictions. We combat these risks<br />
by adopting a comprehensive risk management<br />
approach. This involves the pro-active management<br />
of our vendor portfolio and utilization of<br />
our globally engaged, cross-divisional sourcing<br />
capability, together with strategies aimed at securing<br />
both price and volume through the conclusion<br />
of contracts. Where appropriate and possible,<br />
we also make prudent use of effectively<br />
tailored financial safeguards and hedging instruments.<br />
(For further information relating to the<br />
risks arising from derivative financial instruments<br />
used for hedging purposes, please refer<br />
to Note 21 on pages 128 to 138.)<br />
We also work within interdisciplinary teams<br />
(Research and Development, Supply Chain Management<br />
and Purchasing) on devising alternative<br />
formulations and different forms of packaging to<br />
be able to respond flexibly to unforeseen fluctuations<br />
in raw material prices. We also avoid becoming<br />
dependent on individual vendors so as<br />
to better secure the constant supply of the goods<br />
and services that we require. Close collaboration<br />
with our strategic suppliers plays an exceptionally<br />
important role in our risk man agement<br />
regime. We deal in detail with the assessment of<br />
vendor risk with respect to vendor financial stability<br />
in the section on “Procurement” on pages 67<br />
and 68. The basis for our successful risk management<br />
approach in this domain is a comprehensive<br />
procurement information system that ensures<br />
permanent transparency with respect to our<br />
purchasing volumes.<br />
Production risks<br />
Risks in the field of production arise in the<br />
<strong>Henkel</strong> case not only from low capacity utilization<br />
due to volume decreases, but also in the possibility<br />
of operational interruptions, especially at our<br />
so-called single-source sites. The negative effects<br />
of possible production outages can be offset<br />
through flexible production control and, where<br />
economically viable, appropriate insurance policies.<br />
Generally, risks in the field of production<br />
are minimized by ensuring a high level of employee<br />
qualification, establishing clearly defined<br />
safety standards, and carrying out regular plant<br />
and equipment maintenance. Decisions relating<br />
to capital expenditures on property, plant and<br />
equipment are made in accordance with defined,<br />
differentiated responsibility matrices and approval<br />
procedures in order to mitigate concomitant risk.<br />
The procedures implemented incorporate all the<br />
relevant specialist functions and are regulated in<br />
an internal corporate guideline requiring that<br />
such investments be analyzed in advance on the<br />
basis of a detailed risk appraisal. Further auditing<br />
and analytical procedures accompanying<br />
projects at the assessment and implementation<br />
stage provide the foundation for successful project<br />
management and effective risk reduction.<br />
Macroeconomic and sector-specific risks<br />
We remain exposed to macroeconomic risks<br />
emanating from the uncertainties of the current<br />
economic environment. Specifically, declining<br />
market growth combined with intensifying competitive<br />
pressures constitutes risk in both our<br />
branded consumer goods and our industrial<br />
businesses. We are currently observing an ongoing<br />
process of consolidation within the retail trade,<br />
resulting in increased pressure on both prices<br />
and terms of business relating to the trade’s own<br />
private labels. Our focus therefore is on achieving<br />
a steady increase in our brand equities and<br />
developing further innovations. We see innovative<br />
products as enabling us to differentiate ourselves<br />
from the competition, this being a significant<br />
prerequisite for the success of our company.<br />
Functional risks<br />
Financial risks<br />
<strong>Henkel</strong> is exposed to financial risk in the form of<br />
credit risks, liquidity risks, currency risks, interest<br />
rate risks and risks arising from our pension<br />
obligations.<br />
For information relating to our credit risk, liquidity<br />
risk, interest rate and currency risk, including<br />
the risk-limiting measures applied and the management<br />
approach to such exposure, please refer<br />
to Note 21 on pages 128 to 138.<br />
Risks from pension obligations relate to changes<br />
in interest rates, inflation rates, trends in wages<br />
and salaries, and changes in the statistical life<br />
expectancy of pension beneficiaries. To minimize<br />
exposure and improve risk management,<br />
the pension obligations arising in the most<br />
important countries are therefore almost fully<br />
funded. They are managed on the basis of a twotrack<br />
portfolio approach: The main portion of the<br />
portfolio is invested in interest-bearing plan<br />
assets (liability-driven investments), reducing<br />
the interest rate and inflation risk. In order to
<strong>Henkel</strong> <strong>Annual</strong> <strong>Report</strong> <strong>2011</strong><br />
cover the risks arising from trends in wages,<br />
salaries and life expectancies, and to close the<br />
potential deficit between plan assets and pension<br />
obligations over the long term, additional investments<br />
are made in a return-enhancing portfolio<br />
as an add-on instrument that contains assets<br />
such as equities, private equity investments,<br />
hedge funds, real estate and commodity investments.<br />
The pension funds can be adversely affected in<br />
the event of a downturn in the capital markets.<br />
We mitigate this risk by investing in widely<br />
diversified classes of assets and different instruments<br />
within each asset class. The risks inherent<br />
in the pension plan assets are continuously monitored<br />
and controlled on the basis of risk and<br />
return criteria. Risks are quantified using sensitivity<br />
analyses. Major pension funds are administered<br />
by external fund managers in Germany,<br />
the USA, the UK, Ireland and the Netherlands. All<br />
these countries follow the above-described standard<br />
investment strategy and are centrally monitored.<br />
The funds covering our pension obligations<br />
are invested on the basis of asset-liability<br />
studies aligned to the expected cash flows arising<br />
from the country-specific pension obligations.<br />
Further information on the development of<br />
our pension obligations can be found in Note 15<br />
on pages 120 to 124.<br />
Legal risks<br />
As a globally active corporation, we are also<br />
exposed in the course of our ordinary business<br />
activities to a range of risks relating to litigations<br />
and other proceedings or actions, including<br />
those brought by governmental agencies, in<br />
which we are currently involved or may become<br />
involved in the future. These risks arise, in particular,<br />
in the fields of product liability, product<br />
deficiency, laws relating to competition and<br />
monopolies, the infringement of proprietary<br />
rights, patent law and tax law, and environmental<br />
protection and land contamination issues. The<br />
possibility cannot be discounted that the final<br />
decisions taken in some of these litigations and<br />
proceedings will go against us.<br />
We counteract legal risks by issuing corresponding<br />
binding guidelines and codes of conduct and<br />
by instituting appropriate training measures. We<br />
address current actions and the associated exposure<br />
by maintaining constant contact between<br />
the corporate legal department and local attorneys,<br />
and also through our separate reporting<br />
system. For certain legal risks, we have concluded<br />
insurance policies that are standard for the industry<br />
and that we consider to be fit for purpose.<br />
We form provisions for litigations where it is<br />
likely in our estimation that obligations may<br />
arise which are either excluded from or not fully<br />
covered by our insurance policies and where a<br />
reasonably accurate estimate of the potential loss<br />
is possible. However, predicting the results of<br />
actions is beset with considerable difficulties,<br />
especially in cases in which the claimant is seeking<br />
substantial or unspecified damages. Given<br />
these imponderables, we are unable to predict<br />
what obligations may arise from such litigations.<br />
<strong>Co</strong>nsequently, major losses can emanate from<br />
litigations and proceedings that are not covered<br />
by our insurance policies or our provisions.<br />
We do not currently foresee risks arising from<br />
litigations or proceedings, either pending or<br />
threatened, that could have a material influence<br />
on our net assets, financial position or results of<br />
operations.<br />
Supplementary information on pending actions:<br />
<strong>Henkel</strong> is involved in litigations being brought<br />
by various antitrust authorities in Europe. These<br />
relate to infringements, some of which occurred<br />
more than ten years ago. <strong>Henkel</strong> has cooperated<br />
with the authorities with respect to all such<br />
actions.<br />
On April 13, <strong>2011</strong>, the European <strong>Co</strong>mmission imposed<br />
fines on a number of international laundry<br />
detergent manufacturers for reason of infringements<br />
that had occurred in various countries in<br />
Western Europe between 2002 and the beginning<br />
of 2005, which were discovered by <strong>Henkel</strong> in the<br />
course of internal compliance audits carried out<br />
in 2008. <strong>Henkel</strong> then immediately informed the<br />
relevant authorities and contributed materially<br />
to investigations into the matter. Due to our<br />
extensive cooperation with the EU <strong>Co</strong>mmission,<br />
<strong>Henkel</strong> was granted full immunity from fines.<br />
On December 8, <strong>2011</strong>, the French antitrust authorities<br />
imposed fines totaling around 360 million<br />
euros on several international detergent<br />
manufacturers on account of antitrust violations<br />
in France in the period from 1997 to 2004. <strong>Henkel</strong><br />
received a fine of around 92 million euros. We<br />
have deposited the monies and filed an action<br />
against the decision of the French antitrust<br />
authorities. This action has no suspensive effect<br />
with regard to lodgment of the fine. In our<br />
Group management report<br />
Risk report<br />
91
92 Group management report<br />
Risk report<br />
<strong>Henkel</strong> <strong>Annual</strong> <strong>Report</strong> <strong>2011</strong><br />
opinion and in that of the attorneys from whom<br />
we are seeking advice, the French antitrust<br />
authorities’ decision is not legally correct. We<br />
cooperated extensively with the antitrust authorities<br />
throughout the entire proceedings and, on<br />
the basis of our own internal investigations,<br />
supplied important information that assisted in<br />
establishing the key facts of the matter in France.<br />
In addition, we were the first company to disclose<br />
the European dimension of the case. In our understanding,<br />
the case in France is directly related<br />
to the antitrust violations concerning heavy-duty<br />
detergents in various West European countries<br />
– including France – that led to sanctions being<br />
imposed by the European <strong>Co</strong>mmission on April<br />
13, <strong>2011</strong>. We were granted full exemption from<br />
any fines in relation to these antitrust violations.<br />
It would be contradictory if the French antitrust<br />
authorities were to impose separate sanctions on<br />
us in respect of these infringements.<br />
Information technology risks<br />
The risks associated with our IT operations<br />
relate primarily to the potential for unauthorized<br />
access and data loss. Appropriate approval<br />
procedures, authorization profiles and defensive<br />
technologies are deployed in order to guard<br />
against such eventualities. Daily data back-up<br />
runs are conducted to shadow all critical databases,<br />
and the resultant files are transferred to<br />
another site. We also carry out regular restore<br />
tests. External attacks that took place in <strong>2011</strong> –<br />
for example in the form of hacking, spamming or<br />
viruses – were successfully repelled by the security<br />
measures implemented and therefore had no<br />
disruptive effect on our business processes.<br />
Moreover, <strong>Henkel</strong> has put in place a globally<br />
binding internal IT guideline to which our external<br />
service-providers are also bound. Major components<br />
of this code include measures for avoiding<br />
risk, and descriptions of escalation processes<br />
and best-practice technologies. <strong>Co</strong>rrect implementation<br />
is continuously monitored by our<br />
globally active Internal Audit function. In addition,<br />
our safeguards are examined for their efficacy<br />
and efficiency by external specialists.<br />
Personnel risks<br />
The future economic development of <strong>Henkel</strong> is<br />
essentially dependent upon the commitment and<br />
capabilities of our employees. We respond to the<br />
increasing competition for well qualified technical<br />
and managerial staff by maintaining close<br />
contacts with selected universities and by<br />
conducting special recruitment campaigns. Our<br />
new employer branding campaign is serving to<br />
position us even more effectively as an employer<br />
of choice. We combat the risk of failing to retain<br />
valuable employees over the long term through<br />
specifically aligned personnel development<br />
programs. The basis for these is provided by<br />
regular potential and performance analyses<br />
leading to attractive qualification and further<br />
training opportunities linked to performance-<br />
related compensation arrangements. You will<br />
find further information relating to our employees<br />
on pages 64 to 66.<br />
Environmental and safety risks<br />
<strong>Henkel</strong> is a global manufacturing company and<br />
is therefore exposed to risks pertaining to<br />
environment, safety, health and social standards,<br />
manifesting in the form of personal injury, physical<br />
damage to goods and reputational damage. We<br />
minimize these risks by applying the appropriate<br />
management systems and processes, and also<br />
through our auditing, advisory and training<br />
activities. We update these preventive and precautionary<br />
measures on a continual basis with a<br />
view to safeguarding our facilities, assets and<br />
reputation. Integrity in this respect is further<br />
ensured by compliance with high technical standards<br />
and our rules of conduct, and by faithful<br />
implementation of relevant statutory directives.<br />
Business strategy risks<br />
Business strategy risks can arise from the expectations<br />
that we have invested in internal projects,<br />
acquisitions and strategic alliances failing to<br />
materialize in part or in full. This may, in turn,<br />
mean that we are unable to recoup the associated<br />
capital expenditures. Individual projects could<br />
also be delayed by unforeseen risks. We endeavor<br />
to minimize these business strategy risks<br />
through regular and intensive analysis of the<br />
market and our competition.<br />
Our strategy of standardizing our processes on a<br />
global scale and concentrating our production<br />
facilities may give rise, for example, to strained<br />
relationships with employees and vendors. We<br />
limit exposure through early risk analyses<br />
performed by experienced specialist departments,<br />
supported by external consultants where<br />
appropriate.
<strong>Henkel</strong> <strong>Annual</strong> <strong>Report</strong> <strong>2011</strong><br />
Overall risk – Management Board appraisal<br />
At the time of writing this report, there are no<br />
identifiable risks relating to future developments<br />
that could endanger the existence either of<br />
<strong>Henkel</strong> <strong>AG</strong> & <strong>Co</strong>. <strong>KGaA</strong> or of the Group as a going<br />
concern. As we have no special-purpose entities<br />
or investment vehicles, there is no risk that<br />
might emanate from such a source. Aggregation<br />
of the most significant individual risks is not<br />
appropriate due to the unlikelihood that such<br />
risks would occur simultaneously. Our risk analysis<br />
indicates that our exposure to risk does not<br />
represent any lasting endangerment to the net<br />
assets, financial position and results of operations<br />
either of <strong>Henkel</strong> <strong>AG</strong> & <strong>Co</strong>. <strong>KGaA</strong> or of the<br />
Group. The overall picture shows no underlying<br />
change to the risk situation compared to the<br />
previous year. The system of risk categorization<br />
undertaken by <strong>Henkel</strong> continues to indicate that<br />
the most significant exposure currently relates to<br />
the impact of macroeconomic and sector uncertainty<br />
and financial risk, to which we are responding<br />
with the countermeasures described.<br />
Forecast<br />
Macroeconomic development<br />
Overview: Gross domestic product growth below<br />
3 percent with mixed regional developments<br />
expected<br />
We expect 2012 to bring a general slowdown in<br />
economic growth, but without a global collapse<br />
such as experienced in the crisis year 2008/2009.<br />
Based on the data provided by Feri EuroRating<br />
Services 1, we expect gross domestic product to<br />
rise by less than 3 percent.<br />
2012 should again see the emerging regions<br />
undergo robust economic expansion, supported<br />
in particular by developments in Russia and<br />
China. For Asia (excluding Japan) we expect an<br />
increase in economic output of around 6 percent,<br />
while that of Latin America is likely to be about<br />
4 percent. Eastern Europe should grow by around<br />
3 percent, while expansion of the economies in<br />
the Africa/Middle East region is anticipated at<br />
roughly 4 percent.<br />
We expect the industrialized countries to grow<br />
1.5 percent. North American GDP is likely to expand<br />
2 percent. Western Europe’s growth should<br />
be less than 1 percent, that of Japan 2 percent.<br />
1 As of January 2012.<br />
Raw material prices: Moderate rise in price level<br />
With raw material prices having consolidated at<br />
a high level during the second half of <strong>2011</strong>, we<br />
expect them to rise moderately in 2012. In the<br />
previous year, we were confronted with a high<br />
degree of volatility in the procurement markets.<br />
For 2012, we expect uncertainties in relation to<br />
raw material price developments. We also anticipate<br />
that logistics services will become more expensive.<br />
Currencies: No major changes<br />
We do not expect any material change in the euro<br />
exchange rate versus the US dollar, with the annual<br />
average for 2012 likely to be around 1.41 US dollars.<br />
However, this is based on the assumption that the<br />
debt crisis in Europe will not increase in severity<br />
and that a political solution will be found. Moreover,<br />
based on these assumptions, we expect that<br />
currencies of importance for <strong>Henkel</strong> from the<br />
emerging regions, such as the Russian ruble, the<br />
Mexican peso and the Polish zloty, will moderately<br />
appreciate in this economic climate.<br />
Our forecasts are based on the following<br />
exchange rates:<br />
Average exchange rates versus the euro<br />
<strong>2011</strong> 20121<br />
Chinese yuan 8.99 8.69<br />
Mexican peso 17.31 16.40<br />
Polish zloty 4.13 3.91<br />
Russian ruble 40.91 40.30<br />
US dollar<br />
1 Forecast.<br />
1.39 1.41<br />
Inflation: Slight increase in global price indices<br />
expected<br />
According to data supplied by Feri EuroRating<br />
Services, global inflation is forecasted to be<br />
around 4 percent. While we can expect a continuing<br />
high degree of price stability for the industrialized<br />
countries with the figure at 2 percent,<br />
the inflation rate of the emerging regions<br />
is likely to average around 6 percent.<br />
Sector development<br />
<strong>Co</strong>nsumption and the retail sector:<br />
Growth at <strong>2011</strong> level<br />
Based on data provided by Feri EuroRating<br />
Services, we anticipate that worldwide private<br />
consumption – and, linked to this, retail sales –<br />
will expand in 2012 at approximately the same<br />
rate as in <strong>2011</strong> (about 3 percent). <strong>Co</strong>nsumers in<br />
Group management report<br />
Risk report / Forecast<br />
93
94 Group management report<br />
Forecast<br />
<strong>Henkel</strong> <strong>Annual</strong> <strong>Report</strong> <strong>2011</strong><br />
the industrialized countries are expected to<br />
spend about 1 percent more than in <strong>2011</strong>, while<br />
the emerging markets will again see a rise in<br />
consumption of about 5 percent in 2012.<br />
Industry: Growth of 3 percent<br />
According to data supplied by Feri EuroRating<br />
Services, growth in industrial output will ease in<br />
2012 compared to <strong>2011</strong> and, at around 3 percent,<br />
will only expand slightly faster than the global<br />
economy as a whole.<br />
It is expected that the transport industry will<br />
register a plus of over 3 percent, with the automotive<br />
sector posting a similar number. Production<br />
of the electronics industry, an important customer<br />
sector for <strong>Henkel</strong>, should also increase further,<br />
by about 4 percent. Growth in basic products<br />
such as semiconductors and printed circuit<br />
boards is actually likely to be more robust than<br />
in <strong>2011</strong>. Production of the metal industry should<br />
expand more slowly than in <strong>2011</strong>, with growth<br />
expected to be around 3 percent. Developments<br />
in consumer-related sectors such as the global<br />
packaging industry are likely to be sluggish,<br />
growing according to our estimates in the low<br />
single-digit percentage range, as was the case<br />
in <strong>2011</strong>. Global construction should expand by<br />
around 2 percent.<br />
Opportunities: Emerging regions and innovative<br />
products with plenty of potential<br />
We continue to see great potential in the emerging<br />
markets, with above-average growth opportunities<br />
from which we intend to benefit through<br />
our local business activities. The regions concerned<br />
include, in particular, Asia, Eastern Europe<br />
and Africa/Middle East, with Latin America also<br />
part of the wider group.<br />
We regard our research and development activities<br />
as a further great source of opportunity. We are<br />
developing a steady stream of new and innovative<br />
products and product solutions offering our<br />
customers added value. We have a well filled and<br />
balanced pipeline of medium and long-term projects<br />
involving products and systems that we intend<br />
to launch onto the markets of all three of<br />
our business sectors, both this year and in years<br />
to come.<br />
Further opportunity lies in our strict focus on<br />
cost and our willingness to constantly examine<br />
and analyze the status quo. Such scrutiny regu-<br />
larly reveals further potential for cost reductions<br />
and capacity adjustments, or the elimination of<br />
non-core business activities and minor brands<br />
from our portfolio. We also expect the planned<br />
further expansion of our shared service centers<br />
to make a substantial contribution to cost reduction.<br />
Opportunities will also arise from the ongoing<br />
pursuit and implementation of our three strategic<br />
priorities, which we explain in detail in the<br />
section entitled “Strategy and financial targets<br />
for 2012” on pages 45 to 48.<br />
Further specific opportunities and risks are<br />
discussed in the individual business sector<br />
reports starting on page 76.<br />
Outlook for the <strong>Henkel</strong> Group in 2012<br />
We expect the <strong>Henkel</strong> Group to generate organic<br />
sales growth of between 3 and 5 percent in fiscal<br />
2012.<br />
We are confident of continuing the positive<br />
growth trend posted by our consumer goods<br />
businesses, with revenues expanding in the<br />
low single-digit percentage range.<br />
For the Adhesive Technologies business sector,<br />
we expect sales to grow in the mid-single-digit<br />
percentage range.<br />
We base this prediction on our strong competitive<br />
position. This we have consolidated and further<br />
extended in recent years through our innovative<br />
strength, our strong brands, our leading<br />
market presence and the quality of our portfolio.<br />
In recent years we have introduced a number of<br />
measures that have had a positive impact on our<br />
cost structure. And in this year too, we intend to<br />
further adapt our structures to the constantly<br />
changing market conditions as a continuation of<br />
our commitment to strict cost discipline. We also<br />
intend to counteract the burden on earnings<br />
caused by high raw material costs.<br />
These factors, together with the expected increase<br />
in sales, will positively influence our earnings<br />
development. Based on our <strong>2011</strong> results, we<br />
anticipate achieving an increase in adjusted 1<br />
return on sales (EBIT) to 14 percent (<strong>2011</strong>:<br />
13.0 percent) and an increase in adjusted earnings<br />
per preferred share of at least 10 percent.<br />
1 After adjusting for one-time charges/gains and restructuring<br />
charges.
<strong>Henkel</strong> <strong>Annual</strong> <strong>Report</strong> <strong>2011</strong><br />
We also expect the following developments in 2012:<br />
• Increase in the prices for raw materials,<br />
packaging, contract manufacturing and traded<br />
goods in the mid-single-digit percentage range.<br />
• Restructuring charges of around 100 million<br />
euros.<br />
• Investments in property, plant and equipment<br />
of around 410 million euros.<br />
Further specific expectations are discussed in<br />
the individual business sector reports starting<br />
on page 76.<br />
Financial targets for 2012<br />
<strong>Annual</strong> organic sales growth (average):<br />
3–5 percent<br />
Adjusted return on sales (EBIT):<br />
14 percent<br />
<strong>Annual</strong> growth in adjusted earnings per<br />
preferred share (average):<br />
> 10 percent<br />
Dividends<br />
In keeping with our financial strategy, the dividend<br />
payout should be around 25 percent of net<br />
income attributable to shareholders of <strong>Henkel</strong> <strong>AG</strong><br />
& <strong>Co</strong>. <strong>KGaA</strong>. Based on the anticipated increase in<br />
earnings, we therefore expect to further increase<br />
dividends paid for 2012.<br />
Capital expenditures<br />
We are planning to increase our investments<br />
in property, plant and equipment to around<br />
410 million euros in 2012. In so doing, we will<br />
be increasing our focus on investment in our<br />
emerging markets. For structural reasons, the<br />
majority of our capital expenditures will be in<br />
Europe and North America.<br />
Major investments in production facilities for the<br />
manufacture of innovative products are planned<br />
for the business sectors Laundry & Home Care<br />
and <strong>Co</strong>smetics/Toiletries. Another major area lies<br />
in production plant optimization and capacity<br />
expansion. The focus of our Adhesive Technologies<br />
business sector in 2012 will be on consolidating<br />
and rationalizing our production footprint.<br />
As part of this process, in <strong>2011</strong> we laid the foundations<br />
in China for the construction of our largest<br />
industrial adhesives production facility<br />
worldwide. In the emerging markets of Eastern<br />
Europe and South America, our investment activities<br />
will concentrate on expanding production<br />
capacity.<br />
Acquisitions, financing and liquidity<br />
We plan to further reduce our net debt in fiscal<br />
2012. We intend to maintain a sufficient balance<br />
of liquid funds in order to enhance our financial<br />
flexibility. We are further aiming at renewing the<br />
credit line, which expires in 2012, safeguarding<br />
our commercial paper program.<br />
Thanks to continuing good business performance<br />
and our improved financial profile, we<br />
regained our target ratings of “A flat” (Standard &<br />
Poor’s) and “A2” (Moody’s) in the second quarter<br />
of <strong>2011</strong>. Looking forward we intend not to jeopardize<br />
our target ratings in the long term when<br />
assessing possible acquisitions.<br />
Post-2012 outlook<br />
Diligent pursuit of our strategic priorities<br />
formulated in 2008 has led to a significant improvement<br />
in our key financials, with the trend<br />
remaining upward. We will again be aiming to<br />
achieve profitable growth in 2013. We will be<br />
presenting specific financial targets for the<br />
years after 2012 at the end of fiscal 2012.<br />
Subsequent events<br />
There have been no notifiable events.<br />
Group management report<br />
Forecast / Subsequent events<br />
95
96 <strong>Co</strong>nsolidated fi nancial statements<br />
Subindex<br />
<strong>Henkel</strong> <strong>Annual</strong> <strong>Report</strong> <strong>2011</strong><br />
<strong>Co</strong>nsolidated<br />
financial statements<br />
Subindex<br />
98 <strong>Co</strong>nsolidated statement of financial position<br />
100 <strong>Co</strong>nsolidated statement of income<br />
101 <strong>Co</strong>nsolidated statement of comprehensive<br />
income<br />
101 <strong>Co</strong>nsolidated statement of changes in<br />
equity<br />
102 <strong>Co</strong>nsolidated statement of cash flows<br />
103 Group segment report by business sector<br />
104 Key financials by region<br />
105 Accounting principles and methods applied<br />
in preparation of the consolidated financial<br />
statements<br />
Notes to the consolidated statement of<br />
financial position<br />
111 Intangible assets<br />
114 Property, plant and equipment<br />
116 Other financial assets<br />
116 Other assets<br />
117 Deferred taxes<br />
117 Inventories<br />
117 Trade accounts receivable<br />
117 Cash and cash equivalents<br />
118 Assets held for sale<br />
118 Issued capital<br />
119 Capital reserve<br />
119 Retained earnings<br />
119 Other components of equity<br />
119 Non-controlling interests<br />
120 Pension obligations<br />
125 Income tax provisions and other provisions<br />
126 Borrowings<br />
127 Other financial liabilities<br />
127 Other liabilities<br />
127 Trade accounts payable<br />
128 Financial instruments report
<strong>Henkel</strong> <strong>Annual</strong> <strong>Report</strong> <strong>2011</strong><br />
Notes to the consolidated statement of<br />
income<br />
139 Sale proceeds and principles of<br />
income realization<br />
139 <strong>Co</strong>st of sales<br />
139 Marketing, selling and distribution expenses<br />
139 Research and development expenses<br />
139 Administrative expenses<br />
139 Other operating income<br />
140 Other operating charges<br />
140 Financial result<br />
140 Taxes on income<br />
142 Non-controlling interests<br />
Other disclosures<br />
143 Payroll cost<br />
146 Employee structure<br />
146 Group segment report<br />
148 Earnings per share<br />
148 <strong>Co</strong>nsolidated statement of cash flows<br />
149 <strong>Co</strong>ntingent liabilities<br />
149 Other unrecognized financial commitments<br />
149 Voting rights/Related party disclosures<br />
150 Exercise of exemption options<br />
150 Remuneration of the corporate management<br />
150 Declaration of compliance with the <strong>Co</strong>rporate<br />
Governance <strong>Co</strong>de (Kodex)<br />
150 Subsidiaries and other investments<br />
150 Auditor’s fees and services<br />
151 Recommendation for the approval<br />
of the annual financial statements<br />
and the appropriation of profit of<br />
<strong>Henkel</strong> <strong>AG</strong> & <strong>Co</strong>. <strong>KGaA</strong><br />
152 <strong>Annual</strong> financial statements of<br />
<strong>Henkel</strong> <strong>AG</strong> & <strong>Co</strong>. <strong>KGaA</strong> (summarized)<br />
153 Independent Auditor’s <strong>Report</strong><br />
155 Responsibility statement by the<br />
Personally Liable Partner<br />
156 <strong>Co</strong>rporate management of<br />
<strong>Henkel</strong> <strong>AG</strong> & <strong>Co</strong>. <strong>KGaA</strong><br />
<strong>Co</strong>nsolidated fi nancial statements<br />
Subindex<br />
97
98 <strong>Co</strong>nsolidated financial statements<br />
<strong>Co</strong>nsolidated statement of financial position<br />
<strong>Henkel</strong> <strong>Annual</strong> <strong>Report</strong> <strong>2011</strong><br />
<strong>Co</strong>nsolidated statement of financial position<br />
Assets<br />
in million euros Note 2010 % <strong>2011</strong> %<br />
Intangible assets 1 8,641 49.3 8,769 47.2<br />
Property, plant and equipment 2 2,215 12.6 2,264 12.2<br />
Other financial assets 1 3 238 1.4 246 1.3<br />
Income tax refund claims 3 – 1 –<br />
Other assets 1 4 135 0.8 103 0.6<br />
Deferred tax assets 5 358 2.0 465 2.5<br />
Non-current assets 11,590 66.1 11,848 63.8<br />
Inventories 6 1,460 8.3 1,550 8.3<br />
Trade accounts receivable 7 1,893 10.8 2,001 10.8<br />
Other financial assets 1 3 684 3.9 748 4.0<br />
Income tax refund claims 133 0.8 164 0.9<br />
Other assets 1 4 219 1.2 237 1.2<br />
Cash and cash equivalents 8 1,515 8.7 1,980 10.7<br />
Assets held for sale 9 31 0.2 51 0.3<br />
Current assets 5,935 33.9 6,731 36.2<br />
Total assets 17,525 100.0 18,579 100.0<br />
1 Prior-year figures adjusted (see “Recognition and measurement methods” on pages 108 and 109).
<strong>Henkel</strong> <strong>Annual</strong> <strong>Report</strong> <strong>2011</strong><br />
Equity and liabilities<br />
in million euros Note 2010 % <strong>2011</strong> %<br />
Issued capital 10 438 2.5 438 2.4<br />
Capital reserve 11 652 3.7 652 3.5<br />
Treasury shares – 99 – 0.5 – 93 – 0.5<br />
Retained earnings 12 7,926 45.2 8,586 46.2<br />
Other components of equity 13 – 1,058 – 6.0 – 942 – 5.1<br />
Equity attributable to shareholders of <strong>Henkel</strong> <strong>AG</strong> & <strong>Co</strong>. <strong>KGaA</strong> 7,859 44.9 8,641 46.5<br />
Non-controlling interests 14 91 0.5 121 0.7<br />
Equity 7,950 45.4 8,762 47.2<br />
Pension obligations 1 15 644 3.7 998 5.4<br />
Income tax provisions 16 119 0.7 93 0.5<br />
Other provisions 16 302 1.7 394 2.1<br />
Borrowings 17 3,570 20.4 3,501 18.8<br />
Other financial liabilities 1 18 73 0.4 54 0.3<br />
Other liabilities 1 19 25 0.1 23 0.1<br />
Deferred tax liabilities 5 416 2.4 481 2.6<br />
Non-current liabilities 5,149 29.4 5,544 29.8<br />
Income tax provisions 16 327 1.9 309 1.7<br />
Other provisions 16 867 4.9 833 4.4<br />
Borrowings 17 536 3.1 412 2.2<br />
Trade accounts payable 20 2,308 13.2 2,411 13.0<br />
Other financial liabilities 1 18 147 0.8 84 0.5<br />
Other liabilities 1 19 230 1.2 207 1.1<br />
<strong>Co</strong>rporate income tax liabilities 11 0.1 17 0.1<br />
Current liabilities 4,426 25.2 4,273 23.0<br />
Total equity and liabilities 17,525 100.0 18,579 100.0<br />
1 Prior-year figures adjusted (see “Recognition and measurement methods” on pages 108 and 109).<br />
<strong>Co</strong>nsolidated financial statements<br />
<strong>Co</strong>nsolidated statement of financial position<br />
99
100 <strong>Co</strong>nsolidated financial statements<br />
<strong>Co</strong>nsolidated statement of income<br />
<strong>Henkel</strong> <strong>Annual</strong> <strong>Report</strong> <strong>2011</strong><br />
<strong>Co</strong>nsolidated statement of income<br />
in million euros Note 2010 % <strong>2011</strong> % Change<br />
Sales 22 15,092 100.0 15,605 100.0 3.4 %<br />
<strong>Co</strong>st of sales 1 23 – 8,078 – 53.5 – 8,538 – 54.7 5.7 %<br />
Gross profit 7,014 46.5 7,067 45.3 0.8 %<br />
Marketing, selling and distribution expenses 1 24 – 4,257 – 28.2 – 4,132 – 26.5 – 2.9 %<br />
Research and development expenses 1 25 – 391 – 2.6 – 410 – 2.6 4.9 %<br />
Administrative expenses 1 26 – 750 – 5.0 – 785 – 5.0 4.7 %<br />
Other operating income 27 216 1.4 209 1.3 – 3.2 %<br />
Other operating charges 28 – 109 – 0.7 – 92 – 0.6 – 15.6 %<br />
Operating profit (EBIT) 1,723 11.4 1,857 11.9 7.8 %<br />
Interest income 25 0.2 45 0.3 80.0 %<br />
Interest expense – 197 – 1.3 – 200 – 1.3 1.5 %<br />
Interest result – 172 – 1.1 – 155 – 1.0 – 9.9 %<br />
Investment result 1 – – – – 100.0 %<br />
Financial result 29 – 171 – 1.1 – 155 – 1.0 –9.4 %<br />
Income before tax 1,552 10.3 1,702 10.9 9.7 %<br />
Taxes on income 30 – 409 – 2.7 – 419 – 2.7 2.4 %<br />
Tax rate in % 26.4 24.6<br />
Net income 1,143 7.6 1,283 8.2 12.2 %<br />
– attributable to non-controlling interests 31 25 0.2 30 0.2 20.0 %<br />
– attributable to shareholders of <strong>Henkel</strong> <strong>AG</strong> & <strong>Co</strong>. <strong>KGaA</strong> 1,118 7.4 1,253 8.0 12.1 %<br />
1 Restructuring charges <strong>2011</strong>: 227 million euros (2010: 184 million euros), of which: cost of sales 83 million euros (2010: 114 million euros);<br />
marketing, selling and distribution expenses 51 million euros (2010: 23 million euros); research and development expenses 14 million euros<br />
(2010: 8 million euros); administrative expenses 79 million euros (2010: 39 million euros).<br />
Earnings per share (basic)<br />
in euros Note 2010 <strong>2011</strong> Change<br />
Ordinary shares 35 2.57 2.88 12.1 %<br />
Non-voting preferred shares 35 2.59 2.90 12.0 %<br />
Earnings per share (diluted)<br />
in euros Note 2010 <strong>2011</strong> Change<br />
Ordinary shares 35 2.56 2.87 12.1 %<br />
Non-voting preferred shares 35 2.58 2.89 12.0 %<br />
Additional voluntary information<br />
in million euros 2010 <strong>2011</strong><br />
EBIT (as reported) 1,723 1,857<br />
One-time gains 1 – 59 – 57<br />
One-time charges 14 2<br />
Restructuring charges 184 227<br />
Adjusted EBIT 1,862 2,029<br />
Adjusted return on sales in % 12.3 13.0<br />
Adjusted tax rate in % 26.6 26.0<br />
Adjusted earnings per share (basic)<br />
Adjusted net income<br />
in euros 2.82 3.14<br />
– attributable to shareholders of <strong>Henkel</strong> <strong>AG</strong> & <strong>Co</strong>. <strong>KGaA</strong> 1,217 1,356<br />
1 Of which: 48 million euros gain from the sale of our branded consumer goods business in India, and 9 million euros gain from the sale of our roofing membrane<br />
business under the Wolfin brand operated by Adhesive Technologies.
<strong>Henkel</strong> <strong>Annual</strong> <strong>Report</strong> <strong>2011</strong><br />
<strong>Co</strong>nsolidated statement of comprehensive income<br />
See Notes 15 and 21 for further explanatory information<br />
in million euros 2010 <strong>2011</strong><br />
Net income 1,143 1,283<br />
Exchange differences on translation of foreign operations 531 113<br />
Gains/losses from derivative financial instruments (Hedge reserve per IAS 39) – 59 4<br />
Losses from financial instruments in the available-for-sale category<br />
(Available-for-sale reserve) – – 2<br />
Actuarial gains/losses 53 –297<br />
Other comprehensive income (net of taxes) 525 –182<br />
Total comprehensive income for the period 1,668 1,101<br />
– attributable to non-controlling interests 31 29<br />
– attributable to shareholders of <strong>Henkel</strong> <strong>AG</strong> & <strong>Co</strong>. <strong>KGaA</strong> 1,637 1,072<br />
<strong>Co</strong>nsolidated statement of changes in equity<br />
See Notes 10 to 14 for further explanatory information<br />
Issued<br />
capital<br />
<strong>Co</strong>nsolidated financial statements<br />
<strong>Co</strong>nsolidated statement of comprehensive income / <strong>Co</strong>nsolidated statement of changes in equity<br />
Other components<br />
of equity<br />
Ordinary Preferred Capital Treasury Retained Transla- Hedge AvailableShareNon-con- Total<br />
shares shares reserve shares earnings tiondif- reserve for-saleholderstrollingferences per reserve of <strong>Henkel</strong> interests<br />
IAS 39<br />
<strong>AG</strong> & <strong>Co</strong>.<br />
in million euros<br />
<strong>KGaA</strong><br />
At January 1, 2010 260 178 652 – 109 7,017 – 1,301 – 223 – 6,474 70 6,544<br />
Net income<br />
Other comprehensive<br />
– – – – 1,118 – – – 1,118 25 1,143<br />
income<br />
Total comprehensive<br />
– – – – 53 525 – 59 – 519 6 525<br />
income for the period – – – – 1,171 525 – 59 – 1,637 31 1,668<br />
Dividends – – – – – 225 – – – – 225 – 19 – 244<br />
Sales of treasury shares<br />
Changes in ownership inter-<br />
– – – 10 9 – – – 19 – 19<br />
est without loss of control – – – – – 27 – – – – 27 – 10 – 37<br />
Other changes in equity<br />
At December 31, 2010/<br />
– – – – – 19 – – – – 19 19 –<br />
January 1, <strong>2011</strong> 260 178 652 – 99 7,926 – 776 – 282 – 7,859 91 7,950<br />
Net income<br />
Other comprehensive<br />
– – – – 1,253 – – – 1,253 30 1,283<br />
income<br />
Total comprehensive<br />
– – – – – 297 114 4 –2 – 181 –1 – 182<br />
income for the period – – – – 956 114 4 –2 1,072 29 1,101<br />
Dividends – – – – – 307 – – – –307 –16 –323<br />
Sales of treasury shares<br />
Changes in ownership<br />
interest without loss<br />
– – – 6 6 – – – 12 – 12<br />
of control – – – – –1 – – – –1 –2 –3<br />
Other changes in equity – – – – 6 – – – 6 19 25<br />
At December 31, <strong>2011</strong> 260 178 652 – 93 8,586 – 662 – 278 – 2 8,641 121 8,762<br />
101
102 <strong>Co</strong>nsolidated financial statements<br />
<strong>Co</strong>nsolidated statement of cash flows<br />
<strong>Henkel</strong> <strong>Annual</strong> <strong>Report</strong> <strong>2011</strong><br />
<strong>Co</strong>nsolidated statement of cash flows<br />
See Note 36 for further explanatory information<br />
in million euros 2010 <strong>2011</strong><br />
Operating profit (EBIT) 1,723 1,857<br />
Income taxes paid – 365 – 426<br />
Amortization/depreciation/write-ups of non-current assets (excluding financial assets) 478 403<br />
Net gains/losses on disposal of non-current assets including divestments (excluding financial assets) – 5 – 68<br />
Change in inventories – 182 – 105<br />
Change in trade accounts receivable – 72 – 111<br />
Change in other assets – 14 – 71<br />
Change in trade accounts payable 341 111<br />
Change in other liabilities and provisions – 53 – 28<br />
Cash flow from operating activities 1,851 1,562<br />
Purchase of intangible assets – 16 – 9<br />
Purchase of property, plant and equipment – 240 – 384<br />
Payments for acquisitions – 46 – 4<br />
Proceeds on disposal of subsidiaries and business units 19 53<br />
Proceeds on disposal of other non-current assets 43 47<br />
Cash flow from investing activities/acquisitions – 240 – 297<br />
Dividends paid to shareholders of <strong>Henkel</strong> <strong>AG</strong> & <strong>Co</strong>. <strong>KGaA</strong> – 225 – 307<br />
Dividends (of subsidiaries) paid to non-controlling interests – 19 – 16<br />
Interest received 21 37<br />
Interest paid –181 – 200<br />
Dividends and interest paid and received – 404 – 486<br />
Change in borrowings – 174 – 181<br />
Allocation to pension funds – 312 – 46<br />
Other changes in pension obligations 30 – 102<br />
Purchase of non-controlling interests with no change of control – 23 – 3<br />
Other financing transactions – 340 16<br />
Cash flow from financing activities – 1,223 – 802<br />
Net change in cash and cash equivalents 388 463<br />
Effect of exchange rates on cash and cash equivalents 17 2<br />
Change in cash and cash equivalents 405 465<br />
Cash and cash equivalents at January 1 1,110 1,515<br />
Cash and cash equivalents at December 31 1,515 1,980<br />
Additional voluntary information<br />
Reconciliation to free cash flow<br />
in million euros 2010 <strong>2011</strong><br />
Cash flow from operating activities 1,851 1,562<br />
Purchase of intangible assets – 16 – 9<br />
Purchase of property, plant and equipment – 240 – 384<br />
Proceeds on disposal of other non-current assets 43 47<br />
Net interest paid – 160 – 163<br />
Other changes in pension obligations 30 – 102<br />
Free cash flow 1,508 951
<strong>Henkel</strong> <strong>Annual</strong> <strong>Report</strong> <strong>2011</strong><br />
Group segment report by business sector 1<br />
See Note 34 for further explanatory information<br />
<strong>Co</strong>nsolidated financial statements<br />
Group segment report by business sector<br />
Laundry & <strong>Co</strong>smetics/ Adhesives Industrial Total Operating <strong>Co</strong>rporate <strong>Henkel</strong><br />
Home Care Toiletries for <strong>Co</strong>nsum- Adhesives Adhesive business<br />
Group<br />
ers,CraftsTechno- sectors<br />
men and<br />
logies total<br />
in million euros<br />
Building<br />
Sales <strong>2011</strong> 4,304 3,399 1,933 5,813 7,746 15,449 156 15,605<br />
Change from previous year –0.3 % 4.0 % 3.3 % 7.0 % 6.0 % 3.7 % –21.5 % 3.4 %<br />
After adjusting for foreign exchange 2.0 % 5.1 % 5.9 % 8.9 % 8.1 % 5.7 % – 5.3 %<br />
Organic 2.9 % 5.4 % 8.1 % 8.3 % 8.3 % 6.1 % – 5.9 %<br />
Proportion of Group sales 27 % 22 % 12 % 37 % 50 % 99 % 1 % 100 %<br />
Sales 2010 4,319 3,269 1,872 5,434 7,306 14,894 199 15,092<br />
EBIT <strong>2011</strong> 511 471 232 769 1,002 1,983 –127 1,857<br />
EBIT 2010 542 411 216 662 878 1,831 –108 4 1,723<br />
Change from previous year –5.8 % 14.6 % 7.8 % 16.2 % 14.1 % 8.3 % – 7.8 %<br />
Return on sales (EBIT) <strong>2011</strong> 11.9 % 13.8 % 12.0 % 13.2 % 12.9 % 12.8 % – 11.9 %<br />
Return on sales (EBIT) 2010 12.6 % 12.6 % 11.5 % 12.2 % 12.0 % 12.3 % – 11.4 %<br />
Adjusted EBIT <strong>2011</strong> 570 482 254 821 1,075 2,127 –98 2,029<br />
Adjusted EBIT 2010 562 436 246 692 938 1,936 –74 1,862<br />
Change from previous year 1.4 % 10.5 % 3.3 % 18.7 % 14.7 % 9.9 % – 9.0 %<br />
Return on sales (adjusted EBIT) <strong>2011</strong> 13.2 % 14.2 % 13.2 % 14.1 % 13.9 % 13.8 % – 13.0 %<br />
Return on sales (adjusted EBIT) 2010 13.0 % 13.3 % 13.1 % 12.7 % 12.8 % 13.0 % – 12.3 %<br />
Capital employed <strong>2011</strong> 2 2,314 2,001 979 5,874 6,853 11,168 40 11,208<br />
Capital employed 2010 2 2,558 2,041 1,004 6,046 7,049 11,648 – 53 11,595<br />
Change from previous year –9.5 % –2.0 % –2.4 % –2.8 % –2.8 % –4.1 % – –3.3 %<br />
Return on capital employed (ROCE) <strong>2011</strong> 22.1 % 23.5 % 23.7 % 13.1 % 14.6 % 17.8 % – 16.6 %<br />
Return on capital employed (ROCE) 2010 21.2 % 20.1 % 22.1 % 11.0 % 12.5 % 15.8 % – 14.9 %<br />
Amortization/depreciation/write-ups <strong>2011</strong> 113 49 43 181 224 386 17 403<br />
of which impairment losses <strong>2011</strong> 14 – 1 6 7 21 – 21<br />
of which write-ups <strong>2011</strong> – – – 1 1 1 – 1<br />
Amortization/depreciation/write-ups 2010 121 48 67 220 287 456 22 478<br />
of which impairment losses 2010 12 2 25 35 60 74 1 75<br />
of which write-ups 2010<br />
Capital expenditures<br />
– – 1 4 5 5 1 6<br />
(excl. financial assets) <strong>2011</strong><br />
Capital expenditures<br />
162 113 59 105 164 439 4 443<br />
(excl. financial assets) 2010 85 43 35 85 120 248 11 260<br />
Operating assets <strong>2011</strong> 3 3,704 2,848 1,429 7,019 8,448 15,000 425 15,424<br />
Operating liabilities <strong>2011</strong> 1,228 1,050 504 1,458 1,962 4,240 385 4,625<br />
Net operating assets employed <strong>2011</strong> 3 2,476 1,798 925 5,561 6,486 10,759 40 10,799<br />
Operating assets 2010 3 4,135 2,919 1,433 7,190 8,623 15,677 352 16,029<br />
Operating liabilities 2010 1,408 1,077 487 1,419 1,906 4,391 405 4,796<br />
Net operating assets employed 2010 3 2,727 1,842 946 5,770 6,717 11,286 – 53 11,233<br />
1 Calculated on the basis of units of 1,000 euros.<br />
2 Including goodwill at cost prior to any accumulated amortization in accordance with IFRS 3.79 (b).<br />
3 Including goodwill at net book value.<br />
4 Including restructuring charges of 14 million euros disclosed in 2010 for the last time under <strong>Co</strong>rporate, arising from integration of the National Starch businesses.<br />
103
104 <strong>Co</strong>nsolidated financial statements<br />
Key financials by region<br />
<strong>Henkel</strong> <strong>Annual</strong> <strong>Report</strong> <strong>2011</strong><br />
Key financials by region 1<br />
Western Eastern Africa/ North Latin Asia- Regions <strong>Co</strong>rporate <strong>Henkel</strong><br />
in million euros<br />
Europe Europe Middle East America America Pacific total<br />
Group<br />
Sales 2 <strong>2011</strong> 5,624 2,813 934 2,716 1,065 2,296 15,449 156 15,605<br />
Sales 2 2010 5,470 2,649 901 2,724 982 2,168 14,894 199 15,092<br />
Change from previous year<br />
After adjusting for foreign<br />
2.8 % 6.2 % 3.7 % –0.3 % 8.4 % 5.9 % 3.7 % – 3.4 %<br />
exchange 2.5 % 10.5 % 10.0 % 4.3 % 11.1 % 5.6 % 5.7 % – 5.3 %<br />
Organic 2.3 % 10.3 % 10.0 % 4.4 % 11.0 % 8.6 % 6.1 % – 5.9 %<br />
Proportion of Group sales <strong>2011</strong> 36 % 18 % 6 % 17 % 7 % 15 % 99 % 1 % 100 %<br />
Proportion of Group sales 2010 36 % 18 % 6 % 18 % 7 % 14 % 99 % 1 % 100 %<br />
Operating profit (EBIT) <strong>2011</strong> 767 384 79 289 105 360 1,983 –127 1,857<br />
Operating profit (EBIT) 2010 706 314 81 320 104 306 1,831 –108 1,723<br />
Change from previous year<br />
After adjusting for foreign<br />
8.6 % 22.3 % –2.6 % –9.9 % 1.2 % 17.8 % 8.3 % – 7.8 %<br />
exchange 8.2 % 27.0 % 5.8 % –5.7 % 4.0 % 17.8 % 10.2 % – 9.6 %<br />
Return on sales (EBIT) <strong>2011</strong> 13.6 % 13.6 % 8.5 % 10.6 % 9.8 % 15.7 % 12.8 % – 11.9 %<br />
Return on sales (EBIT) 2010 12.9 % 11.9 % 9.0 % 11.8 % 10.5 % 14.1 % 12.3 % – 11.4 %<br />
1 Calculated on the basis of units of 1,000 euros.<br />
2 By location of company.<br />
In <strong>2011</strong>, the affiliated companies domiciled in Germany,<br />
including <strong>Henkel</strong> <strong>AG</strong> & <strong>Co</strong>. <strong>KGaA</strong>, generated sales of 2,241 million<br />
euros (previous year: 2,182 million euros). Sales realized<br />
by the affiliated companies domiciled in the USA in <strong>2011</strong><br />
amounted to 2,499 million euros (previous year: 2,502 million<br />
euros). In fiscal 2010 and <strong>2011</strong>, no individual customer<br />
accounted for more than 10 percent of total sales.<br />
Of the total non-current assets disclosed for the <strong>Henkel</strong> Group<br />
as of December 31, <strong>2011</strong> (excluding financial instruments and<br />
deferred tax claims) amounting to 11,137 million euros (previous<br />
year: 10,981 million euros) 1, 1,043 million euros (previous<br />
year: 1,053 million euros) 1 was attributable to the affiliated<br />
companies domiciled in Germany, including <strong>Henkel</strong> <strong>AG</strong> & <strong>Co</strong>.<br />
<strong>KGaA</strong>. The non-current assets (excluding financial assets and<br />
deferred tax assets) recognized in respect of the affiliated<br />
companies domiciled in the USA amounted to 5,993 million<br />
euros (previous year: 5,821 million euros) 1.<br />
1 Prior-year figures adjusted<br />
(see “Recognition and measurement methods” on pages 108 and 109).
<strong>Henkel</strong> <strong>Annual</strong> <strong>Report</strong> <strong>2011</strong><br />
Accounting principles and methods applied in preparation<br />
of the consolidated financial statements<br />
General information<br />
The consolidated financial statements of <strong>Henkel</strong> <strong>AG</strong> & <strong>Co</strong>. <strong>KGaA</strong><br />
as of December 31, <strong>2011</strong> have been prepared in accordance with<br />
International Financial <strong>Report</strong>ing Standards (IFRS) as adopted<br />
by the European Union and in compliance with Section 315a of<br />
the German <strong>Co</strong>mmercial <strong>Co</strong>de [HGB].<br />
The individual financial statements of the companies included<br />
in the consolidation are drawn up on the same accounting<br />
date, December 31, <strong>2011</strong>, as that of <strong>Henkel</strong> <strong>AG</strong> & <strong>Co</strong>. <strong>KGaA</strong>.<br />
Members of the KPMG organization or other independent firms<br />
of auditors instructed accordingly have audited the financial<br />
statements of the material companies included in the consolidation.<br />
Having prepared the consolidated financial statements,<br />
on January 27, 2012 the Management Board of <strong>Henkel</strong><br />
Management <strong>AG</strong> – which is the Personally Liable Partner of<br />
<strong>Henkel</strong> <strong>AG</strong> & <strong>Co</strong>. <strong>KGaA</strong> – approved the release of same to the<br />
Supervisory Board. The Supervisory Board is responsible for<br />
reviewing the consolidated financial statements and declaring<br />
whether it approves them.<br />
The consolidated financial statements are based on the principle<br />
of historical cost with the exception that certain financial<br />
instruments are accounted for at their fair values. The Group<br />
currency is the euro. Unless otherwise indicated, all amounts<br />
are shown in million euros. In order to improve the clarity<br />
and informative value of the consolidated financial statements,<br />
certain items are combined in the consolidated statement of<br />
financial position, the consolidated statement of income and<br />
the consolidated statement of comprehensive income, and<br />
then shown separately in the Notes.<br />
Scope of consolidation<br />
In addition to <strong>Henkel</strong> <strong>AG</strong> & <strong>Co</strong>. <strong>KGaA</strong> as the ultimate parent<br />
company, the consolidated financial statements at December 31,<br />
<strong>2011</strong> include seven German and 170 non-German companies<br />
in which <strong>Henkel</strong> <strong>AG</strong> & <strong>Co</strong>. <strong>KGaA</strong> has a dominating influence<br />
over financial and operating policy, based on the concept<br />
of control. This is generally the case where <strong>Henkel</strong> <strong>AG</strong> & <strong>Co</strong>.<br />
<strong>KGaA</strong> holds, directly or indirectly, a majority of the voting<br />
rights. <strong>Co</strong>mpanies in which not more than half of the voting<br />
rights are held are fully consolidated if <strong>Henkel</strong> <strong>AG</strong> & <strong>Co</strong>. <strong>KGaA</strong>,<br />
on the basis of contractual agreements or rights held, has the<br />
power, directly or indirectly, to appoint executive and managerial<br />
bodies and thereby to govern their financial and operating policies.<br />
<strong>Co</strong>mpared to December 31, 2010, four new companies have been<br />
included in the scope of consolidation and eleven companies<br />
<strong>Co</strong>nsolidated financial statements<br />
Accounting principles and methods applied in preparation<br />
of the consolidated financial statements<br />
have left the scope of consolidation. Seven mergers also took<br />
place. The changes in the scope of consolidation have not<br />
had any material effect on the main items of the consolidated<br />
financial statements.<br />
Acquisitions and divestments<br />
The acquisitions and divestments made in fiscal <strong>2011</strong> had no<br />
material effect on the business and organizational structure<br />
of <strong>Henkel</strong>, nor on our net assets, financial position or results<br />
of operations.<br />
Acquisitions<br />
Effective January 1, <strong>2011</strong>, we assumed control of Schwarzkopf<br />
Inc., Culver City, California, USA. We own 100 percent of the<br />
voting rights of the company. Having a direct presence in the<br />
US hair salon segment enables us to better exhaust the potential<br />
of this market. The purchase price paid was 42 million<br />
euros. Goodwill in the amount of 41 million euros was recognized.<br />
It is assumed that the capitalized goodwill is completely<br />
tax-deductible. Cash acquired in the amount of 1 million<br />
euros is shown in the consolidated statement of cash flows<br />
under payments for acquisitions. Customer and supplier<br />
relationships were capitalized in the amount of 3 million<br />
euros. The fair value applied to the acquired trade accounts<br />
receivable is 6 million euros.<br />
As from April 1, <strong>2011</strong>, we now include Purbond Group, Hatfield,<br />
UK, which was previously recognized at equity, as a fully<br />
consolidated entity in our consolidated financial statements.<br />
Our share of the voting rights is 100 percent. The purchase<br />
price paid amounted to 4 million euros. Fifty percent of the<br />
shares had already been acquired as of April 3, 2008. Taking<br />
into account the provisions of IFRS 3 pertaining to business<br />
combinations achieved in stages (step acquisition) and the<br />
corresponding revaluation of previously held shares at fair<br />
value, there ensued a positive contribution to earnings<br />
amounting to 2.5 million euros recognized under other operating<br />
income.<br />
In the second half of <strong>2011</strong>, we spent 3 million euros acquiring<br />
outstanding non-controlling interests in Rilken <strong>Co</strong>smetics<br />
Industry S.A., Athens, Greece. Effective December 31, <strong>2011</strong>, we<br />
increased our shareholding from 50 percent to 78 percent with<br />
the purpose of acquiring 100 percent of the shares in the future.<br />
The difference between the previously held share of net assets<br />
and the purchase price was recognized in retained earnings.<br />
The goodwill recognized in the year under review essentially<br />
represents the market position and profitability of the acquired<br />
businesses, together with expected synergies.<br />
105
106 <strong>Co</strong>nsolidated financial statements<br />
Accounting principles and methods applied in preparation<br />
of the consolidated financial statements<br />
<strong>Henkel</strong> <strong>Annual</strong> <strong>Report</strong> <strong>2011</strong><br />
The purchase price allocation procedure for all acquisitions<br />
was completed as of December 31, <strong>2011</strong>.<br />
The following table shows the acquisitions made in fiscal<br />
<strong>2011</strong>. The acquisitions indicated, taken both individually and<br />
in sum, did not exert any material effect on the net assets,<br />
financial position or results of operations of the Group.<br />
Acquisitions<br />
January 1 to December 31<br />
in million euros<br />
Carrying<br />
amount<br />
Adjustments Fair value<br />
Assets 14 3 17<br />
Non-current assets 1 2 3<br />
Current assets 12 1 13<br />
Cash and cash equivalents 1 – 1<br />
Liabilities<br />
Non-current liabilities and<br />
13 2 15<br />
provisions<br />
Current liabilities and<br />
6 – 6<br />
provisions 7 2 9<br />
Net assets 1 1 2<br />
Goodwill <strong>2011</strong><br />
in million euros Fair value<br />
Purchase price 46<br />
Fair value of non-controlling interests 3<br />
Less net assets 2<br />
Goodwill 47<br />
Divestments<br />
At the end of January <strong>2011</strong>, we disposed of our non-core TAED<br />
bleach activator business in Ireland for 4 million euros.<br />
On May 31, <strong>2011</strong>, we sold our shares in <strong>Henkel</strong> India Ltd.,<br />
Chennai, India. The sale proceeds amounted to 29 million<br />
euros while the gain totaled 48 million euros. In the course<br />
of the divestment, bank liabilities amounting to 66 million<br />
euros were discharged.<br />
Effective June 30, <strong>2011</strong>, we sold our roofing membrane business<br />
under the Wolfin brand operated by the Adhesive Technologies<br />
business sector. The proceeds of the sale amounted<br />
to 13 million euros with a gain of 9 million euros.<br />
On December 9, <strong>2011</strong>, we also disposed of our non-core corrosion-<br />
protection business in the USA operated by the Adhesive<br />
Technologies business sector. The proceeds of the sale were<br />
8 million euros, resulting in a gain of 4 million euros.<br />
On December 15, <strong>2011</strong>, we sold our 51 percent share in the joint<br />
venture Cemedine <strong>Henkel</strong> <strong>Co</strong>. Ltd., Tokyo, Japan, generating<br />
proceeds of 6 million euros and a gain of 1 million euros.<br />
The proceeds from the divestments indicated were received in<br />
cash. The gains were recognized under other operating income.<br />
The following table shows the disposal and deconsolidation<br />
effects from entity sales in <strong>2011</strong> and from the divestment<br />
in <strong>2011</strong> of operations that no longer form part of our core<br />
business.<br />
Divestments and deconsolidation effects<br />
January 1 to December 31<br />
in million euros<br />
Disposal effects<br />
<strong>Henkel</strong><br />
India Ltd.<br />
Other<br />
entities<br />
Other<br />
operations<br />
Total<br />
Non-current assets 4 6 2 12<br />
Current assets 16 10 6 32<br />
Assets held for sale – 4 – 4<br />
Cash and cash equivalents<br />
Non-current liabilities<br />
– 4 – 4<br />
and provisions<br />
Current liabilities<br />
– 1 2 3<br />
and provisions<br />
69 9 – 78<br />
Net assets – 49 14 6 – 29<br />
Share of net assets owned<br />
by shareholders of <strong>Henkel</strong><br />
<strong>AG</strong> & <strong>Co</strong>. <strong>KGaA</strong><br />
– 19 10 6 – 3<br />
Total consideration 29 10 21 60<br />
Incidental costs of disposal<br />
Accumulated currency trans-<br />
– 3 – –2 – 5<br />
lation gains<br />
Deconsolidation gain (+)/<br />
3 1 – 4<br />
loss (–)<br />
48 1 13 62<br />
<strong>Co</strong>nsolidation methods<br />
The annual financial statements of <strong>Henkel</strong> <strong>AG</strong> & <strong>Co</strong>. <strong>KGaA</strong><br />
and of the subsidiaries included in the consolidated financial<br />
statements were prepared on the basis of uniformly valid<br />
principles of recognition and measurement, applying the<br />
standardized year-end date adopted by the Group.<br />
Such entities are included in the consolidated financial statements<br />
as of the date on which the Group acquired control.<br />
All receivables and liabilities, sales, income and expenses,<br />
as well as intra-group profits on transfers of non-current<br />
assets or inventories, are eliminated on consolidation. Intragroup<br />
transactions are effected on the basis of market or<br />
transfer prices.<br />
The purchase method is used for capital consolidation. With<br />
business combinations, therefore, all hidden reserves and<br />
hidden charges in the entity acquired are fully reflected at<br />
fair value and all identifiable intangible assets are separately
<strong>Henkel</strong> <strong>Annual</strong> <strong>Report</strong> <strong>2011</strong><br />
disclosed. Any difference arising between the cost of acquisition<br />
and the (share of) net assets is recognized as goodwill.<br />
Entities acquired are included in the consolidation for the<br />
first time as subsidiaries by offsetting the carrying amount of<br />
the <strong>Henkel</strong> <strong>AG</strong> & <strong>Co</strong>. <strong>KGaA</strong> investment in them against their<br />
assets and liabilities. <strong>Co</strong>ntingent consideration is recognized<br />
at fair value as of the date of first-time consolidation. (Incidental)<br />
costs related to the acquisition of subsidiaries are not<br />
included in the valuation of those shares. Instead, they are<br />
recognized in other operating expenses in the period in<br />
which they occur. In the recognition of acquisitions of less<br />
than 100 percent, minority interests are measured at the fair<br />
value of the share of net assets that they represent. We do not<br />
apply the option of measuring minority interests at their fair<br />
value (full goodwill method).<br />
In subsequent years, the carrying amount of the <strong>Henkel</strong> <strong>AG</strong> &<br />
<strong>Co</strong>. <strong>KGaA</strong> investment is eliminated against the current equity<br />
of the subsidiary entities concerned.<br />
Changes in the shareholdings of subsidiary companies, as<br />
a result of which the participating interests of the Group<br />
decrease or increase without loss of control, are recognized<br />
within equity as changes in ownership without loss of control.<br />
As soon as the control of a subsidiary is relinquished, all the<br />
assets and liabilities and the non-controlling interests, and<br />
also the accumulated currency translation gains or losses, are<br />
Currency<br />
<strong>Co</strong>nsolidated financial statements<br />
Accounting principles and methods applied in preparation<br />
of the consolidated financial statements<br />
derecognized. In the event that <strong>Henkel</strong> continues to own<br />
non-controlling interests in the non-consolidated entity,<br />
these are measured at fair value. The result of deconsolidation<br />
is recognized under other operating income or charges.<br />
Currency translation<br />
The annual financial statements of the consolidated companies,<br />
including the hidden reserves and hidden charges of<br />
Group companies recognized under the purchase method,<br />
and also goodwill arising on consolidation, are translated<br />
into euros using the functional currency method outlined in<br />
International Accounting Standard (IAS) 21 “The Effects of<br />
Changes in Foreign Exchange Rates.” The functional currency<br />
is the currency in which the foreign company predominantly<br />
generates funds and makes payments. As the functional<br />
currency for all the companies included in the consolidation<br />
is the local currency of the company concerned, assets and<br />
liabilities are translated at closing rates, while income and<br />
expenses are translated at the average rates for the year, based<br />
on an approximation of the actual rates at the date of the<br />
transaction. The differences arising from using average rather<br />
than closing rates are taken to equity and shown as other<br />
components of equity or non-controlling interests, and<br />
remain neutral in respect of net income until the shares<br />
are divested.<br />
Financial assets and liabilities in foreign currencies are<br />
measured at closing rates and recognized in profit or loss. For<br />
the main currencies in the Group, the following exchange<br />
rates have been used based on 1 euro:<br />
Average exchange rate Closing exchange rate<br />
Dec. 31<br />
ISO code 2010 <strong>2011</strong> 2010 <strong>2011</strong><br />
Chinese yuan CNY 8.98 8.99 8.82 8.16<br />
Mexican peso MXN 16.75 17.31 16.55 18.05<br />
Polish zloty PLN 4.00 4.13 3.98 4.46<br />
Russian ruble RUB 40.26 40.91 40.82 41.77<br />
US dollar USD 1.33 1.39 1.34 1.29<br />
107
108 <strong>Co</strong>nsolidated financial statements<br />
Accounting principles and methods applied in preparation<br />
of the consolidated financial statements<br />
<strong>Henkel</strong> <strong>Annual</strong> <strong>Report</strong> <strong>2011</strong><br />
Recognition and measurement methods<br />
Summary of selected measurement methods<br />
Items in the consolidated statement of financial position<br />
Assets<br />
Measurement method<br />
Goodwill<br />
Other intangible assets<br />
Lower of carrying amount and recoverable amount (“impairment only” method)<br />
with indefinite useful lives Lower of carrying amount and recoverable amount (“impairment only” method)<br />
with definite useful lives (Amortized) cost less any impairment losses<br />
Property, plant and equipment<br />
Financial assets (categories per IAS 39)<br />
(Amortized) cost less any impairment losses<br />
“Loans and receivables” (Amortized) cost using the effective interest method<br />
“Available for sale” Fair value with gains or losses recognized directly in equity 1<br />
“Held for trading” Fair value through profit or loss<br />
Other assets (Amortized) cost<br />
Inventories Lower of cost and net realizable value<br />
Assets held for sale Lower of cost and fair value less costs to sell<br />
1 Apart from permanent impairment losses and effects arising from measurement in a foreign currency.<br />
Liabilities<br />
Provisions for pensions and similar obligations Present value of future obligations (“projected unit credit” method)<br />
Other provisions<br />
Financial liabilities (categories per IAS 39)<br />
Settlement amount<br />
“Measured at amortized cost” (Amortized) cost using the effective interest method<br />
“Held for trading” Fair value through profit or loss<br />
Other liabilities Settlement amount<br />
The methods of recognition and measurement are described<br />
in detail in the Notes relating to the individual items of the<br />
statement of financial position on these pages. Also provided<br />
as part of the report on our financial instruments (Note 21<br />
on pages 128 to 138) are the disclosures relevant to IFRS 7<br />
showing the breakdown of our financial instruments by<br />
category, our methods for fair value measurement, and the<br />
derivative financial instruments that we use.<br />
Changes in the methods of recognition and measurement<br />
arising from revised and new standards are applied retrospectively,<br />
provided that there are no alternative regulations<br />
that supersede the standard concerned. The consolidated<br />
statement of income from the previous year and the opening<br />
balance of the consolidated statement of financial position for<br />
this comparative period are adjusted as if the new methods<br />
of recognition and measurement had always been applied.<br />
In order to standardize the disclosure of financial instruments<br />
in accordance with IFRS 7 and IAS 39, we disclosed the<br />
assets from overfunding of pension obligations falling under<br />
IAS 19 (previous year: 15 million euros) and the reimbursement<br />
rights relating to employee benefits (previous year:<br />
90 million euros in non-current assets and 9 million euros in<br />
current assets) under other assets instead of in other finan-<br />
cial assets. Since <strong>2011</strong>, the liabilities to employees falling<br />
under IAS 19 have been recognized under other liabilities<br />
instead of other financial liabilities. We have adjusted the<br />
consolidated statement of financial position as of December<br />
31, 2010. There were no effects on the consolidated statement<br />
of income or the consolidated statement of comprehensive<br />
income.<br />
In addition, we reclassified portions of liabilities to employees<br />
in the USA resulting from deferred compensation to<br />
pension obligations (previous year: 50 million euros) in the<br />
<strong>2011</strong> fiscal year. In economic terms, and based on the analysis<br />
of the actual treatment of the payments, these constitute postemployment<br />
benefits as defined in IAS 19. The reimbursement<br />
rights related to those pension obligations in the USA<br />
(previous year: 84 million euros) are therefore accounted for<br />
in accordance with the provisions of IAS 19 in the same way<br />
as the corresponding liabilities. Due to the change in this<br />
recognition method, we have appropriately adjusted the<br />
prior-year figures for pension obligations in the consolidated<br />
statement of financial position and also revised the prioryear<br />
Notes relating to pension obligations and other assets.<br />
The disclosures pertaining to the financial result have been<br />
expanded. There was no effect on the total amount of the<br />
income and expenses disclosed under financial result in the
<strong>Henkel</strong> <strong>Annual</strong> <strong>Report</strong> <strong>2011</strong><br />
previous year, as the expected return from reimbursement<br />
rights corresponded to the actual return generated.<br />
The reclassifications had the following effects on the relevant<br />
items of the consolidated statement of financial position<br />
dated December 31, 2010:<br />
Reclassifications<br />
in million euros<br />
Dec. 31,<br />
2010<br />
Non-current assets 15<br />
Other financial assets – 90<br />
Other assets 105<br />
Current assets – 15<br />
Other financial assets – 24<br />
Other assets 9<br />
Non-current liabilities 3<br />
Pension obligations 50<br />
Other financial liabilities – 55<br />
Other liabilities 8<br />
Current liabilities –3<br />
Other financial liabilities – 28<br />
Other liabilities 25<br />
Accounting estimates, assumptions and discretionary<br />
judgments<br />
Preparation of the consolidated financial statements is based<br />
on a number of accounting estimates and assumptions. These<br />
have an impact on the reported amounts of assets, liabilities<br />
and contingent liabilities at the reporting date and the disclosure<br />
of income and expenses for the reporting period. The<br />
actual amounts may differ from these estimates.<br />
The accounting estimates and their underlying assumptions<br />
are continually reviewed. Changes in accounting estimates<br />
are recognized in the period in which the change takes place<br />
where such change exclusively affects that period. A change<br />
is recognized in the period in which it occurs and in later<br />
periods where such change affects both the reporting period<br />
and subsequent periods. The judgments of the Management<br />
Board regarding the application of those IFRSs which have a<br />
significant impact on the consolidated financial statements<br />
are presented in the explanatory notes on taxes on income<br />
(Note 30 on pages 140 to 142), intangible assets (Note 1 on<br />
pages 111 to 114), pension obligations (Note 15 on pages<br />
120 to 124), financial instruments (Note 21 on pages 128 to<br />
138) and share-based payment plans (Note 32 on pages 143<br />
to 145).<br />
<strong>Co</strong>nsolidated financial statements<br />
Accounting principles and methods applied in preparation<br />
of the consolidated financial statements<br />
Essentially, discretionary judgments are made in respect of<br />
the following two areas:<br />
∙ The US dollar liabilities of <strong>Henkel</strong> of America, Inc. are set<br />
off against sureties of <strong>Henkel</strong> <strong>AG</strong> & <strong>Co</strong>. <strong>KGaA</strong>, as the deposit<br />
and the loan are with the same lender and of the same<br />
maturity, there is a legal right to set off these sums and the<br />
Group intends to settle net.<br />
∙ The demarcation of the cash-generating units is also a<br />
discretionary judgment of the Group management and<br />
is explained under Note 1 on pages 111 to 114.<br />
New international accounting regulations according to<br />
International Financial <strong>Report</strong>ing Standards (IFRS)<br />
Accounting regulations applied for the first time in the year<br />
under review<br />
Application of the following standards, amendments and<br />
interpretations has been mandatory since January 1, <strong>2011</strong>:<br />
Accounting regulations applied for the first time in the year<br />
under review<br />
<strong>Co</strong>llective standard: “Improvements to IFRS 2010”<br />
Significance<br />
Minor<br />
IAS 24 (Rev. 2009) “Related Party Disclosures” Irrelevant<br />
IAS 32 “Classification of Rights Issues” (Amendment)<br />
IFRIC 14 “Prepayments of a Minimum Funding Require-<br />
Irrelevant<br />
ment” (Amendment)<br />
IFRIC 19 “Extinguishing Financial Liabilities with Equity<br />
Irrelevant<br />
Instruments” Irrelevant<br />
• In May 2010, the International Accounting Standards Board<br />
(IASB) issued amendments of existing standards and interpretations<br />
as part of its annual improvement project. In<br />
addition to editorial revisions introduced to clarify existing<br />
regulations, amendments also relate to changes of individual<br />
standards affecting recognition, measurement or disclosure.<br />
• In November 2009, the IASB published a revision of IAS 24<br />
“Related Party Disclosures.” The revised standard clarifies<br />
the definition of a related party and simplifies the disclosure<br />
requirement for government-related entities.<br />
• In October 2009, the IASB published amendments to<br />
International Accounting Standard (IAS) 32 “Financial<br />
Instruments: Presentation.” The amendments stipulate the<br />
accounting at the issuer of pre-emptive rights, options and<br />
warrants issued to acquire a fixed number of equity instruments<br />
that are denominated in a currency other than that<br />
of the issuer. Such cases were hitherto reported as derivative<br />
liabilities. Pre-emptive rights that are issued pro rata at a<br />
fixed currency amount to the existing shareholders of a<br />
company are in future to be classified as equity. The<br />
currency in which the exercise price is stated is irrelevant.<br />
109
110<br />
<strong>Co</strong>nsolidated financial statements<br />
Accounting principles and methods applied in preparation<br />
of the consolidated financial statements<br />
• International Financial <strong>Report</strong>ing Interpretations <strong>Co</strong>mmittee<br />
(IFRIC) 14 “IAS 19 – The Limit on a Defined Benefit Asset,<br />
Minimum Funding Requirements and their Interaction”<br />
deals with the accounting treatment of voluntary prepaid<br />
contributions made by a company in order to meet existing<br />
minimum funding requirements. The amendment allows<br />
a company to recognize the benefit arising from such a<br />
prepayment as an asset.<br />
• IFRIC 19 “Extinguishing Financial Liabilities with Equity<br />
Instruments” states in particular that if a debtor issues<br />
equity instruments to a creditor to extinguish all or part of<br />
a financial liability, those equity instruments are “consideration<br />
paid” in accordance with IAS 39.41. The debtor should<br />
measure the equity instruments issued to the creditor at<br />
fair value. The debtor recognizes in profit or loss the difference<br />
between the carrying amount of the financial liability<br />
extinguished and the initial measurement of the equity<br />
instruments issued.<br />
The first-time application of the revised and amended<br />
standards and interpretations had no material impact on<br />
the presentation of our financial statements.<br />
Accounting regulations not applied in<br />
advance of their effective date<br />
The following interpretations and amendments to existing<br />
standards of possible relevance to <strong>Henkel</strong>, which have been<br />
adopted into EU law (endorsement mechanism) but are not<br />
yet mandatory, have not yet been applied:<br />
Accounting regulations not applied in advance of their effective<br />
date<br />
Mandatory for fiscal years<br />
beginning on or after<br />
IFRS 7 “Disclosures Relating to the Transfer<br />
of Financial Assets and Liabilities”<br />
(Amendment) July 1, <strong>2011</strong><br />
• In October 2010, the IASB published an amendment to IFRS 7<br />
“Financial Instruments: Disclosure.” The purpose of the<br />
extended disclosure requirements is to provide financial<br />
statement users with a better understanding of the relationship<br />
between the transferred financial assets and the corresponding<br />
liabilities. Particularly where financial assets are<br />
completely derecognized, the additional information now<br />
required should enable an assessment of the type and the<br />
risks of any continuing involvement. The amendment is<br />
applicable for financial years beginning on or after July 1,<br />
<strong>2011</strong>, with earlier application permitted.<br />
This amendment of IFRS 7 will not be applied by <strong>Henkel</strong> until<br />
fiscal 2012. We do not expect application to have any material<br />
impact on the presentation of our financial statements.<br />
Accounting regulations not yet adopted into EU law<br />
In fiscal <strong>2011</strong>, the IASB issued the following standards or interpretations<br />
of and amendments to standards of relevance to<br />
<strong>Henkel</strong> which still have to be adopted into EU law (endorsement<br />
mechanism) before they become applicable:<br />
Accounting regulations not yet adopted into EU law<br />
<strong>Henkel</strong> <strong>Annual</strong> <strong>Report</strong> <strong>2011</strong><br />
Mandatory for fiscal years<br />
beginning or after<br />
IAS 1 “Presentation of Items of Other<br />
<strong>Co</strong>mprehensive Income” (Amendment) July 1, 2012<br />
IAS 19 (Rev. <strong>2011</strong>) “Employee Benefits” January 1, 2013<br />
IAS 28 “Investments in Associates and<br />
Joint Ventures” (Amendment) January 1, 2013<br />
IAS 32 “Offsetting Financial Assets and<br />
Liabilities” (Amendment) January 1, 2014<br />
IFRS 7 “Disclosures – Offsetting Financial<br />
Assets and Liabilities” (Amendment) January 1, 2013<br />
IFRS 9 “Financial Instruments” January 1, 2015<br />
IFRS 10 “<strong>Co</strong>nsolidated Financial<br />
Statements” January 1, 2013<br />
IFRS 11 “Joint Arrangements” January 1, 2013<br />
IFRS 12 “Disclosure of Interests in Other<br />
Entities” January 1, 2013<br />
IFRS 13 “Fair Value Measurement” January 1, 2013<br />
These amendments and standards will be applied by <strong>Henkel</strong><br />
from fiscal 2012 or later. We expect the future application<br />
of the aforementioned regulations not to have a significant<br />
impact on the presentation of the financial statements.
<strong>Henkel</strong> <strong>Annual</strong> <strong>Report</strong> <strong>2011</strong> <strong>Co</strong>nsolidated financial statements<br />
Notes to the consolidated statement of financial position<br />
111<br />
Notes to the consolidated statement of financial position<br />
The measurement and recognition policies for financial statement items are described in the relevant Note.<br />
Non-current assets<br />
All non-current assets with definite useful lives are amortized<br />
or depreciated using the straight-line method on the<br />
basis of estimated useful lives. The useful life estimates are<br />
reviewed annually. Impairment losses are recognized when<br />
required. These are then charged to the relevant functions.<br />
The following unchanged, standardized useful lives are<br />
applied:<br />
(1) Intangible assets<br />
<strong>Co</strong>st<br />
Useful life<br />
in years<br />
Intangible assets with definite useful lives 3 to 20<br />
Residential buildings 50<br />
Office buildings<br />
Research and factory buildings, workshops,<br />
40<br />
stores and staff buildings<br />
25 to 33<br />
Production facilities 10 to 25<br />
Machinery 7 to 10<br />
Other equipment 10<br />
Vehicles 5 to 20<br />
Factory and research equipment 2 to 5<br />
Trademark rights and other rights<br />
Assets with Assets with Internally Goodwill<br />
Total<br />
indefinite definite generated<br />
useful lives useful lives intangible assets<br />
with definite<br />
in million euros<br />
useful lives<br />
At January 1, 2010 1,156 1,437 156 6,148 8,897<br />
Acquisitions – – – 1 1<br />
Divestments – – – – –<br />
Additions – 6 10 – 16<br />
Disposals – –16 –1 –74 –91<br />
Reclassifications into assets held for sale – – – – –<br />
Reclassifications – 2 – – 2<br />
Translation differences 84 88 3 457 632<br />
At December 31, 2010/January 1, <strong>2011</strong> 1,240 1,517 168 6,532 9,457<br />
Acquisitions – 3 – 47 50<br />
Divestments – – – –5 –5<br />
Additions – 5 4 – 9<br />
Disposals – –14 – – –14<br />
Reclassifications into assets held for sale –27 – – – –27<br />
Reclassifications – 1 – – 1<br />
Translation differences 35 26 2 149 212<br />
At December 31, <strong>2011</strong> 1,248 1,538 174 6,723 9,683
112 <strong>Co</strong>nsolidated financial statements<br />
Notes to the consolidated statement of financial position<br />
<strong>Henkel</strong> <strong>Annual</strong> <strong>Report</strong> <strong>2011</strong><br />
Accumulated amortization<br />
Trademark rights and other rights<br />
Assets with Assets with Internally Goodwill<br />
Total<br />
indefinite definite generated<br />
useful lives useful lives intangible assets<br />
with definite<br />
in million euros<br />
useful lives<br />
At January 1, 2010 9 603 56 11 679<br />
Divestments – – – – –<br />
Write-ups – – – – –<br />
Scheduled amortization – 86 23 – 109<br />
Impairment losses 4 23 – 6 33<br />
Disposals – –16 –1 –6 –23<br />
Reclassifications into assets held for sale – – – – –<br />
Reclassifications – – – – –<br />
Translation differences – 17 1 – 18<br />
At December 31, 2010/January 1, <strong>2011</strong> 13 713 79 11 816<br />
Divestments – – – – –<br />
Write-ups – – – – –<br />
Scheduled amortization – 81 21 – 102<br />
Impairment losses – – – – –<br />
Disposals – –14 – – –14<br />
Reclassifications into assets held for sale – – – – –<br />
Reclassifications – – – – –<br />
Translation differences – 9 1 – 10<br />
At December 31, <strong>2011</strong> 13 789 101 11 914<br />
Net book values<br />
Trademark rights and other rights<br />
Assets with Assets with Internally Goodwill<br />
Total<br />
indefinite definite generated<br />
useful lives useful lives intangible assets<br />
with definite<br />
in million euros<br />
useful lives<br />
At December 31, <strong>2011</strong> 1,235 749 73 6,712 8,769<br />
At December 31, 2010 1,227 804 89 6,521 8,641<br />
Trademarks and other rights acquired for valuable consideration<br />
are stated initially at acquisition cost, while internally<br />
generated software is stated at manufacturing cost.<br />
Thereafter, goodwill and trademark rights and other rights<br />
with indefinite useful lives are subject to an impairment test<br />
at least once a year (“impairment only” approach). In the<br />
course of our annual impairment test, we reviewed the carrying<br />
amounts of goodwill and trademark rights and other rights<br />
with indefinite useful lives. The following table shows the<br />
cash-generating units together with the associated goodwill<br />
and trademark rights and other rights with indefinite useful<br />
lives at book value at the reporting date. The description<br />
of the cash-generating units can be found in the Group<br />
management report on pages 76 to 87.
<strong>Henkel</strong> <strong>Annual</strong> <strong>Report</strong> <strong>2011</strong><br />
Book values<br />
<strong>Co</strong>nsolidated financial statements<br />
Notes to the consolidated statement of financial position<br />
December 31, 2010 December 31, <strong>2011</strong><br />
Trademarks and Goodwill Trademarks and Goodwill<br />
other rights with<br />
other rights with<br />
Cash-generating units (summarized)<br />
indefinite useful<br />
indefinite useful<br />
in million euros<br />
lives<br />
lives<br />
Laundry 362 683 372 700<br />
Home Care 241 776 249 797<br />
Total Laundry & Home Care 603 1,459 621 1,497<br />
Branded <strong>Co</strong>nsumer Goods 481 1,046 467 1,073<br />
Hair Salon 13 51 13 96<br />
Total <strong>Co</strong>smetics/Toiletries 494 1,097 480 1,169<br />
Adhesives for <strong>Co</strong>nsumers, Craftsmen and Building 47 411 49 408<br />
Industrial Adhesives 83 3,554 85 3,638<br />
Total Adhesive Technologies 130 3,965 134 4,046<br />
The assessment for goodwill impairment according to the<br />
fair-value-less-cost-to-sell approach is based on future estimated<br />
cash flows which are obtained from corporate budgets.<br />
The assumptions upon which the essential planning parameters<br />
are based reflect experience gained in the past, aligned<br />
to current information provided by external sources. Budgets<br />
are prepared on the basis of a financial planning horizon of<br />
three years. For the period after that, a growth rate in a bandwidth<br />
between 1 and 2 percent in the cash flows is assumed<br />
for the purpose of impairment testing. The US dollar to euro<br />
exchange rate applied is 1.36. Taking into account specific<br />
tax effects, the cash flows in all cash-generating units are<br />
discounted at different rates reflecting the cost of capital<br />
(WACC) in each business sector: 6.5 percent after tax for<br />
Laundry & Home Care and <strong>Co</strong>smetics/Toiletries, and 8.0 percent<br />
after tax for Adhesive Technologies. The reportable segment<br />
Industrial Adhesives is comprised of the two business<br />
areas Packaging, <strong>Co</strong>nsumer Goods and <strong>Co</strong>nstruction Adhesives,<br />
and Transport, Metal, General Industry and Electronics.<br />
Goodwill at our Packaging, <strong>Co</strong>nsumer Goods and <strong>Co</strong>nstruction<br />
Adhesives business in fiscal <strong>2011</strong> amounted to 1,857 million<br />
euros (previous year: 1,817 million euros), while goodwill at<br />
Transport, Metal, General Industry and Electronics had a value<br />
of 1,781 million euros in <strong>2011</strong> (previous year: 1,737 million euros).<br />
In the Laundry & Home Care business sector, we have assumed<br />
an increase in sales during the three-year forecasting<br />
horizon of approximately 3 percent per year with a slight increase<br />
in world market share. Sales growth in the <strong>Co</strong>smetics/<br />
Toiletries business sector over the three-year forecasting<br />
horizon is likewise budgeted at around 3 percent per annum.<br />
With the cosmetics market relevant to <strong>Henkel</strong> expected to<br />
grow at an annual rate of less than 1 percent, this would mean<br />
an increase in market shares. The anticipated average sales<br />
growth during the three-year forecasting horizon in the<br />
Adhesive Technologies business sector is approximately<br />
6 percent per annum.<br />
In all the business sectors, we have assumed that a future<br />
increase in the cost of raw materials can be extensively offset<br />
by cost reduction measures in purchasing and/or passed on<br />
to our customers. With measures to improve efficiency and<br />
pro-active management of the portfolio, we anticipate<br />
achieving higher gross margins in all our business sectors.<br />
The impairment tests revealed sufficient buffer so that, as in<br />
the previous year, no goodwill write-downs were required. In<br />
the previous year, the disposal of our adhesives business in<br />
South Korea resulted in a goodwill impairment loss of 6 million<br />
euros, which was recognized in other operating charges.<br />
The brands/trademark rights with indefinite useful lives are<br />
established in their markets and will continue to be intensively<br />
promoted. Moreover, there are no other statutory, regulatory<br />
or competition-related factors that limit our usage of<br />
our brand names. The value of trademarks and other rights<br />
with indefinite useful lives attributable to our Industrial<br />
Adhesives segment is comprised of 43 million euros (previous<br />
year: 42 million euros) for our Packaging, <strong>Co</strong>nsumer<br />
Goods and <strong>Co</strong>nstruction Adhesives businesses, and 42 million<br />
euros (previous year: 41 million euros) for our Transport,<br />
Metal, General Industry and Electronics businesses.<br />
The impairment tests on trademark rights and other rights<br />
with indefinite useful lives resulted in no unscheduled<br />
charges. In the previous year, the impairment loss recognized<br />
was 4 million euros.<br />
113
114 <strong>Co</strong>nsolidated financial statements<br />
Notes to the consolidated statement of financial position<br />
<strong>Henkel</strong> <strong>Annual</strong> <strong>Report</strong> <strong>2011</strong><br />
The company also intends to continue using the brands disclosed<br />
as having definite lives. No impairment losses were<br />
registered with respect to trademark rights and other rights<br />
with definite lives in <strong>2011</strong>. The impairment charges of 23 million<br />
euros recognized in 2010 related predominantly to assets<br />
(2) Property, plant and equipment<br />
<strong>Co</strong>st<br />
attributable to Adhesive Technologies acquired in previous<br />
years. Write-downs of trademark rights and other rights are<br />
recognized as selling expenses.<br />
The write-downs on other intangible assets are allocated<br />
to the relevant functions in the consolidated statement of<br />
income.<br />
Land, land rights Plant and Factory and Payments on<br />
Total<br />
and buildings machinery office equip- account and asmentsets<br />
in course of<br />
in million euros<br />
construction<br />
At January 1, 2010 1,915 2,692 898 108 5,613<br />
Acquisitions – – – – –<br />
Divestments – – – – –<br />
Additions 21 74 50 95 240<br />
Disposals –55 –154 –63 –2 –274<br />
Reclassifications into assets held for sale 1 –10 –34 –2 – –46<br />
Reclassifications 50 42 17 –105 4<br />
Translation differences 81 67 34 – 182<br />
At December 31, 2010/January 1, <strong>2011</strong> 2,002 2,687 934 96 5,719<br />
Acquisitions – – – – –<br />
Divestments –7 –14 –5 – –26<br />
Additions 32 80 61 211 384<br />
Disposals –40 –134 –82 –1 –257<br />
Reclassifications into assets held for sale 1 –9 1 1 – –7<br />
Reclassifications 13 52 16 –82 –1<br />
Translation differences 7 –4 2 3 8<br />
At December 31, <strong>2011</strong> 1,998 2,668 927 227 5,820<br />
1 Of which 4 million euros cost (previous year: 6 million euros cost) and 2 million euros depreciation (previous year: 3 million euros) arising from reclassification from<br />
assets held for sale, as disposal is no longer intended.
<strong>Henkel</strong> <strong>Annual</strong> <strong>Report</strong> <strong>2011</strong><br />
Accumulated depreciation<br />
<strong>Co</strong>nsolidated financial statements<br />
Notes to the consolidated statement of financial position<br />
Land, land rights Plant and Factory Payments on<br />
Total<br />
and buildings machinery and office account and<br />
equipment assets in course<br />
in million euros<br />
of construction<br />
At January 1, 2010 828 1,873 664 – 3,365<br />
Divestments – – – – –<br />
Write-ups –4 –2 – – –6<br />
Scheduled depreciation 57 152 91 – 300<br />
Impairment losses 13 25 4 – 42<br />
Disposals –40 –141 –60 – –241<br />
Reclassifications into assets held for sale 1 –7 –32 –2 – –41<br />
Reclassifications 6 1 –4 – 3<br />
Translation differences 29 39 14 – 82<br />
At December 31, 2010/January 1, <strong>2011</strong> 882 1,915 707 – 3,504<br />
Divestments –3 –12 –4 – –19<br />
Write-ups –1 – – – –1<br />
Scheduled depreciation 54 145 82 – 281<br />
Impairment losses 9 11 1 – 21<br />
Disposals –24 –125 –80 – –229<br />
Reclassifications into assets held for sale 1 –6 1 1 – –4<br />
Reclassifications – –1 1 – –<br />
Translation differences 2 –1 2 – 3<br />
At December 31, <strong>2011</strong> 913 1,933 710 – 3,556<br />
1 Of which 4 million euros cost (previous year: 6 million euros cost) and 2 million euros depreciation (previous year: 3 million euros) arising from reclassification from<br />
assets held for sale, as disposal is no longer intended.<br />
Net book values<br />
Land, land rights Plant and Factory Payments on<br />
Total<br />
and buildings machinery and office account and<br />
equipment assets in course<br />
in million euros<br />
of construction<br />
At December 31, <strong>2011</strong> 1,085 735 217 227 2,264<br />
At December 31, 2010 1,120 772 227 96 2,215<br />
Additions are stated at purchase or manufacturing cost. The<br />
latter includes direct costs and appropriate proportions of<br />
necessary overheads. Interest charges on borrowings are not<br />
included, as <strong>Henkel</strong> does not currently hold any qualifying<br />
assets in accordance with IAS 23 “Borrowing <strong>Co</strong>sts.” A qualifying<br />
asset is an asset that necessarily takes a substantial<br />
period of time to get ready for its intended use. <strong>Co</strong>st figures<br />
are shown net of investment grants and allowances. Incidental<br />
acquisition costs incurred in order to make the asset ready<br />
for the intended use are capitalized. An overview of the<br />
primary investment projects undertaken during the fiscal<br />
year can be found on pages 60 and 61.<br />
Liabilities secured by mortgages at December 31, <strong>2011</strong> amounted<br />
to 32 million euros (previous year: 30 million euros). The<br />
periods over which the assets are depreciated are based on<br />
their estimated useful lives as set out on page 111.<br />
Scheduled depreciation and impairment losses recognized are<br />
disclosed in the consolidated statement of income according<br />
to the functions in which the assets are used.<br />
Of the impairment charges amounting to 21 million euros,<br />
further production optimization measures attributable to<br />
the Adhesive Technologies business sector in North America<br />
accounted for 6 million euros. Portfolio adjustments and<br />
structural optimization projects, including the termination<br />
of our Biozym joint venture, resulted in impairment losses<br />
in the Laundry & Home Care business sector amounting to<br />
11 million euros. Write-downs are allocated to the relevant<br />
functions in the consolidated statement of income.<br />
115
116 <strong>Co</strong>nsolidated financial statements<br />
Notes to the consolidated statement of financial position<br />
<strong>Henkel</strong> <strong>Annual</strong> <strong>Report</strong> <strong>2011</strong><br />
(3) Other financial assets<br />
Analysis<br />
December 31, 2010 December 31, <strong>2011</strong><br />
in million euros Non-current Current Total Non-current Current Total<br />
Financial receivables from other investments – 2 2 1 5 6<br />
Financial receivables from third parties 26 27 53 23 22 45<br />
Derivative financial instruments 187 144 331 194 70 264<br />
Financial investments 22 – 22 19 – 19<br />
Receivables from <strong>Henkel</strong> Trust e.V. – 9 9 – 115 115<br />
Securities and time deposits – 362 362 – 362 362<br />
Sundry financial assets 1 3 140 143 9 174 183<br />
Total 1 238 684 922 246 748 994<br />
1 Prior-year figures adjusted (see “Recognition and measurement methods” on pages 108 and 109).<br />
With the exception of derivatives, securities and time deposits,<br />
other financial assets are measured at amortized cost.<br />
The receivables from <strong>Henkel</strong> Trust e.V. relate to pension<br />
payments made by <strong>Henkel</strong> <strong>AG</strong> & <strong>Co</strong>. <strong>KGaA</strong> to retirees, for<br />
which reimbursement can be claimed from <strong>Henkel</strong> Trust e.V.<br />
Included under securities and time deposits are monies<br />
deposited as part of our short-term financial management<br />
arrangements. The securities involved are primarily floating<br />
interest bonds from industrial companies and financial<br />
institutions. All the bonds are publicly listed and can be<br />
sold at short notice.<br />
(4) Other assets<br />
Analysis<br />
Sundry non-current financial assets include receivables from<br />
employees.<br />
The sundry current financial assets include the following:<br />
• A surety payment related to a pending litigation in France<br />
in the amount of 92 million euros (previous year: 0 million<br />
euros).<br />
• Amounts due from sureties and guarantee deposits of<br />
31 million euros (previous year: 32 million euros).<br />
• Receivables from suppliers of 15 million euros (previous<br />
year: 21 million euros).<br />
• Receivables from employees amounting to 10 million euros<br />
(previous year: 10 million euros).<br />
December 31, 2010 December 31, <strong>2011</strong><br />
in million euros Non-current Current Total Non-current Current Total<br />
Tax receivables 10 134 144 – 123 123<br />
Payments on account – 26 26 – 21 21<br />
Overfunding of pension obligations 1<br />
Reimbursement rights related to<br />
15 – 15 4 – 4<br />
employee benefits 1 90 9 99 79 9 88<br />
Accruals 6 38 44 5 46 51<br />
Sundry other assets 14 12 26 15 38 53<br />
Total 1 135 219 354 103 237 340<br />
1 Prior-year figures adjusted (see “Recognition and measurement methods” on pages 108 and 109).
<strong>Henkel</strong> <strong>Annual</strong> <strong>Report</strong> <strong>2011</strong><br />
Disclosed under other assets for the first time are the overfunding<br />
of pension obligations, and reimbursement rights<br />
related to employee benefits. For further explanation of the<br />
adjustments of prior-year amounts, please refer to pages<br />
108 and 109.<br />
Of the reimbursement rights related to employee benefits,<br />
84 million euros (previous year: 90 million euros) is for<br />
reimbursement rights related to defined-benefit pension<br />
obligations, both of which are reported unnetted in the<br />
statement of financial position in accordance with IAS 19.<br />
The other reimbursement rights relate to liabilities to<br />
employees disclosed under other liabilities.<br />
(5) Deferred taxes<br />
Deferred taxes arise from differences between financial statement<br />
valuations and valuations prescribed for determining<br />
taxable income. They emanate from the following factors:<br />
• Timing differences between the valuation of an asset or a<br />
liability in the financial statement and the relevant tax base.<br />
• Unused tax losses expected to be utilized.<br />
• Tax credits.<br />
No deferred taxes are allocated in respect of the temporary<br />
differences arising from the first-time recognition of goodwill.<br />
Deferred taxes are calculated on the basis of tax rates that apply<br />
in the individual countries as of the year-end date. Deferred<br />
tax assets are netted with deferred tax liabilities where the<br />
company has a legally enforceable claim to set off corresponding<br />
current tax assets against current tax liabilities and the<br />
taxes are levied by the same tax authority. Deferred tax assets<br />
are only recognized to the extent that it is probable that the<br />
resultant future tax advantages will be utilized. An impairment<br />
test is conducted annually in this regard as of the year-end date.<br />
The breakdown of claims in respect of the various items in<br />
the statement of financial position is indicated under Note 30<br />
“Taxes on income” on pages 140 to 142.<br />
(6) Inventories<br />
In accordance with IAS 2, reported under inventories are<br />
those assets that are intended for sale in the normal course of<br />
business (finished products and merchandise), those undergoing<br />
manufacture ready for sale (unfinished products) and<br />
those to be utilized or consumed in the course of manufacture<br />
or the provision of services (raw materials and supplies).<br />
Payments on account made for the purpose of purchasing<br />
inventories are likewise disclosed under the inventories<br />
heading.<br />
Inventories are measured at the lower of cost and net realizable<br />
value.<br />
<strong>Co</strong>nsolidated financial statements<br />
Notes to the consolidated statement of financial position<br />
Inventories are measured using either the “first in, first out”<br />
(FIFO) or the average cost method. Manufacturing cost includes<br />
not only the direct costs but also appropriate portions<br />
of necessary overheads (for example goods-in department,<br />
raw material storage, filling, costs incurred through to the<br />
finished goods warehouse), production-related administrative<br />
expenses, the costs of the retirement pensions of people who<br />
are employed in the production process, and production-<br />
related depreciation and amortization. The overhead add-ons<br />
are calculated on the basis of average capacity utilization.<br />
Not included, however, are interest expenses incurred during<br />
the manufacturing period.<br />
The net realizable value is determined as an estimated selling<br />
price less costs yet to be incurred through to completion and<br />
necessary selling and distribution costs. Write-downs to the<br />
net realizable value are made if, as of year-end, the carrying<br />
amounts of the inventories are above their realizable fair values.<br />
The resultant valuation allowance for fiscal <strong>2011</strong> amounts to<br />
105 million euros (previous year: 108 million euros).<br />
Analysis of inventories<br />
December December<br />
in million euros<br />
31, 2010 31, <strong>2011</strong><br />
Raw materials and supplies 446 475<br />
Work in progress 61 61<br />
Finished products and merchandise 950 1,010<br />
Payments on account for merchandise 3 4<br />
Total 1,460 1,550<br />
(7) Trade accounts receivable<br />
Trade accounts receivable amount to 2,001 million euros<br />
(previous year: 1,893 million euros), all due within one year.<br />
Valuation allowances have been recognized in respect of<br />
specific risks as appropriate. Overall, the total valuation<br />
allowances recognized amount to 23 million euros (previous<br />
year: 24 mil lion euros).<br />
(8) Cash and cash equivalents<br />
Recognized under cash and cash equivalents are liquid funds,<br />
sight deposits and other financial assets with an original<br />
term of not more than three months. In accordance with IAS 7,<br />
also recognized under cash equivalents are shares in money<br />
market funds which, due to their first-class credit rating and<br />
investment in extremely short-term money market securities,<br />
undergo only minor value fluctuations and can be readily<br />
converted within one day into known amounts of cash. Utilized<br />
bank overdrafts are recognized in the statement of financial<br />
position as liabilities to banks.<br />
117
118 <strong>Co</strong>nsolidated financial statements<br />
Notes to the consolidated statement of financial position<br />
<strong>Henkel</strong> <strong>Annual</strong> <strong>Report</strong> <strong>2011</strong><br />
The volume of cash and cash equivalents increased compared<br />
to the previous year, from 1,515 million euros to 1,980 million<br />
euros. Of this figure, 829 million euros (previous year: 1,505 million<br />
euros) relates to cash and 1,151 million euros (previous<br />
year: 10 million euros) to cash equivalents. The change is shown<br />
in the consolidated statement of cash flows.<br />
(9) Assets held for sale<br />
Assets held for sale are assets that can be sold in their current<br />
condition and whose sale is very probable. Disposal must be<br />
expected within one year from the time of reclassification<br />
as held for sale. Such assets may be individual assets, groups<br />
of assets (disposal groups) or business operations (discontinued<br />
operations). Assets held for sale are no longer subject to<br />
scheduled depreciation or amortization and are instead<br />
recognized at the lower of carrying amount and fair value<br />
less costs to sell.<br />
<strong>Co</strong>mpared to December 31, 2010, the figure for assets held for<br />
sale rose by 20 million euros to 51 million euros. The increase<br />
is primarily due to the reclassification of non-core brands<br />
within the <strong>Co</strong>smetics/Toiletries business sector into assets<br />
held for sale. Certain non-current assets of various Group<br />
companies were similarly reclassified. This effect was countervailed<br />
by the disposal of our non-core TAED bleach activator<br />
business in Ireland, with a carrying value of 4 million<br />
euros, and also sales of assets at various Group companies.<br />
Moreover, assets of one company with a carrying value of<br />
2 million euros were classified back to property, plant and<br />
equipment as there was no longer any intention to sell.<br />
Measurement of assets held for sale at the lower of carrying<br />
amount and fair value less costs to sell resulted in an impairment<br />
charge of 2 million euros in the Adhesive Technologies<br />
business sector.<br />
(10) Issued capital<br />
Issued capital<br />
December December<br />
in million euros<br />
31, 2010 31, <strong>2011</strong><br />
Ordinary bearer shares 260 260<br />
Preferred bearer shares 178 178<br />
Capital stock 438 438<br />
<strong>Co</strong>mprising<br />
259,795,875 ordinary shares, 178,162,875 non-voting preferred shares.<br />
All the shares are fully paid in. The ordinary and preferred<br />
shares are bearer shares of no par value, each of which represents<br />
a nominal proportion of the capital stock amounting to<br />
1 euro. The liquidation proceeds are the same for all shares.<br />
The number of ordinary shares issued has remained unchanged<br />
since December 31, 2010. The number of preferred<br />
shares in circulation increased by 250,395 to 174,386,705 due<br />
to the exercise of option rights from stock incentive plans<br />
during the fiscal year, accompanied by a corresponding<br />
decrease in the number of treasury shares.<br />
According to Art. 6 (5) of the Articles of Association, the Personally<br />
Liable Partner is authorized – with the approval of the<br />
Shareholders’ <strong>Co</strong>mmittee and of the Supervisory Board – to<br />
increase the capital of the corporation in one or more installments<br />
at any time until April 18, 2015, up to a total of 25.6 million<br />
euros (25.6 million shares) by issuing new non-voting<br />
preferred shares to be paid up in cash (authorized capital).<br />
All shareholders are essentially assigned pre-emptive rights.<br />
However, these may be set aside where necessary in order to<br />
grant to holders of bonds with warrants or conversion rights<br />
issued by the corporation, or one of the companies dependent<br />
upon it, pre-emptive rights to new shares corresponding to<br />
those that would accrue to such bondholders following the<br />
exercise of their warrant or conversion rights, or if the issue<br />
price of the new shares is not significantly below the quoted<br />
market price at the time of issue price fixing. Pre-emptive<br />
rights may also be set aside where necessary in order to<br />
dispose of fractional amounts.<br />
On April 19, 2010, the <strong>Annual</strong> General Meeting of <strong>Henkel</strong> <strong>AG</strong> &<br />
<strong>Co</strong>. <strong>KGaA</strong> resolved to authorize the Personally Liable Partner<br />
to acquire, by April 18, 2015, ordinary or preferred shares of<br />
the corporation representing a nominal proportion of the<br />
capital stock of not more than 10 percent. This authorization<br />
can be exercised for any legal purpose. To the exclusion of<br />
the pre-emptive rights of existing shareholders, treasury<br />
shares may be used to operate the Stock Incentive Plan of the<br />
<strong>Henkel</strong> Group or transferred to third parties for the purpose<br />
of acquiring companies or investing in companies. Treasury<br />
stock may also be sold to third parties against payment in
<strong>Henkel</strong> <strong>Annual</strong> <strong>Report</strong> <strong>2011</strong><br />
cash, provided that the selling price is not significantly below<br />
the quoted market price at the time of share disposal. The<br />
shares may likewise be used to satisfy warrants or conversion<br />
rights granted by the corporation.<br />
The Personally Liable Partner has also been authorized –<br />
with the approval of the Shareholders’ <strong>Co</strong>mmittee and of the<br />
Supervisory Board – to cancel treasury shares without further<br />
resolution in General Meeting being required. The proportion<br />
of capital stock represented by treasury shares issued or sold<br />
on the basis of these authorizations must not exceed a total<br />
of 10 percent. Also to be taken into account in this restriction<br />
are shares used to service bonds with warrants or conversion<br />
rights or a conversion obligation, issued by the corporation or<br />
one of the companies dependent upon it, where these bonds<br />
were or are issued with the pre-emptive rights of existing<br />
shareholders excluded.<br />
Treasury stock held by the corporation at December 31, <strong>2011</strong><br />
amounted to 3,776,170 preferred shares. This represents 0.86 percent<br />
of capital stock and a proportional nominal value of<br />
3.8 million euros. The treasury shares were acquired in order<br />
to service the option rights arising from the Stock Incentive<br />
Plans. Originally, 992,680 shares were purchased in the year<br />
2000, an amount of 808,120 shares was purchased in 2001<br />
and 694,900 shares were purchased in 2002. This corresponds<br />
to a total of 2,495,700 shares or, following the share<br />
split implemented in 2007 (at a ratio of 1:3), 7,487,100 shares.<br />
Options were exercised for the first time under the Stock<br />
Incentive Plan in 2004. Since 2004, taking the share split<br />
into account, the exercise of options has led to a reduction of<br />
3,710,930 in treasury shares held, with a proportional nominal<br />
value of 3.7 million euros (0.85 percent of capital stock).<br />
In <strong>2011</strong>, the exercise of options led to a reduction of 250,395 in<br />
treasury shares held. The proportional nominal value of the<br />
capital stock amounted to 0.3 million euros (0.06 percent).<br />
The selling prices were based on the stock market prices prevailing<br />
at the time of disposal. The total proceeds on disposal<br />
of 12 million euros were recognized directly in equity.<br />
See also the explanatory notes on pages 30 and 31 of the<br />
management report.<br />
<strong>Co</strong>nsolidated financial statements<br />
Notes to the consolidated statement of financial position<br />
(11) Capital reserve<br />
The capital reserve comprises the amounts received in previous<br />
years in excess of the nominal value of preferred shares<br />
and convertible warrant bonds issued by <strong>Henkel</strong> <strong>AG</strong> & <strong>Co</strong>.<br />
<strong>KGaA</strong>.<br />
(12) Retained earnings<br />
Included in the retained earnings are the following:<br />
• Amounts allocated in the financial statements of <strong>Henkel</strong> <strong>AG</strong> &<br />
<strong>Co</strong>. <strong>KGaA</strong> in previous years.<br />
• Amounts allocated from the consolidated net income less<br />
those amounts attributable to non-controlling interests.<br />
• Buy-back of treasury shares by <strong>Henkel</strong> <strong>AG</strong> & <strong>Co</strong>. <strong>KGaA</strong> at<br />
cost and the proceeds from their disposal.<br />
• Actuarial gains and losses recognized in equity.<br />
(13) Other components of equity<br />
<strong>Report</strong>ed under this heading are differences arising from the<br />
currency translation of annual financial statements of foreign<br />
subsidiaries and also the effects arising from the revenue-neutral<br />
valuation of financial assets in the “available for<br />
sale” category and of derivative financial instruments for<br />
which hedge accounting is used. The latter are derivatives<br />
used in connection with cash flow hedges or hedges of a net<br />
investment in a foreign entity.<br />
Due in particular to the appreciation of the US dollar versus<br />
the euro, the negative difference attributable to shareholders<br />
of <strong>Henkel</strong> <strong>AG</strong> & <strong>Co</strong>. <strong>KGaA</strong> arising from currency translation<br />
was reduced by 114 million euros compared to the figure as of<br />
December 31, 2010, to –662 million euros.<br />
(14) Non-controlling interests<br />
Recognized under non-controlling interests are equity shares<br />
held by third parties in a number of consolidated subsidiaries,<br />
measured on the basis of the proportion of net assets that<br />
those shareholdings represent.<br />
119
120 <strong>Co</strong>nsolidated financial statements<br />
Notes to the consolidated statement of financial position<br />
<strong>Henkel</strong> <strong>Annual</strong> <strong>Report</strong> <strong>2011</strong><br />
(15) Pension obligations<br />
Employees in companies included in the consolidated financial<br />
statements have entitlements under company pension<br />
plans which are either defined contribution or defined benefit<br />
plans. These take different forms depending on the legal,<br />
financial and tax regime of each country. The level of benefits<br />
provided is based, as a rule, on the length of service and<br />
on the earnings of the person entitled.<br />
The defined contribution plans are structured in such a way<br />
that the corporation pays contributions to public or private<br />
sector institutions on the basis of statutory or contractual<br />
terms or on a voluntary basis and has no further obligations<br />
regarding the payment of benefits to employees. The contributions<br />
for defined contribution plans for the year under<br />
review amounted to 90 million euros (previous year: 91 million<br />
euros). In <strong>2011</strong>, payments to public sector institutions<br />
totaled 50 million euros (previous year: 46 million euros) and<br />
payments to private sector institutions totaled 40 million<br />
euros (previous year: 45 million euros).<br />
Trends in wages, salaries and retirement benefits<br />
In defined benefit plans, the liability for pensions and other<br />
post-employment benefits is calculated at the present value<br />
of the future obligations (projected unit credit method). This<br />
actuarial method of calculation takes future trends in wages,<br />
salaries and retirement benefits into account.<br />
The mortality rates used are based on published statistics<br />
and actuarial data as applicable in each country. In Germany,<br />
the assumptions are based on the “Heubeck 2005 G” mortality<br />
table. In the USA, the assumptions are based on the “RP<br />
2000 projected to 2015” mortality table.<br />
To provide protection under civil law of the pension entitlements<br />
of future and current pensioners of <strong>Henkel</strong> <strong>AG</strong> & <strong>Co</strong>.<br />
<strong>KGaA</strong> against insolvency, we have allocated proceeds of the<br />
bond issued in 2005 and certain other assets to <strong>Henkel</strong> Trust<br />
e.V. The trustee invests the cash with which it has been entrusted<br />
in the capital market in accordance with investment<br />
policies laid down in the trust agreement.<br />
Germany USA Rest of world 1<br />
in percent 2010 <strong>2011</strong> 2010 <strong>2011</strong> 2010 <strong>2011</strong><br />
Discount factor 4.50 4.30 5.40 4.40 3.8 4.2<br />
Income trend 3.25 3.25 4.25 4.25 3.1 3.1<br />
Retirement benefit trend 2.00 2.00 4.25 4.30 2.2 2.2<br />
Expected return on plan assets 6.19 5.69 5.80 5.80 4.1 3.8<br />
Expected return from reimbursement rights – – 6.50 6.50 – –<br />
Expected increases in costs for medical benefits – – 8.50 8.50 8.0 8.0<br />
1 Weighted average. Prior-year figures adjusted.<br />
Present value of pension obligations at December 31, 2010<br />
in million euros Germany USA 1 Rest of world Total<br />
At January 1, 2010 2,070 973 690 3,733<br />
Changes in the Group – – – 2 – 2<br />
Translation differences – 77 30 107<br />
Actuarial gains (–)/losses (+) 110 – 10 40 140<br />
Current service cost 78 20 26 124<br />
Gains (–)/losses (+) arising from the termination and curtailment of plans – – 16 – 2 – 18<br />
Interest expense 100 53 34 187<br />
Retirement benefits paid out of plan assets/out of reimbursement rights – 130 – 58 – 37 – 225<br />
Employer’s payments for pension obligations – 5 – 20 – 17 – 42<br />
Past service cost (+)/gain (–) – –1 – – 1<br />
At December 31, 2010 2,223 1,018 762 4,003<br />
of which unfunded obligations 134 198 97 429<br />
of which funded obligations 2,089 732 665 3,486<br />
of which obligations covered by reimbursement rights – 88 – 88<br />
1 Prior-year figures adjusted (see “Recognition and measurement methods” on pages 108 and 109).
<strong>Henkel</strong> <strong>Annual</strong> <strong>Report</strong> <strong>2011</strong><br />
Fair value of plan assets at December 31, 2010<br />
in million euros Germany USA Rest of world Total<br />
At January 1, 2010 1,730 567 543 2,840<br />
Changes in the Group – – – 1 – 1<br />
Translation differences – 44 21 65<br />
Employer contributions to pension funds 213 77 22 312<br />
Employee contributions to pension funds – – 1 1<br />
Retirement benefits paid out of plan assets –130 – 48 – 37 – 215<br />
Expected return on plan assets 107 36 28 171<br />
Actuarial gains (+)/losses (–) 178 10 26 214<br />
At December 31, 2010 2,098 686 603 3,387<br />
Actual return on plan assets 285 46 54 385<br />
Fair value of reimbursement rights at December 31, 2010<br />
in million euros Germany USA Rest of world Total<br />
At January 1, 2010 – 84 – 84<br />
Changes in the Group – – – –<br />
Translation differences – 6 – 6<br />
Employer contributions to pension funds – 2 – 2<br />
Employee contributions to pension funds – – – –<br />
Retirement benefits paid out of reimbursement rights – – 8 – – 8<br />
Expected return on reimbursement rights – 6 – 6<br />
Actuarial gains (+)/losses (–) – – – –<br />
At December 31, 2010 – 90 – 90<br />
Actual return on reimbursement rights – 6 – 6<br />
Net pension cost 2010<br />
in million euros Germany USA 1 Rest of world Total<br />
Current service cost 78 20 26 124<br />
Amortization of past service cost – – – –<br />
Gains (–)/losses (+) arising from the termination and curtailment of plans – –16 –2 –18<br />
Interest expense 100 53 34 187<br />
Expected return on plan assets –107 –36 –28 –171<br />
Expected return on reimbursement rights – –6 – –6<br />
Net pension cost 2010 71 15 30 116<br />
1 Prior-year figures adjusted (see “Recognition and measurement methods” on pages 108 and 109).<br />
Reconciliation of overfunding/underfunding to recognized<br />
provisions for pension obligations and to net obligation at December 31, 2010<br />
<strong>Co</strong>nsolidated financial statements<br />
Notes to the consolidated statement of financial position<br />
in million euros Germany USA 1 Rest of world Total<br />
Overfunding/underfunding of obligations – 125 – 332 – 159 – 616<br />
Amount not recognized due to asset ceiling – – – 9 – 9<br />
Past service cost – –6 2 – 4<br />
Reimbursement rights – 90 – 90<br />
Net obligation – 125 – 248 – 166 – 539<br />
Plan assets reported as net assets –9 – –6 –15<br />
Recognized as reimbursement rights (asset) – – 90 – – 90<br />
Recognized provision for pension obligations at December 31, 2010 –134 – 338 – 172 – 644<br />
1 Prior-year figures adjusted (see “Recognition and measurement methods” on pages 108 and 109).<br />
121
122 <strong>Co</strong>nsolidated financial statements<br />
Notes to the consolidated statement of financial position<br />
<strong>Henkel</strong> <strong>Annual</strong> <strong>Report</strong> <strong>2011</strong><br />
Present value of pension obligations at December 31, <strong>2011</strong><br />
in million euros Germany USA Rest of world Total<br />
At January 1, <strong>2011</strong> 2,223 1,018 762 4,003<br />
Changes in the Group –1 1 –3 –3<br />
Translation differences – 41 14 55<br />
Actuarial gains (–)/losses (+) 59 121 56 236<br />
Current service cost 35 16 27 78<br />
Gains (–)/losses (+) arising from the termination and curtailment of plans – –1 –2 –3<br />
Interest expense 97 49 33 179<br />
Retirement benefits paid out of plan assets/out of reimbursement rights –119 –54 –30 –203<br />
Employer’s payments for pension obligations –25 –21 –14 –60<br />
Past service cost (+)/gain (–) – –1 3 2<br />
At December 31, <strong>2011</strong> 2,269 1,169 846 4,284<br />
of which unfunded obligations 105 208 92 405<br />
of which funded obligations 2,164 867 754 3,785<br />
of which obligations covered by reimbursement rights – 94 – 94<br />
Fair value of plan assets at December 31, <strong>2011</strong><br />
in million euros Germany USA Rest of world Total<br />
At January 1, <strong>2011</strong> 2,098 686 603 3,387<br />
Changes in the Group – – –3 –3<br />
Translation differences – 24 13 37<br />
Employer contributions to pension funds 23 – 23 46<br />
Employee contributions to pension funds – – 1 1<br />
Retirement benefits paid out of plan assets –119 –46 –30 –195<br />
Expected return on plan assets 119 35 26 180<br />
Actuarial gains (+)/losses (–) –188 29 9 –150<br />
At December 31, <strong>2011</strong> 1,933 728 642 3,303<br />
Actual return on plan assets –69 64 35 30<br />
Fair value of reimbursement rights at December 31, <strong>2011</strong><br />
in million euros Germany USA Rest of world Total<br />
At January 1, <strong>2011</strong> – 90 – 90<br />
Changes in the Group – – – –<br />
Translation differences – 2 – 2<br />
Employer contributions to pension funds – – – –<br />
Employee contributions to pension funds – – – –<br />
Retirement benefits paid out of reimbursement rights – –7 – –7<br />
Expected return on reimbursement rights – 4 – 4<br />
Actuarial gains (+)/losses (–) – –5 – –5<br />
At December 31, <strong>2011</strong> – 84 – 84<br />
Actual return on reimbursement rights – –1 – –1<br />
Net pension cost <strong>2011</strong><br />
in million euros Germany USA Rest of world Total<br />
Current service cost 35 16 27 78<br />
Amortization of past service cost – – – –<br />
Gains (–)/losses (+) arising from the termination and curtailment of plans – –1 –2 –3<br />
Interest expense 97 49 33 179<br />
Expected return on plan assets –119 –35 –26 –180<br />
Expected return on reimbursement rights – –4 – –4<br />
Net pension cost <strong>2011</strong> 13 25 32 70
<strong>Henkel</strong> <strong>Annual</strong> <strong>Report</strong> <strong>2011</strong><br />
Reconciliation of overfunding/underfunding to recognized<br />
provisions for pension obligations and to net obligation at December 31, <strong>2011</strong><br />
in million euros Germany USA Rest of world Total<br />
Overfunding/underfunding of obligations –336 –441 –204 –981<br />
Amount not recognized due to asset ceiling – – –9 –9<br />
Past service cost – –5 1 –4<br />
Reimbursement rights – 84 – 84<br />
Net obligation –336 –362 –212 –910<br />
Plan assets reported as net assets – – –4 –4<br />
Recognized as reimbursement rights (asset) – –84 – –84<br />
Recognized provision for pension obligations at December 31, <strong>2011</strong> –336 –446 –216 –998<br />
To facilitate comparison, the figures for pension obligations<br />
to employees from the previous year have been adjusted, as<br />
explained on pages 108 and 109.<br />
Exercising the elective right that exists, we recognize actuarial<br />
gains and losses in the year in which they arise as part of the<br />
pension provision and include them in the statement of comprehensive<br />
income in accordance with IAS 19.93B “Employee<br />
Benefits.” Hence, the full extent of the obligation is recognized<br />
as of the statement of financial position date. As of December 31,<br />
<strong>2011</strong>, accumulated actuarial losses of 1,475 million euros<br />
(previous year: 1,084 million euros) were offset against retained<br />
earnings.<br />
We have derived the expected return on total plan assets<br />
from the weighted expected long-term return on the various<br />
asset classes.<br />
Analysis of plan assets<br />
<strong>Co</strong>nsolidated financial statements<br />
Notes to the consolidated statement of financial position<br />
Of the amounts added to the provision in <strong>2011</strong>, 78 million euros<br />
(previous year: 124 million euros) is included in operating<br />
profit (pension costs as part of payroll cost, see page 143)<br />
and 5 million euros (previous year: –10 million euros) in<br />
financial result (see page 140). The expenses shown in<br />
operating profit are allocated by function, depending on the<br />
sphere of activity of the employees. All gains/losses from the<br />
termination and curtailment of plans have been recognized<br />
in other operating income/charges. The employer’s contributions<br />
in respect of state pension provisions are included as<br />
“Social security costs and staff welfare costs” under Note 32,<br />
page 143. In <strong>2011</strong>, payments into the plan assets amounted<br />
to 46 million euros (previous year: 314 million euros).<br />
The reimbursement rights covering a portion of the pension<br />
obligations in the USA are assets that do not fulfill the definition<br />
of plan assets as stated in IAS 19. The reimbursement<br />
rights indicated are available to the Group in order to cover<br />
the expenditures required to fulfill the respective pension<br />
obligations. Reimbursement rights and the associated<br />
pension obligations must, according to IAS 19, be shown<br />
unnetted in the statement of financial position.<br />
December 31, 2010 December 31, <strong>2011</strong><br />
in million euros<br />
Investment funds invested in<br />
Fair value in % Fair value in %<br />
shares 952 28.1 951 28.8<br />
bonds 1,826 53.9 2,026 61.3<br />
cash 360 10.6 130 4.0<br />
Other assets 176 5.2 186 5.6<br />
Cash 73 2.2 10 0.3<br />
Total 3,387 100.0 3,303 100.0<br />
123
124 <strong>Co</strong>nsolidated financial statements<br />
Notes to the consolidated statement of financial position<br />
<strong>Henkel</strong> <strong>Annual</strong> <strong>Report</strong> <strong>2011</strong><br />
At December 31, <strong>2011</strong>, other assets making up the plan assets<br />
included the present value of a non-current receivable of<br />
47 million euros (previous year: 42 million euros) relating to<br />
claims pertaining to a hereditary building lease assigned by<br />
<strong>Henkel</strong> <strong>AG</strong> & <strong>Co</strong>. <strong>KGaA</strong> to <strong>Henkel</strong> Trust e.V. Also shown here is<br />
a claim of 132 million euros (previous year: 135 million euros)<br />
against BASF Personal Care & Nutrition GmbH (formerly<br />
<strong>Co</strong>gnis) for indemnification of pension obligations.<br />
Future pension payments<br />
in million euros Germany USA Rest of world Total<br />
2012 155 108 30 293<br />
2013 140 88 30 258<br />
2014 137 87 32 256<br />
2015 131 87 34 252<br />
2016 128 87 34 249<br />
Effect of discount rate changes on the present<br />
value of pension obligations<br />
in million euros Germany USA<br />
Present value of obligations 2,269 1,169<br />
Increase of 0.5 percentage points –130 –54<br />
Decrease of 0.5 percentage points 138 60<br />
Effects of a trend change in medical costs<br />
In <strong>2011</strong>, <strong>Henkel</strong> <strong>AG</strong> & <strong>Co</strong>. <strong>KGaA</strong> received or claimed indemnification<br />
out of the assets held by <strong>Henkel</strong> Trust e.V. with<br />
respect to benefits paid to pensioners in the amount of<br />
117 million euros.<br />
Payments into pension funds in fiscal 2012 are expected<br />
to total 52 million euros.<br />
In the next five financial years, the payments expected to<br />
come out of pension funds are as follows:<br />
December 31, 2010 December 31, <strong>2011</strong><br />
Service cost Interest Present value of Service cost Interest Present value of<br />
in million euros<br />
Increase in medical costs<br />
expense obligations<br />
expense obligations<br />
of 1 percentage point<br />
Decrease in medical costs<br />
–<br />
–<br />
8 – – 8<br />
of 1 percentage point –<br />
–<br />
– 7<br />
–<br />
–<br />
–7<br />
Multi-year summary<br />
in million euros 2007 1 2008 1 2009 1 2010 <strong>2011</strong><br />
Present value of obligations 3,118 3,248 3,684 4,003 4,284<br />
of which: post-retirement health care obligations 189 212 199 191 196<br />
Fair value of plan assets 2,461 2,445 2,840 3,387 3,303<br />
of which: for post-retirement health care obligations 4 8 7 7 6<br />
Overfunding/underfunding of obligations – 657 – 803 – 844 – 616 – 981<br />
Experience adjustments on pension obligations – 14 5 25 9 5<br />
Experience adjustments on plan assets – 125 – 499 53 214 –150<br />
1 The figures for 2007 to 2009 have not been adjusted as described in detail on pages 108 and 109.
<strong>Henkel</strong> <strong>Annual</strong> <strong>Report</strong> <strong>2011</strong><br />
(16) Income tax provisions and other provisions<br />
Development in <strong>2011</strong><br />
Initial balance<br />
Other Utilized Released<br />
Added End balance<br />
January 1, <strong>2011</strong> changes<br />
December 31,<br />
in million euros<br />
<strong>2011</strong><br />
Income tax provisions 446 4 94 80 126 402<br />
of which non-current 119 –1 8 26 9 93<br />
of which current 327 5 86 54 117 309<br />
Restructuring provisions 245 3 102 12 157 291<br />
of which non-current 74 –17 8 2 45 92<br />
of which current 171 20 94 10 112 199<br />
Sundry provisions 924 3 534 32 575 936<br />
of which non-current 228 –4 27 5 110 302<br />
of which current 696 7 507 27 465 634<br />
Total 1,615 10 730 124 858 1,629<br />
of which non-current 421 –22 43 33 164 487<br />
of which current 1,194 32 687 91 694 1,142<br />
Provisions are recognized in response to an obligation to<br />
third parties where the outflow of resources is probable and<br />
the expected obligation can be reliably estimated. Provisions<br />
are aligned to the best estimate of the expenditures required<br />
in order to meet the current obligation as of the reporting<br />
date. Price increases expected to take place prior to the time<br />
of performance are included in the calculation. Provisions in<br />
which the interest effect is material are discounted to the reporting<br />
date at a pre-tax interest rate. For obligations in Germany, we<br />
have applied interest rates of between 2.6 and 4.5 percent.<br />
The income tax provisions comprise accrued tax liabilities<br />
and amounts set aside for the outcome of external tax audits.<br />
Other provisions include identifiable obligations toward third<br />
parties. They are measured at total cost.<br />
Other changes in provisions include changes in the scope<br />
of consolidation, movements in exchange rates, and adjustments<br />
to reflect changes in maturity as time passes.<br />
Provisions are recognized in respect of restructuring measures,<br />
provided that work has begun on the implementation of<br />
a detailed, formal plan or such a plan has already been communicated.<br />
In order to continuously adapt our structures to<br />
our markets and customers, we have increased the additions<br />
to our restructuring provisions, particularly in respect of<br />
Western Europe and North America. We are further expanding<br />
our shared service centers, realigning our organization in<br />
the Laundry & Home Care business sector toward greater<br />
efficiency, and optimizing the production network within<br />
the Adhesive Technologies business sector.<br />
<strong>Co</strong>nsolidated financial statements<br />
Notes to the consolidated statement of financial position<br />
The provisions for obligations arising from our sales activities<br />
cover expected burdens in the form of subsequent reductions<br />
in already generated revenues, and risks arising from<br />
onerous contracts.<br />
Provisions for obligations in the personnel sphere essentially<br />
cover expenditures likely to be incurred by the Group for<br />
variable, performance-related compensation components.<br />
In the year under review, we added 62 million euros to the<br />
provisions for our “Special Incentive 2012,” which is included<br />
in non-current provisions for payments to employees. The<br />
program extends to our management circles 0 to IIb.<br />
Provisions for obligations in the production and technology<br />
sphere relate primarily to provisions for warranties.<br />
Analysis of sundry provisions by function<br />
December December<br />
in million euros<br />
31, 2010 31, <strong>2011</strong><br />
Sales 166 120<br />
of which non-current 9 4<br />
of which current 157 116<br />
Personnel 506 585<br />
of which non-current 144 228<br />
of which current 362 357<br />
Production and technology 39 40<br />
of which non-current 20 22<br />
of which current 19 18<br />
Various sundry obligations 213 191<br />
of which non-current 55 48<br />
of which current 158 143<br />
Total 924 936<br />
of which non-current 228 302<br />
of which current 696 634<br />
125
126 <strong>Co</strong>nsolidated financial statements<br />
Notes to the consolidated statement of financial position<br />
<strong>Henkel</strong> <strong>Annual</strong> <strong>Report</strong> <strong>2011</strong><br />
(17) Borrowings<br />
December 31, 2010 December 31, <strong>2011</strong><br />
in million euros Non-current Current Total Non-current Current Total<br />
Bonds 3,468 219 3,687 3,483 187 3,670<br />
<strong>Co</strong>mmercial papers 1 – 79 79 – 29 29<br />
Liabilities to banks 2 102 233 335 15 194 209<br />
(of which amounts secured) (11) (93) (104) (12) (62) (74)<br />
Other borrowings – 5 5 3 2 5<br />
Total 3,570 536 4,106 3,501 412 3,913<br />
1 From the euro and US dollar commercial paper program (total volume 2.1 billion euros).<br />
2 Obligations with floating rates of interest or interest rates pegged for less than one year.<br />
Bonds<br />
Issuer<br />
Type<br />
Nominal<br />
Carrying amounts<br />
excluding accrued<br />
interest<br />
Market values<br />
excluding accrued<br />
interest 1<br />
Market values<br />
including accrued<br />
interest 1<br />
Interest rate 2<br />
Interest<br />
fixing<br />
in million euros 2010 <strong>2011</strong> 2010 <strong>2011</strong> 2010 <strong>2011</strong> 2010 <strong>2011</strong><br />
<strong>Henkel</strong> <strong>AG</strong> & <strong>Co</strong>. <strong>KGaA</strong><br />
Interest rate swap<br />
Bond 1,000 1,049 1,030 1,057 1,044 1,081 1,068 4.2500 4.2500 until 2013 3<br />
(3-month Euribor +0.405 %) 6 Receiver swap 1,000 55 32 55 32 78 55 1.4351 1.8751 3 months<br />
<strong>Henkel</strong> <strong>AG</strong> & <strong>Co</strong>. <strong>KGaA</strong><br />
Interest rate swap<br />
Bond 1,000 1,020 1,029 1,076 1,072 1,112 1,108 4.6250 4.6250 until 2014 4<br />
(3-month Euribor +2.02 %) 6 Receiver swap 1,000 24 32 24 32 59 67 3.0453 3.4403 3 months<br />
<strong>Henkel</strong> <strong>AG</strong> & <strong>Co</strong>. <strong>KGaA</strong><br />
Interest rate swap<br />
Hybrid bond 1,300 1,399 1,424 1,320 1,296 1,327 1,303 5.3750 5.3750 until 2015 5<br />
(3-month Euribor +1.80 %) 6<br />
Interest rate swap<br />
Receiver swap 650 37 54 37 54 39 55 2.8352 3.2712 3 months<br />
(1-month Euribor +0.955 %) 6 Receiver swap 650 69 81 69 81 72 84 1.7590 2.0750 1 month<br />
Total bonds 3,300 3,468 3,483 3,453 3,412 3,520 3,479<br />
Total interest rate swaps 3,300 185 199 185 199 248 261<br />
1 Market value of the bonds derived from the stock market price at December 31.<br />
2 Interest rate on December 31.<br />
3 Fixed-rate interest of bond coupon: 4.25 percent, converted using interest rate swaps into a floating interest rate; interest rate to be fixed next on March 12, 2012<br />
(previous year: March 10, <strong>2011</strong>) (fair value hedge).<br />
4 Fixed-rate interest of bond coupon: 4.625 percent, converted using interest rate swaps into a floating interest rate; interest rate to be fixed next on March 19, 2012<br />
(previous year: March 21, <strong>2011</strong>) (fair value hedge).<br />
5 Fixed-rate interest of bond coupon: 5.375 percent, converted using interest rate swaps into a floating interest rate; interest rate to be fixed next on January 25, 2012<br />
(previous year: January 25, <strong>2011</strong> ) (fair value hedge).<br />
6 Not including the valuation allowance in the amount of 4.8 million euros to provide for counterparty default risk.<br />
The ten-year bond issued in 2003 by <strong>Henkel</strong> <strong>AG</strong> & <strong>Co</strong>. <strong>KGaA</strong><br />
for 1 billion euros with a coupon of 4.25 percent matures in<br />
June 2013.<br />
The five-year bond issued in 2009 by <strong>Henkel</strong> <strong>AG</strong> & <strong>Co</strong>. <strong>KGaA</strong><br />
for 1 billion euros with a coupon of 4.625 percent matures in<br />
March 2014.<br />
The 1.3 billion euro subordinated hybrid bond issued by <strong>Henkel</strong><br />
<strong>AG</strong> & <strong>Co</strong>. <strong>KGaA</strong> in November 2005 to finance a large part of<br />
the pension obligations in Germany matures in 2104. Under<br />
the terms of the bond, the coupon for the first ten years is<br />
5.375 percent. The earliest bond redemption date is November<br />
25, 2015. If it is not redeemed, the bond interest will be based<br />
on the 3-month Euribor interest rate plus a premium of<br />
2.85 percentage points. The bond terms also stipulate that if<br />
there is a “cash flow event,” <strong>Henkel</strong> <strong>AG</strong> & <strong>Co</strong>. <strong>KGaA</strong> has the<br />
option or the obligation to defer the interest payments. A cash<br />
flow event is deemed to have occurred if the adjusted cash<br />
flow from operating activities is below a certain percentage<br />
of the net liabilities (20 percent for optional interest deferral,<br />
15 percent for mandatory interest deferral); see Section 3 (4) of<br />
the bond terms and conditions for the definition. On the basis<br />
of the cash flow calculated at December 31, <strong>2011</strong>, the percentage<br />
was 77.42 percent (previous year: 72.23 percent).<br />
The US dollar liabilities of <strong>Henkel</strong> of America, Inc. are set off<br />
against sureties of <strong>Henkel</strong> <strong>AG</strong> & <strong>Co</strong>. <strong>KGaA</strong>. Liabilities to banks<br />
set off against deposits amounted to 1,536 million euros. See<br />
also the explanatory notes on discretionary judgments on<br />
page 109.<br />
The securities for liabilities to banks relate to mortgages,<br />
assigned receivables and inventory pledged.
<strong>Henkel</strong> <strong>Annual</strong> <strong>Report</strong> <strong>2011</strong><br />
(18) Other financial liabilities<br />
Analysis<br />
December 31, 2010 December 31, <strong>2011</strong><br />
in million euros Non-current Current Total Non-current Current Total<br />
Liabilities to non-consolidated<br />
affiliated companies –<br />
15<br />
15 – 8 8<br />
Liabilities to customers – 30 30 – 33 33<br />
Derivative financial instruments 69 90 159 50 25 75<br />
Sundry financial liabilities 4 12 16 4 18 22<br />
Total 1 73 147 220 54 84 138<br />
1 Prior-year figures adjusted (see “Recognition and measurement methods” on pages 108 and 109).<br />
Sundry other liabilities include payments owed to the Pensionssicherungsverein<br />
(German pension protection fund)<br />
amounting to 9 million euros (previous year: 12 million euros).<br />
(19) Other liabilities<br />
Analysis<br />
December 31, 2010 December 31, <strong>2011</strong><br />
in million euros Non-current Current Total Non-current Current Total<br />
Other tax liabilities – 83 83 – 81 81<br />
Liabilities to employees 1 8 25 33 4 18 22<br />
Liabilities relating to employees’ deductions – 51 51 – 53 53<br />
Liabilities in respect of social security – 21 21 – 20 20<br />
Sundry other liabilities 17 50 67 19 35 54<br />
Total 1 25 230 255 23 207 230<br />
1 Prior-year figures adjusted (see “Recognition and measurement methods” on pages 108 and 109).<br />
The sundry other liabilities primarily comprise various accruals<br />
and deferrals amounting to 15 million euros (previous year:<br />
16 million euros) and also include payments on account in the<br />
amount of 4 million euros (previous year: 5 million euros).<br />
(20) Trade accounts payable<br />
Trade accounts payable increased from 2,308 million euros<br />
to 2,411 million euros. In addition to purchase invoices, they<br />
also relate to accruals for invoices outstanding in respect of<br />
goods and services received. All such payables are due within<br />
one year.<br />
<strong>Co</strong>nsolidated financial statements<br />
Notes to the consolidated statement of financial position<br />
127
128 <strong>Co</strong>nsolidated financial statements<br />
Notes to the consolidated statement of financial position<br />
<strong>Henkel</strong> <strong>Annual</strong> <strong>Report</strong> <strong>2011</strong><br />
(21) Financial instruments report<br />
Loans and<br />
receivables<br />
Amortized cost<br />
Held to maturity<br />
Financial instruments explained by category<br />
A financial instrument is any contract that gives rise to a<br />
financial asset of one entity and a financial liability or equity<br />
instrument of another entity.<br />
Within the <strong>Henkel</strong> Group, financial instruments are reported<br />
under trade accounts receivable, trade accounts payable, borrowings,<br />
other financial assets and other financial liabilities,<br />
and also cash and cash equivalents within the statement of<br />
financial position.<br />
Financial instruments are recognized once <strong>Henkel</strong> becomes<br />
a party to the contractual provisions of the financial instrument.<br />
The recognition of financial assets takes place at the<br />
settlement date, with the exemption of derivative financial<br />
instruments that are recognized on the transaction date.<br />
All financial instruments are initially recognized at their fair<br />
value. Incidental acquisition costs are only capitalized if the<br />
financial instruments are not subsequently remeasured to<br />
fair value through profit or loss.<br />
For subsequent remeasurement, financial instruments are<br />
divided into the following classes in accordance with IAS 39:<br />
• Financial instruments measured at amortized cost<br />
• Financial instruments measured at fair value<br />
Different valuation categories are allocated to these two<br />
classes. Financial instruments assigned to the valuation<br />
categories “Available for sale” and “Held for trading” are essentially<br />
measured at fair value. Securities and time deposits<br />
recognized as other financial assets, and also financial<br />
investments are categorized as “Held for sale.” Only the<br />
Financial instruments<br />
Financial assets Financial liabilities<br />
Fair value option<br />
Profit and loss<br />
Categories used by <strong>Henkel</strong><br />
Equity<br />
instruments<br />
Fair value Amortized cost Fair value <strong>Co</strong>st<br />
Held for trading<br />
<strong>Co</strong>mprehensive<br />
income<br />
Available for sale<br />
derivative financial instruments held by the <strong>Henkel</strong> Group<br />
which are not included in hedge accounting are designated as<br />
“Held for trading.” All other financial instruments including<br />
the financial assets categorized as “Loans and receivables”<br />
are recognized at amortized cost using the effective interest<br />
method. The measurement categories “Held to maturity” and<br />
“Fair value option” are not used within the <strong>Henkel</strong> Group.<br />
The financial instruments in the measurement category<br />
“Loans and receivables” are nonderivative financial instruments.<br />
They are characterized by fixed or determinable payments<br />
and are not traded in an active market. Within the<br />
<strong>Henkel</strong> Group, this category is mainly comprised of trade<br />
accounts receivable, cash and cash equivalents, and other<br />
financial assets with the exception of derivatives, securities<br />
and time deposits. The carrying amounts of the financial<br />
instruments categorized as loans and receivables approximate<br />
to their fair value due to their predominantly shortterm<br />
nature. If there are doubts as to the realizability of these<br />
financial instruments, they are recognized at amortized<br />
cost less appropriate individual valuation allowances<br />
or global valuation allowances for bad debts.<br />
Financial instruments in the category “Available for sale”<br />
are not derivative financial assets and are, provided that it<br />
is reliably determinable, recognized at fair value. If the fair<br />
value cannot be reliably determined, they are recognized at<br />
cost. Value changes between the reporting dates are essentially<br />
recognized in the consolidated statement of comprehensive<br />
income (revaluation reserve) without affecting<br />
revenue, unless the cause lies in permanent impairment.<br />
Impairment losses are recognized through profit or loss. When<br />
the asset is derecognized, the amounts recognized in the
<strong>Henkel</strong> <strong>Annual</strong> <strong>Report</strong> <strong>2011</strong><br />
revaluation reserve are released through profit or loss. In the<br />
<strong>Henkel</strong> Group, the se curities and time deposits recognized<br />
under other financial assets and also the financial investments<br />
are categorized as “Available for sale.” The fair values of the<br />
securities and time deposits are based on quoted market prices.<br />
As the fair values of the financial investments cannot be<br />
reliably determined, they are measured at amortized cost.<br />
The sale or disposal of these financial instruments is not<br />
currently intended.<br />
The derivative financial instruments not included in a designated<br />
hedging relationship and therefore categorized as held<br />
for trading are essentially recognized at their fair value. All<br />
fair value changes are recognized through profit or loss. In<br />
order to avoid profit and loss variations arising from fair<br />
Carrying amounts and fair values of financial instruments<br />
December 31, 2010<br />
in million euros<br />
Assets<br />
Carrying<br />
amount<br />
December 31<br />
<strong>Co</strong>nsolidated financial statements<br />
Notes to the consolidated statement of financial position<br />
value changes in derivative financial instruments, in individual<br />
cases – where possible and economically sensible – hedge<br />
accounting is applied. Depending on the type of underlying<br />
and the risk needing to be hedged, fair value and cash flow<br />
hedges are also designated within the Group. Details relating<br />
to the hedging contracts transacted within the Group and<br />
how the fair values of the derivatives are determined are<br />
provided on pages 131 to 133.<br />
All financial liabilities, with the exception of derivative<br />
financial instruments, are essentially recognized at amortized<br />
cost using the effective interest method.<br />
Borrowings for which a hedging transaction has been concluded<br />
that meets the requirements of IAS 39 with respect to<br />
hedge accounting are recognized through hedge accounting.<br />
Valuation according to IAS 39<br />
Amortized cost Fair value Fair value<br />
through other through profit<br />
comprehensive<br />
income<br />
or loss<br />
Fair value<br />
December 31<br />
Loans and receivables 3,615 3,615 – – 3,615<br />
Trade accounts receivable 1,893 1,893 – – 1,893<br />
Other financial assets 207 207 – – 207<br />
Cash and cash equivalents 1,515 1,515 – – 1,515<br />
Available for sale 384 22 362 – 384<br />
Other financial assets 384 22 362 – 384<br />
Held for trading<br />
Derivative financial instruments not included in a designated<br />
83 – – 83 83<br />
hedging relationship<br />
Derivative financial instruments included in a designated hedging<br />
83 – – 83 83<br />
relationship 248 – – 248 248<br />
Total 4,330 3,637 362 331 4,330<br />
Liabilities<br />
Amortized cost 6,475 6,475 – – 6,460<br />
Trade accounts payable 2,308 2,308 – – 2,308<br />
Borrowings with no financial statement hedging relationship 571 571 – – 571<br />
Borrowings with a financial statement hedging relationship 3,535 3,535 – – 3,520<br />
Other financial liabilities 61 61 – – 61<br />
Held for trading<br />
Derivative financial instruments not included in a designated<br />
89 – – 89 89<br />
hedging relationship<br />
Derivative financial instruments included in a designated hedging<br />
89 – – 89 89<br />
relationship 70 – 70 – 70<br />
Total 6,634 6,475 70 89 6,619<br />
129
130 <strong>Co</strong>nsolidated financial statements<br />
Notes to the consolidated statement of financial position<br />
<strong>Henkel</strong> <strong>Annual</strong> <strong>Report</strong> <strong>2011</strong><br />
December 31, <strong>2011</strong><br />
in million euros<br />
Assets<br />
Carrying<br />
amount<br />
December 31<br />
Valuation according to IAS 39<br />
Amortized cost Fair value Fair value<br />
through other through<br />
comprehensive<br />
income<br />
profit or loss<br />
Fair value<br />
December 31<br />
Loans and receivables 4,330 4,330 – – 4,330<br />
Trade accounts receivable 2,001 2,001 – – 2,001<br />
Other financial assets 349 349 – – 349<br />
Cash and cash equivalents 1,980 1,980 – – 1,980<br />
Available for sale 381 19 362 – 381<br />
Other financial assets 381 19 362 – 381<br />
Held for trading<br />
Derivative financial instruments not included in a designated<br />
8 – – 8 8<br />
hedging relationship<br />
Derivative financial instruments included in a designated hedging<br />
8 – – 8 8<br />
relationship 256 – – 256 256<br />
Total 4,975 4,349 362 264 4,975<br />
Liabilities<br />
Amortized cost 6,387 6,387 – – 6,316<br />
Trade accounts payable 2,411 2,411 – – 2,411<br />
Borrowings with no financial statement hedging relationship 363 363 – – 363<br />
Borrowings with a financial statement hedging relationship 3,550 3,550 – – 3,479<br />
Other financial liabilities 63 63 – – 63<br />
Held for trading<br />
Derivative financial instruments not included in a designated<br />
24 – – 24 24<br />
hedging relationship<br />
Derivative financial instruments included in a designated hedging<br />
24 – – 24 24<br />
relationship 51 – 51 – 51<br />
Total 6,462 6,387 51 24 6,391<br />
The following hierarchy is applied in order to determine and<br />
disclose the fair value of financial instruments:<br />
• Level 1: Fair values which are determined on the basis of<br />
quoted, unadjusted prices in active markets.<br />
• Level 2: Fair values which are determined on the basis of<br />
parameters for which either directly or indirectly derived<br />
market prices are available.<br />
• Level 3: Fair values which are determined on the basis of<br />
parameters for which the input factors are not derived from<br />
observable market data.<br />
The securities categorized within the <strong>Henkel</strong> Group as<br />
available for sale and measured at fair value fall under<br />
fair value hierarchy level 1, while derivative financial<br />
instruments fall under fair value hierarchy level 2.<br />
Net gains and losses from financial instruments by category<br />
The net gains and losses from financial instruments can<br />
be allocated to the following categories:<br />
Net results of the measurement categories and reconciliation<br />
to financial result<br />
in million euros 2010 <strong>2011</strong><br />
Loans and receivables 52 66<br />
Available for sale<br />
Held for trading including derivatives in a<br />
5 9<br />
designated hedging relationship – 37 43<br />
Financial liabilities measured at amortized cost –230 –220<br />
Total net results – 210 –102<br />
Foreign exchange effects<br />
Interest expense of pension provisions<br />
less expected return from plan assets and<br />
58 –59<br />
reimbursement rights<br />
Other financial result<br />
–10 5<br />
(not related to financial instruments) – 9 1<br />
Financial result – 171 –155
<strong>Henkel</strong> <strong>Annual</strong> <strong>Report</strong> <strong>2011</strong><br />
The net result of loans and receivables is allocated in full to<br />
interest income. Expenses arising from valuation allowances<br />
amounting to 39 million euros (previous year: 41 million<br />
euros) and income from writeups amounting to 2 million<br />
euros (previous year: 3 million euros) were recognized in<br />
operating profit.<br />
The net result from securities and time deposits classified<br />
as available for sale breaks down to 9 million euros (previous<br />
year: 4 million euros) for interest income and 0 million euros<br />
(previous year: 1 million euros) for income from financial<br />
investments. The measurement of these financial instruments<br />
at fair value led to an impairment charge of 2 million<br />
euros (previous year: 0 million euros) which was recognized<br />
in the reserve for financial instruments available for sale in<br />
other comprehensive income.<br />
The net result from “Held for trading” financial instruments<br />
plus derivatives included in a designated hedging relationship<br />
includes, in addition to the outcome of remeasurement<br />
of these derivatives to fair value amounting to 11 million euros<br />
(previous year: –92 million euros), an expense of 4 million<br />
euros (previous year: 0 million euros) arising from the valuation<br />
allowance made for counterparty credit risk. Also recognized<br />
under this heading is the interest income arising from interest<br />
rate hedging instruments amounting to 36 million euros<br />
(previous year: 55 million euros).<br />
The net result from financial liabilities measured at amortized<br />
cost is essentially derived from the interest expense for<br />
borrowings amounting to 217 million euros (previous year:<br />
227 million euros). Fees for procuring money and loan<br />
<strong>Co</strong>nsolidated financial statements<br />
Notes to the consolidated statement of financial position<br />
resources amounting to 3 million euros (previous year:<br />
3 million euros) were also recognized under this heading.<br />
The realization and valuation of financial assets and liabilities<br />
in foreign currencies resulted in an expense of –59 million<br />
euros (previous year: gain of 58 million euros).<br />
Derivative financial instruments<br />
Derivative financial instruments are measured at their fair<br />
value at the reporting date. Recognition of the gains and losses<br />
arising from fair value changes of derivative financial instruments<br />
is dependent upon whether the requirements of IAS 39<br />
are fulfilled with respect to hedging relationships (hedge<br />
accounting).<br />
Hedge accounting is not applied to the large majority of<br />
derivative financial instruments. The fair value changes<br />
in these derivatives which, in economic terms, represent<br />
effective hedges within the framework of Group strategy, are<br />
recognized through profit or loss. These are, however, largely<br />
compensated by fair value changes undergone by the hedged<br />
items.<br />
In hedge accounting, derivative financial instruments are<br />
qualified as instruments for hedging the fair value of a<br />
re cognized underlying (“fair value hedge”), as instruments<br />
for hedging future cash flows (“cash flow hedge”) or as instruments<br />
for hedging a net investment in a foreign entity.<br />
The following table provides an overview of the derivative<br />
financial instruments utilized and recognized within the<br />
Group, and their fair values:<br />
Derivative financial instruments<br />
At December 31<br />
Nominal value Positive fair value 2 Negative fair value 2<br />
in million euros<br />
2010 <strong>2011</strong> 2010 <strong>2011</strong> 2010 <strong>2011</strong><br />
Forward exchange contracts 1 2,396 1,445 77 7 – 89 –23<br />
(of which: for hedging loans within the Group) (1,848) (881) (75) (4) (– 83) (–14)<br />
Interest rate swaps 4,797 4,537 248 256 – 70 –51<br />
(of which: designated as fair value hedge) (3,300) (3,300) (248) (256) (–) (–)<br />
(of which: designated as cash flow hedge) (1,497) (1,237) (–) (–) (– 70) (–51)<br />
Other interest rate hedging instruments 500 386 2 – – –<br />
(of which: designated for hedge accounting) (–) (–) (–) (–) (–) (–)<br />
<strong>Co</strong>mmodity futures 1 44 39 4 1 – –1<br />
(of which: designated for hedge accounting) (–) (–) (–) (–) (–) (–)<br />
Total derivative financial instruments 7,737 6,407 331 264 – 159 –75<br />
1 Maturity shorter than 1 year.<br />
2 Fair values including accrued interest and a valuation allowance for counterparty credit risk of 4.8 million euros (prior year: 0.8 million euros).<br />
131
132 <strong>Co</strong>nsolidated financial statements<br />
Notes to the consolidated statement of financial position<br />
<strong>Henkel</strong> <strong>Annual</strong> <strong>Report</strong> <strong>2011</strong><br />
For forward exchange transactions, the fair value is determined<br />
on the basis of the reference exchange rates of the<br />
European Central Bank prevailing at the reporting date, taking<br />
into account forward premiums/forward discounts for the<br />
remaining term of the respective contract versus the contracted<br />
foreign exchange rate. Foreign exchange options are<br />
measured using price quotations or recognized models for<br />
the determination of option prices. Interest rate hedging<br />
instruments are measured on the basis of discounted cash<br />
flows expected in the future, taking into account market<br />
interest rates applicable for the remaining term of the<br />
contracts. These are indicated for the two most important<br />
currencies in the following table. It shows the interest rates<br />
quoted on the interbank market in each case as of December 31.<br />
Interest rates in percent p.a.<br />
At December 31<br />
EUR USD<br />
Term<br />
2010 <strong>2011</strong> 2010 <strong>2011</strong><br />
3 months 0.96 1.36 0.48 0.69<br />
6 months 1.23 1.84 0.40 0.76<br />
1 year 1.51 1.95 0.88 1.23<br />
2 years 1.53 1.29 0.82 0.75<br />
5 years 2.50 1.73 2.23 1.27<br />
10 years 3.35 2.42 3.56 2.10<br />
Due to the complexities involved, financial derivatives entered<br />
into as hedges of commodity price risks are primarily measured<br />
on the basis of bankdeveloped simulation models, which are<br />
derived from market quotations. Regular plausibility checks<br />
are performed in order to safeguard valuation correctness.<br />
In measuring derivative financial instruments, counterparty<br />
credit risk is taken into account with a lumpsum adjustment<br />
to the fair values concerned, determined on the basis of<br />
credit risk premiums. The adjustment relating to fiscal <strong>2011</strong><br />
amounts to 4.8 million euros (previous year: 0.8 mil lion euros).<br />
The addition was expensed under financial result.<br />
Depending on their fair value and their maturity on the reporting<br />
date, derivative financial instruments are included in<br />
financial assets (positive fair value) or in financial liabilities<br />
(negative fair value).<br />
Most of the forward exchange contracts and currency options<br />
serve to hedge risks arising from trade accounts receivable<br />
and payable, and those pertaining to Group financing in US<br />
dollars.<br />
The interest rate hedging instruments are entered into in order<br />
to manage the interest rate risks arising from the fixedinterest<br />
bonds issued by <strong>Henkel</strong> <strong>AG</strong> & <strong>Co</strong>. <strong>KGaA</strong> and the floating<br />
interest bank liabilities (loans and overdrafts) entered into<br />
by <strong>Henkel</strong> of America, Inc. See also the following explanations<br />
relating to fair value hedges and cash flow hedges, and<br />
also with respect to the interest rate risk exposure of the<br />
<strong>Henkel</strong> Group.<br />
To a lesser extent, commodity derivatives are used to hedge<br />
uncertainties in future commodity price developments. See<br />
also the explanations relating to other price risks on page 138.<br />
Fair value hedges: A fair value hedge hedges the fair value of<br />
recognized assets and liabilities. The change in the fair value<br />
of the derivatives and the change in the fair value of the<br />
underlying relating to the hedged risk are simultaneously<br />
recognized in profit or loss.<br />
Receiver interest rate swaps are used to hedge the fair value risk<br />
of the fixedinterest bonds issued by <strong>Henkel</strong> <strong>AG</strong> & <strong>Co</strong>. <strong>KGaA</strong>.<br />
The fair value of these interest rate swaps is 199 million euros<br />
(previous year: 185 million euros) excluding accrued interest.<br />
The changes in fair value of the receiver interest rate swaps<br />
arising from market interest rate risks amounted to 14 million<br />
euros (previous year: 72 million euros). The corresponding<br />
changes in fair value of the hedged bonds amounted to<br />
–15 million euros (previous year: –69 million euros). In determining<br />
the fair value change in the bonds (see also Note 17 on<br />
page 126), only that portion is taken into account that<br />
relates to the interest rate risk.<br />
The following table provides an overview of the gains and losses<br />
arising from fair value hedges (valuation allowance made for<br />
the counterparty credit risk not included):<br />
Gains and losses from fair value hedges<br />
in million euros 2010 <strong>2011</strong><br />
Losses (–) from hedged items – 69 –15<br />
Gains (+) from hedging instruments 72 14<br />
Balance 3 –1<br />
Cash flow hedges: A cash flow hedge safeguards against the<br />
fluctuations in future cash flows from recognized assets and<br />
liabilities (in the case of interest rate risks), and also transactions<br />
that are either planned or highly probable, or firmly<br />
contracted unrecognized financial commitments, from<br />
which a currency risk arises. The effective portion of a cash<br />
flow hedge is recognized in the hedge reserve under equity.<br />
Ineffective portions arising from the change in value of the<br />
hedging instrument are recognized through profit or loss in<br />
the financial result. The gains and losses associated with the<br />
hedging measures initially remain in equity and are subsequently<br />
recognized through profit or loss in the period in<br />
which the hedged transaction influences the results for that<br />
period. If the hedging of a contracted item subsequently<br />
results in the recognition of a nonfinancial asset, the gains<br />
and losses recognized in equity are usually assigned to the<br />
asset on its addition (basis adjustment).
<strong>Henkel</strong> <strong>Annual</strong> <strong>Report</strong> <strong>2011</strong><br />
Cash flow hedges<br />
(after tax)<br />
Initial Addition Disposal End<br />
balance (recognized (recognized balance<br />
in equity) through pro-<br />
in million euros<br />
fit or loss)<br />
<strong>2011</strong> –351 4 – –347<br />
2010 – 276 – 75 – – 351<br />
The initial value of the cash flow hedges recognized in equity<br />
reflects firstly the fair values of the payer interest swaps used<br />
to hedge the cash flow risks arising from floatinginterest US<br />
dollar liabilities at <strong>Henkel</strong> of America, Inc., and secondly forward<br />
exchange contracts taken out in previous years in the<br />
course of the acquisition of the National Starch businesses.<br />
The addition in the amount of 4 million euros after taxes on<br />
income relates to the interest rate hedge of the US dollar<br />
liabilities of <strong>Henkel</strong> of America, Inc. The fair value of interest<br />
rate swaps for the US dollar liabilities of <strong>Henkel</strong> of America,<br />
Inc. amounts to –50 million euros (previous year: –69 million<br />
euros) excluding accrued interest. In the fiscal year under<br />
review, ineffective portions amounting to 0.2 million euros<br />
(previous year: 0.4 million euros) were recognized in profit or<br />
loss under financial result. The cash flows arising from hedging<br />
the floating interest rate of the US dollar liabilities of <strong>Henkel</strong><br />
of America, Inc. are expected in the period from 2012 to 2014<br />
and will be recognized through profit or loss in the periods<br />
concerned as interest expense. The hedged cash flows relating<br />
to the acquisition of the National Starch businesses will only<br />
be recognized in operating profit with disposal or in the<br />
event of an impairment loss on the goodwill attributable<br />
to the acquisition of these businesses.<br />
Hedges of a net investment in a foreign entity: The accounting<br />
treatment of hedges in a net investment in a foreign entity<br />
against translation risk is similar to that applied to cash flow<br />
hedges. The gain or loss arising from the effective portion<br />
of the hedging instrument is recognized in equity through<br />
other comprehensive income; the gain or loss of the ineffective<br />
portion is recognized directly through profit or loss. The gains<br />
or losses recognized directly in equity remain there until<br />
disposal or partial disposal of the net investment.<br />
The items recognized in equity relate to translation risks<br />
arising from net investments in Swiss francs (CHF) and US<br />
dollars (USD) for which the associated hedges were entered<br />
into and settled in previous years.<br />
<strong>Co</strong>nsolidated financial statements<br />
Notes to the consolidated statement of financial position<br />
In the past financial year, no hedges of a net investment in a<br />
foreign entity were entered into. No amounts were transferred<br />
in the course of the year from equity to profit or loss.<br />
Hedges of a net investment in a foreign entity<br />
(after tax)<br />
Initial Addition Disposal End<br />
balance (recognized (recognized balance<br />
in equity) through pro-<br />
in million euros<br />
fit or loss)<br />
<strong>2011</strong> 69 – – 69<br />
2010 53 16 – 69<br />
Risks arising from financial instruments, and risk management<br />
As a globally active corporation, <strong>Henkel</strong> is exposed in the<br />
course of its ordinary business operations to credit risks,<br />
liquidity risks and market risks (currency translation, interest<br />
rate and commodity price risks). The purpose of financial<br />
risk management is to restrict the exposure arising from<br />
operating activities through the use of selective derivative<br />
and nonderivative hedges. <strong>Henkel</strong> uses derivative financial<br />
instruments exclusively for the purposes of risk management.<br />
Without these instruments, <strong>Henkel</strong> would be exposed to<br />
higher financial risks. Changes in exchange rates, interest<br />
rates or commodity prices can lead to significant fluctuations<br />
in the fair values of the derivatives used. These variations in<br />
fair value should not be regarded in isolation from the hedged<br />
items, as derivatives and the underlying constitute a unit in<br />
terms of forex countervalue fluctuation.<br />
Management of currency, interest rate and liquidity risks is<br />
based on the treasury guidelines introduced by the Management<br />
Board, which are binding on the entire corporation. Defined<br />
in these are the targets, principles, accountability and competences<br />
of <strong>Co</strong>rporate Treasury. They describe the fields of<br />
responsibility and establish the distribution of these responsibilities<br />
between the <strong>Co</strong>rporate Treasury department and<br />
<strong>Henkel</strong>’s subsidiaries. The Management Board is regularly and<br />
comprehensively informed of all major risks and of all relevant<br />
hedging transactions and arrangements. The objectives<br />
and fundamental principles adopted in capital management<br />
are described in the Management <strong>Report</strong> on pages 62 and 63.<br />
There were no major risk clusters in the year under review.<br />
133
134 <strong>Co</strong>nsolidated financial statements<br />
Notes to the consolidated statement of financial position<br />
<strong>Henkel</strong> <strong>Annual</strong> <strong>Report</strong> <strong>2011</strong><br />
Credit risk<br />
In the course of business activities with third parties, the<br />
<strong>Henkel</strong> Group is exposed to global credit risk arising from<br />
both its operating business and its financial investments.<br />
This risk derives from the possibility of a contractual party<br />
not fulfilling its obligations.<br />
The maximum credit risk is represented by the carrying value<br />
of the financial assets recognized in the statement of financial<br />
position, as indicated in the following table:<br />
Maximum risk position<br />
in million euros 2010 <strong>2011</strong><br />
Trade accounts receivable<br />
Derivative financial instruments not included in a<br />
1,893 2,001<br />
designated hedging relationship<br />
Derivative financial instruments included in a<br />
83 8<br />
designated hedging relationship 248 256<br />
Other financial assets 591 730<br />
Cash and cash equivalents 1,515 1,980<br />
Total carrying values 4,330 4,975<br />
In its operating business, <strong>Henkel</strong> is confronted by progressive<br />
concentration and consolidation on the customer side,<br />
reflected in the receivables from individual customers.<br />
A credit risk management system operating on the basis of<br />
a globally applied credit policy ensures that credit risks are<br />
constantly monitored and bad debts minimized. This policy,<br />
which applies to both new and existing customers, governs<br />
the allocation of credit limits and compliance with those limits,<br />
individual analyses of customers’ creditworthiness based on<br />
both internal and external financial information, risk classi<br />
Age analysis of non-impaired overdue loans<br />
and receivables<br />
fication, and continuous monitoring of the risk of bad debts<br />
at the local level. Our key customer relationships are also<br />
monitored at the regional and global level. In addition, hedging<br />
measures are implemented on a selective basis for particular<br />
countries and customers inside and outside the euro zone.<br />
<strong>Co</strong>llateral received and other safeguards include countryspecific<br />
and customerspecific protection afforded by credit<br />
insurance, confirmed and unconfirmed letters of credit in<br />
the export business, as well as warranties, guarantees and<br />
cover notes.<br />
Valuation allowances are made in respect of financial assets<br />
so that those assets are recognized at their fair value as of<br />
the reporting date. In the case of impairment losses that have<br />
already occurred but have not yet been identified, global<br />
valuation allowances are made on the basis of empirical evidence,<br />
taking into account the overdue structure. Financial<br />
assets that are more than 180 days overdue are, following the<br />
impair ment test, generally written off.<br />
In all, we recognized individual valuation allowances on<br />
loans and receivables in <strong>2011</strong> in the amount of 35 million<br />
euros (previous year: 35 million euros) and global valuation<br />
allowances in the amount of 4 million euros (previous year:<br />
6 million euros).<br />
The carrying amount for loans and receivables, the term of<br />
which was renegotiated because they would have otherwise<br />
fallen overdue or been impaired, was 1 million euros (previous<br />
year: 0 million euros).<br />
Based on our experience, we do not expect the necessity to<br />
arise for any further valuation allowances, other than those<br />
described above, on nonoverdue, nonimpaired financial<br />
assets.<br />
Analysis<br />
Less than 30 to 60 61 to 90 91 to 180 Total<br />
in million euros<br />
30 days days days days<br />
At December 31, <strong>2011</strong> 130 35 14 2 181<br />
At December 31, 2010 96 28 10 3 137
<strong>Henkel</strong> <strong>Annual</strong> <strong>Report</strong> <strong>2011</strong><br />
Credit risks also arise from financial investments such as cash<br />
at bank, securities, time deposits and the positive fair value<br />
of derivatives. Such exposure is limited by our <strong>Co</strong>rporate<br />
Treasury specialists through selection of banks of good reputation<br />
with at least an “A” rating, and restriction of the amounts<br />
allocated to individual investments. In financial investments<br />
and derivatives trading with German and international<br />
banks, we only enter into transactions with counterparties<br />
of the highest financial standing. Financial investments are<br />
generally undertaken for periods of less than one year and are<br />
widely diversified between both different counterparties and<br />
also different investment types. To minimize the credit risk,<br />
netting arrangements are agreed with counter parties and<br />
investment limits are set. These limits are based on the credit<br />
rating of the counterparty and are regularly monitored and<br />
adjusted. Besides relevant ratings, certain other indicators<br />
such as the pricing of credit default swaps (CDS) by the banks<br />
are applied in determining the limits. We additionally enter<br />
into collateral agreements with selected banks, on the basis<br />
of which reciprocal sureties are established to hedge the fair<br />
values of contracted derivatives and other claims and obligations.<br />
Effective December 31, <strong>2011</strong>, the balance of collateral<br />
received from such banks and paid to such banks amounted<br />
to 70 million euros.<br />
<strong>Co</strong>nsolidated financial statements<br />
Notes to the consolidated statement of financial position<br />
Liquidity risk<br />
Liquidity risk is defined as the risk of an entity failing to<br />
meet its financial obligations at any given time.<br />
We minimize this risk by deploying longterm financing instruments<br />
in the form of bonds. In order to secure the financial<br />
flexibility of the <strong>Henkel</strong> Group at any time, the liquidity within<br />
the Group is extensively centralized and managed through<br />
the use of cash pools. We predominantly invest cash in financial<br />
assets traded in a liquid market in order to ensure that<br />
they can be sold at any time to procure liquid funds. In addition,<br />
the <strong>Henkel</strong> Group has at its disposal confirmed credit<br />
lines of 2.1 billion euros to ensure its liquidity and financial<br />
flexibility at all times. These credit lines were contracted to<br />
secure the commercial paper program and they have terms<br />
extending to 2012 and 2015. The individual subsidiaries of the<br />
<strong>Henkel</strong> Group additionally have at their disposal committed<br />
bilateral loans of 0.4 billion euros with a revolving term of up<br />
to one year. Our credit rating is regularly assessed by the<br />
rating agencies Standard & Poor’s and Moody’s.<br />
Our liquidity risk can therefore be regarded as very low.<br />
The maturity structure of the original and derivative financial<br />
liabilities within the scope of IFRS 7 based on cash flows<br />
is shown in the following table.<br />
Cash flows from financial liabilities<br />
December Up to<br />
Remaining term<br />
Between More than December<br />
31, 2010 1 year 1 and 5 years 31, 2010<br />
Carrying<br />
5 years<br />
Total<br />
in million euros<br />
amount<br />
cash flows<br />
Bonds 1 3,687 313 3,736 – 4,049<br />
<strong>Co</strong>mmercial papers 2 79 79 – – 79<br />
Liabilities to banks 335 240 100 2 342<br />
Trade accounts payable 2,308 2,308 – – 2,308<br />
Sundry financial instruments 3 66 62 4 – 66<br />
Original financial instruments 6,475 3,002 3,840 2 6,844<br />
Derivative financial instruments 159 119 41 – 160<br />
Total 6,634 3,121 3,881 2 7,004<br />
1 The cash flows from the hybrid bond issued in 2005 are disclosed for the period until the first possible redemption date by <strong>Henkel</strong> on November 25, 2015.<br />
2 From the euro and US dollar commercial paper program (total volume: 2.1 billion euros).<br />
3 Sundry financial instruments include amounts due from customers and finance bills. These prior-year figures have been adjusted (see “Recognition and<br />
measurement methods” on pages 108 and 109).<br />
135
136 <strong>Co</strong>nsolidated financial statements<br />
Notes to the consolidated statement of financial position<br />
<strong>Henkel</strong> <strong>Annual</strong> <strong>Report</strong> <strong>2011</strong><br />
Cash flows from financial liabilities<br />
December Up to<br />
Remaining term<br />
Between More than December<br />
31, <strong>2011</strong> 1 year 1 and 5 years 31, <strong>2011</strong><br />
Carrying<br />
5 years<br />
Total<br />
in million euros<br />
amount<br />
cash flows<br />
Bonds 1 3,670 284 3,644 – 3,928<br />
<strong>Co</strong>mmercial papers 2 29 29 – – 29<br />
Liabilities to banks 209 201 12 2 215<br />
Trade accounts payable 2,411 2,411 – – 2,411<br />
Sundry financial instruments 3 68 61 4 3 68<br />
Original financial instruments 6,387 2,986 3,660 5 6,651<br />
Derivative financial instruments 75 45 30 – 75<br />
Total 6,462 3,031 3,690 5 6,726<br />
1 The cash flows from the hybrid bond issued in 2005 are disclosed for the period until the first possible redemption date by <strong>Henkel</strong> on November 25, 2015.<br />
2 From the euro and US dollar commercial paper program (total volume: 2.1 billion euros).<br />
3 Sundry financial instruments include amounts due from customers and finance bills.<br />
Market risk<br />
Market risks exist where the fair value or future cash flows<br />
of a financial instrument may fluctuate due to changes in<br />
market prices. Market risks primarily take the form of currency<br />
risk, interest rate risk and various price risks (particularly<br />
the commodity price risk).<br />
The <strong>Co</strong>rporate Treasury department manages currency exposure<br />
and interest rates centrally for the Group and is therefore<br />
responsible for all transactions with financial derivatives<br />
and other financial instruments. Trading, Treasury <strong>Co</strong>ntrolling<br />
and Settlement (front, middle and back offices) are separated<br />
both physically and in terms of organization. The parties<br />
to the contracts are German and international banks<br />
which <strong>Henkel</strong> monitors regularly, in accordance with <strong>Co</strong>rporate<br />
Treasury guidelines, for creditworthiness and the quality<br />
of their quotations. Financial derivatives are used to manage<br />
currency exposure and interest rate risks in connection with<br />
operating activities and the resultant financing requirements,<br />
again in accordance with the Treasury guidelines. Financial<br />
derivatives are entered into exclusively for hedging purposes.<br />
The currency and interest rate risk management of the Group<br />
is supported by an integrated treasury system which is used to<br />
identify, measure and analyze the Group’s currency exposure<br />
and interest rate risks. In this context, “integrated” means<br />
that the entire process from the initial recording of financial<br />
transactions to their entry in the accounts is covered. Much<br />
of the currency trading takes place on internetbased, multibank<br />
dealing platforms. These foreign currency transactions<br />
are automatically transferred into the treasury system. The<br />
currency exposure and interest rate risks reported by all subsidiaries<br />
under standardized reporting procedures are integrated<br />
into the treasury system by data transfer. As a result,<br />
it is possible to retrieve and measure at any time all currency<br />
and interest rate risks across the Group and all derivatives<br />
entered into to hedge the exposure to these risks. The treasury<br />
system supports the use of various risk concepts.<br />
Market risk is monitored on the basis of sensitivity analyses<br />
and valueatrisk computations. Sensitivity analyses enable<br />
estimation of potential losses, future gains, fair values or<br />
cash flows of instruments susceptible to market risks arising<br />
from one or several selected hypothetical changes in foreign<br />
exchange rates, interest rates, commodity prices or other<br />
relevant market rates or prices over a specific period. Sensitivity<br />
analyses are used in the <strong>Henkel</strong> Group because they<br />
enable reasonable risk assessments to be made on the basis of<br />
direct assumptions (e.g. an increase in interest rates). Valueatrisk<br />
computations reveal the maximum potential future<br />
loss of a certain portfolio over a given period that, based on a<br />
specified probability level, will not be exceeded.<br />
Currency risk<br />
The global nature of our business activities results in a huge<br />
number of cash flows in different currencies. The resultant<br />
currency risk breaks down into two categories, namely<br />
transaction and translation risks.<br />
Transaction risks arise from possible exchange rate fluctuations<br />
causing changes in the value of future foreign currency<br />
cash flows. The hedging of the resultant exchange rate risks<br />
forms a major part of our central risk management activity.<br />
Transaction risks arising from our operating business are<br />
partially avoided by the fact that we largely manufacture our<br />
products in those countries in which they are sold. Residual<br />
transaction risks on the operating side are proactively<br />
managed by <strong>Co</strong>rporate Treasury. This includes the ongoing<br />
assessment of specific currency risk and the development of<br />
appropriate hedging strategies. The objective of our currency<br />
hedging is to fix prices based on hedging rates so that we are<br />
protected from future adverse fluctuations in exchange rates.
<strong>Henkel</strong> <strong>Annual</strong> <strong>Report</strong> <strong>2011</strong><br />
Because we limit our potential losses, any negative impact<br />
on profits is restricted. The transaction risk arising from<br />
major financial payables and receivables is, for the most part,<br />
hedged. In order to manage these risks, we primarily utilize<br />
forward exchange contracts and currency swaps. To avoid<br />
complexity and given the costs and benefits involved, we do<br />
not apply hedge accounting for the derivatives employed. The<br />
derivatives are designated as held for trading and are recognized<br />
at fair value through profit or loss. The currency risk<br />
that exists within the Group in the form of transaction risk<br />
therefore has a direct effect on income rather than being<br />
recognized in equity.<br />
The valueatrisk pertaining to the transaction risk of the<br />
<strong>Henkel</strong> Group as of December 31, <strong>2011</strong> amounted to 16 million<br />
euros after hedging (previous year: 17 million euros). The<br />
valueatrisk shown represents the maximum expected risk<br />
of loss in a month as a result of currency fluctuations. The<br />
risk arises from imports and exports by <strong>Henkel</strong> <strong>AG</strong> & <strong>Co</strong>.<br />
<strong>KGaA</strong> and its foreign subsidiaries. Due to the international<br />
nature of its activities, the <strong>Henkel</strong> Group has a portfolio with<br />
more than 50 different currencies. In addition to the US<br />
dollar, the main influence on currency risk is exerted by the<br />
Russian ruble, the Mexican peso, the Turkish lira, the Canadian<br />
dollar and the Japanese yen. The valueatrisk analysis assumes<br />
a time horizon of one month and a unilateral confidence<br />
interval of 95 percent. The calculation is based on the<br />
variancecovariance approach. Fluctuations and correlations<br />
are determined using historical data. The valueatrisk analysis<br />
is based on the operating book positions and budgeted<br />
positions in foreign currency, with a forecasting horizon<br />
of up to twelve months.<br />
Translation risks emanate from changes caused by foreign<br />
exchange fluctuations to items on the statement of financial<br />
position and the income statement of a subsidiary, and the<br />
effect these changes have on the translation of individual<br />
company financial statements into Group currency. However,<br />
unlike transaction risk, translation risk does not necessarily<br />
impact future cash flows. The Group’s equity reflects the<br />
changes in carrying value resulting from foreign exchange<br />
influences. The risks arising from the translation of the<br />
earnings results of subsidiaries in foreign currencies and<br />
from net investments in foreign entities are only hedged in<br />
exceptional cases.<br />
<strong>Co</strong>nsolidated financial statements<br />
Notes to the consolidated statement of financial position<br />
Interest rate risk<br />
The interest rate risk encompasses those potentially positive<br />
or negative influences on profits, equity or cash flow in current<br />
or future reporting periods arising from changes in interest<br />
rates. In the case of fixedinterest financial instruments,<br />
changing capital market interest rates result in a fair value<br />
risk, as the attributable fair values fluctuate depending on<br />
capital market interest rates. In the case of floatinginterest<br />
financial instruments, a cash flow risk exists because the<br />
interest payments may be subject to future fluctuations.<br />
The <strong>Henkel</strong> Group obtains and invests the majority of the cash<br />
it requires from the international money and capital markets.<br />
The resulting financial liabilities and our cash deposits may<br />
be exposed to the risk of changes in interest rates. The aim of<br />
our centralized interest rate management system is to manage<br />
this risk by selecting appropriate maturities and through the<br />
use of derivative financial instruments. Only those derivative<br />
financial instruments that can be modeled, monitored and<br />
assessed in the risk management system may be used to hedge<br />
the interest rate risk.<br />
<strong>Henkel</strong>’s interest management strategy is essentially aligned<br />
to optimizing the net interest result for the Group. The decisions<br />
taken in interest management relate to the bonds issued to<br />
secure Group liquidity, and other financial instruments. The<br />
financial instruments and interest rate derivatives exposed to<br />
interest rate risk are denominated in euros and US dollars.<br />
Depending on forecasts with respect to interest rate developments,<br />
<strong>Henkel</strong> enters into derivative financial instruments,<br />
primarily interest rate swaps, in order to optimize the interest<br />
rate lockdown structure. The coupon interest on the eurodenominated<br />
bonds issued by <strong>Henkel</strong> has been converted from<br />
fixed to floating with the aid of interest rate swaps. In the<br />
event of an expected rise in interest rate levels, <strong>Henkel</strong> protects<br />
its positions by transacting additional interest rate caps<br />
and forward rate agreements as an effective means of guarding<br />
against interest rates rising over the short term. A major<br />
portion of the financing of <strong>Henkel</strong> of America, Inc. in US dollars<br />
has been converted from floating to fixed interest rates<br />
through interest rate swaps. As a result, the net interest<br />
position comprises a structured mix of fixed US dollar and<br />
floating euro interest rates.<br />
137
138 <strong>Co</strong>nsolidated financial statements<br />
Notes to the consolidated statement of financial position<br />
<strong>Henkel</strong> <strong>Annual</strong> <strong>Report</strong> <strong>2011</strong><br />
Our exposure to interest rate risk at the reporting dates 2010<br />
and <strong>2011</strong> was as follows:<br />
Interest rate exposure<br />
Carrying amounts<br />
in million euros<br />
Fixed-interest financial instruments<br />
2010 <strong>2011</strong><br />
Euro – –<br />
US dollar 1,497 1,237<br />
Others – –<br />
1,497 1,237<br />
Floating-interest financial instruments<br />
Euro 337 170<br />
US dollar 202 212<br />
Others –33 –304<br />
506 78<br />
The calculation of the interest rate risk is based on sensitivity<br />
analyses. The analysis of cash flow risk examines all the<br />
main financial instruments which bear interest at a variable<br />
rate at the statement of financial position date. Securities,<br />
time deposits, fixedinterest instruments and interest hedging<br />
instruments are deducted from net borrowings. The interest<br />
rate risk figures shown in the table are based on this calculation<br />
at the relevant reporting date, assuming a parallel shift<br />
in the interest curve of 100 basis points. The analysis of fair<br />
value risk also assumes a parallel shift in the interest curve<br />
of 100 basis points, with the hypothetical loss or gain of the<br />
relevant interest rate derivatives at the reporting date being<br />
calculated accordingly. The fixedinterest financial instruments<br />
exposed to fair value risk are essentially the fixed interest<br />
rate bank liabilities denominated in US dollars.<br />
The risk of interest rate fluctuations with respect to the earnings<br />
of the <strong>Henkel</strong> Group is shown in the basis point value<br />
(BPV) analysis in the table below.<br />
Interest rate risk<br />
in million euros<br />
Based on an interest rate rise<br />
2010 <strong>2011</strong><br />
of 100 basis points<br />
of which:<br />
52 27<br />
Cash flow through profit and loss<br />
Fair value recognized in equity through<br />
10 5<br />
comprehensive income<br />
42<br />
22<br />
Other price risks (commodity price risk)<br />
Uncertainty with respect to raw material price development<br />
impacts Group business. Purchase prices for raw materials<br />
can affect the net assets, financial position and results of<br />
operations of the corporation. The risk management strategy<br />
put in place by the Group management for safeguarding<br />
against the procurement market risk is described in more<br />
detail in the risk report on pages 89 and 90.<br />
As a small part of the risk management strategy, cashsettled<br />
commodity futures are entered into on the basis of forecasted<br />
purchasing requirements in order to hedge future uncertainties<br />
with respect to commodity prices. Cashsettled commodity<br />
derivatives are only used at <strong>Henkel</strong> where there is a direct<br />
relationship between the hedging derivative and the physical<br />
underlying. <strong>Henkel</strong> does not practice hedge accounting and<br />
is therefore exposed to temporary price risks when holding<br />
commodity derivatives. Such price risks arise due to the fact<br />
that the commodity derivatives are measured at fair value<br />
whereas the purchasing requirement, as a pending transaction,<br />
is not measured or recognized. This can lead to losses being<br />
recognized in profit or loss and equity. Developments in fair<br />
values and the resultant risks are continuously monitored.<br />
The influence of negative commodity price developments on<br />
the valuation of the derivatives employed is immaterial to the<br />
financial position of the <strong>Henkel</strong> Group due to the low volume<br />
of derivatives used. In the event of a change in commodity<br />
prices of 10 percent, the resultant loss would be less than<br />
1 million euros.
<strong>Henkel</strong> <strong>Annual</strong> <strong>Report</strong> <strong>2011</strong><br />
Notes to the consolidated statement of income<br />
(22) Sale proceeds and principles of income realization<br />
Sales increased from 15,092 million euros to 15,605 million<br />
euros.<br />
Revenues and their development by business sector and region<br />
are summarized in the Group segment report and in the key<br />
financials by region on pages 103 and 104. A detailed explanation<br />
of the development of major income and expense<br />
items can be found in the management report on pages 58<br />
and 59.<br />
Sales comprise sales of goods and services less sales deductions<br />
such as customer-related rebates, credits and other benefits<br />
paid or granted. Sales are recognized once the goods have been<br />
delivered or the service has been performed. In the case of<br />
goods, this coincides with the physical delivery and transfer<br />
of risks and rewards. <strong>Henkel</strong> uses different terms of delivery<br />
determining the transfer of risks and rewards. It must also<br />
be probable that the economic benefits associated with the<br />
transaction will flow to the Group, and the costs incurred in<br />
respect of the transaction must be reliably measurable.<br />
Services are generally provided in conjunction with the sale<br />
of goods, and recorded once the service has been performed.<br />
No sale is recognized if there are significant risks relating to<br />
the receipt of the consideration or it is likely that the goods<br />
will be returned.<br />
Interest income is recognized on a time-proportion basis that<br />
takes into account the effective yield on the asset and the inte rest<br />
rate in force. Dividend income from investments is recognized<br />
when the shareholder’s right to receive payment is legally<br />
established.<br />
(23) <strong>Co</strong>st of sales<br />
The cost of sales rose from 8,078 million euros to 8,538 million<br />
euros.<br />
<strong>Co</strong>st of sales comprises the cost of products and services sold<br />
and the purchase cost of merchandise sold. It consists of the<br />
directly attributable cost of materials and primary production<br />
cost, as well as indirect production overheads including the<br />
production-related amortization and depreciation of intangible<br />
assets and property, plant and equipment.<br />
(24) Marketing, selling and distribution expenses<br />
Marketing, selling and distribution expenses amounted to<br />
4,132 million euros (previous year: 4,257 million euros).<br />
In addition to marketing organization and distribution expenses,<br />
this item comprises, in particular, advertising, sales<br />
promotion and market research expenses. Also included here<br />
are the expenses of technical advisory services for customers,<br />
and valuation allowances on trade accounts receivable.<br />
(25) Research and development expenses<br />
Research and development expenses rose compared to the<br />
previous year by 19 million euros to 410 million euros.<br />
Research expenditures may not be recognized as an asset.<br />
Develop ment expenditures are recognized as an asset if all the<br />
criteria for recognition are met, the research phase can be<br />
clearly distinguished from the development phase and the<br />
expenditures can be attributed to distinct project phases.<br />
Currently, the criteria set out in IAS 38 “Intangible Assets” for<br />
recognizing development expenditures are not all being met,<br />
due to a high level of interdependence within the development<br />
projects and the difficulty of assessing which products will<br />
eventually be marketable.<br />
(26) Administrative expenses<br />
Administrative expenses amounted to 785 million euros<br />
(previous year: 750 million euros).<br />
Administrative expenses include personnel and non-personnel<br />
costs of Group management and costs relating to the Human<br />
Resources, Purchasing, Accounting and IT departments.<br />
(27) Other operating income<br />
Other operating income<br />
<strong>Co</strong>nsolidated financial statements<br />
Notes to the consolidated statement of income<br />
in million euros 2010 <strong>2011</strong><br />
Release of provisions 1 68 37<br />
Gains on disposal of non-current assets 19 15<br />
Insurance claim payouts 12 7<br />
Write-ups of non-current assets<br />
Release of valuation allowances for<br />
6 1<br />
bad debts<br />
3 2<br />
Profits on sale of businesses 3 62<br />
Sundry operating income 105 85<br />
Total 216 209<br />
1 Including income from the release of provisions for pension obligations<br />
(curtailment gains) of 3 million euros (previous year: 18 million euros).<br />
Sundry operating income relates to a number of individual<br />
items arising from ordinary operating activities, such as<br />
rent income, grants and subsidies, bonus credits and similar<br />
income.<br />
139
140 <strong>Co</strong>nsolidated financial statements<br />
Notes to the consolidated statement of income<br />
<strong>Henkel</strong> <strong>Annual</strong> <strong>Report</strong> <strong>2011</strong><br />
(28) Other operating charges<br />
Other operating charges<br />
in million euros 2010 <strong>2011</strong><br />
Losses on disposal of non-current assets 14 9<br />
Goodwill impairment losses 6 –<br />
Write-downs on assets held for sale – 2<br />
Write-downs on other assets 1 5<br />
Sundry operating expenses 88 76<br />
Total 109 92<br />
Sundry operating expenses relate to a number of individual<br />
items arising from ordinary operating activities, such as<br />
contractual termination severance payments, compensation<br />
settlements and similar expenses.<br />
(29) Financial result<br />
Financial result<br />
in million euros 2010 <strong>2011</strong><br />
Investment result 1 –<br />
Interest result – 172 –155<br />
Total – 171 –155<br />
Investment result<br />
in million euros 2010 <strong>2011</strong><br />
Income from other investments – –<br />
Other 1 –<br />
Total 1 –<br />
Interest result<br />
in million euros 2010 <strong>2011</strong><br />
Interest and similar income from third parties 1<br />
Expected return on plan assets less interest<br />
17 34<br />
expense for pension provisions 2<br />
Expected return on reimbursement rights<br />
– 1<br />
(IAS 19) 6 3 4<br />
Other financial income 2 6<br />
Total interest income 25 45<br />
Interest to third parties 1 – 134 3 –145<br />
Other financial charges<br />
Interest expense for pension provisions less<br />
– 47 –55<br />
expected return on plan assets 2<br />
– 16 3 –<br />
Total interest expense – 197 –200<br />
Total – 172 –155<br />
1 Including interest income and interest expense, both in the amount of<br />
41 million euros (previous year: 39 million euros), in respect of mutually<br />
offset deposits and liabilities to banks, reported on a net basis.<br />
2 Interest expense of 179 million euros and expected interest income of<br />
180 million euros (previous year: interest expense of 187 million euros and<br />
expected interest income of 171 million euros).<br />
3 Prior-year figures adjusted (see “Recognition and measurement methods”<br />
on pages 108 and 109).<br />
An overview on the net results by measurement category<br />
(IFRS 7) and a reconciliation to the financial result is provided<br />
on page 130 in Note 21 “Financial instruments report.”<br />
(30) Taxes on income<br />
Earnings before taxes on income and analysis of taxes<br />
in million euros 2010 <strong>2011</strong><br />
Earnings before tax 1,552 1,702<br />
Current taxes 424 384<br />
Deferred taxes – 15 35<br />
Taxes on income 409 419<br />
Tax rate in percent 26.4% 24.6%<br />
Main components of tax expense and income<br />
in million euros 2010 <strong>2011</strong><br />
Current tax expense/income in the reporting year 432 455<br />
Current tax adjustments for prior years<br />
Deferred tax expense/income from temporary<br />
– 8 –71<br />
differences<br />
Deferred tax expense/income from unused tax<br />
– 25 14<br />
losses 38 22<br />
Deferred tax expense/income from tax credits<br />
Deferred tax expense/income from changes in<br />
3 2<br />
tax rates<br />
Increase/decrease in valuation allowances on<br />
6 –5<br />
deferred tax assets – 37 2<br />
In accordance with IAS 12, deferred tax assets and liabilities<br />
are recognized with respect to temporary differences between<br />
the statement of financial position valuation of an asset or<br />
liability and its tax base, unused tax losses and tax credits.<br />
Deferred taxes are calculated on the basis of the tax rates that<br />
are applicable or anticipated in the individual countries at the<br />
time of realization or utilization. In Germany there is a uniform<br />
corporate income tax rate of 15 percent plus a solidarity<br />
tax of 5.5 percent. After taking into account trade tax, this<br />
yields an overall tax rate of 31 percent.<br />
Deferred tax assets are recognized where it is likely that<br />
sufficient taxable income will be generated in future to realize<br />
the corresponding benefit.<br />
Deferred tax assets and liabilities are netted where they<br />
involve the same tax authority and the same tax creditor.<br />
The deferred tax assets and liabilities stated at December 31,<br />
<strong>2011</strong> relate to the following items of the consolidated statement<br />
of financial position, unused tax losses and tax credits:
<strong>Henkel</strong> <strong>Annual</strong> <strong>Report</strong> <strong>2011</strong><br />
Allocation of deferred taxes<br />
in million euros<br />
Deferred tax assets Deferred tax liabilities<br />
December 31,<br />
2010<br />
December 31,<br />
<strong>2011</strong><br />
December 31,<br />
2010<br />
December 31,<br />
<strong>2011</strong><br />
Intangible assets 122 99 669 674<br />
Property, plant and equipment 23 19 86 87<br />
Financial assets 1 2 7 7<br />
Inventories 41 39 5 5<br />
Other receivables and other assets 63 63 143 108<br />
Special tax-allowable items – – 49 46<br />
Provisions 409 522 6 8<br />
Liabilities 188 144 11 12<br />
Tax credits 11 9 – –<br />
Unused tax losses 106 52 – –<br />
964 949 976 947<br />
Amounts netted – 560 –466 – 560 –466<br />
Valuation allowances – 46 –18 – –<br />
Financial statement figures 358 465 416 481<br />
The deferred tax assets amounting to 522 million euros (previous<br />
year: 409 million euros) relating to provisions in the<br />
financial statement result primarily from recognition and<br />
measurement differences with respect to pensions and similar<br />
obligations.<br />
The deferred tax liabilities amounting to 674 million euros<br />
(previous year: 669 million euros) relating to intangible assets<br />
are chiefly attributable to business combinations such as the<br />
acquisition of the National Starch businesses in 2008.<br />
Deferred taxes have not been recognized with respect to unused<br />
tax losses of 58 million euros (previous year: 144 mil-<br />
Expiry dates of unused tax losses and tax credits<br />
<strong>Co</strong>nsolidated financial statements<br />
Notes to the consolidated statement of income<br />
lion euros), as it is not sufficiently probable that taxable gains<br />
or benefits will be available against which they may be utilized.<br />
Of these tax losses carried forward, 6 million euros lapse<br />
within one year, 4 million euros within two years, 2 million<br />
euros within three years, 24 million euros after three years,<br />
with 22 million euros non-expiring.<br />
The table below summarizes the expiry dates of unused tax<br />
losses and tax credits. This table includes unused tax losses<br />
arising from the disposal of assets of 12 million euros<br />
(previous year: 13 million euros) which may be carried forward<br />
without restriction. In many countries, different tax rates<br />
apply to losses on the disposal of assets and to operating profits,<br />
and in some cases losses on the disposal of assets may only<br />
be offset against gains on the disposal of assets.<br />
Unused tax losses Tax credits<br />
December 31, December 31, December 31, December 31,<br />
in million euros<br />
Lapse within<br />
2010<br />
<strong>2011</strong><br />
2010<br />
<strong>2011</strong><br />
1 year 10 9 – –<br />
2 years 23 5 – –<br />
3 years 19 14 – –<br />
more than 3 years 364 254 11 9<br />
May be carried forward without restriction 167 104 – –<br />
Total 583 386 11 9<br />
141
142 <strong>Co</strong>nsolidated financial statements<br />
Notes to the consolidated statement of income<br />
<strong>Henkel</strong> <strong>Annual</strong> <strong>Report</strong> <strong>2011</strong><br />
Of unused tax losses lapsing beyond three years, 202 million<br />
euros (previous year: 222 million euros) relate to loss carryforwards<br />
of US subsidiaries in respect of state taxes (tax rate<br />
about 5 percent).<br />
Equity-increasing deferred taxes of 91 million euros were<br />
recognized in <strong>2011</strong> (previous year: equity-reducing amount<br />
of 33 million euros). Within this figure, 94 million euros is a<br />
net actuarial gain on pension obligations, this being offset by<br />
3 million euros in net loss from cash flow hedges.<br />
The individual company reports – prepared on the basis of<br />
the tax rates applicable in each country and taking into account<br />
consolidation procedures – have been summarized in the<br />
statement below, showing how the estimated tax charge, based<br />
on the tax rate applicable to <strong>Henkel</strong> <strong>AG</strong> & <strong>Co</strong>. <strong>KGaA</strong> of 31 percent,<br />
is reconciled to the effective tax charge disclosed.<br />
Tax reconciliation statement<br />
in million euros 2010 <strong>2011</strong><br />
Income before taxes on income<br />
Tax rate (including municipal trade tax)<br />
1,552 1,702<br />
on income of <strong>Henkel</strong> <strong>AG</strong> & <strong>Co</strong>. <strong>KGaA</strong> 31 % 31 %<br />
Estimated tax charge 481 528<br />
Tax reductions due to differing tax rates abroad – 64 –64<br />
Tax increases/reductions for prior years<br />
Tax increases/reductions<br />
9 –61<br />
due to changes in tax rates<br />
Tax increases/reductions due to the recognition<br />
of deferred tax assets relating to unused tax losses<br />
6 –5<br />
and temporary differences<br />
Tax reductions due to tax-free income<br />
– 37 2<br />
and other items – 46 –49<br />
Tax increases due to non-deductible expenses<br />
of which<br />
Non-deductible write-downs<br />
60 68<br />
on intangible assets<br />
Taxation effects arising from additions and<br />
2 –<br />
reductions for local taxes<br />
Non-deductible and non-offsettable<br />
15 18<br />
withholding tax 12 20<br />
Other non-deductible expenses 31 30<br />
Tax charge disclosed 409 419<br />
Effective tax rate 26.4 % 24.6 %<br />
The decrease in the effective tax rate in <strong>2011</strong> to 24.6 percent<br />
(previous year: 26.4 percent) is primarily due to the successful<br />
conclusion of appeal proceedings and of transfer price<br />
negotiations between – among others – Germany and France,<br />
which had a beneficial effect on ongoing tax audits in a number<br />
of countries.<br />
Deferred tax liabilities relating to the retained earnings of<br />
foreign subsidiaries have not been calculated due to the fact<br />
that these earnings are available to the entities concerned for<br />
their own use.<br />
(31) Non-controlling interests<br />
The amount shown here represents the proportion of net<br />
income and losses attributable to other shareholders of affiliated<br />
companies.<br />
Their share of net income was 33 million euros (previous<br />
year: 31 million euros) and that of losses 3 million euros<br />
(previous year: 6 million euros).
<strong>Henkel</strong> <strong>Annual</strong> <strong>Report</strong> <strong>2011</strong><br />
Other disclosures<br />
(32) Payroll cost<br />
Payroll cost 1<br />
in million euros 2010 <strong>2011</strong><br />
Wages and salaries 2,012 2,052<br />
Social security contributions and<br />
staff welfare costs<br />
331 336<br />
Pension costs 144 134<br />
Total 2,487 2,522<br />
1 Excluding personnel-related restructuring charges of<br />
140 million euros (previous year: 128 million euros).<br />
Share-based payment plans<br />
The objective of the <strong>Henkel</strong> Stock Incentive Plan introduced<br />
in the year 2000 is to provide additional motivation for about<br />
700 senior executive personnel around the world. Participants<br />
in the plan are granted option rights to subscribe for <strong>Henkel</strong><br />
preferred shares, which may be exercised for the first time<br />
once a vesting period of three years has elapsed. The exercise<br />
of rights must be within a period not exceeding five years<br />
after completion of the vesting period. Under the plan, rights<br />
were issued annually on a revolving basis, the relevant terms<br />
being revised each year by the Management Board and Shareholders’<br />
<strong>Co</strong>mmittee. In 2004, options were issued for the last<br />
time, in this case to the members of the Management Board.<br />
Each option granted originally carried the right to acquire up<br />
to eight <strong>Henkel</strong> preferred shares. After the 1:3 share split on<br />
June 18, 2007, the number of preferred shares per option right<br />
was trebled. The exact number of shares that can be bought<br />
per option at a specific price depends on the extent to which<br />
the performance targets are met. One target is based on absolute<br />
performance – the performance of the <strong>Henkel</strong> preferred<br />
share price. The other takes into account relative performance,<br />
comparing the movement in value of the <strong>Henkel</strong> preferred<br />
share with that of the Dow Jones Euro Stoxx (600) index. For<br />
both performance targets, the average market price of the<br />
<strong>Henkel</strong> preferred share at the date of issue is compared to the<br />
average market price three years later. The average market<br />
price is calculated in each case on the basis of 20 stock exchange<br />
trading days after the <strong>Annual</strong> General Meeting. The<br />
calculation of relative performance takes account of dividend<br />
<strong>Co</strong>nsolidated financial statements<br />
Other disclosures<br />
payments and other rights and benefits as well as movements<br />
in the share price (total shareholder return). The subscription<br />
rights attached to an option are split into two categories.<br />
Taking the share split into account, up to 15 subscription<br />
rights can be exercised by reference to the absolute performance<br />
and up to nine subscription rights by reference to<br />
the relative performance.<br />
Option rights are granted to members of the Management<br />
Board and corporate senior vice presidents, and to managers<br />
of comparable status within German and foreign affiliated<br />
companies, on condition that they make a direct investment<br />
of three preferred shares for each option right.<br />
The total value of stock options granted to senior executive<br />
personnel at the grant date is determined using an option<br />
pricing model. The total value of the stock options calculated<br />
in this way is treated as a payroll cost spread over the period<br />
in which the corporation receives the service of the employee.<br />
For financial years since 2005, this cost in respect of the<br />
option rights granted in 2003 (tranche 4) and 2004 (tranche 5)<br />
is required to be expensed.<br />
The table shows the number of option rights granted per<br />
tranche and the number of shares in the various tranches,<br />
taking into account the 1:3 share split of June 18, 2007. The<br />
vesting period has now expired for all the tranches. Because<br />
the exercise period for the fourth tranche expired on May 11,<br />
<strong>2011</strong>, option rights that were not exercised have lapsed.<br />
In 2004 for the fourth tranche and in 2007 for the fifth<br />
tranche, the Management Board decided to avail itself of the<br />
right to pay in cash the gain arising on the exercise of the<br />
options to the employees participating in the plan. The fifth<br />
tranche is treated as if it had been paid in shares.<br />
143
144 <strong>Co</strong>nsolidated financial statements<br />
Other disclosures<br />
<strong>Henkel</strong> <strong>Annual</strong> <strong>Report</strong> <strong>2011</strong><br />
Option rights / Subscribable preferred shares<br />
in number of shares/options 4th tranche 5th tranche Total<br />
At January 1, <strong>2011</strong> 21,056 7,200 28,256<br />
expressed in preferred shares 315,845 151,200 467,045<br />
Options granted – – –<br />
expressed in preferred shares – – –<br />
Options exercised 1 12,986 2,648 15,634<br />
expressed in preferred shares 194,795 55,600 250,395<br />
Options forfeited 210 – 210<br />
expressed in preferred shares 3,150 – 3,150<br />
Lapsed options 7,860 – 7,860<br />
expressed in preferred shares 117,900 – 117,900<br />
At December 31, <strong>2011</strong> – 4,552 4,552<br />
expressed in preferred shares – 95,600 95,600<br />
1 Average price at exercise date: 46.68 euros.<br />
At December 31, 2010, there was a provision of 8.3 million<br />
euros for the fourth tranche, of which 5.2 million euros was<br />
used in fiscal <strong>2011</strong>. The amount released of 3.1 million euros<br />
increased earnings for the period.<br />
The costs are calculated using the Black-Scholes option<br />
pricing model, modified to reflect the special features of the<br />
Stock Incentive Plan. The cost calculation was based on the<br />
following factors:<br />
Black-Scholes option pricing model<br />
Exercise price (before share split) in euros<br />
On issue<br />
5th tranche<br />
71.28<br />
Exercise price (after share split)<br />
Expected volatility of the preferred<br />
in euros 23.76<br />
share price in % 26.6<br />
Expected volatility of the index in % 18.6<br />
Expected forfeiture rate in % –<br />
Risk-free interest rate in % 3.96<br />
The expected volatility rates are based on the historic volatility<br />
of the <strong>Henkel</strong> preferred share and of the Dow Jones Euro<br />
Stoxx (600) index. The period to which the estimate of the<br />
volatility of the <strong>Henkel</strong> share relates starts at the beginning<br />
of the remaining term of the option tranche and finishes on<br />
the date on which the tranche is valued.<br />
The performance period relating to the fourth tranche ended<br />
on May 11, 2006, and that of the fifth tranche on May 15, 2007.<br />
Thereafter, at any time during a five-year period, the beneficiaries<br />
of the fourth tranche were able to exercise their right<br />
to acquire 15 <strong>Henkel</strong> preferred shares per option, and in the<br />
case of the fifth tranche 21 shares per option. The allocation<br />
for the fourth tranche was based exclusively on absolute performance.<br />
The allocation for the fifth tranche was 15 shares<br />
as a result of absolute performance and six shares as a result<br />
of relative performance. The option rights for the fourth<br />
tranche lapsed on May 11, <strong>2011</strong> as per the prescribed deadline.<br />
The outstanding option rights for tranche five may be exercised<br />
at any time, except during blocked periods which in<br />
each case cover the four weeks prior to the reporting dates<br />
of the corporation.<br />
Global Cash Performance Units (CPU) Plan<br />
Since the end of the Stock Incentive Plan, those eligible for<br />
that plan, the senior executive personnel of the <strong>Henkel</strong> Group<br />
(excluding members of the Management Board) have, since<br />
2004, been part of the Global CPU Plan, which enables them<br />
to participate in any increase in price of the <strong>Henkel</strong> preferred<br />
share. Cash Performance Units (CPUs) are awarded on the<br />
basis of the level of achievement of certain defined targets.<br />
They grant the beneficiary the right to receive a cash payment<br />
at a fixed point in time. The CPUs are granted on condition<br />
that the member of the Plan is employed for three years by<br />
<strong>Henkel</strong> <strong>AG</strong> & <strong>Co</strong>. <strong>KGaA</strong> or one of its subsidiaries in a position<br />
senior enough to qualify to participate and that he or she is<br />
not under notice during that period. This minimum period of<br />
employment pertains to the calendar year in which the CPUs<br />
are granted and the two subsequent calendar years.
<strong>Henkel</strong> <strong>Annual</strong> <strong>Report</strong> <strong>2011</strong><br />
The number of CPUs granted depends not only on the seniority<br />
of the officer, but also on the achievement of set target<br />
figures. For the periods to date, these targets have been operating<br />
profit (EBIT) and net income attributable to shareholders<br />
of <strong>Henkel</strong> <strong>AG</strong> & <strong>Co</strong>. <strong>KGaA</strong>. The value of a CPU in each case<br />
is the average price of the <strong>Henkel</strong> preferred share as quoted<br />
20 stock exchange trading days after the <strong>Annual</strong> General<br />
Meeting following the performance period. In the case of<br />
exceptional increases in the share price, there is an upper<br />
limit or cap. After the 1:3 share split of June 18, 2007, the<br />
number of CPUs was trebled.<br />
The total value of CPUs granted to senior management personnel<br />
is remeasured at each year-end and treated as a payroll<br />
cost over the period in which the plan member provides<br />
their services to <strong>Henkel</strong>. The fifth tranche, which was issued<br />
in 2008, became due for payment in July <strong>2011</strong>. Across the<br />
world, at December 31, <strong>2011</strong>, the CPU Plan comprised<br />
400,498 CPUs issued in the sixth tranche in 2009 (expense:<br />
6.0 million euros), 551,718 CPUs from the seventh tranche<br />
issued in 2010 (expense: 8.2 million euros) and 456,754 CPUs<br />
from the eighth tranche issued in the reporting year<br />
(expense: 6.8 million euros). The corresponding provision<br />
amounted to 41.0 million euros (previous year: 32.5 million<br />
euros).<br />
Cash Performance Units Program<br />
Effective fiscal 2010, the compensation system for members<br />
of the Management Board changed. From 2010, they receive<br />
as a long-term incentive (LTI) a variable cash payment related<br />
to the corporation’s long-term financial performance as measured<br />
by the increase in earnings per share (EPS) over a period<br />
of three years (performance period). (For details, please<br />
refer to the remuneration report on pages 36 to 44.)<br />
In fiscal 2005 to 2009, the members of the Management<br />
Board received an LTI in the form of a cash payment based on<br />
preferred share performance. Each member of the Management<br />
Board was allocated, as a function of the absolute<br />
increase in the price of the <strong>Henkel</strong> preferred share and the<br />
increase in the earnings per <strong>Henkel</strong> preferred share (EPS)<br />
achieved over a period of three years (performance period),<br />
the cash equivalent of up to 10,800 preferred shares –<br />
so-called Cash Performance Units – per financial year (this<br />
being equivalent to a tranche). On expiry of the performance<br />
period, the number and the value of the Cash Performance<br />
Units (CPUs) due are determined and the resulting tranche<br />
income is paid in cash. Each member of the Management<br />
Board participating in a tranche was required to acquire a<br />
personal stake by investing in <strong>Henkel</strong> preferred shares to the<br />
value of 25 percent of the gross tranche payout, and to place<br />
these shares in a blocked custody account with a five-year<br />
drawing restriction.<br />
<strong>Co</strong>nsolidated financial statements<br />
Other disclosures<br />
In the event of an absolute rise in the share price during<br />
the performance period of at least 15 percent, 21 percent or<br />
30 percent, each participant is allocated 1,800, 3,600 or<br />
5,400 CPUs respectively. To calculate the increase in the<br />
share price, the average price in January of the year of issue<br />
of a tranche is compared with the average price in January of<br />
the third financial year following the year of issue (reference<br />
price). If, during the performance period, earnings per<br />
preferred share increase by at least 15 percent, 21 percent or<br />
30 percent, each participant is allocated a further 1,800, 3,600<br />
or 5,400 CPUs respectively. To calculate the increase in earnings<br />
per preferred share, the earnings per preferred share of<br />
the financial year prior to the year of issue is compared with<br />
the earnings per preferred share of the second financial<br />
year after the year of issue. The amounts included in the<br />
calculation of the increase are, in each case, the earnings<br />
per preferred share as disclosed in the certified and approved<br />
consolidated financial statements of the relevant financial<br />
years, adjusted for exceptional items.<br />
The monetary value per CPU essentially corresponds to the<br />
reference price of the <strong>Henkel</strong> preferred share. A ceiling value<br />
(cap) is imposed in the event of extraordinary share price<br />
increases.<br />
The base price for the 2009 tranche was 21.78 euros. We based<br />
the measurement of the provision for the year of tranche<br />
issue on the achievement of mid-range targets; in the subsequent<br />
years, the pro rata provisions for the still live tranches<br />
issued in the previous years were adjusted on the basis of the<br />
latest figures. This has resulted in the addition of a further<br />
expense of 0.5 million euros in the financial year. At December<br />
31, <strong>2011</strong>, the provision for the still live tranche from this<br />
Program, which was discontinued as of 2009, was 1.9 million<br />
euros (previous year: 3.4 million euros).<br />
145
146 <strong>Co</strong>nsolidated financial statements<br />
Other disclosures<br />
<strong>Henkel</strong> <strong>Annual</strong> <strong>Report</strong> <strong>2011</strong><br />
(33) Employee structure<br />
<strong>Annual</strong> average amounts excluding apprentices and trainees,<br />
work experience students and interns, based on quarterly<br />
figures:<br />
Number of employees per function<br />
2010 <strong>2011</strong><br />
Production and engineering 23,672 23,568<br />
Marketing, selling and distribution 15,106 14,941<br />
Research and development 2,665 2,654<br />
Administration 6,698 6,590<br />
Total 48,141 47,753<br />
(34) Group segment report<br />
The format for reporting the activities of the <strong>Henkel</strong> Group by<br />
segment is by business sector; selected regional information<br />
is also provided. This classification corresponds to the way in<br />
which the Group manages its operating business.<br />
The activities of the <strong>Henkel</strong> Group are divided into the following<br />
operating segments: Laundry & Home Care, <strong>Co</strong>smetics/<br />
Toiletries and Adhesive Technologies (Adhesives for <strong>Co</strong>nsumers,<br />
Craftsmen and Building, and Industrial Adhesives).<br />
Laundry & Home Care<br />
The Laundry & Home Care business sector is globally active<br />
in the laundry and home care branded consumer goods business.<br />
The Laundry business includes not only heavy-duty and<br />
specialty detergents but also fabric softeners, laundry performance<br />
enhancers and laundry care products. The portfolio<br />
of our Home Care business encompasses hand-dishwashing<br />
and machine-dishwashing products, cleaners for bath and<br />
WC applications, and household, glass and specialty cleaners.<br />
We also have a market presence in selected regions with air<br />
fresheners and insecticides for household applications.<br />
<strong>Co</strong>smetics/Toiletries<br />
The <strong>Co</strong>smetics/Toiletries business sector is active in the<br />
Branded <strong>Co</strong>nsumer Goods business area with Hair <strong>Co</strong>smetics,<br />
Body Care, Skin Care and Oral Care, as well as in the professional<br />
Hair Salon business.<br />
Adhesive Technologies (Adhesives for <strong>Co</strong>nsumers, Craftsmen and<br />
Building, and Industrial Adhesives)<br />
The Adhesive Technologies business sector comprises five<br />
market- and customer-focused strategic business units.<br />
In the Adhesives for <strong>Co</strong>nsumers, Craftsmen and Building<br />
segment, we market a wide range of brandname products for<br />
private and professional users. Based on our four international<br />
brand platforms, namely Loctite, Pritt, Pattex and Ceresit, we<br />
offer target group-aligned system solutions for applications<br />
in the household, in schools and offices, for do-it-yourselfers<br />
and craftsmen, and also for the building industry.<br />
Our Transport and Metal business serves major international<br />
customers in the automotive and metal-processing industries,<br />
offering tailored system solutions and specialized technical<br />
services that cover the entire value chain from steel coating<br />
to final vehicle assembly.<br />
Within the General Industry business, our customers comprise<br />
manufacturers from a multitude of industries, ranging<br />
from household appliance producers to the wind power industry.<br />
Our portfolio here encompasses Loctite products for<br />
industrial main tenance, repair and overhaul, as well as a wide<br />
range of sealants and system solutions for surface treatment<br />
applications, and specialty adhesives.<br />
The Packaging, <strong>Co</strong>nsumer Goods and <strong>Co</strong>nstruction Adhesives<br />
business serves major international customers as well as<br />
medium- and small-sized manufacturers of the consumer<br />
goods and furniture industries. Leveraging our economies of<br />
scale, we offer attractive solutions for standard and volume<br />
applications.<br />
Our Electronics business offers customers from the worldwide<br />
electronics industry a comprehensive portfolio of innovative,<br />
high-tech adhesives and soldering materials for the<br />
manu facture of microchips and printed circuit boards.<br />
In determining the segment results and the asset and liability<br />
values, essentially the same principles of recognition and<br />
measurement are applied as in the consolidated financial<br />
statements. Operating assets in foreign currencies have been<br />
valued at average exchange rates.<br />
The Group measures the performance of its segments on the<br />
basis of a segment income variable referred to by Internal<br />
<strong>Co</strong>ntrol and <strong>Report</strong>ing as “adjusted EBIT.” For this purpose,<br />
operating profit (EBIT) is adjusted for one-time charges and<br />
gains and also restructuring charges.<br />
For reconciliation with the figures for the <strong>Henkel</strong> Group,<br />
Group overheads are reported under <strong>Co</strong>rporate together with<br />
income and expenses that cannot be allocated to the individual<br />
business sectors.<br />
Proceeds transferred between the segments only exist to a<br />
negligible extent and are therefore not separately disclosed.<br />
Operating assets, provisions and liabilities are assigned to<br />
the segments in accordance with their usage or origin. Where<br />
usage or origin is attributable to several segments, allocation<br />
is effected on the basis of appropriate ratios and keys.
<strong>Henkel</strong> <strong>Annual</strong> <strong>Report</strong> <strong>2011</strong><br />
For regional and geographic analysis purposes, sales are<br />
allocated to countries on the basis of the country-of-origin<br />
principle; non-current assets are allocated in accordance<br />
with the domicile of the international company to which<br />
they pertain.<br />
Reconciliation between net operating assets/<br />
capital employed and financial statement figures<br />
Net operating assets<br />
Financial<br />
statement<br />
figures<br />
December 31,<br />
2010<br />
Net operating assets<br />
Financial<br />
statement<br />
figures<br />
December 31,<br />
<strong>2011</strong><br />
<strong>Annual</strong> December 31,<br />
<strong>Annual</strong> December 31,<br />
in million euros<br />
average 1 2010 2010<br />
average 1 <strong>2011</strong> <strong>2011</strong><br />
Goodwill at book value<br />
Other intangible assets and property, plant and equipment<br />
6,512 6,521 6,521 6,361 6,713 6,713<br />
(total) 4,500 4,335 4,335 4,192 4,319 4,319<br />
Deferred taxes – – 358 – – 465<br />
Inventories 1,451 1,460 1,460 1,588 1,550 1,550<br />
Trade accounts receivable from third parties 2,062 1,893 1,893 2,110 2,001 2,001<br />
Intra-group accounts receivable 1,079 919 – 799 911 –<br />
Other assets and tax refund claims 2 425 388 1,412 374 431 1,500<br />
Cash and cash equivalents – – 1,515 1,980<br />
Assets held for sale – – 31 51<br />
Operating assets (gross)/Total assets 16,029 15,516 17,525 15,424 15,926 18,579<br />
– Operating liabilities<br />
of which:<br />
4,796 4,648 – 4,625 4,687 –<br />
Trade accounts payable to third parties 2,262 2,308 2,308 2,460 2,411 2,411<br />
Intra-group accounts payable<br />
Other provisions and other liabilities 2<br />
1,079 919 – 799 911 –<br />
, 3<br />
(financial and non-financial) 1,455 1,421 1,644 1,366 1,365 1,595<br />
Net operating assets 11,233 10,868 – 10,799 11,239 –<br />
– Goodwill at book value 6,512 – – 6,361 – –<br />
+ Goodwill at cost 4 6,875 – – 6,770 – –<br />
Capital employed 11,595 – – 11,208 – –<br />
1 The annual average is calculated on the basis of the twelve monthly figures.<br />
2 Only amounts relating to operating activities are taken into account in calculating net operating assets.<br />
3 Prior-year figures adjusted (see “Recognition and measurement methods” on pages 108 and 109).<br />
4 Before deduction of accumulated amortization pursuant to IFRS 3.79 (b).<br />
<strong>Co</strong>nsolidated financial statements<br />
Other disclosures<br />
147
148 <strong>Co</strong>nsolidated financial statements<br />
Other disclosures<br />
<strong>Henkel</strong> <strong>Annual</strong> <strong>Report</strong> <strong>2011</strong><br />
(35) Earnings per share<br />
The Stock Incentive Plan (Note 32, pages 143 to 145) dilutes<br />
earnings per ordinary share and earnings per preferred share<br />
by 1 eurocent in each case.<br />
Earnings per share<br />
in million euros (rounded) 2010 <strong>2011</strong><br />
Net income attributable to shareholders of <strong>Henkel</strong> <strong>AG</strong> & <strong>Co</strong>. <strong>KGaA</strong> 1,118 1,253<br />
Dividends, ordinary shares 182 203<br />
Dividends, preferred shares 125 139<br />
Total dividends 307 342<br />
Retained earnings per ordinary share 486 545<br />
Retained earnings per preferred share 325 366<br />
Retained earnings 811 911<br />
Number of ordinary shares 259,795,875 259,795,875<br />
Dividend per ordinary share in euros 0.70 0.78 4<br />
of which preliminary dividend per ordinary share in euros 1 0.02 0.02<br />
Retained earnings per ordinary share in euros 1.87 2.10<br />
EPS per ordinary share in euros 2.57 2.88<br />
Number of outstanding preferred shares 2 173,924,174 174,309,407<br />
Dividend per preferred share in euros 0.72 0.80 4<br />
of which preferred dividend per preferred share in euros 1 0.04 0.04<br />
Retained earnings per preferred share in euros 1.87 2.10<br />
EPS per preferred share in euros 2.59 2.90<br />
Number of ordinary shares 259,795,875 259,795,875<br />
Dividend per ordinary share in euros 0.70 0.78 4<br />
of which preliminary dividend per ordinary share in euros 1 0.02 0.02<br />
Retained earnings per ordinary share in euros after dilution 1.86 2.09<br />
Diluted EPS per ordinary share in euros 2.56 2.87 5<br />
Number of potential outstanding preferred shares 3 174,300,359 174,467,626<br />
Dividend per preferred share in euros 0.72 0.80 4<br />
of which preferred dividend per preferred share in euros 1 0.04 0.04<br />
Retained earnings per preferred share in euros after dilution 1.86 2.09<br />
Diluted EPS per preferred share in euros 2.58 2.89 5<br />
1 See Group management report, <strong>Co</strong>rporate governance, Division of capital stock, Shareholder rights.<br />
2 Weighted annual average of preferred shares (<strong>Henkel</strong> buy-back program).<br />
3 Weighted annual average of preferred shares adjusted for the potential number of shares arising from the Stock Incentive Plan.<br />
4 Proposal to shareholders for the <strong>Annual</strong> General Meeting on April 16, 2012.<br />
5 Based on income attributable to shareholders of <strong>Henkel</strong> <strong>AG</strong> & <strong>Co</strong>. <strong>KGaA</strong> of 1,251 million euros (IAS 33.59).<br />
(36) <strong>Co</strong>nsolidated statement of cash flows<br />
The statement of cash flows is prepared in accordance with<br />
IAS 7 “Statements of Cash Flows.” It describes the flow of cash<br />
and cash equivalents by origin and usage of liquid funds. It<br />
distinguishes between changes in funds arising from operating<br />
activities, investing activities/acquisitions, and financing<br />
activities. Financial funds include cash on hand, checks and<br />
credits at banks, and other financial assets with a remaining<br />
term of not more than three months. Securities are therefore<br />
included in financial funds, provided that they are available<br />
at short term and are only exposed to an insignificant price<br />
change risk. As in the previous year, <strong>Henkel</strong>’s financial funds<br />
match the cash and cash equivalents figure disclosed in the<br />
consolidated statement of financial position. Effects arising<br />
from currency translation are allowed for in the computation.<br />
In some countries, there are administrative hurdles to the<br />
transfer of money to the parent company.<br />
Cash flows from operating activities are determined by initially<br />
adjusting operating profit by non-cash variables such as<br />
depreciation/amortization/write-ups on assets, supplemented<br />
by changes in provisions, changes in other assets and liabilities,<br />
and also changes in net working capital. Payments made<br />
for income taxes are disclosed under operating cash flow.
<strong>Henkel</strong> <strong>Annual</strong> <strong>Report</strong> <strong>2011</strong><br />
Cash flows from investing activities/acquisitions occur<br />
essentially as a result of the flow of funds generated by<br />
disposals of non-current assets, subsidiary companies and<br />
business operations, and the outflow of funds arising from<br />
investments in non-current assets and acquisitions.<br />
Cash flow from investing activities/acquisitions includes<br />
payments for acquisitions in the amount of 4 million euros<br />
(previous year: 46 million euros) and relate exclusively to<br />
the acquisition of the Purbond Group within the Adhesive<br />
Technologies business sector.<br />
Cash flows from financing activities take into account interest<br />
and dividends paid and received, the change in borrowings<br />
and in pension provisions, and also payments made for the<br />
acquisition of non-controlling interests and other financing<br />
transactions. The change in borrowings takes into account<br />
a number of cash inflows and outflows, particularly arising<br />
from the assumption and amortization of current liabilities<br />
to banks.<br />
Free cash flow shows how much cash is actually available<br />
for acquisitions and dividends and/or for reducing debt.<br />
(37) <strong>Co</strong>ntingent liabilities<br />
Analysis<br />
in million euros<br />
Liabilities under guarantee and<br />
warranty agreements<br />
December<br />
31, 2010<br />
(38) Other unrecognized financial commitments<br />
15<br />
December<br />
31, <strong>2011</strong><br />
Operating leases as defined in IAS 17 comprise all forms of<br />
rights of use of assets, including rights of use arising from<br />
rent and leasehold agreements. Payment obligations under<br />
operating lease agreements are shown at the total amounts<br />
payable up to the earliest date when they can be terminated.<br />
The amounts shown are the nominal values. At December 31,<br />
<strong>2011</strong>, they were due for payment as follows:<br />
Operating lease commitments<br />
December December<br />
in million euros<br />
31, 2010 31, <strong>2011</strong><br />
Due in the following year 58 59<br />
Due within 1 to 5 years 127 118<br />
Due after 5 years 36 35<br />
Total 221 212<br />
In the course of the <strong>2011</strong> financial year, 67 million euros became<br />
due for payment under operating leases (previous year:<br />
67 million euros).<br />
8<br />
<strong>Co</strong>nsolidated financial statements<br />
Other disclosures<br />
As of the end of <strong>2011</strong>, commitments arising from orders for<br />
property, plant and equipment amounted to 52 million euros<br />
(previous year: 36 million euros). As in the previous year, there<br />
were no purchase commitments arising from toll manufacturing<br />
contracts.<br />
Payment commitments under the terms of agreements for<br />
capital increases and share purchases contracted prior to<br />
December 31, <strong>2011</strong> amounted to 7 million euros (previous<br />
year: 5 million euros).<br />
(39) Voting rights / Related party disclosures<br />
Related parties as defined by IAS 24 (“Related Party Disclosures”)<br />
are legal entities or natural persons who may be able to<br />
exert influence on <strong>Henkel</strong> <strong>AG</strong> & <strong>Co</strong>. <strong>KGaA</strong> and its subsidiaries,<br />
or be subject to the control or a material influence by <strong>Henkel</strong><br />
<strong>AG</strong> & <strong>Co</strong>. <strong>KGaA</strong> or its subsidiaries. These include, in particular,<br />
the members of the <strong>Henkel</strong> share-pooling agreement, nonconsolidated<br />
entities in which <strong>Henkel</strong> holds participating<br />
interest, and also the members of the management bodies of<br />
<strong>Henkel</strong> <strong>AG</strong> & <strong>Co</strong>. <strong>KGaA</strong> whose remunerations are indicated in<br />
the Remuneration <strong>Report</strong> section of the Management <strong>Report</strong><br />
on pages 36 to 44. <strong>Henkel</strong> Trust e.V. and Metzler Trust e.V.<br />
also fall into the category of related parties as defined in IAS 24.<br />
Information required by Section 160 (1) no. 8 of the German<br />
Stock <strong>Co</strong>rporation Act [AktG]:<br />
The company has been notified that the share of voting rights<br />
of the parties to the <strong>Henkel</strong> share-pooling agreement at<br />
October 21, 2010 represents in total 53.21 percent of the voting<br />
rights (138,240,804 votes) in <strong>Henkel</strong> <strong>AG</strong> & <strong>Co</strong>. <strong>KGaA</strong>, and is<br />
held by<br />
• 111 members of the families of the descendants of Fritz<br />
<strong>Henkel</strong>, the company’s founder,<br />
• four foundations set up by members of those families,<br />
• one civil-law partnership set up by members of those<br />
f amilies, and<br />
• eight private limited companies set up by members of those<br />
families, seven limited partnerships with a limited company<br />
as general partner (GmbH & <strong>Co</strong>. KG) and one limited partnership<br />
(KG)<br />
under the terms of a share-pooling agreement (agreement<br />
restricting the transfer of shares) pursuant to Section 22 (2)<br />
of the German Securities Trading Act [WpHG], whereby the<br />
shares held by the eight private limited companies, the seven<br />
limited partnerships with a limited company as general partner<br />
and the one limited partnership representing a total of<br />
14.02 percent (36,419,097 voting rights) are attributed (pursuant<br />
to Section 22 (1) no. 1 WpHG) to the family members who<br />
control those companies.<br />
149
150 <strong>Co</strong>nsolidated financial statements<br />
Other disclosures<br />
<strong>Henkel</strong> <strong>Annual</strong> <strong>Report</strong> <strong>2011</strong><br />
Dr. Christoph <strong>Henkel</strong>, London, has exceeded the 5 percent<br />
threshold of voting rights in <strong>Henkel</strong> <strong>AG</strong> & <strong>Co</strong>. <strong>KGaA</strong> with<br />
14,172,457 voting ordinary shares in <strong>Henkel</strong> <strong>AG</strong> & <strong>Co</strong>. <strong>KGaA</strong>,<br />
representing a rounded percentage of 5.46 percent. Even after<br />
adding voting rights expressly granted under the terms of<br />
usufruct agreements, no other party to the share-pooling<br />
agreement has a notification obligation triggered by their<br />
reaching or exceeding the threshold of 3 percent or more of<br />
the total voting rights in <strong>Henkel</strong> <strong>AG</strong> & <strong>Co</strong>. <strong>KGaA</strong>.<br />
The authorized representative of the parties to the <strong>Henkel</strong><br />
share-pooling agreement is Dr. Simone Bagel-Trah, Düsseldorf.<br />
Financial receivables from and payables to other investments<br />
in the form of non-consolidated entities are disclosed in<br />
Notes 3 and 18.<br />
<strong>Henkel</strong> Trust e.V. and Metzler Trust e.V., as parties to relevant<br />
contractual trust arrangements (CTA), hold the assets required<br />
to cover the pension obligations in Germany. The claim on<br />
<strong>Henkel</strong> Trust e.V. for reimbursement of pension payments made<br />
is shown under other financial assets (Note 3 on page 116).<br />
(40) Exercise of exemption options<br />
The following German companies included in the consolidated<br />
financial statements of <strong>Henkel</strong> <strong>AG</strong> & <strong>Co</strong>. <strong>KGaA</strong> exercised exemption<br />
options in fiscal <strong>2011</strong>:<br />
• Elch GmbH, Leverkusen (Section 264 (3) German <strong>Co</strong>mmercial<br />
<strong>Co</strong>de [HGB])<br />
• Schwarzkopf <strong>Henkel</strong> Production Europe GmbH & <strong>Co</strong>. KG,<br />
Düsseldorf (Section 264b German <strong>Co</strong>mmercial <strong>Co</strong>de [HGB]).<br />
The Dutch company <strong>Henkel</strong> Nederland B.V., Nieuwegein,<br />
exercised the exemption option afforded in Article 2:403 of<br />
the Civil <strong>Co</strong>de of the Netherlands.<br />
(41) Remuneration of the corporate management<br />
The total remuneration of the members of the Supervisory<br />
Board and of the Shareholders’ <strong>Co</strong>mmittee of <strong>Henkel</strong> <strong>AG</strong> & <strong>Co</strong>.<br />
<strong>KGaA</strong> amounted to 1,515,500 euros plus VAT (previous year:<br />
1,516,000 euros) and 2,295,205 euros (previous year:<br />
2,209,180 euros) respectively. The total remuneration<br />
(Section 285 no. 9 German <strong>Co</strong>mmercial <strong>Co</strong>de [HGB]) of the<br />
Management Board and members of the Management Board<br />
of <strong>Henkel</strong> Management <strong>AG</strong> amounted to 21,992,191 euros<br />
(previous year: 18,297,602 euros). For further details regarding<br />
the emoluments of the corporate management, please refer to<br />
the remuneration report on pages 36 to 44.<br />
(42) Declaration of compliance with the <strong>Co</strong>rporate<br />
Governance <strong>Co</strong>de (Kodex)<br />
In February <strong>2011</strong>, the Management Board of <strong>Henkel</strong> Management<br />
<strong>AG</strong> and the Supervisory Board and Shareholders’ <strong>Co</strong>mmittee<br />
of <strong>Henkel</strong> <strong>AG</strong> & <strong>Co</strong>. <strong>KGaA</strong> approved a joint declaration<br />
of compliance with the recommendations of the German<br />
<strong>Co</strong>rporate Governance <strong>Co</strong>de (Kodex) in accordance with<br />
Section 161 of the German Stock <strong>Co</strong>rporation Act [AktG]. The<br />
declaration has been made permanently available to shareholders<br />
on the company website: www.henkel.com/ir<br />
(43) Subsidiaries and other investments<br />
Details relating to the investments held by <strong>Henkel</strong> <strong>AG</strong> & <strong>Co</strong>. <strong>KGaA</strong><br />
and the <strong>Henkel</strong> Group are provided in a separate schedule<br />
appended to these notes to the consolidated financial statements<br />
but not included in the printed form of the <strong>Annual</strong><br />
<strong>Report</strong>. Said schedule is included in the accounting record<br />
submitted for publication in the Electronic Federal Gazette<br />
and can be viewed there and at the <strong>Annual</strong> General Meeting.<br />
The schedule is also included in the online version of the<br />
<strong>Annual</strong> <strong>Report</strong> on our website: www.henkel.com/ir<br />
(44) Auditor’s fees and services<br />
The total fees charged to the Group for the services of the<br />
auditor KPMG <strong>AG</strong> Wirtschaftsprüfungsgesellschaft and the<br />
other KPMG companies in fiscal 2010 and <strong>2011</strong> were as<br />
follows:<br />
Type of fee<br />
2010 of which <strong>2011</strong> of which<br />
in million euros<br />
Germany<br />
Germany<br />
Audits 8.5 1.3 7.7 1.3<br />
Other audit-related services 1.2 0.3 1.4 0.3<br />
Tax advisory services 0.9 0.4 0.6 0.1<br />
Other services 0.6 0.4 0.8 0.7<br />
Total 11.2 2.4 10.5 2.4<br />
The item “Audits” includes fees and disbursements in respect<br />
of the audit of the Group accounts and the legally prescribed<br />
financial statements of <strong>Henkel</strong> <strong>AG</strong> & <strong>Co</strong>. <strong>KGaA</strong> and its affiliated<br />
companies. The fees for audit-related services relate primarily<br />
to the quarterly reviews. The item “Tax advisory services”<br />
includes fees for advice and support on tax issues and the<br />
performance of tax compliance services on behalf of affiliated<br />
companies outside Germany. “Other services” comprise fees<br />
predominantly for project-related consultancy services.
<strong>Henkel</strong> <strong>Annual</strong> <strong>Report</strong> <strong>2011</strong><br />
Recommendation for the approval of the annual<br />
financial statements and the appropriation of<br />
the profit of <strong>Henkel</strong> <strong>AG</strong> & <strong>Co</strong>. <strong>KGaA</strong><br />
It is proposed that the annual financial statements of <strong>Henkel</strong> <strong>AG</strong> & <strong>Co</strong>. <strong>KGaA</strong> be<br />
approved as presented and that the unappropriated profit of 345,171,082.50 euros<br />
for the year ended December 31, <strong>2011</strong> be applied as follows:<br />
a) Payment of a dividend of 0.78 euros per ordinary share<br />
(259,795,875 shares) = 202,640,782.50 euros<br />
b) Payment of a dividend of 0.80 euros per preferred share<br />
(178,162,875 shares) = 142,530,300.00 euros<br />
345,171,082.50 euros<br />
According to Section 71 German Stock <strong>Co</strong>rporation Act [AktG], treasury shares<br />
do not qualify for a dividend. The amount in unappropriated profit which<br />
relates to the shares held by the corporation (treasury stock) at the date of<br />
the <strong>Annual</strong> General Meeting will be carried forward as retained earnings. As<br />
the <strong>Annual</strong> General Meeting can change the number of such treasury shares,<br />
a correspondingly adapted proposal for the appropriation of profit will be<br />
submitted to it, providing for an unchanged payout of 0.78 euros per ordinary<br />
share qualifying for a dividend and 0.80 euros per preferred share qualifying<br />
for a dividend, with corresponding adjustment of the other retained earnings<br />
and retained earnings carried forward to the following year.<br />
Düsseldorf, January 27, 2012<br />
<strong>Henkel</strong> Management <strong>AG</strong><br />
(Personally Liable Partner<br />
of <strong>Henkel</strong> <strong>AG</strong> & <strong>Co</strong>. <strong>KGaA</strong>)<br />
Management Board<br />
Notes to the consolidated financial statements<br />
151
152 Notes to the consolidated financial statements<br />
<strong>Henkel</strong> <strong>Annual</strong> <strong>Report</strong> <strong>2011</strong><br />
<strong>Annual</strong> financial statements of<br />
<strong>Henkel</strong> <strong>AG</strong> & <strong>Co</strong>. <strong>KGaA</strong> (summarized) *<br />
Statement of income<br />
in million euros 2010 <strong>2011</strong><br />
Sales 3,272 3,424<br />
<strong>Co</strong>st of sales –2,262 –2,426<br />
Gross profit 1,010 998<br />
Selling, research and administrative expenses –1,283 –1,331<br />
Other income (net of other expenses) 458 442<br />
Operating profit 185 109<br />
Financial result 874 –6<br />
Profit on ordinary activities 1,059 103<br />
Change in special accounts with reserve element 14 11<br />
Extraordinary result 37 –<br />
Earnings before tax 1,110 114<br />
Taxes on income –141 –82<br />
Net income 969 32<br />
Profit brought forward 377 304<br />
Allocated to other retained earnings / transferred from other retained earnings –484 9<br />
Unappropriated profit 1 862 345<br />
1 Statement of income figures are rounded; unappropriated profit 2010: 861,527,712.35 euros; unappropriated profit <strong>2011</strong>: 345,171,082.50 euros.<br />
Balance sheet<br />
in million euros 2010 <strong>2011</strong><br />
Intangible assets and property, plant and equipment 671 660<br />
Financial assets 7,017 7,185<br />
Non-current assets 7,688 7,845<br />
Inventories 224 233<br />
Receivables and miscellaneous assets / Deferred charges 1,994 1,591<br />
Marketable securities 250 309<br />
Liquid funds 1,117 1,389<br />
Current assets 3,585 3,522<br />
Assets arising from the overfunding of pension obligations 115 2<br />
Total assets 11,388 11,369<br />
Equity 5,468 5,204<br />
Special accounts with reserve element 151 139<br />
Provisions 654 762<br />
Liabilities, deferred income and accrued expenses 5,115 5,264<br />
Total equity and liabilities 11,388 11,369<br />
* The full financial statements of <strong>Henkel</strong> <strong>AG</strong> & <strong>Co</strong>. <strong>KGaA</strong> with the auditor’s<br />
unqualified opinion are filed with the commercial register and are also<br />
available at www.henkel.com/ir. <strong>Co</strong>pies can be obtained from <strong>Henkel</strong> <strong>AG</strong><br />
& <strong>Co</strong>. <strong>KGaA</strong> on request.
<strong>Henkel</strong> <strong>Annual</strong> <strong>Report</strong> <strong>2011</strong><br />
Independent Auditor’s <strong>Report</strong><br />
We have issued the following unqualified auditor’s report:<br />
“Independent Auditor’s <strong>Report</strong><br />
To <strong>Henkel</strong> <strong>AG</strong> & <strong>Co</strong>. <strong>KGaA</strong>, Düsseldorf<br />
<strong>Report</strong> on the <strong>Co</strong>nsolidated Financial Statements<br />
We have audited the accompanying consolidated financial<br />
statements of <strong>Henkel</strong> <strong>AG</strong> & <strong>Co</strong>. <strong>KGaA</strong>, Düsseldorf, and its<br />
subsidiaries, which comprise the consolidated statement of<br />
financial position as at December 31, <strong>2011</strong>, and the consolidated<br />
statement of income, the consolidated statement of comprehensive<br />
income, the consolidated statement of changes in<br />
equity, the consolidated statement of cash flows for the<br />
financial year then ended, and the notes to the consolidated<br />
financial statements.<br />
Responsibility of the Personally Liable Partner of the<br />
<strong>Co</strong>mpany for the <strong>Co</strong>nsolidated Financial Statements<br />
The personally liable partner of <strong>Henkel</strong> <strong>AG</strong> & <strong>Co</strong>. <strong>KGaA</strong> is<br />
responsible for the preparation of these consolidated financial<br />
statements. This responsibility includes preparing these<br />
consolidated financial statements in accordance with International<br />
Financial <strong>Report</strong>ing Standards as adopted by the<br />
European Union and the supplementary requirements of<br />
German law pursuant to Section 315a (1) German <strong>Co</strong>mmercial<br />
<strong>Co</strong>de, to give a true and fair view of the net assets, financial<br />
position and results of operations of the Group in accordance<br />
with these requirements. The personally liable partner of the<br />
company is also responsible for the internal controls that it<br />
determines are necessary to enable the preparation of consolidated<br />
financial statements that are free from material<br />
misstatement, whether due to fraud or error.<br />
Auditor’s Responsibility<br />
Our responsibility is to express an opinion on these consolidated<br />
financial statements based on our audit. We conducted<br />
our audit in accordance with Section 317 German <strong>Co</strong>mmercial<br />
<strong>Co</strong>de and German generally accepted standards for the audit<br />
of financial statements promulgated by the Institut der<br />
Wirtschaftsprüfer (Institute of Public Auditors in Germany)<br />
as well as in supplementary compliance with International<br />
Standards on Auditing (ISA). Those standards require that we<br />
comply with professional requirements and plan and perform<br />
the audit to obtain reasonable assurance about whether the<br />
consolidated financial statements are free from material<br />
misstatement.<br />
An audit involves performing audit procedures to obtain<br />
audit evidence about the amounts and disclosures in the<br />
consolidated financial statements. The selection of audit<br />
procedures depends on the auditor’s professional judgment.<br />
This includes the assessment of the risks of material misstatement<br />
of the consolidated financial statements, whether<br />
due to fraud or error. In assessing those risks, the auditor<br />
considers the system of internal control relevant to the entity’s<br />
preparation of the consolidated financial statements that give<br />
a true and fair view. The aim of this is to plan and perform<br />
audit procedures that are appropriate in the given circumstances,<br />
but not for the purpose of expressing an opinion on<br />
the effectiveness of the Group’s system of internal control. An<br />
audit also includes evaluating the appropriateness of accounting<br />
policies used and the reasonableness of accounting<br />
estimates made by the personally liable partner of the<br />
company, as well as evaluating the overall presentation<br />
of the consolidated financial statements.<br />
We believe that the audit evidence we have obtained is sufficient<br />
and appropriate to provide a basis for our audit opinion.<br />
Audit Opinion<br />
Pursuant to Section 322 (3) 1 German <strong>Co</strong>mmercial <strong>Co</strong>de, we<br />
state that our audit of the consolidated financial statements<br />
has not led to any reservations.<br />
In our opinion, based on the findings of our audit, the consolidated<br />
financial statements comply in all material respects<br />
with International Financial <strong>Report</strong>ing Standards as adopted<br />
by the European Union and the supplementary requirements<br />
of German law pursuant to Section 315a (1) German <strong>Co</strong>mmercial<br />
<strong>Co</strong>de and give a true and fair view of the net assets and<br />
financial position of the <strong>Henkel</strong> Group as at December 31, <strong>2011</strong>,<br />
as well as the results of operations for the financial year then<br />
ended, in accordance with these requirements.<br />
<strong>Report</strong> on the Group Management <strong>Report</strong><br />
We have audited the accompanying Group management<br />
report of <strong>Henkel</strong> <strong>AG</strong> & <strong>Co</strong>. <strong>KGaA</strong>. The personally liable partner<br />
of <strong>Henkel</strong> <strong>AG</strong> & <strong>Co</strong>. <strong>KGaA</strong> is responsible for the preparation<br />
of the Group management report in compliance with the<br />
applicable requirements of German law pursuant to Section<br />
315a (1) German <strong>Co</strong>mmercial <strong>Co</strong>de. We conducted our audit in<br />
accordance with Section 317 (2) German <strong>Co</strong>mmercial <strong>Co</strong>de<br />
and German generally accepted standards for the audit of the<br />
Group management report promulgated by the Institut der<br />
Wirtschaftsprüfer (Institute of Public Auditors in Germany).<br />
Those standards require that we plan and perform the audit<br />
of the Group management report to obtain reasonable assurance<br />
about whether the Group management report is consistent<br />
with the consolidated financial statements and with the<br />
findings of our audit, and as a whole provides a suitable view<br />
of the Group’s position and suitably presents the opportunities<br />
and risks of future development.<br />
153
154 <strong>Henkel</strong> <strong>Annual</strong> <strong>Report</strong> <strong>2011</strong><br />
Pursuant to Section 322 (3) 1 German <strong>Co</strong>mmercial <strong>Co</strong>de, we<br />
state that our audit of the Group management report has not<br />
led to any reservations.<br />
In our opinion, based on the findings of our audit of the consolidated<br />
financial statements and of the Group management<br />
report, the Group management report is consistent with the<br />
consolidated financial statements, and as a whole provides a<br />
suitable view of the Group’s position and suitably presents<br />
the opportunities and risks of future development.<br />
Düsseldorf, January 27, 2012<br />
KPMG <strong>AG</strong><br />
Wirtschaftsprüfungsgesellschaft<br />
Prof. Dr. Kai C. Andrejewski<br />
Wirtschaftsprüfer<br />
(German Public Auditor)<br />
Michael Gewehr<br />
Wirtschaftsprüfer<br />
(German Public Auditor)”
<strong>Henkel</strong> <strong>Annual</strong> <strong>Report</strong> <strong>2011</strong><br />
Responsibility statement by the Personally Liable<br />
Partner<br />
To the best of our knowledge, and in accordance with the applicable accounting<br />
principles for financial reporting, the consolidated financial statements give a<br />
true and fair view of the net assets, financial position and results of operations<br />
of the Group, and the management report of the Group includes a fair review of<br />
the development, performance and results of the business and the position of<br />
the Group, together with a cogent description of the principal opportunities<br />
and risks associated with the expected development of the Group.<br />
Düsseldorf, January 27, 2012<br />
<strong>Henkel</strong> Management <strong>AG</strong><br />
Management Board<br />
Kasper Rorsted,<br />
Jan-Dirk Auris, Kathrin Menges, Bruno Piacenza,<br />
Dr. Lothar Steinebach, Hans Van Bylen<br />
155
156 Notes to the consolidated financial statements<br />
<strong>Co</strong>rporate management of <strong>Henkel</strong> <strong>AG</strong> & <strong>Co</strong>. <strong>KGaA</strong><br />
<strong>Co</strong>rporate management of <strong>Henkel</strong> <strong>AG</strong> & <strong>Co</strong>. <strong>KGaA</strong><br />
Boards / memberships as defined by Section 125 (1) sentence 5 of the German Stock <strong>Co</strong>rporation Act [AktG] as at January, 2012<br />
Dipl.-Ing. Albrecht Woeste: Honorary Chairman of the <strong>Henkel</strong> Group<br />
Supervisory Board of <strong>Henkel</strong> <strong>AG</strong> & <strong>Co</strong>. <strong>KGaA</strong><br />
Dr. rer. nat. Simone Bagel-Trah<br />
Chairwoman,<br />
Private Investor, Düsseldorf<br />
Born in 1969<br />
Member since April 14, 2008<br />
Memberships:<br />
<strong>Henkel</strong> Management <strong>AG</strong> (Chairwoman) 1<br />
<strong>Henkel</strong> <strong>AG</strong> & <strong>Co</strong>. <strong>KGaA</strong> (Shareholders’ <strong>Co</strong>mmittee,<br />
Chairwoman) 2<br />
Heraeus Holding GmbH 1<br />
Winfried Zander *<br />
Vice-chairman,<br />
Chairman of the General Works <strong>Co</strong>uncil of<br />
<strong>Henkel</strong> <strong>AG</strong> & <strong>Co</strong>. <strong>KGaA</strong> and Chairman of the<br />
Works <strong>Co</strong>uncil of <strong>Henkel</strong> <strong>AG</strong> & <strong>Co</strong>. <strong>KGaA</strong>,<br />
Düsseldorf site<br />
Born in 1954<br />
Member since May 17, 1993<br />
Jutta Bernicke *<br />
Member of the Works <strong>Co</strong>uncil of<br />
<strong>Henkel</strong> <strong>AG</strong> & <strong>Co</strong>. <strong>KGaA</strong>, Düsseldorf site<br />
Born in 1962<br />
Member since April 14, 2008<br />
Dr. rer. nat. Kaspar von Braun<br />
Astrophysicist, Pasadena<br />
Born in 1971<br />
Member since April 19, 2010<br />
Johann-Christoph Frey<br />
<strong>Co</strong>mmercial Executive, Klosters<br />
Born in 1955<br />
Member since September 23, 2009<br />
Birgit Helten-Kindlein *<br />
Member of the Works <strong>Co</strong>uncil of<br />
<strong>Henkel</strong> <strong>AG</strong> & <strong>Co</strong>. <strong>KGaA</strong>, Düsseldorf site<br />
Born in 1964<br />
Member since April 14, 2008<br />
Prof. Dr. sc. nat. Michael Kaschke<br />
Chairman of the Executive Board of<br />
Carl Zeiss <strong>AG</strong>, Oberkochen<br />
Born in 1957<br />
Member since April 14, 2008<br />
Memberships:<br />
Carl Zeiss Group mandates:<br />
Carl Zeiss MicroImaging GmbH (Chairman) 1<br />
Carl Zeiss SMT GmbH (Chairman) 1<br />
Carl Zeiss Japan <strong>Co</strong>. Ltd. (Chairman) , Japan 2<br />
Carl Zeiss Far East (Chairman), Hong Kong 2<br />
Carl Zeiss India Pte. Ltd. (Chairman), India 2<br />
Thomas Manchot<br />
Private Investor, Düsseldorf<br />
Born in 1965<br />
Member since April 10, 2006<br />
Mayc Nienhaus *<br />
Member of the General Works <strong>Co</strong>uncil of<br />
<strong>Henkel</strong> <strong>AG</strong> & <strong>Co</strong>. <strong>KGaA</strong> and Chairman of the<br />
Works <strong>Co</strong>uncil of <strong>Henkel</strong> <strong>AG</strong> & <strong>Co</strong>. <strong>KGaA</strong>, Unna site<br />
Born in 1961<br />
Member since January 1, 2010<br />
Thierry Paternot<br />
Operating Partner, Duke Street Capital, Paris<br />
Born in 1948<br />
Member since April 14, 2008<br />
Memberships:<br />
Eckes <strong>AG</strong> 1<br />
Bio DS SAS, France 2<br />
Freedom-FullSix SAS (Chairman), France 2<br />
Oeneo SA, France 2<br />
Andrea Pichottka *<br />
Executive Assistant to the Executive Board<br />
Member Section 3 responsible for<br />
members, target groups, education<br />
IG Bergbau, Chemie, Energie, Hannover<br />
Born in 1959<br />
Member since October 26, 2004<br />
Memberships:<br />
Siltronic <strong>AG</strong> 1<br />
Dr. rer. nat. Martina Seiler*<br />
(since January 1, 2012)<br />
Chemist, Duisburg<br />
Representative of the Senior Staff of<br />
<strong>Henkel</strong> <strong>AG</strong> & <strong>Co</strong>. <strong>KGaA</strong><br />
Born in 1971<br />
Member since January 1, 2012<br />
* Employee representative.<br />
1 Membership in statutory supervisory and administrative boards in Germany.<br />
2 Membership of comparable oversight bodies.<br />
Prof. Dr. oec. publ. Theo Siegert<br />
Managing Partner of<br />
de Haen-Carstanjen & Söhne, Düsseldorf<br />
Born in 1947<br />
Member since April 20, 2009<br />
Memberships:<br />
Deutsche Bank <strong>AG</strong> 1<br />
E.ON <strong>AG</strong> 1<br />
Merck <strong>KGaA</strong> 1<br />
DKSH Holding Ltd., Switzerland 2<br />
E. Merck OHG 2<br />
Edgar Topsch *<br />
Member of the General Works <strong>Co</strong>uncil of<br />
<strong>Henkel</strong> <strong>AG</strong> & <strong>Co</strong>. <strong>KGaA</strong> and Vice-chairman of the<br />
Works <strong>Co</strong>uncil of <strong>Henkel</strong> <strong>AG</strong> & <strong>Co</strong>. <strong>KGaA</strong>,<br />
Düsseldorf site<br />
Born in 1960<br />
Member since August 1, 2010<br />
Michael Vassiliadis *<br />
Chairman of the Executive <strong>Co</strong>mmittee of<br />
IG Bergbau, Chemie, Energie, Hannover<br />
Born in 1964<br />
Member since May 4, 1998<br />
Memberships:<br />
BASF SE 1<br />
K + S <strong>AG</strong> (Vice-chairman) 1<br />
STE<strong>AG</strong> GmbH (Vice-chairman) 1<br />
Dr.-Ing. E.h. Bernhard Walter<br />
Former Chairman of the Executive Board<br />
of Dresdner Bank <strong>AG</strong>, Frankfurt/Main<br />
Born in 1942<br />
Member since May 4, 1998<br />
Memberships:<br />
Bilfinger Berger SE (Chairman) 1<br />
Daimler <strong>AG</strong> 1<br />
Deutsche Telekom <strong>AG</strong> 1<br />
Ulf Wentzien *<br />
(until December 31, <strong>2011</strong>)<br />
<strong>Co</strong>mmercial Executive, Düsseldorf<br />
Representative of the Senior Staff of<br />
<strong>Henkel</strong> <strong>AG</strong> & <strong>Co</strong>. <strong>KGaA</strong><br />
Born in 1963<br />
Member from April 14, 2008<br />
<strong>Henkel</strong> <strong>Annual</strong> <strong>Report</strong> <strong>2011</strong>
<strong>Henkel</strong> <strong>Annual</strong> <strong>Report</strong> <strong>2011</strong><br />
Subcommittees of the Supervisory Board<br />
Nominations <strong>Co</strong>mmittee<br />
Functions<br />
The Nominations <strong>Co</strong>mmittee prepares the resolutions of the Supervisory Board<br />
on election proposals to be presented to the <strong>Annual</strong> General Meeting for the election<br />
of members of the Supervisory Board (representatives of the shareholders).<br />
Members<br />
Dr. Simone Bagel-Trah, Chairwoman<br />
Dr. Bernhard Walter<br />
Johann-Christoph Frey<br />
Audit <strong>Co</strong>mmittee<br />
Functions<br />
The Audit <strong>Co</strong>mmittee prepares the proceedings and resolutions of the Supervisory<br />
Board relating to the approval of the annual financial statements and the<br />
consolidated financial statements, and relating to ratification of the proposal to<br />
be put before the <strong>Annual</strong> General Meeting regarding appointment of the auditor.<br />
It also deals with accountancy, risk management and compliance issues.<br />
Members<br />
Dr. Bernhard Walter, Chairman<br />
Prof. Dr. Theo Siegert, Vice-chairman<br />
Dr. Simone Bagel-Trah<br />
Birgit Helten-Kindlein<br />
Michael Vassiliadis<br />
Winfried Zander<br />
Notes to the consolidated financial statements<br />
<strong>Co</strong>rporate management of <strong>Henkel</strong> <strong>AG</strong> & <strong>Co</strong>. <strong>KGaA</strong><br />
157
158 Notes to the consolidated financial statements<br />
<strong>Co</strong>rporate management of <strong>Henkel</strong> <strong>AG</strong> & <strong>Co</strong>. <strong>KGaA</strong><br />
Shareholders’ <strong>Co</strong>mmittee of <strong>Henkel</strong> <strong>AG</strong> & <strong>Co</strong>. <strong>KGaA</strong><br />
Dr. rer. nat. Simone Bagel-Trah<br />
Chairwoman,<br />
Private Investor, Düsseldorf<br />
Born in 1969<br />
Member since April 18, 2005<br />
Memberships:<br />
<strong>Henkel</strong> <strong>AG</strong> & <strong>Co</strong>. <strong>KGaA</strong> (Chairwoman) 1<br />
<strong>Henkel</strong> Management <strong>AG</strong> (Chairwoman) 1<br />
Heraeus Holding GmbH 1<br />
Dr. rer. pol. h.c. Christoph <strong>Henkel</strong><br />
Vice-chairman,<br />
Managing Partner Canyon Equity LLC, London<br />
Born in 1958<br />
Member since May 27, 1991<br />
Prof. Dr. oec. HSG Paul Achleitner<br />
Member of the Executive Board of<br />
Allianz SE, Munich<br />
Born in 1956<br />
Member since April 30, 2001<br />
Memberships:<br />
Bayer <strong>AG</strong> 1<br />
RWE <strong>AG</strong> 1<br />
Daimler <strong>AG</strong> 1<br />
Allianz Group mandates: Allianz Global Investors <strong>AG</strong> 1<br />
Allianz Investment Management SE (Chairman) 1<br />
Boris Canessa<br />
Private Investor, Düsseldorf<br />
Born in 1963<br />
Member since September 19, 2009<br />
Memberships:<br />
Wilhelm von Finck Deutsche Family Office <strong>AG</strong> 1<br />
Subcommittees of the Shareholders’ <strong>Co</strong>mmittee<br />
Finance Subcommittee<br />
Stefan Hamelmann<br />
Private Investor, Düsseldorf<br />
Born in 1963<br />
Member since May 3, 1999<br />
Memberships:<br />
<strong>Henkel</strong> Management <strong>AG</strong> (Vice-chairman) 1<br />
Prof. Dr. rer. pol. Ulrich Lehner<br />
Former Chairman of the Management Board<br />
of <strong>Henkel</strong> <strong>KGaA</strong>, Düsseldorf<br />
Born in 1946<br />
Member since April 14, 2008<br />
Memberships:<br />
Deutsche Telekom <strong>AG</strong> (Chairman) 1<br />
E.ON <strong>AG</strong> 1<br />
<strong>Henkel</strong> Management <strong>AG</strong> 1<br />
Porsche Automobil Holding SE 1<br />
ThyssenKrupp <strong>AG</strong> 1<br />
Dr. August Oetker KG 2<br />
Novartis <strong>AG</strong>, Switzerland 2<br />
Dr.-Ing. Dr.-Ing. E.h. Norbert Reithofer<br />
(since April 11, <strong>2011</strong>)<br />
Chairman of the Management Board<br />
of Bayerische Motoren Werke <strong>AG</strong>, Munich<br />
Born in 1956<br />
Member since April 11, <strong>2011</strong><br />
Functions<br />
The Finance Subcommittee deals principally with financial matters, accounting<br />
issues including the statutory year-end audit, taxation and accounting policy,<br />
and risk management in the company.<br />
Members<br />
Dr. Christoph <strong>Henkel</strong>, Chairman<br />
Stefan Hamelmann, Vice-chairman<br />
Prof. Dr. Paul Achleitner<br />
Prof. Dr. Ulrich Lehner<br />
Dr. Norbert Reithofer (since April 11, <strong>2011</strong>)<br />
1 Membership in statutory supervisory and administrative boards in Germany.<br />
2 Membership of comparable oversight bodies.<br />
Human Resources Subcommittee<br />
Konstantin von Unger<br />
Founding Partner, Blue <strong>Co</strong>rporate Finance <strong>AG</strong>,<br />
London<br />
Born in 1966<br />
Member since April 14, 2003<br />
Memberships:<br />
Ten Lifestyle Management Ltd.,<br />
Great Britain 2<br />
Karel Vuursteen<br />
Former Chairman of the Executive Board<br />
of Heineken N.V., Amsterdam<br />
Born in 1941<br />
Member since May 6, 2002<br />
Memberships:<br />
Akzo Nobel N.V. (Chairman), Netherlands 2<br />
Heineken Holding N.V., Netherlands 2<br />
Tom Tom N.V. (Chairman), Netherlands 2<br />
Werner Wenning<br />
Former Chairman of the Executive Board<br />
of Bayer <strong>AG</strong>, Leverkusen<br />
Born in 1946<br />
Member since April 14, 2008<br />
Memberships:<br />
Deutsche Bank <strong>AG</strong> 1<br />
E.ON <strong>AG</strong> (Chairman) 1<br />
HDI V.a.G. 1<br />
Talanx <strong>AG</strong> 1<br />
Freudenberg & <strong>Co</strong>. KG 2<br />
Functions<br />
The Human Resources Subcommittee deals principally with personnel matters<br />
relating to members of the Management Board, issues pertaining to human<br />
resources strategy, and with remuneration.<br />
Members<br />
Dr. Simone Bagel-Trah, Chairwoman<br />
Konstantin von Unger, Vice-chairman<br />
Boris Canessa<br />
Karel Vuursteen<br />
Werner Wenning<br />
<strong>Henkel</strong> <strong>Annual</strong> <strong>Report</strong> <strong>2011</strong>
<strong>Henkel</strong> <strong>Annual</strong> <strong>Report</strong> <strong>2011</strong><br />
Management Board of <strong>Henkel</strong> Management <strong>AG</strong> *<br />
Kasper Rorsted<br />
Chairman of the Management Board<br />
Born in 1962<br />
Member since April 1, 2005 3<br />
Memberships:<br />
Bertelsmann <strong>AG</strong>1<br />
Danfoss A/S, Denmark 2<br />
Jan-Dirk Auris<br />
(since January 1, <strong>2011</strong>)<br />
Adhesive Technologies<br />
Born in 1968<br />
Member since January 1, <strong>2011</strong><br />
Memberships:<br />
<strong>Henkel</strong> <strong>Co</strong>rporation (Chairman), USA 2<br />
Kathrin Menges<br />
(since October 1, <strong>2011</strong>)<br />
Human Resources<br />
Born in 1964<br />
Member since October 1, <strong>2011</strong><br />
Memberships:<br />
<strong>Henkel</strong> Central Eastern Europe GmbH, Austria 2<br />
<strong>Henkel</strong> Norden AB, Sweden 2<br />
<strong>Henkel</strong> of America Inc., USA 2<br />
<strong>Henkel</strong> Norden Oy, Finland 2<br />
Dr. rer. nat. Simone Bagel-Trah<br />
Chairwoman,<br />
Private Investor, Düsseldorf<br />
Born in 1969<br />
Member since February 15, 2008<br />
Memberships:<br />
<strong>Henkel</strong> <strong>AG</strong> & <strong>Co</strong>. <strong>KGaA</strong> (Chairwoman) 1<br />
<strong>Henkel</strong> <strong>AG</strong> & <strong>Co</strong>. <strong>KGaA</strong> (Shareholders’ <strong>Co</strong>mmittee,<br />
Chairwoman) 2<br />
Heraeus Holding GmbH 1<br />
Bruno Piacenza<br />
(since January 1, <strong>2011</strong>)<br />
Laundry & Home Care<br />
(since March 1, <strong>2011</strong>)<br />
Born in 1965<br />
Member since January 1, <strong>2011</strong><br />
Supervisory Board of <strong>Henkel</strong> Management <strong>AG</strong> *<br />
Dr. rer. soc. oec. Friedrich Stara<br />
(until February 28, <strong>2011</strong>)<br />
Laundry & Home Care<br />
Born in 1949<br />
Member from July 1, 2005 3<br />
Memberships:<br />
Wiener Städtische Allgemeine Versicherung <strong>AG</strong>,<br />
Austria 2<br />
Stefan Hamelmann<br />
Vice-chairman,<br />
Private Investor, Düsseldorf<br />
Born in 1963<br />
Member since September 19, 2009<br />
Memberships:<br />
<strong>Henkel</strong> <strong>AG</strong> & <strong>Co</strong>. <strong>KGaA</strong><br />
(Shareholders’ <strong>Co</strong>mmittee) 2<br />
* Personally Liable Partner of <strong>Henkel</strong> <strong>AG</strong> & <strong>Co</strong>. <strong>KGaA</strong>.<br />
1 Membership in statutory supervisory and administrative boards in Germany.<br />
2 Membership of comparable oversight bodies.<br />
3 Including membership of the Management Board of <strong>Henkel</strong> <strong>KGaA</strong>.<br />
Notes to the consolidated financial statements<br />
<strong>Co</strong>rporate management of <strong>Henkel</strong> <strong>AG</strong> & <strong>Co</strong>. <strong>KGaA</strong><br />
Dr. jur. Lothar Steinebach<br />
Finance / Purchasing / IT / Legal<br />
Born in 1948<br />
Member since July 1, 2003 3<br />
Memberships:<br />
LSG Lufthansa Service Holding <strong>AG</strong> 1<br />
<strong>Henkel</strong> Adhesives Middle East E.C., Bahrain 2<br />
<strong>Henkel</strong> (China) Investment <strong>Co</strong>. Ltd., China 2<br />
<strong>Henkel</strong> & Cie <strong>AG</strong>, Switzerland 2<br />
<strong>Henkel</strong> Central Eastern Europe GmbH (Chairman),<br />
Austria 2<br />
<strong>Henkel</strong> <strong>Co</strong>nsumer Goods Inc. (Chairman), USA 2<br />
<strong>Henkel</strong> Ltd., Great Britain 2<br />
<strong>Henkel</strong> of America Inc. (Chairman), USA 2<br />
<strong>Henkel</strong> Technologies Egypt SAE, Egypt 2<br />
Türk <strong>Henkel</strong> Kimya Sanayi ve Ticaret AS (Chairman),<br />
Turkey 2<br />
Hans Van Bylen<br />
<strong>Co</strong>smetics/Toiletries<br />
Born in 1961<br />
Member since July 1, 2005 3<br />
Memberships:<br />
<strong>Henkel</strong> Belgium N.V., Belgium 2<br />
<strong>Henkel</strong> Nederland BV, Netherlands 2<br />
The Dial <strong>Co</strong>rporation (Chairman), USA 2<br />
Prof. Dr. rer. pol. Ulrich Lehner<br />
Former Chairman of the Management Board<br />
of <strong>Henkel</strong> <strong>KGaA</strong>, Düsseldorf<br />
Born in 1946<br />
Member since February 15, 2008<br />
Memberships:<br />
Deutsche Telekom <strong>AG</strong> (Chairman) 1<br />
E.ON <strong>AG</strong> 1<br />
Porsche Automobil Holding SE 1<br />
ThyssenKrupp <strong>AG</strong> 1<br />
<strong>Henkel</strong> <strong>AG</strong> & <strong>Co</strong>. <strong>KGaA</strong> (Shareholders’ <strong>Co</strong>mmittee) 2<br />
Dr. August Oetker KG 2<br />
Novartis <strong>AG</strong>, Switzerland 2<br />
159
160 Further information<br />
<strong>Henkel</strong> <strong>Annual</strong> <strong>Report</strong> <strong>2011</strong><br />
Further information<br />
<strong>Co</strong>rporate Senior Vice Presidents<br />
Prof. Dr. Ramón Bacardit<br />
Adhesive Technologies<br />
Research<br />
Georg Baratta-Dragono<br />
Laundry & Home Care<br />
Western Europe,<br />
International Sales,<br />
Customer Operations<br />
Alain Bauwens<br />
Laundry & Home Care<br />
International Marketing Laundry Care,<br />
New Business & Trends,<br />
Latin America<br />
Wolfgang Beynio<br />
<strong>Co</strong>rporate Functions<br />
Finance/<strong>Co</strong>ntrolling<br />
Dr. Andreas Bruns<br />
<strong>Co</strong>rporate Functions<br />
Infrastructure Services<br />
Julian <strong>Co</strong>lquitt<br />
Adhesive Technologies<br />
North America,<br />
SBU General Industry<br />
Bertrand <strong>Co</strong>nquéret<br />
<strong>Co</strong>rporate Functions<br />
Purchasing<br />
Ashraf El Afifi<br />
Laundry & Home Care<br />
Middle East/North Africa,<br />
President Africa/Middle East<br />
Management Circle I Worldwide<br />
Hikaru Adachi<br />
Aleksej Ananishnov<br />
Giacomo Archi<br />
Faruk Arig<br />
Thomas Hans Jörg Auris<br />
Dr. Kourosh Bahrami<br />
Paul Berry<br />
Cedric Berthod<br />
Michael Biondolillo<br />
Dr. Joachim Bolz<br />
Oriol Bonaclocha<br />
Guy Boone<br />
Oliver Bossmann<br />
Robert Bossuyt<br />
Hanno Brenningmeyer<br />
Daniel Brogan<br />
Sergey Bykovskih<br />
Angela Cackovich<br />
Edward Capasso<br />
Renata Casaro<br />
Michelle Cheung<br />
Adil Choudhry<br />
Jürgen <strong>Co</strong>nvent<br />
Susanne <strong>Co</strong>rnelius<br />
Matthias Czaja<br />
Michael Czech<br />
Jean Fayolle<br />
Adhesive Technologies<br />
SBU Packaging Industry<br />
Enric Holzbacher<br />
Adhesive Technologies<br />
Africa/Middle East,<br />
SBU <strong>Co</strong>nsumer & Building Industry<br />
Pascal Houdayer<br />
Laundry & Home Care<br />
International Marketing Home Care,<br />
Digital, Export and<br />
Business Development, Asia<br />
Dr. Stefan Huchler<br />
<strong>Co</strong>smetics/Toiletries<br />
Supply Chain/Packaging<br />
Dr. Joachim Jäckle<br />
<strong>Co</strong>rporate Functions<br />
Financial Operations<br />
Patrick Kaminski<br />
<strong>Co</strong>smetics/Toiletries<br />
Emerging Markets, Exports,<br />
President Asia-Pacific<br />
Paul Kirsch<br />
Adhesive Technologies<br />
SBU Transportation & Metal Industry<br />
Carsten Knobel<br />
<strong>Co</strong>smetics/Toiletries<br />
Financial Director,<br />
<strong>Co</strong>rporate Functions<br />
<strong>Co</strong>rporate <strong>Co</strong>ntrolling<br />
Dr. Nils Daecke<br />
Paul De Bruecker<br />
Ivan De Jonghe<br />
Patrick De Meyer<br />
Joseph DeBiase<br />
Hermann Deitzer<br />
Nicola delli Venneri<br />
Raymond Dimuzio<br />
Eric Dumez<br />
Christoph Eibel<br />
Wolfgang Eichstaedt<br />
Simon Ellis<br />
Steven Essick<br />
Charles Evans<br />
Ahmed Fahmy<br />
Thomas Feldbrügge<br />
Dr. Lars Feuerpeil<br />
Dr. Peter Florenz<br />
Dr. Thomas Förster<br />
Timm Rainer Fries<br />
Stephan Füsti-Molnár<br />
Holger Gerdes<br />
Roberto Gianetti<br />
Dr. Karl W. Gladt<br />
Michael Goder<br />
Ralf Grauel<br />
Peter Günther<br />
Peter Hassel<br />
Roswitha Heiland<br />
Lars Hennemann<br />
Georg Höbenstreit<br />
Dr. Alois Hoeger<br />
Katharina Höhne<br />
Dr. Dirk Holbach<br />
Jos Hubin<br />
Jeremy Hunter<br />
Dr. Regina Jäger<br />
Dr. Dieter Kahling<br />
Julio Muñoz Kampff<br />
George Kazantzis<br />
Thomas Keller<br />
Michael Kellner<br />
Klaus Keutmann<br />
Dr. Christian Kirsten<br />
Patrick Kivits<br />
Rolf Knörzer<br />
Nuri Erdem Koçak<br />
Dr. Harald Köster<br />
Luis Carlos Lacorte<br />
Dr. Daniel Langer<br />
Tom Linckens<br />
Jasmin Manner<br />
Alfredo Morales<br />
Liam Murphy<br />
Dirk-Stephan Koedijk<br />
<strong>Co</strong>rporate Functions<br />
Chief <strong>Co</strong>mpliance Officer<br />
Norbert Koll<br />
<strong>Co</strong>smetics/Toiletries<br />
Laundry & Home Care<br />
North America<br />
(since September 1, <strong>2011</strong>)<br />
Thomas Gerd Kühn<br />
<strong>Co</strong>rporate Functions<br />
Legal, IP, Insurance<br />
Dr. Marcus Kuhnert<br />
Laundry & Home Care<br />
Financial Director<br />
Tina Müller<br />
<strong>Co</strong>smetics/Toiletries<br />
Chief Marketing Officer Retail<br />
Prof. Dr. Thomas Müller-Kirschbaum<br />
Laundry & Home Care<br />
R&D, Technology, Supply Chain<br />
Michael Olosky<br />
Adhesive Technologies<br />
Asia-Pacific<br />
Dr. Matthias Schmidt<br />
Adhesive Technologies<br />
Financial Director<br />
SBU = Strategic Business Unit<br />
Christoph Neufeldt<br />
Sylvie Nicol<br />
Heinz Nicolas<br />
Joseph O’Brien<br />
Björk Ohlhorst<br />
Dr. Uwe Over<br />
Ian Parish<br />
Jerry Perkins<br />
Jeffrey Piccolomini<br />
Dr. Torsten Pilz<br />
Michael Rauch<br />
Gary Raykowitz<br />
Birgit Rechberger-Krammer<br />
Wolfgang Reiter<br />
Dr. Michael Reuter<br />
Robert Risse<br />
Dr. Michael Robl<br />
David Rodriguez<br />
Steffen Ruebke<br />
Norman Sack<br />
Jean-Baptiste Santoul<br />
Dr. Arndt Scheidgen<br />
Dr. Berthold Schreck<br />
Marie-Eve Schröder<br />
Prof. Dr. Hans-Willi Schroiff<br />
Dr. Zuzana Schütz-Halkova<br />
Dr. Johann Seif<br />
Jens-Martin Schwärzler<br />
<strong>Co</strong>smetics/Toiletries<br />
Western Europe, Germany,<br />
International Sales<br />
(since February 1, <strong>2011</strong>)<br />
Stefan Sudhoff<br />
<strong>Co</strong>smetics/Toiletries<br />
Schwarzkopf Professional<br />
(since September 1, <strong>2011</strong>)<br />
Alan Syzdek<br />
Adhesive Technologies<br />
SBU Electronics Industry<br />
Günter Thumser<br />
Laundry & Home Care<br />
Eastern Europe<br />
President <strong>Henkel</strong><br />
Central Eastern Europe<br />
Carsten Tilger<br />
<strong>Co</strong>rporate Functions<br />
<strong>Co</strong>rporate <strong>Co</strong>mmunications<br />
Dr. Peter Wroblowski<br />
<strong>Co</strong>rporate Functions<br />
Information Technology<br />
Active personnel,<br />
as at January 2012.<br />
Dr. Simone Siebeke<br />
Katrin Steinbüchel<br />
Dr. Walter Sterzel<br />
Klaus Strottmann<br />
Monica Sun<br />
Marco Swoboda<br />
Csaba Szendrei<br />
Makoto Tamaki<br />
Dr. Boris Tasche<br />
Agnès Thee<br />
Michael G. Todd<br />
Thomas Tönnesmann<br />
Johnny Tong<br />
Gordon Tredgold<br />
Amélie Vidal-Simi<br />
Dr. Tilo Weiss<br />
Dr. Jürgen Wichelhaus<br />
Dr. Hans-Christof Wilk<br />
Dorian Williams<br />
Bing Wu<br />
Active personnel,<br />
as at January 2012.
<strong>Henkel</strong> <strong>Annual</strong> <strong>Report</strong> <strong>2011</strong><br />
Quarterly breakdown of key financials<br />
in million euros<br />
Sales<br />
Further information<br />
1st quarter 2nd quarter 3rd quarter 4th quarter Full year<br />
2010 <strong>2011</strong> 2010 <strong>2011</strong> 2010 <strong>2011</strong> 2010 <strong>2011</strong> 2010 <strong>2011</strong><br />
Laundry & Home Care 1,049 1,072 1,086 1,076 1,123 1,110 1,061 1,046 4,319 4,304<br />
<strong>Co</strong>smetics/Toiletries 762 821 865 881 845 860 797 836 3,269 3,399<br />
Adhesive Technologies 1,651 1,884 1,890 1,963 1,945 2,020 1,820 1,879 7,306 7,746<br />
<strong>Co</strong>rporate 50 46 49 33 49 38 51 39 199 156<br />
<strong>Henkel</strong> Group 3,512 3,823 3,890 3,953 3,961 4,028 3,729 3,800 15,092 15,605<br />
<strong>Co</strong>st of sales –1,829 –2,073 –2,074 –2,138 –2,106 –2,215 –2,069 –2,111 –8,078 –8,538<br />
Gross profit 1,683 1,750 1,816 1,815 1,855 1,813 1,660 1,689 7,014 7,067<br />
Marketing, selling and distribution<br />
expenses –1,011 –1,057 –1,108 –1,063 –1,090 –1,041 –1,048 –971 –4,257 –4,132<br />
Research and development expenses –95 –103 –103 –105 –95 –103 –98 –99 –391 –410<br />
Administrative expenses –185 –187 –202 –196 –185 –209 –178 –193 –750 –785<br />
Other operating charges and income<br />
EBIT<br />
30 27 18 86 16 –9 43 13 107 117<br />
Laundry & Home Care 151 100 137 157 139 125 115 129 542 511<br />
<strong>Co</strong>smetics/Toiletries 100 112 112 140 113 111 86 107 411 471<br />
Adhesive Technologies 185 244 222 269 268 254 202 235 878 1,002<br />
<strong>Co</strong>rporate –15 –27 –50 –29 –19 –38 –24 –32 –108 –127<br />
<strong>Henkel</strong> Group 422 430 421 537 501 451 379 439 1,723 1,857<br />
Investment result – – – – – 1 1 –1 1 –<br />
Net interest –54 –37 –35 –41 –37 –38 –46 –39 –172 –155<br />
Financial result –54 –37 –35 –41 –37 –37 –45 –40 –171 –155<br />
Earnings before tax 368 393 386 496 464 414 334 399 1,552 1,702<br />
Taxes on income –102 –103 –106 –121 –121 –100 –80 –95 –409 –419<br />
Net income<br />
– attributable to non-controlling<br />
266 290 280 375 343 314 254 304 1,143 1,283<br />
interests<br />
– attributable to shareholders<br />
–7 –5 –7 –9 –6 –7 –5 –9 –25 –30<br />
of <strong>Henkel</strong> <strong>AG</strong> & <strong>Co</strong>. <strong>KGaA</strong><br />
Earnings per<br />
259 285 273 366 337 307 249 295 1,118 1,253<br />
preferred share in euros 0.60 0.66 0.63 0.85 0.78 0.71 0.58 0.68 2.59 2.90<br />
1st quarter 2nd quarter 3rd quarter 4th quarter Full year<br />
in million euros<br />
2010 <strong>2011</strong> 2010 <strong>2011</strong> 2010 <strong>2011</strong> 2010 <strong>2011</strong> 2010 <strong>2011</strong><br />
EBIT (as reported) 422 430 421 537 501 451 379 439 1,723 1,857<br />
One-time gains –32 – –1 –57 –10 – –16 – –59 –57<br />
One-time charges – – 9 – – – 5 2 14 2<br />
Restructuring charges 31 43 47 34 26 90 80 61 184 227<br />
Adjusted EBIT<br />
Adjusted earnings<br />
421 473 476 514 517 541 448 502 1,862 2,029<br />
per preferred share in euros 0.60 0.73 0.73 0.79 0.80 0.85 0.69 0.77 2.82 3.14<br />
The quarterly figures are specific to the quarter to which they refer and have been rounded for commercial convenience.<br />
161
162 Further information<br />
<strong>Henkel</strong> <strong>Annual</strong> <strong>Report</strong> <strong>2011</strong><br />
Multi-year summary<br />
in million euros 2005 2006 2007 2008 6 2009 2010 <strong>2011</strong><br />
Sales 11,974 12,740 13,074 14,131 13,573 15,092 15,605<br />
Operating profit (EBIT) 1,162 1,298 1,344 779 1,080 1,723 1,857<br />
Earnings before tax 1,042 1,176 1,250 1,627 885 1,552 1,702<br />
Net income 770 871 941 1,233 628 1,143 1,283<br />
Net income attributable to shareholders<br />
of <strong>Henkel</strong> <strong>AG</strong> & <strong>Co</strong>. <strong>KGaA</strong> 757 855 921 1,221 602 1,118 1,253<br />
Earnings per preferred share (EPS) 1 in euros 1.77 1.99 2.14 2.83 1.40 2.59 2.90<br />
Total assets 13,944 13,346 13,048 16,173 15,818 17,525 18,579<br />
Non-current assets 2 9,065 8,664 7,931 11,360 11,162 11,590 11,848<br />
Current assets 4,879 4,682 5,117 4,813 4,656 5,935 6,731<br />
Liabilities 8,545 7,799 7,342 9,539 9,274 9,575 9,817<br />
Operating debt coverage ratio 3 in % 39.9 48.4 71.6 45.1 41.8 71.4 83.2<br />
Interest coverage ratio 3 7.1 9.4 9.4 4.8 8.7 12.8 14.6<br />
Equity 5,399 5,547 5,706 6,535 6,544 7,950 8,762<br />
Equity ratio in % 38.7 41.6 43.7 40.3 41.4 45.4 47.2<br />
Net return on sales 4 in % 6.4 6.8 7.2 8.7 4.7 7.6 8.2<br />
Return on equity 5 in % 17.7 16.1 17.0 21.6 9.6 17.5 16.1<br />
Dividend per ordinary share in euros 0.43 0.48 0.51 0.51 0.51 0.70 0.78 7<br />
Dividend per preferred share in euros 0.45 0.50 0.53 0.53 0.53 0.72 0.80 7<br />
Total dividends 193 214 227 227 227 310 345 7<br />
Capital expenditures (including financial assets) 1,119 897 548 4,074 415 260 443<br />
Investment ratio as % of sales 9.3 7.0 4.2 28.8 3.0 1.7 2.8<br />
Research and development expenses 324 340 350 429 396 391 410<br />
Number of employees 8 (at December 31) 52,101 51,819 52,628 55,142 49,262 47,854 47,265<br />
of which in Germany 10,224 9,981 9,820 9,747 8,830 8,580 8,322<br />
of which abroad 41,877 41,838 42,808 45,395 40,432 39,274 38,943<br />
1 Basis: share split (1:3) of June 18, 2007.<br />
2 Prior-year figures adjusted (see “Recognition and measurement methods” on pages 108 and 109).<br />
3 See page 63 for formula.<br />
4 Net income divided by sales.<br />
5 Net income divided by equity at the start of the year.<br />
6 Adjusted following finalization of purchase price allocation relating to the acquisition of the National Starch businesses.<br />
7 Proposed.<br />
8 Basis: permanent employees excluding apprentices.
<strong>Henkel</strong> <strong>Annual</strong> <strong>Report</strong> <strong>2011</strong><br />
Glossary<br />
Adjusted EBIT<br />
Earnings before interest and taxes adjusted for<br />
exceptional items in the form of one-time charges,<br />
one-time gains and restructuring charges.<br />
Beta factor<br />
Reflects the systemic risk (market risk) of a share<br />
price compared to a certain index (stock market<br />
average): in the case of a beta factor of 1.0, the<br />
share price fluctuates to the same extent as the<br />
index. If the factor is less than 1.0, this indicates<br />
that the share price undergoes less fluctuation,<br />
while a factor above 1.0 indicates that the share<br />
price fluctuates more than the market average.<br />
Capital employed<br />
Interest-bearing capital invested in company assets<br />
and operations.<br />
Cash flows<br />
Inflows and outflows of cash and cash equivalents<br />
divided within the statement of cash flows into cash<br />
flows from ordinary activities, from investing and<br />
acquisition activities, and from financing activities.<br />
<strong>Co</strong>mmercial papers<br />
Short-term bearer bonds with a promise to pay,<br />
issued for the purpose of generating short-term<br />
debt capital.<br />
<strong>Co</strong>mpliance<br />
Acting in conformity with applicable regulations;<br />
adherence to laws, rules, regulations and in-house<br />
or corporate codes of conduct.<br />
<strong>Co</strong>mpound annual growth rate<br />
Year over year rate of growth, e.g. of an investment,<br />
over a defined period.<br />
<strong>Co</strong>rporate governance<br />
System of management and control, primarily within<br />
listed companies. Describes the powers and authority<br />
of corporate management, the extent to which these<br />
need to be monitored and the extent to which structures<br />
should be put in place through which certain<br />
interest/stakeholder groups may exert influence on<br />
the corporate management.<br />
<strong>Co</strong>rporate Governance <strong>Co</strong>de (Kodex)<br />
The Kodex is intended to render the rules applicable<br />
in Germany governing corporate management and<br />
control transparent for national and international<br />
investors, engendering trust and confidence in the<br />
corporate management of German companies.<br />
Credit default swap<br />
Instrument used by <strong>Henkel</strong> to evaluate the credit<br />
risks of banks.<br />
Credit facility<br />
Aggregate of all loan services available on call from<br />
one or several banks as cover for an immediate<br />
credit requirement.<br />
DAX ®<br />
Abbreviation for Deutscher Aktienindex, the German<br />
share index. The DAX lists the stocks and shares<br />
of Germany’s 30 largest listed corporations. <strong>Henkel</strong>’s<br />
preferred shares are quoted on the DAX. DAX is a<br />
registered trademark of Deutsche Börse <strong>AG</strong>, the<br />
German stock exchange company.<br />
Declaration of conformity<br />
Declaration made by the management/executive<br />
board and supervisory board of a company according<br />
to Section 161 of the German Stock <strong>Co</strong>rporation<br />
Act [AktG], confirming implementation of the recommendations<br />
of the Governmental <strong>Co</strong>mmission for<br />
the German <strong>Co</strong>rporate Governance <strong>Co</strong>de (Kodex).<br />
Deferred taxes<br />
In accordance with International Accounting Standard<br />
(IAS) 12, deferred taxes are recognized with<br />
respect to temporary differences between the statement<br />
of financial statement valuation of an asset or<br />
a liability and its tax base, unused tax losses and tax<br />
credits.<br />
Defined benefit plans<br />
Post-employment benefit plans other than defined<br />
contribution plans.<br />
Defined contribution plans<br />
Post-employment benefit plans under which an<br />
entity pays fixed contributions into a separate entity<br />
(a fund) and will have no legal or constructive obligation<br />
to pay further contributions if the fund does<br />
not hold sufficient assets to pay all employee benefits<br />
relating to employee service in the current and<br />
prior periods.<br />
Derivative<br />
Financial instrument, the value of which changes<br />
in response to changes in an underlying asset or an<br />
index, which will be settled at a future date and<br />
which initially requires only a small or no investment.<br />
Divestment<br />
Disposal, sale or divestiture of an asset, operation<br />
or business unit.<br />
Earnings per share (EPS)<br />
Metric indicating the income of a joint stock<br />
corporation divided between the weighted average<br />
number of its shares outstanding. The calculation<br />
is performed in accordance with International<br />
Accounting Standard (IAS) 33.<br />
EBIT<br />
Abbreviation for Earnings before Interest and Taxes.<br />
Standard profit metric that enables the earning<br />
power of the operating business activities of a company<br />
to be assessed independently of its financial<br />
structure, enabling comparability between entities<br />
where these are financed by varying levels of debt<br />
capital.<br />
Glossary 163<br />
EBITDA<br />
Abbreviation for Earnings before Interest, Taxes,<br />
Depreciation and Amortization.<br />
Economic value added (EVA ® )<br />
The EVA concept reflects the net wealth generated<br />
by a company over a certain period. A company<br />
achieves positive EVA when the operating result<br />
exceeds the weighted average cost of capital. The<br />
WACC corresponds to the yield on capital employed<br />
expected by the capital market. EVA is a registered<br />
trademark of Stern Stewart & <strong>Co</strong>.<br />
Equity ratio<br />
Financial metric indicating the ratio of equity to<br />
total capital. It expresses the share of total assets<br />
financed out of equity (owners’ capital) rather than<br />
debt capital (provided by lenders). Serves to assess<br />
the financial stability and independence of a company.<br />
Fair value<br />
Amount at which an asset or a liability might be<br />
exchanged or a debt paid in an arm’s length transaction<br />
between knowledgeable, willing parties.<br />
Free cash flow<br />
Cash flow actually available for acquisitions, dividend<br />
payments and the reduction of borrowings.<br />
Goodwill<br />
Amount by which the total consideration for<br />
a company or a business exceeds the netted sum of<br />
the fair values of the individual, identifiable assets<br />
and liabilities.<br />
Gross margin<br />
Indicates the percentage by which a company’s sales<br />
exceed cost of sales, i.e. the ratio of gross profit to<br />
sales.<br />
Gross profit<br />
Difference between sales and cost of sales.<br />
Hedge accounting<br />
Method for accounting for hedging transactions<br />
whereby the compensatory effect of changes in the<br />
fair value of the hedging instrument (derivative)<br />
and of the underlying asset or liability is recognized<br />
in either the statement of income or the statement<br />
of comprehensive income.<br />
Hybrid bond<br />
Equity-like corporate bond, usually with no specified<br />
date of maturity, or with a very long maturity, characterized<br />
by its subordination in the event of the<br />
issuer becoming insolvent.<br />
IAS/IFRS<br />
Abbreviation for International Accounting Standards<br />
and International Financial <strong>Report</strong>ing Standards<br />
respectively. In Europe, capital market-oriented<br />
companies are generally required to prepare consolidated<br />
financial statements in accordance with the<br />
International Financial <strong>Report</strong>ing Standards adopted<br />
by the European Union. Standards issued before<br />
2003 are known as IAS, those since that date are<br />
IFRS.
164 Glossary<br />
<strong>Henkel</strong> <strong>Annual</strong> <strong>Report</strong> <strong>2011</strong><br />
<strong>KGaA</strong><br />
Abbreviation for “Kommanditgesellschaft auf Aktien.”<br />
A <strong>KGaA</strong> is a company with a legal identity (legal<br />
entity) in which at least one partner has unlimited<br />
liability with respect to the company’s creditors<br />
(personally liable partner), while the liability for<br />
such debts of the other partners participating in<br />
the share-based capital stock is limited to their<br />
share capital (limited shareholders).<br />
Long-term incentive (LTI)<br />
Bonus aligned to long-term financial performance.<br />
Market capitalization<br />
Market value of a company calculated from the<br />
number of shares issued multiplied by their list<br />
price as quoted on the stock exchange.<br />
Net debt<br />
Borrowings less cash and cash equivalents minus<br />
any positive or plus any negative fair values of<br />
hedging contracts covering those borrowings, provided<br />
that the underlying borrowings are themselves<br />
subject to mark-to-market accounting.<br />
Net working capital<br />
Net balance of inventories, trade accounts receivable,<br />
and trade accounts payable.<br />
Non-controlling interests<br />
Proportion of equity attributable to third parties in<br />
subsidiaries included within the scope of consolidation.<br />
Previously termed “minority interests.” Valued<br />
on a proportional net asset basis. A pro-rata portion<br />
of the net earnings of a corporation is due to shareholders<br />
owning non- controlling interests.<br />
Organic sales growth<br />
Growth in revenues after adjusting for effects<br />
arising from acquisitions, divestments and foreign<br />
exchange differences – i.e. “top line” growth<br />
generated from within.<br />
Payout ratio<br />
Indicates what percentage of annual net income<br />
(adjusted for exceptional items) is paid out in<br />
dividends to shareholders, including non-controlling<br />
interests.<br />
Rating<br />
Assessment of the creditworthiness of a company as<br />
published by rating agencies.<br />
Return on capital employed (ROCE)<br />
Profitability metric reflecting the ratio of earnings<br />
before interest and taxes (EBIT) to capital employed.<br />
Return on sales (EBIT)<br />
Operating business metric derived from the ratio of<br />
EBIT to revenues.<br />
Scope of consolidation<br />
The scope of consolidation is the aggregate of<br />
companies incorporated in the consolidated financial<br />
statements.<br />
Share of advertising/Share of market<br />
A company’s share of total advertising spend in<br />
relation to its market share, specific to its active<br />
markets.<br />
Short-term incentive (STI)<br />
Bonus aligned to short-term financial performance.<br />
Supply chain<br />
Encompasses purchasing, production, storage,<br />
transport, customer services, requirements<br />
planning, production scheduling and supply chain<br />
management.<br />
Swap<br />
Term given to the exchange of capital amounts in<br />
differing currencies (currency swap) or of different<br />
interest obligations (interest swap) between two<br />
entities.<br />
Value at risk<br />
Method, based on fair value, used to calculate the<br />
maximum likely or potential future loss arising from<br />
a portfolio.<br />
Viral online marketing campaign<br />
A form of internet marketing aimed at generating<br />
digital WOM (“word of mouth”) via e-mail, social<br />
networks and/or video networks in order to get a<br />
product or brand quickly known. The term “viral”<br />
alludes to the manner by which the information<br />
spreads – like a virus.<br />
Volatility<br />
Measure of fluctuation and variability in the prices<br />
quoted for securities, in interest rates and in foreign<br />
exchange rates.<br />
Weighted average cost of capital (WACC)<br />
Average return on capital, calculated on the basis<br />
of a weighted average of the cost of debt and equity.<br />
WACC represents the minimum return expected of<br />
a company by its lenders for financing its assets.
Credits<br />
Published by:<br />
<strong>Henkel</strong> <strong>AG</strong> & <strong>Co</strong>. <strong>KGaA</strong><br />
40191 Düsseldorf, Germany<br />
Phone: +49 (0)211-797-0<br />
© 2012 <strong>Henkel</strong> <strong>AG</strong> & <strong>Co</strong>. <strong>KGaA</strong><br />
Edited by:<br />
<strong>Co</strong>rporate <strong>Co</strong>mmunications, Investor Relations,<br />
<strong>Co</strong>rporate Accounting and <strong>Report</strong>ing<br />
<strong>Co</strong>ordination: <strong>Co</strong>nstance Spitzer,<br />
Jens Bruno Wilhelm, Wolfgang Zengerling<br />
English translation: Paul Knighton, Cambridge<br />
Design and production:<br />
mpm <strong>Co</strong>rporate <strong>Co</strong>mmunication Solutions, Mainz<br />
Photographs: Claudia Kempf, Rüdiger Nehmzow,<br />
Alberto Venegas, Gerhard Weinkirn; <strong>Henkel</strong><br />
Pre-print proofing: Thomas Krause, Krefeld<br />
Printed by: Druckpartner, Essen<br />
Date of publication of this <strong>Report</strong>:<br />
March 8, 2012<br />
<strong>Co</strong>rporate <strong>Co</strong>mmunications<br />
Phone: +49 (0)211-797-2606<br />
Fax: +49 (0)211-798-2484<br />
E-mail: lars.witteck@henkel.com<br />
Investor Relations<br />
Phone: +49 (0)211-797-3937<br />
Fax: +49 (0)211-798-2863<br />
E-mail: renata.casaro@henkel.com<br />
PR no.: 03 12 5,000<br />
ISSN: 0724-4738<br />
ISBN: 978-3-941517-33-2<br />
The <strong>Annual</strong> <strong>Report</strong> is printed on PROFIsilkFSC from Sappi. The paper is made from<br />
pulp bleached without chlorine. It consists of wood fibers originating from sustainably<br />
managed forests and certified according to the rules of the Forest Stewardship<br />
<strong>Co</strong>uncil (FSC). The printing inks contain no heavy metals. This publication was coverfinished<br />
and bound with these <strong>Henkel</strong> products: Cellophaning with Adhesin laminating<br />
adhesive, UV spot coating with Miracure UV coating, bound so as to be suitable<br />
for recycling, using Purmelt MicroEmission and Technomelt Ultra for the highest<br />
occupational health and safety standards.<br />
All product names are registered trademarks of <strong>Henkel</strong> <strong>AG</strong> & <strong>Co</strong>. <strong>KGaA</strong>, Düsseldorf, or<br />
its affiliated companies.<br />
Financial calendar<br />
<strong>Annual</strong> General Meeting<br />
<strong>Henkel</strong> <strong>AG</strong> & <strong>Co</strong>. <strong>KGaA</strong> 2012:<br />
Monday, April 16, 2012<br />
Publication of <strong>Report</strong><br />
for the First Quarter 2012:<br />
Wednesday, May 9, 2012<br />
Publication of <strong>Report</strong><br />
for the Second Quarter / Half Year 2012:<br />
Wednesday, August 1, 2012<br />
Publication of <strong>Report</strong><br />
for the Third Quarter / Nine Months 2012:<br />
Friday, November 16, 2012<br />
Publication of <strong>Report</strong><br />
for Fiscal 2012:<br />
Thursday, February 28, 2013<br />
<strong>Annual</strong> General Meeting<br />
<strong>Henkel</strong> <strong>AG</strong> & <strong>Co</strong>. <strong>KGaA</strong> 2013:<br />
Monday, April 15, 2013<br />
Up-to-date facts and figures on <strong>Henkel</strong> also<br />
available on the internet:<br />
www.henkel.com<br />
This document contains forward-looking statements which are based on the current<br />
estimates and assumptions made by the executive management of <strong>Henkel</strong> <strong>AG</strong> & <strong>Co</strong>.<br />
<strong>KGaA</strong>. Forward-looking statements are characterized by the use of words such as<br />
expect, intend, plan, predict, assume, believe, estimate, anticipate and similar formulations.<br />
Such statements are not to be understood as in any way guaranteeing that<br />
those expectations will turn out to be accurate. Future performance and the results<br />
actually achieved by <strong>Henkel</strong> <strong>AG</strong> & <strong>Co</strong>. <strong>KGaA</strong> and its affiliated companies depend on a<br />
number of risks and uncertainties, and may therefore differ materially from the forward-looking<br />
statements. Many of these factors are outside <strong>Henkel</strong>’s control and cannot<br />
be accurately estimated in advance, such as the future economic environment<br />
and the actions of competitors and others involved in the marketplace. <strong>Henkel</strong><br />
neither plans nor undertakes to update forward-looking statements.
www.henkel.com/annualreport<br />
<strong>Henkel</strong> <strong>AG</strong> & <strong>Co</strong>. <strong>KGaA</strong><br />
40191 Düsseldorf, Germany<br />
Phone: +49 (0)211-797-0<br />
www.henkel.com<br />
www.henkel.com/sustainabilityreport<br />
The <strong>Henkel</strong> <strong>Co</strong>rporate <strong>Report</strong> app:<br />
<strong>Henkel</strong> in social media:<br />
www.facebook.com/henkel<br />
www.twitter.com/henkel<br />
www.youtube.com/henkel