Henkel Annual Report 2011 - Henkel AG & Co. KGaA Annual Report ...
Henkel Annual Report 2011 - Henkel AG & Co. KGaA Annual Report ...
Henkel Annual Report 2011 - Henkel AG & Co. KGaA Annual Report ...

Create successful ePaper yourself
Turn your PDF publications into a flip-book with our unique Google optimized e-Paper software.
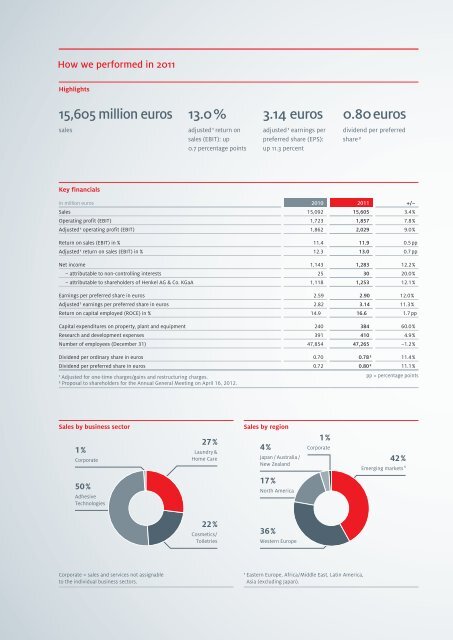
How we performed in <strong>2011</strong><br />
Highlights<br />
15,605 million euros<br />
sales<br />
Key financials<br />
in million euros 2010 <strong>2011</strong> +/–<br />
Sales 15,092 15,605 3.4 %<br />
Operating profit (EBIT) 1,723 1,857 7.8 %<br />
Adjusted ¹ operating profit (EBIT) 1,862 2,029 9.0 %<br />
Return on sales (EBIT) in % 11.4 11.9 0.5 pp<br />
Adjusted ¹ return on sales (EBIT) in % 12.3 13.0 0.7 pp<br />
Net income 1,143 1,283 12.2 %<br />
– attributable to non-controlling interests 25 30 20.0 %<br />
– attributable to shareholders of <strong>Henkel</strong> <strong>AG</strong> & <strong>Co</strong>. <strong>KGaA</strong> 1,118 1,253 12.1 %<br />
Earnings per preferred share in euros 2.59 2.90 12.0 %<br />
Adjusted ¹ earnings per preferred share in euros 2.82 3.14 11.3 %<br />
Return on capital employed (ROCE) in % 14.9 16.6 1.7 pp<br />
Capital expenditures on property, plant and equipment 240 384 60.0 %<br />
Research and development expenses 391 410 4.9 %<br />
Number of employees (December 31) 47,854 47,265 –1.2 %<br />
Dividend per ordinary share in euros 0.70 0.78 2 11.4 %<br />
Dividend per preferred share in euros 0.72 0.80 2 11.1 %<br />
¹ Adjusted for one-time charges/gains and restructuring charges.<br />
² Proposal to shareholders for the <strong>Annual</strong> General Meeting on April 16, 2012.<br />
pp = percentage points<br />
Sales by business sector<br />
1 %<br />
<strong>Co</strong>rporate<br />
50 %<br />
Adhesive<br />
Technologies<br />
<strong>Co</strong>rporate = sales and services not assignable<br />
to the individual business sectors.<br />
13.0 %<br />
adjusted ¹ return on<br />
sales (EBIT): up<br />
0.7 percentage points<br />
27 %<br />
Laundry &<br />
Home Care<br />
22 %<br />
<strong>Co</strong>smetics/<br />
Toiletries<br />
3.14 euros<br />
adjusted ¹ earnings per<br />
preferred share (EPS):<br />
up 11.3 percent<br />
Sales by region<br />
4 %<br />
Japan / Australia /<br />
New Zealand<br />
17 %<br />
North America<br />
36 %<br />
Western Europe<br />
1 %<br />
<strong>Co</strong>rporate<br />
¹ Eastern Europe, Africa/Middle East, Latin America,<br />
Asia (excluding Japan).<br />
0.80 euros<br />
dividend per preferred<br />
share ²<br />
42 %<br />
Emerging markets ¹