Henkel Annual Report 2011 - Henkel AG & Co. KGaA Annual Report ...
Henkel Annual Report 2011 - Henkel AG & Co. KGaA Annual Report ...
Henkel Annual Report 2011 - Henkel AG & Co. KGaA Annual Report ...

You also want an ePaper? Increase the reach of your titles
YUMPU automatically turns print PDFs into web optimized ePapers that Google loves.
<strong>Henkel</strong> <strong>Annual</strong> <strong>Report</strong> <strong>2011</strong> Group management report<br />
Net assets and financial position<br />
63<br />
to 412 million euros as of the reporting date.<br />
These essentially comprise interest-bearing loans<br />
and overdrafts from banks.<br />
We used our cash flow from operating activities<br />
to redeem current borrowings and to build<br />
up cash and cash equivalents, thus reducing our<br />
net debt. The hybrid bond is treated as 50 percent<br />
equity by Standard & Poor’s and – following<br />
a change in its evaluation method – now also by<br />
Moody’s. This treatment benefits the rating-specific<br />
debt ratios of the Group (see key financial<br />
ratios table below).<br />
For further information on our financial instruments,<br />
please refer to the Notes on pages 128<br />
to 138.<br />
Our financial risk management activities are<br />
explained in the financial instruments report<br />
in the Notes on pages 128 to 138 and also in<br />
the risk report on pages 90 and 91.<br />
Financial position<br />
In <strong>2011</strong>, cash flow from operating activities<br />
amounted to 1,562 million euros, a total of 289 million<br />
euros below the prior-year level. The cash<br />
inflow from the growth in operating profit was<br />
offset by the outflow arising from higher net<br />
working capital caused by an increase in inventories<br />
and trade accounts receivable. The increase<br />
in operating profit led to a rise in income taxes<br />
paid. The higher gains from asset disposals have<br />
been adjusted out of cash flow from operating<br />
activities. Where cash-relevant, they are disclosed<br />
instead in cash flow from investing activities/<br />
acquisitions.<br />
Cash outflow in cash flow from investing activities/acquisitions<br />
was 57 million euros higher<br />
than the prior-year level. The increase in investments<br />
in property, plant and equipment compared<br />
to previous year led to higher outflows,<br />
countervailed by increased proceeds from divestments,<br />
predominantly from the sale of our branded<br />
consumer goods business in India and our<br />
business involving roofing membrane under<br />
the Wolfin brand.<br />
With a net outflow of 802 million euros, cash flow<br />
from financing activities showed a significant<br />
improvement of 421 million euros compared to<br />
the previous year, despite a higher dividend payout.<br />
The transfer of liquid funds to other current<br />
financial assets effected in the previous year,<br />
and the use of liquid funds to further strengthen<br />
our pension plan assets, were also reported as<br />
outflows under this heading.<br />
Cash and cash equivalents increased by 465 million<br />
euros to 1,980 million euros as a result of<br />
the cash flow from operating activities.<br />
Free cash flow amounted to 951 million euros,<br />
a decrease of 557 million euros below the prioryear<br />
figure due to the lower cash flow from operating<br />
activities and higher capital expenditures.<br />
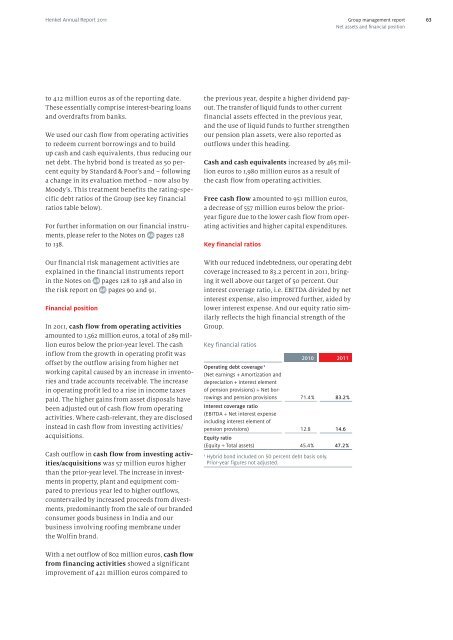
Key financial ratios<br />
With our reduced indebtedness, our operating debt<br />
coverage increased to 83.2 percent in <strong>2011</strong>, bringing<br />
it well above our target of 50 percent. Our<br />
interest coverage ratio, i.e. EBITDA divided by net<br />
interest expense, also improved further, aided by<br />
lower interest expense. And our equity ratio similarly<br />
reflects the high financial strength of the<br />
Group.<br />
Key financial ratios<br />
2010 <strong>2011</strong><br />
Operating debt coverage 1<br />
(Net earnings + Amortization and<br />
depreciation + interest element<br />
of pension provisions) ÷ Net borrowings<br />
and pension provisions<br />
Interest coverage ratio<br />
(EBITDA ÷ Net interest expense<br />
including interest element of<br />
71.4 % 83.2%<br />
pension provisions)<br />
Equity ratio<br />
12.8 14.6<br />
(Equity ÷ Total assets)<br />
45.4 % 47.2%<br />
1 Hybrid bond included on 50 percent debt basis only.<br />
Prior-year figures not adjusted.