EXTENDED LEARNING MODULE D - McGraw-Hill Learning Solutions
EXTENDED LEARNING MODULE D - McGraw-Hill Learning Solutions
EXTENDED LEARNING MODULE D - McGraw-Hill Learning Solutions

You also want an ePaper? Increase the reach of your titles
YUMPU automatically turns print PDFs into web optimized ePapers that Google loves.
Haag−Cummings:<br />
Management Information<br />
Systems for the Information<br />
Age, Seventh Edition<br />
Extended <strong>Learning</strong> Module<br />
D: Decision Analysis with<br />
Spreadsheet Software<br />
192 Extended <strong>Learning</strong> Module D<br />
<strong>LEARNING</strong> OUTCOME 1<br />
Text © The <strong>McGraw</strong>−<strong>Hill</strong><br />
Companies, 2008<br />
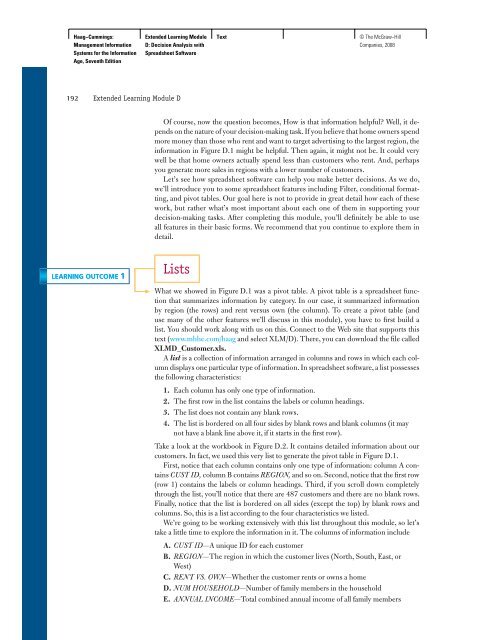
Of course, now the question becomes, How is that information helpful? Well, it depends<br />
on the nature of your decision-making task. If you believe that home owners spend<br />
more money than those who rent and want to target advertising to the largest region, the<br />
information in Figure D.1 might be helpful. Then again, it might not be. It could very<br />
well be that home owners actually spend less than customers who rent. And, perhaps<br />
you generate more sales in regions with a lower number of customers.<br />
Let’s see how spreadsheet software can help you make better decisions. As we do,<br />
we’ll introduce you to some spreadsheet features including Filter, conditional formatting,<br />
and pivot tables. Our goal here is not to provide in great detail how each of these<br />
work, but rather what’s most important about each one of them in supporting your<br />
decision-making tasks. After completing this module, you’ll defi nitely be able to use<br />
all features in their basic forms. We recommend that you continue to explore them in<br />
detail.<br />
Lists<br />
What we showed in Figure D.1 was a pivot table. A pivot table is a spreadsheet function<br />
that summarizes information by category. In our case, it summarized information<br />
by region (the rows) and rent versus own (the column). To create a pivot table (and<br />
use many of the other features we’ll discuss in this module), you have to fi rst build a<br />
list. You should work along with us on this. Connect to the Web site that supports this<br />
text ( www.mhhe.com/haag and select XLM/D). There, you can download the fi le called<br />
XLMD_Customer.xls.<br />
A list is a collection of information arranged in columns and rows in which each column<br />
displays one particular type of information. In spreadsheet software, a list possesses<br />
the following characteristics:<br />
1.<br />
2.<br />
3.<br />
4.<br />
Each column has only one type of information.<br />
The fi rst row in the list contains the labels or column headings.<br />
The list does not contain any blank rows.<br />
The list is bordered on all four sides by blank rows and blank columns (it may<br />
not have a blank line above it, if it starts in the fi rst row).<br />
Take a look at the workbook in Figure D.2 . It contains detailed information about our<br />
customers. In fact, we used this very list to generate the pivot table in Figure D.1 .<br />
First, notice that each column contains only one type of information: column A contains<br />
CUST ID, column B contains REGION, and so on. Second, notice that the fi rst row<br />
(row 1) contains the labels or column headings. Third, if you scroll down completely<br />
through the list, you’ll notice that there are 487 customers and there are no blank rows.<br />
Finally, notice that the list is bordered on all sides (except the top) by blank rows and<br />
columns. So, this is a list according to the four characteristics we listed.<br />
We’re going to be working extensively with this list throughout this module, so let’s<br />
take a little time to explore the information in it. The columns of information include<br />
A.<br />
B.<br />
C.<br />
D.<br />
E.<br />
CUST ID—A unique ID for each customer<br />
REGION—The region in which the customer lives (North, South, East, or<br />
West)<br />
RENT VS. OWN—Whether the customer rents or owns a home<br />
NUM HOUSEHOLD—Number of family members in the household<br />
ANNUAL INCOME—Total combined annual income of all family members