Perception of Fourier and non- Fourier motion by ... - ResearchGate
Perception of Fourier and non- Fourier motion by ... - ResearchGate
Perception of Fourier and non- Fourier motion by ... - ResearchGate

You also want an ePaper? Increase the reach of your titles
YUMPU automatically turns print PDFs into web optimized ePapers that Google loves.
© 2000 Nature America Inc. • http://neurosci.nature.com<br />
articles<br />
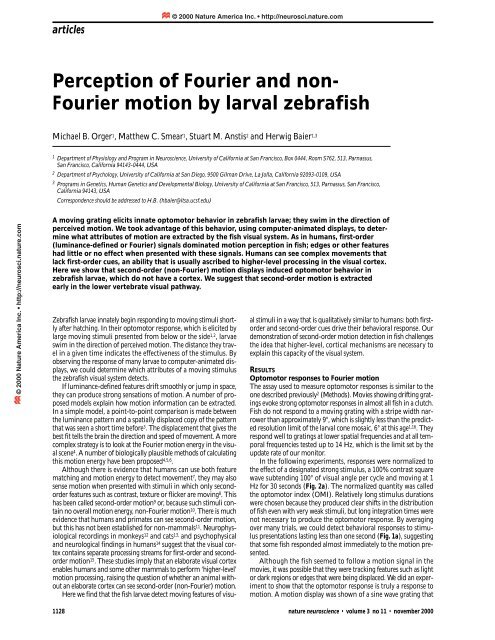
<strong>Perception</strong> <strong>of</strong> <strong>Fourier</strong> <strong>and</strong> <strong>non</strong>-<br />
<strong>Fourier</strong> <strong>motion</strong> <strong>by</strong> larval zebrafish<br />
Michael B. Orger 1, Matthew C. Smear 1, Stuart M. Anstis 2 <strong>and</strong> Herwig Baier 1,3<br />
1 Department <strong>of</strong> Physiology <strong>and</strong> Program in Neuroscience, University <strong>of</strong> California at San Francisco, Box 0444, Room S762, 513, Parnassus,<br />
San Francisco, California 94143-0444, USA<br />
2 Department <strong>of</strong> Psychology, University <strong>of</strong> California at San Diego, 9500 Gilman Drive, La Jolla, California 92093-0109, USA<br />
3 Programs in Genetics, Human Genetics <strong>and</strong> Developmental Biology, University <strong>of</strong> California at San Francisco, 513, Parnassus, San Francisco,<br />
California 94143, USA<br />
Correspondence should be addressed to H.B. (hbaier@itsa.ucsf.edu)<br />
A moving grating elicits innate optomotor behavior in zebrafish larvae; they swim in the direction <strong>of</strong><br />
perceived <strong>motion</strong>. We took advantage <strong>of</strong> this behavior, using computer-animated displays, to determine<br />
what attributes <strong>of</strong> <strong>motion</strong> are extracted <strong>by</strong> the fish visual system. As in humans, first-order<br />
(luminance-defined or <strong>Fourier</strong>) signals dominated <strong>motion</strong> perception in fish; edges or other features<br />
had little or no effect when presented with these signals. Humans can see complex movements that<br />
lack first-order cues, an ability that is usually ascribed to higher-level processing in the visual cortex.<br />
Here we show that second-order (<strong>non</strong>-<strong>Fourier</strong>) <strong>motion</strong> displays induced optomotor behavior in<br />
zebrafish larvae, which do not have a cortex. We suggest that second-order <strong>motion</strong> is extracted<br />
early in the lower vertebrate visual pathway.<br />
Zebrafish larvae innately begin responding to moving stimuli shortly<br />
after hatching. In their optomotor response, which is elicited <strong>by</strong><br />
large moving stimuli presented from below or the side 1,2 , larvae<br />
swim in the direction <strong>of</strong> perceived <strong>motion</strong>. The distance they travel<br />
in a given time indicates the effectiveness <strong>of</strong> the stimulus. By<br />
observing the response <strong>of</strong> many larvae to computer-animated displays,<br />
we could determine which attributes <strong>of</strong> a moving stimulus<br />
the zebrafish visual system detects.<br />
If luminance-defined features drift smoothly or jump in space,<br />
they can produce strong sensations <strong>of</strong> <strong>motion</strong>. A number <strong>of</strong> proposed<br />
models explain how <strong>motion</strong> information can be extracted.<br />
In a simple model, a point-to-point comparison is made between<br />
the luminance pattern <strong>and</strong> a spatially displaced copy <strong>of</strong> the pattern<br />
that was seen a short time before 3 . The displacement that gives the<br />
best fit tells the brain the direction <strong>and</strong> speed <strong>of</strong> movement. A more<br />
complex strategy is to look at the <strong>Fourier</strong> <strong>motion</strong> energy in the visual<br />
scene 4 . A number <strong>of</strong> biologically plausible methods <strong>of</strong> calculating<br />
this <strong>motion</strong> energy have been proposed 4,5,6 .<br />
Although there is evidence that humans can use both feature<br />
matching <strong>and</strong> <strong>motion</strong> energy to detect movement 7 , they may also<br />
sense <strong>motion</strong> when presented with stimuli in which only secondorder<br />
features such as contrast, texture or flicker are moving 8 . This<br />
has been called second-order <strong>motion</strong> 9 or, because such stimuli contain<br />
no overall <strong>motion</strong> energy, <strong>non</strong>-<strong>Fourier</strong> <strong>motion</strong> 10 . There is much<br />
evidence that humans <strong>and</strong> primates can see second-order <strong>motion</strong>,<br />
but this has not been established for <strong>non</strong>-mammals 11 . Neurophysiological<br />
recordings in monkeys 12 <strong>and</strong> cats 13, <strong>and</strong> psychophysical<br />
<strong>and</strong> neurological findings in humans 14 suggest that the visual cortex<br />
contains separate processing streams for first-order <strong>and</strong> secondorder<br />
<strong>motion</strong> 15 . These studies imply that an elaborate visual cortex<br />
enables humans <strong>and</strong> some other mammals to perform ‘higher-level’<br />
<strong>motion</strong> processing, raising the question <strong>of</strong> whether an animal without<br />
an elaborate cortex can see second-order (<strong>non</strong>-<strong>Fourier</strong>) <strong>motion</strong>.<br />
Here we find that the fish larvae detect moving features <strong>of</strong> visu-<br />
© 2000 Nature America Inc. • http://neurosci.nature.com<br />
al stimuli in a way that is qualitatively similar to humans: both firstorder<br />
<strong>and</strong> second-order cues drive their behavioral response. Our<br />
demonstration <strong>of</strong> second-order <strong>motion</strong> detection in fish challenges<br />
the idea that higher-level, cortical mechanisms are necessary to<br />
explain this capacity <strong>of</strong> the visual system.<br />
RESULTS<br />
Optomotor responses to <strong>Fourier</strong> <strong>motion</strong><br />
The assay used to measure optomotor responses is similar to the<br />
one described previously 2 (Methods). Movies showing drifting gratings<br />
evoke strong optomotor responses in almost all fish in a clutch.<br />
Fish do not respond to a moving grating with a stripe width narrower<br />
than approximately 9°, which is slightly less than the predicted<br />
resolution limit <strong>of</strong> the larval cone mosaic, 6° at this age 1,16 . They<br />
respond well to gratings at lower spatial frequencies <strong>and</strong> at all temporal<br />
frequencies tested up to 14 Hz, which is the limit set <strong>by</strong> the<br />
update rate <strong>of</strong> our monitor.<br />
In the following experiments, responses were normalized to<br />
the effect <strong>of</strong> a designated strong stimulus, a 100% contrast square<br />
wave subtending 100° <strong>of</strong> visual angle per cycle <strong>and</strong> moving at 1<br />
Hz for 30 seconds (Fig. 2a). The normalized quantity was called<br />
the optomotor index (OMI). Relatively long stimulus durations<br />
were chosen because they produced clear shifts in the distribution<br />
<strong>of</strong> fish even with very weak stimuli, but long integration times were<br />
not necessary to produce the optomotor response. By averaging<br />
over many trials, we could detect behavioral responses to stimulus<br />
presentations lasting less than one second (Fig. 1a), suggesting<br />
that some fish responded almost immediately to the <strong>motion</strong> presented.<br />
Although the fish seemed to follow a <strong>motion</strong> signal in the<br />
movies, it was possible that they were tracking features such as light<br />
or dark regions or edges that were being displaced. We did an experiment<br />
to show that the optomotor response is truly a response to<br />
<strong>motion</strong>. A <strong>motion</strong> display was shown <strong>of</strong> a sine wave grating that<br />
1128 nature neuroscience • volume 3 no 11 • november 2000
© 2000 Nature America Inc. • http://neurosci.nature.com<br />
articles<br />
a<br />
b<br />
moved with constant velocity, but was reset every 200 ms to its original<br />
position, thus never moving through more than one sixth <strong>of</strong><br />
its spatial period (Fig. 1b). If the fish were tracking features, we<br />
would expect little or no response from them, because there was<br />
no net displacement <strong>of</strong> the bars. However, the fish swam vigorously<br />
with the direction <strong>of</strong> smooth movement (OMI ± s.d; 0.67 ± 0.09),<br />
suggesting that they indeed detected <strong>motion</strong> cues in the display.<br />
In a drifting square-wave grating (Fig. 2a), <strong>Fourier</strong> <strong>motion</strong> energy<br />
<strong>and</strong> edges or other features all move in the same direction. To<br />
determine which attribute <strong>of</strong> the <strong>motion</strong> stimulus is detected <strong>by</strong><br />
the zebrafish optomotor system, we modified the square wave <strong>by</strong><br />
subtracting out the spatial fundamental 4 (Fig. 2b). In this ‘fluted<br />
square wave’ movie, the features <strong>of</strong> the stripes still moved to the<br />
left, but the <strong>Fourier</strong> energy contained in the dominant third spatial<br />
harmonic moved to the right. In this case, the fish saw <strong>motion</strong><br />
to the right. When we then subtracted the third harmonic, the fish<br />
saw the leftward moving fifth spatial harmonic (Fig. 2c). The contrast<br />
<strong>and</strong> apparent velocity <strong>of</strong> the third <strong>and</strong> fifth harmonic are one<br />
third <strong>and</strong> one fifth <strong>of</strong> the fundamental, respectively. As expected,<br />
the responses to the latter stimuli were only a fraction <strong>of</strong> the<br />
response to a square wave, but they were always consistent with a<br />
<strong>Fourier</strong> mechanism.<br />
We were concerned about spectral artifacts that were caused <strong>by</strong><br />
the jumpy animation necessary for the fluted square wave effect.<br />
Fig. 2. Psychophysical tests for the detection <strong>of</strong> <strong>Fourier</strong> <strong>motion</strong> <strong>by</strong><br />
zebrafish. Six different stimuli <strong>and</strong> the corresponding optomotor<br />
responses. The optomotor index (OMI) is a measure for the strength<br />
<strong>of</strong> the stimulus (Fig. 1). (a) A high-contrast square wave, in which each<br />
stripe subtends a visual angle <strong>of</strong> 60°. (b) The same square wave after<br />
subtraction <strong>of</strong> the fundamental <strong>Fourier</strong> component. (c) The same<br />
square wave after subtraction <strong>of</strong> fundamental <strong>and</strong> third harmonic. (d) A<br />
stimulus consisting <strong>of</strong> two superimposed 50% contrast gratings <strong>of</strong> relative<br />
spatial frequencies 3f <strong>and</strong> 4f. The resulting pattern has a fundamental<br />
spatial frequency <strong>of</strong> f. The 4f grating remains stationary, whereas the<br />
3f steps to the right, causing the contrast modulation, which has frequency<br />
f, to move to the left. (e) Phi <strong>motion</strong>. Drifting white bars subtending<br />
a visual angle <strong>of</strong> 33° on a gray background. (f) Reversed phi<br />
<strong>motion</strong>. The same stimulus as (e), but with every other frame reversed<br />
in contrast. Error bars, st<strong>and</strong>ard deviation <strong>of</strong> OMI between individual<br />
sets <strong>of</strong> stimulus presentations (n = 6 to 22). All stimuli were presented<br />
at four frames per second.<br />
© 2000 Nature America Inc. • http://neurosci.nature.com<br />
Fig. 1. The optomotor response <strong>of</strong> zebrafish larvae does not depend<br />
on long integration times or feature displacement. (a) The optomotor<br />
response is elicited <strong>by</strong> short stimulus presentations. Normalized difference<br />
in average position <strong>of</strong> fish (optomotor index, OMI) after short<br />
presentations <strong>of</strong> a square wave drifting in alternate directions. The<br />
stripes <strong>of</strong> the square wave subtended 60° <strong>of</strong> visual angle, <strong>and</strong> the frame<br />
update time was 40 ms. Upper error bars, st<strong>and</strong>ard deviation between<br />
trials; lower bars, 90% confidence intervals (n > 12). (b) The optomotor<br />
response is a response to <strong>motion</strong>. Space–time plot <strong>of</strong> a movie in<br />
which a drifting sinusoidal grating with 60º visual angle per cycle moving<br />
at 0.8 Hz is reset to its original position every 200 ms. The frame<br />
update time is 50 ms. The stimulus evokes robust optomotor behavior<br />
(OMI ± s.d., 0.67 ± 0.09, n = 9).<br />
However, in all three cases discussed, these artifacts would have net<br />
<strong>motion</strong> energy in the direction opposite to the direction <strong>of</strong> swimming,<br />
<strong>and</strong> so could only serve to obscure the effect seen. In another<br />
study, a cleaner stimulus consisting only <strong>of</strong> equal-contrast third <strong>and</strong><br />
fourth harmonics was used 7 . If animated in leftward jumps <strong>of</strong> one<br />
quarter the spatial period, then the third harmonic stepped in quarter-phase<br />
to the right, <strong>and</strong> the fourth harmonic was stationary,<br />
whereas the pattern’s features stepped to the left (Fig. 2d). The fish<br />
followed the third harmonic to the right, indicating that in this <strong>and</strong><br />
the above cases, <strong>Fourier</strong> cues were dominant over feature cues.<br />
To further explore what cues induce <strong>motion</strong> perception in<br />
zebrafish, we used another test from human psychophysics 3,17,18 .<br />
White stripes jumping leftward on a gray surround (Fig. 2e) elicited<br />
an optomotor response to the left. In the ‘reversed-phi’ movie, the<br />
stripes reversed polarity on each consecutive movie frame, alternately<br />
appearing white <strong>and</strong> black (Fig. 2f). The salient features <strong>of</strong><br />
the display, including edges <strong>and</strong> objects, still moved to the left, but the<br />
highest-amplitude <strong>Fourier</strong> component moved to the right 4 . In agreement<br />
with a <strong>motion</strong> energy-based model, the fish responded to this<br />
stimulus <strong>by</strong> swimming to the right, in the direction opposite to stripe<br />
movement.<br />
Optomotor responses to <strong>non</strong>-<strong>Fourier</strong> <strong>motion</strong><br />
Our experiments showed that zebrafish use <strong>Fourier</strong> (first-order)<br />
cues to determine the direction <strong>of</strong> <strong>motion</strong>, raising the question <strong>of</strong><br />
1129 nature neuroscience • volume 3 no 11 • november 2000
© 2000 Nature America Inc. • http://neurosci.nature.com<br />
how fish would respond to a <strong>motion</strong> display that lacks <strong>motion</strong><br />
energy. One such second-order stimulus 10 has been used widely in<br />
primate psychophysics. A dynamic r<strong>and</strong>om noise pattern is modulated<br />
in contrast <strong>by</strong> a coarse sine wave that drifts to the right. Such<br />
a stimulus is said to be drift-balanced, that is, at any spatial frequency<br />
range, one would expect equal numbers <strong>of</strong> leftward- <strong>and</strong><br />
rightward-moving components. Before determining whether the<br />
fish follow the drifting contrast envelope, we had to confirm that<br />
this stimulus was a true second-order display.<br />
One potential problem was that first-order artifacts may be<br />
introduced because <strong>of</strong> <strong>non</strong>-linear properties <strong>of</strong> the peripheral visual<br />
system or the computer display 19,20 . Such unwanted luminance<br />
artifacts would move with the contrast envelope <strong>and</strong> generate firstorder<br />
<strong>motion</strong>. We eliminated this possibility with a <strong>motion</strong>-nulling<br />
technique (Z-L. Lu & G. Sperling, ARVO Abstr., 1047, 1999) 20 , that<br />
removed first-order signals from the stimulus (Fig. 3a). As a control,<br />
movie frames containing contrast-modulated (CM) noise patterns<br />
were interleaved with luminance-modulated (LM) gratings <strong>of</strong><br />
the same spatial frequency (Fig. 3a, insets). Two extreme examples<br />
are shown. In the first example (Fig. 3a, left), the low-contrast<br />
regions appear very dark, as would be the case for an expansive<br />
distortion early in the visual pathway, <strong>and</strong> these can be joined with<br />
© 2000 Nature America Inc. • http://neurosci.nature.com<br />
articles<br />
Fig. 3. Contrast-defined second-order <strong>motion</strong> evokes optomotor<br />
behavior in zebrafish. (a) Control stimulus used to measure firstorder<br />
cues in a contrast-modulated r<strong>and</strong>om dot array. A 4-frame<br />
movie was devised in which the contrast-modulated grating was alternated<br />
with a high-contrast sine wave at the spatial frequency <strong>of</strong> the<br />
contrast envelope (75° per cycle). The peak <strong>of</strong> the sine wave/contrast<br />
envelope was shifted one quarter-cycle to the right between each<br />
frame. A sinusoidal correction grating <strong>of</strong> variable amplitude was added<br />
to the odd-numbered frames. Insets, two extreme amplitudes <strong>of</strong> the<br />
correction grating, –127.5 (left) <strong>and</strong> +92.5 (right) look-up table units.<br />
OMI is plotted as a function <strong>of</strong> the added correction. The fish either<br />
swam to the right or to the left, <strong>and</strong> their response could be canceled<br />
(that is, OMI = 0) at some intermediate amplitude. The carrier dots<br />
subtended a visual angle <strong>of</strong> 5.5°. Error bars, st<strong>and</strong>ard deviation <strong>of</strong> the<br />
OMI between individual stimulus presentations (n = 2 or 3). Each<br />
stimulus was presented for 60 seconds at 1 Hz (4 frames per second).<br />
(b) OMI varies with envelope spatial frequency (black line, downward<br />
pointing error bars), when temporal frequency is held constant at 2<br />
Hz, <strong>and</strong> the frame update time is 125 ms. Carrier pixels subtend 5.5°.<br />
The tuning is different than for a 5% contrast luminance grating (dotted<br />
line, upward pointing error bars). Error bars, 90% confidence<br />
intervals (n ≥ 10, here <strong>and</strong> in c–e). Confidence intervals for the control<br />
movie under the same conditions are shown in dark gray. Both<br />
control <strong>and</strong> test movies are presented for 30 seconds at 8 to 32<br />
frames per second. (c) Similar to (b), but the velocity is held constant<br />
at 55° per second. Note the difference in tuning between the firstorder<br />
<strong>and</strong> second-order responses. (d) Keeping envelope spatial frequency<br />
constant at 87° per cycle <strong>and</strong> moving the envelope with<br />
temporal frequency 2 Hz <strong>and</strong> a frame update time <strong>of</strong> 125 ms, we measured<br />
the variation <strong>of</strong> OMI with carrier pixel size (black line). Pixels<br />
subtending 2.7–22° (2 to 16 screen pixels) were used. (e) Holding<br />
velocity <strong>and</strong> spatial frequency constant as in (d), we varied the frame<br />
rate <strong>and</strong> animation smoothness. Ninety percent confidence intervals<br />
for the control movie played under the same condition are shown. In<br />
some cases, both noise <strong>and</strong> envelope position were updated every<br />
frame (white bars), <strong>and</strong> in others, noise was updated every frame, but<br />
the envelope was only updated eight times per second (gray bars).<br />
Four-fold smoother animation <strong>of</strong> the envelope significantly increased<br />
OMI, even if the noise was updated at the faster rate (*one-tailed ttest,<br />
p < 0.01). At 32 frames per second, the smoothly animated contrast<br />
envelope could elicit an optomotor response, even if its position<br />
was reset every 187.5 ms, before it had moved through a third <strong>of</strong> its<br />
spatial period (white bar, 32*).<br />
the dark stripes in the LM frames to generate a rightward moving<br />
pattern. As expected, this stimulus drove fish to the right. In the<br />
second example (Fig. 3a, right), the low-contrast regions appear<br />
very bright (as for a compressive distortion). Bright bars appeared<br />
to step to the left <strong>and</strong> drove the fish to the left. By adding appropriate<br />
sinusoidal gratings to the CM frames, we titrated the fishes’<br />
response to zero, demonstrating that any first-order artifacts were<br />
canceled out 20 . To create our test movie, we replaced the LM frames<br />
<strong>of</strong> the control movie with (corrected) CM frames. This <strong>motion</strong><br />
display still evoked optomotor responses (Fig. 3b), which must be<br />
induced <strong>by</strong> second-order cues.<br />
Many models <strong>of</strong> second-order <strong>motion</strong> perception involve a<br />
full-wave rectification <strong>of</strong> the luminance pattern, followed <strong>by</strong> a<br />
<strong>motion</strong> energy calculation 6,10 . This would tend to reduce the spatial<br />
resolution <strong>of</strong> the second-order system, raising the question <strong>of</strong><br />
whether the hypothetical second-order <strong>motion</strong> pathway in<br />
zebrafish responds to the same range <strong>of</strong> stimuli as the first-order<br />
pathway. The OMI was determined for CM (second-order) <strong>and</strong><br />
LM (first-order) gratings with different spatial frequencies, while<br />
either the temporal frequency (2 Hz; Fig. 3b) or the velocity<br />
(55° per s; Fig. 3c) was held constant. The CM grating gave a much<br />
lower response than the LM grating at high spatial frequencies,<br />
nature neuroscience • volume 3 no 11 • november 2000 1130
© 2000 Nature America Inc. • http://neurosci.nature.com<br />
articles<br />
but a relatively higher response at low spatial frequencies, consistent<br />
with the above models. The OMI varied very little with carrier<br />
pixel size (Fig. 3d), although it dropped when the pixel size<br />
was significantly below the fishes’ expected limit <strong>of</strong> resolution, six<br />
degrees 16 . In all experiments <strong>and</strong> conditions, we ensured that the<br />
response to the control movie was zero.<br />
Finally, we tried to enhance the response to the second-order<br />
stimulus <strong>by</strong> animating the CM gratings more smoothly at the higher<br />
velocities, although the responses were always weaker than during<br />
a high contrast LM movie (Fig. 3e). Increasing the frame update rate<br />
introduced an additional variable, flicker rate, which may also<br />
increase the response <strong>of</strong> the fish <strong>by</strong> making the stimulus more salient.<br />
The noise carrier was updated every 125, 62.5 or 31.25 ms, <strong>and</strong> the<br />
CM grating, which always moved with the same mean velocity, was<br />
either updated at the same rate (Fig. 3e, white bars) or every 125 ms<br />
(gray bars). The higher rates <strong>of</strong> flicker did not significantly enhance<br />
the strength <strong>of</strong> the <strong>motion</strong> stimulus per se, unless the smoothness<br />
<strong>of</strong> the grating animation also improved. This experiment suggested<br />
that spatial contrast is the salient <strong>motion</strong> cue in this stimulus. It<br />
also provided evidence that responses to second-order stimuli are<br />
true <strong>motion</strong> responses, as smoother <strong>motion</strong> with the same target<br />
displacement gave a larger response. To further verify this, we<br />
replayed the most smoothly animated movie, but reset it every 187.5<br />
ms, so that the net displacement was zero. The fish still responded<br />
(Fig 3e; white bar, right).<br />
To determine whether contrast-modulated <strong>motion</strong> was the<br />
only type <strong>of</strong> second-order <strong>motion</strong> that the fish could see, we<br />
a<br />
b<br />
© 2000 Nature America Inc. • http://neurosci.nature.com<br />
showed two other second-order stimuli, to which the fish gave a<br />
consistent response (Fig. 4). The first stimulus, which was driftbalanced,<br />
consisted <strong>of</strong> a static array <strong>of</strong> black <strong>and</strong> white pixels<br />
(Fig. 4a). Between movie frames, the black pixels <strong>of</strong> every ninth<br />
column turned white, <strong>and</strong> white pixels turned black. In consecutive<br />
frames, these flicker-defined stripes drifted column-<strong>by</strong>-column<br />
to the left, causing humans to perceive a moving illusory<br />
column. Strikingly, the fish also followed the flickering column<br />
to the left (OMI ± s.d., 0.51 ± 0.03), in the strongest <strong>of</strong> all the<br />
second-order responses observed. A simple brightness <strong>non</strong>-linearity,<br />
or even full-wave rectification, were not enough to explain<br />
this response.<br />
We then presented a movie <strong>of</strong> drifting columns defined <strong>by</strong><br />
oblique sinusoidal gratings, oriented alternately at +45° <strong>and</strong> –45°<br />
(Fig. 4b, left). The adjacent gratings created an illusory contour,<br />
which humans could clearly see. The phase <strong>of</strong> the grating was r<strong>and</strong>omized<br />
in each column between every frame to eliminate firstorder<br />
cues. The fish swam in the same direction as the columns<br />
were drifting (Fig. 4b, left), but it was unclear from this experiment<br />
whether the fish were following the regions <strong>of</strong> similar orientation,<br />
the illusory contours between the columns, or the<br />
discontinuities, which consisted <strong>of</strong> local regions <strong>of</strong> high spatial frequency.<br />
When the orientation in each column was switched<br />
between frames, the response was eliminated (Fig. 4b, right). This<br />
suggests that the fish were not simply following the local components<br />
<strong>of</strong> high spatial frequency or the illusory contours, but were<br />
sensitive to the orientations on either side <strong>of</strong> the break. These<br />
experiments demonstrated again that fish larvae are able to respond<br />
to <strong>motion</strong> in the absence <strong>of</strong> <strong>Fourier</strong> signals.<br />
DISCUSSION<br />
We used a series <strong>of</strong> psychophysical tests to dissect the properties<br />
<strong>of</strong> <strong>motion</strong> processing in larval zebrafish, <strong>and</strong> showed that these<br />
properties are similar to those <strong>of</strong> primates. We were interested in<br />
which attributes <strong>of</strong> a moving stimulus are detected <strong>by</strong> the optomotor<br />
pathway <strong>of</strong> this species, <strong>and</strong> whether fundamental differences<br />
in visual processing exist between teleost fish <strong>and</strong> higher<br />
mammals. The fluted square wave (Fig. 2b) <strong>and</strong> reversed-phi (Fig.<br />
2f) tests show that zebrafish <strong>motion</strong> detection relies on <strong>Fourier</strong><br />
<strong>motion</strong>-energy (if available) to determine direction <strong>of</strong> a moving<br />
stimulus. Edges or other features have a minor role, if any, if their<br />
displacement is pitted against that <strong>of</strong> the <strong>Fourier</strong> signal.<br />
We show that the fishes’ behavior was a response to <strong>motion</strong><br />
information in the stimuli, not merely to the displacement <strong>of</strong> a<br />
Fig. 4. Flicker-defined <strong>and</strong> orientation-defined second-order <strong>motion</strong><br />
evokes optomotor behavior in zebrafish. (a) A second-order <strong>motion</strong><br />
stimulus, consisting <strong>of</strong> a r<strong>and</strong>om dot pattern in which a region <strong>of</strong> flicker<br />
moves to the left. Columns <strong>of</strong> dots spaced at intervals <strong>of</strong> nine dotwidths<br />
reversed in contrast between each frame, <strong>and</strong> the array <strong>of</strong><br />
columns that were reversing shifted one dot-width to the left. The dots<br />
subtended a visual angle <strong>of</strong> 5.5°. (b) Two stimuli were presented to the<br />
larvae, each for 60 seconds. The first movie (left) consisted <strong>of</strong> vertical<br />
columns subtending a visual angle <strong>of</strong> 62°. The columns contained sinusoidal<br />
gratings with a spatial frequency <strong>of</strong> 27° per cycle, oriented at 45°<br />
to the column boundaries. The grating in each column was orthogonal<br />
to that in neighboring columns. Its phase was r<strong>and</strong>omized between<br />
each frame. The column boundaries shifted to the left, <strong>and</strong> the movie<br />
repeated every 25 frames. The second movie (right) was created <strong>by</strong><br />
taking two repeats <strong>of</strong> the first movie <strong>and</strong> flipping every even frame vertically.<br />
The OMI for the fish was calculated as in Fig. 1, <strong>and</strong> error bars<br />
show the st<strong>and</strong>ard deviation for individual sets <strong>of</strong> stimulus presentations<br />
(n = 16 <strong>and</strong> 7, respectively).<br />
1131 nature neuroscience • volume 3 no 11 • november 2000
© 2000 Nature America Inc. • http://neurosci.nature.com<br />
visual target. The fish responded strongly to a movie in which<br />
<strong>motion</strong>, but not displacement <strong>of</strong> features, gives a directional cue<br />
(Fig. 1b). The fish never swam rigidly in phase with a moving grating,<br />
<strong>and</strong> indeed followed gratings that moved at up to<br />
1100° per s, many times faster than they swim. They responded<br />
preferentially to <strong>motion</strong> energy when it was placed in competition<br />
with feature displacement (Fig. 2). Our demonstration <strong>of</strong> secondorder<br />
<strong>motion</strong> detection is difficult to reconcile with a model in<br />
which the fish merely track a jumping target.<br />
After having shown that zebrafish larvae extract <strong>Fourier</strong>-<strong>motion</strong><br />
energy if available, we wanted to determine whether we could find<br />
indications <strong>of</strong> primate-like ‘higher-level’ <strong>motion</strong> processing, <strong>of</strong><br />
which the neural substrate is assumed to be in the visual cortex.<br />
We found optomotor responses to three types <strong>of</strong> second-order<br />
<strong>motion</strong> displays, which lack <strong>Fourier</strong> cues. The fish larvae saw a<br />
contrast envelope that moved across a r<strong>and</strong>om array <strong>of</strong> twinkling<br />
dots (Fig. 3), a sweeping column <strong>of</strong> r<strong>and</strong>om black-<strong>and</strong>-white dots<br />
that reversed the dots’ luminance (Fig. 4a), or a moving grating<br />
whose borders were defined <strong>by</strong> obliquely oriented stripes (Fig. 4b).<br />
We eliminated any luminance artifacts created <strong>by</strong> the monitor or <strong>by</strong><br />
early <strong>non</strong>-linearity in the fish visual system.<br />
The zebrafish visual system is equipped with neuronal mechanisms<br />
to process higher-order <strong>motion</strong>. The behavior <strong>of</strong> the fish in<br />
response to our artificial, computer-animated movies was always<br />
qualitatively consistent with the human interpretation <strong>of</strong> the<br />
<strong>motion</strong> signal. Are the mechanisms <strong>of</strong> <strong>motion</strong> processing conserved<br />
between vertebrates at the circuit level? If so, the site <strong>of</strong> processing<br />
may also be conserved. Many second-order features such<br />
as variations in spatial <strong>and</strong> temporal contrast can modulate the<br />
responses <strong>of</strong> retinal cells 21 . Although it is <strong>of</strong>ten assumed that the<br />
retina encodes luminance information linearly, there is a secondorder<br />
output from the retina 22 , which could provide an input to<br />
the classical ‘first-order’ <strong>motion</strong> detection system, without the need<br />
for further processing. This is still consistent with the models in<br />
which second-order <strong>motion</strong> is extracted from a rectified first-order<br />
signal 6,10 , but places the site <strong>of</strong> this processing outside the cortex,<br />
perhaps within the retina. Our results, together with the demonstration<br />
<strong>of</strong> illusory contour perception in a bird 23 , suggest that<br />
complex processing <strong>of</strong> visual scenes is not restricted to primates<br />
<strong>and</strong> other mammals, but may instead be an ability <strong>of</strong> all vertebrates.<br />
Further research with other methods is needed to map the<br />
<strong>motion</strong> pathway in the zebrafish brain.<br />
The ability to extract all available <strong>motion</strong> cues is a crucial asset<br />
for the animals to survive in their natural environment. The optomotor<br />
response, used in this study as a behavioral indicator <strong>of</strong><br />
<strong>motion</strong> perception, has an important function: it helps animals<br />
maintain their location in a fast-flowing stream <strong>and</strong> prevents them<br />
from being carried downstream, or from being sucked into the<br />
mouth <strong>of</strong> predators. The vestibular <strong>and</strong> lateral line systems <strong>of</strong> fish<br />
cannot detect movement at a constant velocity, <strong>and</strong> a muddy<br />
riverbed or moving vegetation may not present a clear first-order<br />
cue to <strong>motion</strong>. Reflective particles, such as s<strong>and</strong> grains in the river<br />
bed, may present a twinkling second-order stimulus, as they are<br />
stirred up <strong>by</strong> flowing water <strong>and</strong> fish are swept above them. We suggest<br />
that the psychophysical displays used here, although highly<br />
abstracted, represent real <strong>and</strong> behaviorally significant features <strong>of</strong><br />
the animal’s visual world 24 .<br />
Our results may relate to ongoing attempts to study the genetic<br />
underpinnings <strong>of</strong> zebrafish visual functions 2,25,26 . Our assay<br />
allows us to look at the behavior <strong>of</strong> hundreds <strong>of</strong> fish simultaneously,<br />
<strong>and</strong> thus might be used as an assay in systematic genetic<br />
screens for visual-system mutations, similar to the successful<br />
screens for embryonic mutations in this species 27,28 .<br />
© 2000 Nature America Inc. • http://neurosci.nature.com<br />
METHODS<br />
Movies were shown on a computer monitor (832 × 624 pixels, 75 Hz, 256<br />
gray levels) using a Macintosh G3 computer. The <strong>non</strong>-linearity <strong>of</strong> the monitor<br />
output was measured with a photometer, <strong>and</strong> corrected using a look-up<br />
table. Movies were programmed using the macro language <strong>of</strong> NIH Image,<br />
Version 1.6. For each experiment, 100 to 200 larvae (7 days old) were placed<br />
into 5 shallow, 230-mm-long acrylic tanks. The fish could swim back <strong>and</strong><br />
forth in the tanks, 10–20 mm above the screen. A Kodak DC290 digital<br />
camera (Eastman Kodak) was used to record the distribution <strong>of</strong> fish, <strong>and</strong><br />
could send an image to the computer every 25 seconds. The results were<br />
analyzed <strong>of</strong>fline using the ‘analyze particles’ function <strong>of</strong> NIH Image, following<br />
background subtraction. This function finds all objects in a given<br />
size range in a thresholded image <strong>and</strong> returns their coordinates. After each<br />
test stimulus, the fish were driven back to the center <strong>of</strong> the tank <strong>by</strong> a strong<br />
optomotor stimulus (a converging sine wave, subtending 118° per cycle,<br />
played at 2 Hz). Each stimulus was presented for 30 seconds, except in the<br />
illusory contour movies, which were played for 60 seconds because it took<br />
longer for a clear response to accumulate (Fig. 4b).<br />
Visual angles were calculated for a fish 15 mm from the monitor screen.<br />
The proximity <strong>of</strong> the fish to the screen meant that the retinal image <strong>of</strong> distant<br />
portions <strong>of</strong> gratings would subtend fewer degrees per cycle than the<br />
portion viewed from directly above. However, we observed that the fish do<br />
not respond to <strong>motion</strong> occurring outside about 20° from the vertical. Within<br />
this 40° response range, the period <strong>of</strong> a sine wave does not vary <strong>by</strong> more<br />
than 4%.<br />
The optomotor index (OMI) was calculated as follows. The mean displacement<br />
<strong>of</strong> the fish from the center was averaged for two stimulus presentations,<br />
one forward <strong>and</strong> one backward. Each backward–forward cycle<br />
was repeated 4 to 29 times. The response strength (in cm traveled) was then<br />
normalized to response to a drifting square wave (Fig. 1a), which is assumed<br />
to be a strong stimulus. A positive OMI value indicates that the movie causes<br />
the fish to swim to the left. A negative OMI value indicates a response to<br />
the right. The movies can be obtained from the authors.<br />
ACKNOWLEDGEMENTS<br />
The authors thank Mark Churchl<strong>and</strong> <strong>and</strong> Nick Priebe for reading the<br />
manuscript, <strong>and</strong> Jonathan Horton <strong>and</strong> Dan Adams for comments. H.B. is a<br />
David <strong>and</strong> Lucile Packard <strong>and</strong> an Alfred P. Sloan fellow. This work was<br />
supported <strong>by</strong> the HHMI Research Resources Program <strong>and</strong> <strong>by</strong> seed money from<br />
the Department <strong>of</strong> Physiology, UCSF. M.O. <strong>and</strong> M.S. were supported <strong>by</strong><br />
predoctoral fellowships from HHMI <strong>and</strong> NSF, respectively.<br />
RECEIVED 29 JUNE; ACCEPTED 7 SEPTEMBER 2000<br />
articles<br />
1. Clark, D. T. Visual responses in developing zebrafish. (Univ. <strong>of</strong> Oregon Press,<br />
Eugene, Oregon, 1981).<br />
2. Neuhauss, S. C. et al. Genetic disorders <strong>of</strong> vision revealed <strong>by</strong> a behavioral<br />
screen <strong>of</strong> 400 essential loci in zebrafish. J. Neurosci. 19, 8603–8615 (1999).<br />
3. Anstis, S. M. Phi movement as a subtraction process. Vision Res. 10,<br />
1411–1430 (1970).<br />
4. Adelson, E. H. & Bergen, J. R. Spatiotemporal energy models for the<br />
perception <strong>of</strong> <strong>motion</strong>. J. Opt. Soc. Am. A 2, 284–299 (1985).<br />
5. Reichardt, W. Autokorrelationsauswertung als funktionsprinzip des<br />
zentralnervensystems. Z. Naturforschung 12b, 447–457 (1957).<br />
6. Wilson, H. R., Ferrera, V. P. & Yo, C. A psychophysically motivated model for<br />
two-dimensional <strong>motion</strong> perception. Vis. Neurosci. 9, 79–97 (1992).<br />
7. Hammett, S. T., Ledgeway, T. & Smith, A. T. Transparent <strong>motion</strong> from<br />
feature- <strong>and</strong> luminance-based processes. Vision Res. 33, 1119–1122 (1993).<br />
8. Ramach<strong>and</strong>ran, V. S., Rao, V. M. & Vidyasagar, T. R. Apparent movement<br />
with subjective contours. Vision Res. 13, 1399–1401 (1973).<br />
9. Cavanagh, P. & Mather, G. Motion: the long <strong>and</strong> short <strong>of</strong> it. Spat. Vis. 4,<br />
103–129 (1989).<br />
10. Chubb, C. & Sperling, G. Drift-balanced r<strong>and</strong>om stimuli: a general basis for<br />
studying <strong>non</strong>-<strong>Fourier</strong> <strong>motion</strong> perception. J. Opt. Soc. Am. A 5, 1986–2007<br />
(1988).<br />
11. Ohzawa, I. Do animals see what we see? Nat. Neurosci. 2, 586–588 (1999).<br />
12. Albright, T. D. Form-cue invariant <strong>motion</strong> processing in primate visual<br />
cortex.Science255, 1141–1143 (1992).<br />
13. Zhou, Y. X. & Baker, C. L. A processing stream in mammalian visual cortex<br />
neurons for <strong>non</strong>-<strong>Fourier</strong> responses.Science261, 98–101 (1993).<br />
nature neuroscience • volume 3 no 11 • november 2000 1132
© 2000 Nature America Inc. • http://neurosci.nature.com<br />
articles<br />
14. Smith, A. T., Greenlee, M. W., Singh, K. D., Kraemer, F. M. & Hennig, J. The<br />
processing <strong>of</strong> first- <strong>and</strong> second-order <strong>motion</strong> in human visual cortex assessed<br />
<strong>by</strong> functional magnetic resonance imaging (fMRI). J. Neurosci. 18,<br />
3816–3830 (1998).<br />
15. Baker, C. L. Central neural mechanisms for detecting second-order <strong>motion</strong>.<br />
Curr. Opin. Neurobiol. 9, 461–466 (1999).<br />
16. Easter, S. S. & Nicola, G. N. The development <strong>of</strong> vision in the zebrafish<br />
(Danio rerio). Dev. Biol. 180, 646–663 (1996).<br />
17. Anstis, S. M. & Rogers, B. J. Illusory reversal <strong>of</strong> visual depth <strong>and</strong> movement<br />
during changes <strong>of</strong> contrast. Vision Res. 15, 957–961 (1975).<br />
18. Chubb, C. & Sperling, G. Two <strong>motion</strong> perception mechanisms revealed <strong>by</strong><br />
distance driven reversal <strong>of</strong> apparent <strong>motion</strong>. Proc. Natl. Acad. Sci. USA 86,<br />
2985–2989 (1989).<br />
19. Smith, A. T. & Ledgeway, T. Separate detection <strong>of</strong> moving luminance <strong>and</strong><br />
contrast modulations: fact or artifact? Vision Res. 37, 45–62 (1997).<br />
20. Scott-Samuel, N. E. & Georgeson, M. A. Does early <strong>non</strong>-linearity account for<br />
second-order <strong>motion</strong>? Vision Res. 39, 2853–2865 (1999).<br />
© 2000 Nature America Inc. • http://neurosci.nature.com<br />
21. Shapley, R. M. & Victor, J. D. The effect <strong>of</strong> contrast on the transfer properties<br />
<strong>of</strong> cat retinal ganglion cells. J. Physiol. (Lond.) 285, 275–298 (1978).<br />
22. Demb, J. B., Haarsma, L., Freed, M. A. & Sterling, P. Functional circuitry <strong>of</strong> the<br />
retinal ganglion cell’s <strong>non</strong>linear receptive field.J. Neurosci.19, 9756–9767 (1999).<br />
23. Nieder, A. & Wagner, H. <strong>Perception</strong> <strong>and</strong> neuronal coding <strong>of</strong> subjective<br />
contours in the owl. Nat. Neurosci. 2, 660–663 (1999).<br />
24. Derrington, A. M. & Henning, B. G. Linear <strong>and</strong> <strong>non</strong>-linear mechanisms in<br />
pattern vision.Curr. Biol.3, 800–803 (1995).<br />
25. Brockerh<strong>of</strong>f, S. E. et al. A behavioral screen for isolating zebrafish mutants<br />
with visual system defects. Proc. Natl. Acad. Sci. USA 92, 10545–10549 (1995).<br />
26. Baier, H. et al. Genetic dissection <strong>of</strong> the retinotectal projection. Development<br />
123, 415–425 (1996).<br />
27. Haffter, P. et al. The identification <strong>of</strong> genes with unique <strong>and</strong> essential<br />
functions in the development <strong>of</strong> the zebrafish, Danio rerio. Development 123,<br />
1–36 (1996).<br />
28. Driever, W. et al. A genetic screen for mutations affecting embryogenesis in<br />
zebrafish.Development123, 37–46 (1996).<br />
1133 nature neuroscience • volume 3 no 11 • november 2000