PCWA-L 480.pdf - PCWA Middle Fork American River Project ...
PCWA-L 480.pdf - PCWA Middle Fork American River Project ...
PCWA-L 480.pdf - PCWA Middle Fork American River Project ...

Create successful ePaper yourself
Turn your PDF publications into a flip-book with our unique Google optimized e-Paper software.
) .<br />
,.<br />
For Windows® 3.1, Windows® '95 and Windows® NT
)<br />
Bioenergetics Overview<br />
The field of fish bioenergetios includes temporal soales that range from tl10se of evolutionary time<br />
to oellular metabolism (Tytler and Calow 1985). It also inoludes spatial scales ranging from<br />
nutrition and growth in controlled aquaculture systems (Jobling 1994) to predator-prey systems in<br />
the largest eoologioal oontext (Adams and Breck 1990). Among the several reviews of the.fIeld,<br />
those by J. R. Brett offer the most insightful combination of basio laboratory studies and tl1eir<br />
applioation in the context most pertinent to fisheries science (Brett and Groves 1979), We<br />
reoommend Brett's lead chapter (Brett 1995) in the new volume edited by Groot et al. (1995) for a<br />
thorough review of the extensive work conducted on energetios of Pacific salmonids and for an<br />
insi,ghtfUI assessment of areas where knowledge of energetics should be improved.<br />
The underpinnings of energetics have a firm theoretical base in the laws ofthermodynamics<br />
(Kleiber 1975). Working from an energy budget requires that you satisfy the terms of a simple<br />
equation; outputs must equal inputs and the budget must balance. As detailed in Chapter 2, the<br />
terms of the energy budget for fiShes are well known and eacl1 can be measured independentiy,<br />
The model allows the user to specify the important external regUlators; temperature and diet. For<br />
fisl1es: the most easily measured component of the energy budgeting process is expressed as<br />
growth. Growth integrates the array of environmental variables affecting an individual fish, Thus<br />
the evidence proVided in the observed growth rate is the rich and varied foundation of scientific<br />
inquiry and the basis for better understanding,<br />
The modeling approach presented In this manual derived from the extension of energetics<br />
principles used in eoosystem-scale 'models of trophio Interactions developed during the<br />
International Biologioal Programme (Kitchell et al. 1974). These models focused on biomass<br />
dynamics. They often inoluded formulations requiring an estimate of carrying capaoity whioh was<br />
used to characterize density-dependent constraints for growth rates of a given trophic level. While<br />
those kinds of models have utility in an ecosystem context, they had three Important shortcomings<br />
when applied to fishes. First, units of biomass per area or volume did not allow for resolution of<br />
cause and effeot at the species or indiVidual scale. After all, it is individual fish that feed, grow,<br />
reproduce and die. Further, as a fish g rows from first-feeding larvae to reproductive adUlt; it may<br />
ascend through three or four trophic levels. Second, biomass models did not allow an effective<br />
interface with either the long history of population-based models In fisheries science or the models<br />
of predator-prey interactions developed in the eoological sciences. Third, biomass models<br />
required an estimate of environmental oarrying capaoity. The latter is dlffioult to do and, more<br />
importantly, likely to change as a oonsequence of the eoologioal effects due to fishery exploitation<br />
and/or anthropogenic effects on fish habitats. '<br />
An alternative to biomass models is an energetios-based approaoh focused on the prooe,sses that<br />
regulate growth by indiVidual fish (Kitohell et al. 1977). This model assembled individuals in agaor<br />
size-based populations, separated the 'agents of mortality (natural vs. fishing) and specified the<br />
trophio ontogeny of predator-prey Interaotions. It fooused on using the kinds of data most<br />
frequentiy collected by biologists - the habitat that is occupied (thermal history), size at age '<br />
,(growth ourves), stomaoh contents, size or age at sexual maturity, and size- or age-related<br />
mortality rates, The development of size- or age-based oohorts is elabo'rated In Chapter 3.
)<br />
Bioenergetics Overview<br />
1.1 The Modeling Strategy<br />
1-2<br />
Starting the process with observed growth rate is different from that of many kinds of modeling<br />
practices. rn this case, the strategy of modei building is based on specifying rules that define the<br />
limit conditions, Le., the maximum and minimum possible rates of growth for members of a<br />
population. The physiological pararl!eters used to represent the rules derive from'readily and ottmeasured<br />
processes such as temperature dependence, thermal tolerance, thermal preference<br />
size dependence, assimilation efficiency, etc., that can be accurately measured in the laborato;y..<br />
Those physiological parameters are assembled as empirical rules that define the effect of<br />
temperature, body size and food quality on maximum feeding rates. 'The minimum is similarly<br />
defined by rules describing the effect of temperature and body size on metabolic rates when food<br />
consumption is set to zero. These limits define the boundaries of the scope for growth. Observed<br />
growth is somewhere between those limits and allows the user to estimate how that growth rate is<br />
being regUlated.<br />
The hierarchy of energy allocation Is an important'component of this modeling approach.<br />
Consumed.energy is first alioCEited to catabolic processes (maintenance and activity metabolism),<br />
then to waste losses (feces, urine and specific dynamic action) and that lett over is allocated to<br />
somatic storage (body growth and gonad development). This hierarchy is analogous to practical<br />
economics. The first costs paid are those for rent or mortgage (metabolism)that sustain the<br />
organism. The second set of costs (waste losses) are like taxes -they are proportional to income'<br />
(food consumption) and must be paid. The energy resource remaining. may then be allocated to<br />
savings (growth) or invested in the next generation (gonad development). In an ecological or .<br />
evoiutionary context, it is easy to imagine selection for behaviors that maximize benefits (growth<br />
rate or gonad development) and minimize costs. Like an account balance, a record of growth<br />
reveals how well the organism has resolved the complexities of its environment<br />
In a thorough review' of previous energetics work, Brett and Groves (1979) presented a<br />
generalization about energy budgets for two ciasses of fishes. if the energy budgetis stated in the<br />
follOWing terms:<br />
Energy Consumed'=' Respiration + Waste + Growth,<br />
and normalized 10 percentages when energy consumption =100, then fishes. growing at "typical"<br />
rates would have energy budgets approximated as below.<br />
For carnivores:<br />
For herbivores:<br />
Consumption = Respiration + Waste + Growth<br />
100<br />
100<br />
=<br />
=<br />
44<br />
37<br />
+ 27 + 29<br />
+ 43 + 20<br />
These budgets reveal two important features. First, as expected, herbivores exhibit lower growth<br />
rates and higher waste-loss rates per unit of energy consumed. That is the logicai consequence of<br />
eating foods of Jowerenergy density and higher Indigestible content Second, both types of fishes<br />
demonstrate high rates of ·growth efficiency compared to those known for mammals and·birds.<br />
Although.these budgets can serve as a first approximation, the 95% confidence Intervals for each<br />
component are substantial (e,g., plus or minus 20% of the mean). Of course, tile energy bUdget<br />
for an average fish in a typical habitat may be very different from that of fishes in some unique<br />
ecological context Fishes are known to exhibit among the highest growth efficiencies recorded<br />
(approaching 50%) and are known to exhlbtt strikingly negative energy budgets, as In the case of<br />
migrating salmon (Brett 1995). Note, too, that tile hierarchy of energy allocation operates In all<br />
cases. Growth efficiency is not a constant, and growth rates in fishes are highly variable.<br />
Observed growth is the integrated answer to a complex question about prey resources and
Bioenergetics Overview<br />
environmental conditions. Deducing the quantitative components of cause and effect Is the<br />
significant challenge. '<br />
in most of its applications, model users will seek an answer to questions about factors that<br />
constrain-growth (e.g., diet quality or environmental stressors) or use the measured growth to<br />
estimate how much effect a predator has had on Its prey populations. Assembled as a population,<br />
the model allows answers to those questions at the larger scales of ecological and management<br />
Interest. This approach doesnot provide for feedback to future generations. Predator or prey<br />
population dynamics are not represented. Those must be character[zed as slmulati(;ms using<br />
specified assumptions about prey availability, mortality rates and environmental conditions,<br />
We view the modeling process as having two general components. First is the "nljts-and-bolts"<br />
process of assembling the parameter tables and the input data. Much' of the former is available in<br />
the manual or formatted in ways that welcome site-specific input. Second is the "arts-and-crafts"<br />
process of structuring analyses in ways that pose key questions and proVide instructive answers.<br />
In these caSaS, It Is often valuable to use the modei as a way to create boundary conditions such<br />
as those for maXimum possibll3 growth or'formaintenance requirements. Using the model in this<br />
way allows it to serve as a "dedu'ctive engine" in the more creative and challenging process of<br />
science (Walters 19B6).<br />
1.2 Previous Applications<br />
This manual represents the third version of what appeared first as Hewett and Johnson (19B9,<br />
1992), which was sold(at cost) to more than 1,000 users and served as the basis tor severai<br />
score of shortcourses and workshops taught since 1988. That version was labeied the "Wisconsin<br />
model" (Ney 1993). As evidenced by the diversity of parameter tables presented in AppendiX A,<br />
previous uSes of this modeling approach are many and varied. They range from aulecological<br />
studies of highly active subtropical tunas (Boggs and Kitchell 1991) to those of the sedentary,<br />
siowly growing burbot (Rudstam et ai. 1995). They include omnivorous minnows (Schindler et a1.<br />
1993) and hyper-predaceous sea lampreys (Kitchell 1990). They provide estimates of<br />
zoopianktivory rates by small fishes in small lakes (Luecke et ai. 1990, Post 1990) and rates of<br />
piscivory by a guild of salmonids predators preying on an assemblage of forage species in Lake<br />
Michigan (Stewart and Ibarra 1991). They inclUde estimates of cannibalism (Rice and Cochran<br />
1984) and quantitativeestilnales linking three trophic levels (LaBar 1993). In addition, the<br />
framework has been modified to develop models for some invertebrates (Rudsiam 1989,<br />
Schneider 1992). '<br />
As summarized in Chapter 2, this model has been evaluated through a rigorous sensitivitY '<br />
analysis. Model resuits have also been compared to independently derived fieid data In several<br />
cases; those by Rice and Cochran (1984), Beauchamp et al. (1989) aod Hansson et al. (1996) are<br />
particuiarly instructive. The approach has been praised for ils promise and criticized for its<br />
inadequacies; both are represented In the proceedings of a recent symposium (Brandt and<br />
,Hartman 1993, Hansen etal. 1993). We encourage the process of rigorous evaluation because<br />
that represents the path to Improvements. The modei cahnot be wrong because it is based on a<br />
budget that must be right. It will improve in proportion to our ability to estimate the physiological<br />
parameters'that regulate growth and the errors or bias of data employed as inputs. .<br />
This version of the model includes several new and important features. First, it is developed in the<br />
Windows environment and proVides for inputs through a spreadsheet interface. Second, it<br />
employs the principles of mass baiance to allow calculations in altemative currencies. Accordingly,<br />
It can be used to estimate the ecological significance of nutrient flux rates owing to fishes. In '<br />
addition, It can be implemented to evaluate bioaccumulation of contaminants such as PCBs or<br />
heavy metals. The basic frameworks described in Chapter 4 invite additional applications.<br />
1-3
Bioenergetics Overview<br />
LaBar, G. W. 1993. Use of bioenergetics models to predict the effect of.increased lake trout<br />
predation on rainbow smelt following sea lamprey control. Trans. Amer. Fish. Soc. 122:942-950.<br />
Luecke, e., M.J. Vanni, J.J. Magnuson, J.F. Kitchell, and P.T. Jacobson. 1990. Seasonal<br />
regulation of Daphnia populations by planktlvorous fish: implications for the spring clear water<br />
phase. Limnol. Oceanogr. 35(8):1718-1733.<br />
Ney, J. J. 1993. Bioenergetics modeling today: growing pains on the CUlling edge. Trans. Amer.<br />
Fish. Soc. 122:736-748.<br />
Post, J.R. 1990. Metabolic allometry of larval and juvenile yellow perch (Perea f1avescens): in situ<br />
estimates and bioenergetic models. Can. J. Fish. Aqua!. Sci. 47:554-560.<br />
Rice, J. A., and P. A. Cochran. 1984. Independent evaluation,of a bioenergetics model for'<br />
largemouth bass. Ecology 63:732-739.<br />
Rudstam, LG. 1989. A bioenergetic model for Mysis growth and consumption .applied to a Baltic<br />
popUlation of Mysis mixta. J. Plankton Res. 11:971-983.<br />
Rudstam, LG., P.E. Peppard, T.W. Fratt, R.E.Bruesewitz, OW.Coble,
,.<br />
......-.. '. :<br />
Section 1, Chapter 2, Page 6: In Equation 1 for respiration, the activity mUltiplier calculations can be'<br />
clarlfied by making a change to the equation set and making a change to the explanation that fallows. Within '<br />
) equation set one, you can assume that swimming speed is constant, or you cljen assume it's a function of mass<br />
or mass and temperature. If swimming speed is oonstant, then simply use that speed (cm· s·1) to represent the<br />
VEL parameter; otherwise, simply use either the secone{ or third form of the VEL equati9n. Currently Equation<br />
1 reads: , ' ,<br />
where:<br />
VEL = R..Kl· W.RJ:4 , when T > RTL, or,<br />
VEL = ACT· W.RJ:4 . e(MC'1'l"), when T 5. RTL.<br />
Change this equation set to r"ad as follows (the only change Is theJirst line after "where:"):<br />
l'T'\ - (RQ'X)'<br />
f 'L/ - e '<br />
ACTMTY = e(RTDVl1L)<br />
where:<br />
VEL ",swimming speed, when swimminsr speed is constant, or<br />
VEL = RKI' W.RJ:4 , when T > RTL. or<br />
VEL", ACT' W.RK4 'e(MC'1'1"), whenT 5. RTL.<br />
Paragraphs four and five provide an explanation of the application of swimming speed to the ACTIVITY part of<br />
the respiration equation. Paragraph four currently reads:<br />
In Fish Bioenergetics 3.0, if swimming speed is a constant then RTM, RTL, RK4 and BACT are set to 0, RK1<br />
and ACT are set to 1, and RTO Is set to the desired velocity (cm· s'1).<br />
Change this paragraph to read asfollows:<br />
'In Fish Bio"nerg"tics 3.0, if swimming spe"d is a constant then RTM, RTL"RK4 and BACT are set to 0, RK1<br />
and ACT are set to 1, VEL equais swimming speed (em· s·l), and RTO equais the coefficient of swimming<br />
speed (s . cm'1).<br />
2-6<br />
"<br />
I<br />
\<br />
I,
.Core Processes in Bioenergetics<br />
Equation 2: Temperature dependent with activity mUltiplier<br />
(Kitchell et a!. 1977)<br />
'f(T) == V X . e(x'(l-V»<br />
ACTIVITY == ACT<br />
. where:<br />
v == (RTM - T) 1(RTM - RTO)<br />
X == (Z2 . (1 + (1 +401 y)os)') 1400<br />
Z = LN(RQ)· (RTM -RTO)<br />
Y == LN(RQ)· (RTM - RTO -+ 2)<br />
With this formulation, the temperature dependence of respiration is adjusted by an activity<br />
mUltiplier (ACT). RTO (' C) is the optimum temperature for respiration (where respiration is.<br />
highest), RTM (. C) is the maximum (Iethai) water temperature, and RQ (. C') approximates the<br />
0 10 (the rate at which the function Increases over reiatlvely low water temperatures). For .<br />
computing R",,,, RA is the number of grams of oxygen (g.g" d") consumed by a 1 gram fish at<br />
RTO and RS is the slope of the allometric mass function for standard metabolism: Activity (ACT)<br />
is a constant times resting metabolism, the "Winberg mUitlplier" (Winberg 1956). Several recent<br />
studies have shown that activity may be a large and variable component of the total energy budget<br />
and Is influenced by a number of enVironmental and physiological factors (Boisclair and Leggett<br />
1989, Boisciair and Sirois 199'3, Lucas eta1.1993, Madon and Culver 1993).<br />
2.3 Waste Losses (Egestion and. Excretion)<br />
Egestion (fecal waste, F) and excretion (nitrogenous waste, V) can be computed as a constant<br />
proportion of consumption, or as functions of water temperature and consumption. Waste losses<br />
are computed as grams of waste per gram of fish'per day.<br />
Equation Set 1: .Proportional to consumption (Kitchell et at: .'<br />
1977)' .<br />
Egestlon:<br />
Excretion:<br />
F== FA·C<br />
U==UA·(C-F)<br />
Egestion Is a constant proportion (FA) of consumption. Excretion is a constant proportion (VA) of<br />
assimilated energy (consumption minus egestion). This formulation suffices for most species.<br />
Equation Set 2: Dependent on mass, temperature and ration<br />
(Elliott 1976)<br />
Egestion: F == FA· T FB • e(FG.p) . C<br />
Excretion: U == UA· TUB . e(UG.p) .(C- F)<br />
2-7<br />
,.'.
Core Processes in Bioenergetics<br />
2-10<br />
References<br />
Bartell, S.M., Breck, J.E., Gardner, R.H., and Brenkert, A.L. 1986. Individual parameter<br />
perturbation and error analysis of fish bioenergetics models. Can. J. Fish. Aqua!. Sci. 43:160-168.<br />
Boisclair, D. and Leggett, W.C. 1989. The importance of activity in bioenergetics models applied<br />
to actively foraging fishes. Can. J. Fish. Aqua!. Sci. 46:1859-1867. .<br />
Boisclair, D. and Sirois, P. 1993. Testing assumptions offish bioenergetics models by direct<br />
estimation of growth, consumption, and activity rates. Trans. Amer. Fish. Soc. 122:784-796.<br />
Elliott, T.A. 1976. Energy losses in the waste products of brown trout (Salmo trutta L.). J. Anim.<br />
Ecol. 45:561-580.· ..<br />
Hartman, K.J. and Brandt, S.B. 1993. Systematic sources of bia.s in a bioenergetic.<br />
modei:examples for age-O .st(iped bass. Trans. Amer. Fish. Soc: 122:912-926.<br />
Hewett, S.W. and Johnson, B.L. 1987. A generalized bioenergetic model offish growth for<br />
microcomputers. Technical Report No. WIS-SG-87-245. University of Wisconsin Sea Grant<br />
Institute, .<br />
Madison, WI.<br />
•<br />
Hewett, SW. and Johnson, B.L. 1992. Fish Bioenergetics Model 2. Technical Report No. WIS-<br />
SG-92-250. University of Wisconsin Sea Grant Institute, Madison, WI. 79 p.<br />
Johnson, T.B. 1995. Long-term dynamics of the zooplanklivorous fish community in Lake<br />
Mendota, Wisconsin. Ph.D. thesis, University of Wisconsin - Madison. 203 p.<br />
Kitchell, J.F., Stewart, D.J., and Weininger, D. 1977. Applications of a bioenergetics modei to<br />
yellow perch (Perca flaveseens) and walleye (Stlzostedlon vitreum vitreum). J. Fish.<br />
Res. Board Can. 34:1922-1935. . .<br />
Lantry, B.F. and Stewart, D.J. 1993. Ecological energetics of rainbow smelt in the Laurentian<br />
Great Lakes: an Interlake comparison. Trans. Amer. Fish. Soc. 122:951-976.<br />
Lucas, M.C., Johnstone, A.D.F., and Priede, I.G. 1993. Use of physiologicai teiemetry as a .<br />
method of estimating metabolismoffishinthe natural environment. Trans. Amer. Fish. Soc.<br />
122:822-833.<br />
Madon, S.P. and Cuiver, D.A. 1993. Bioenergetics model for larval and juvenile walleyes: an In<br />
situ approach with experimental ponds. Trans. Amer. Rsh. Soc. 122:797-813.<br />
Ney, J.J. 1990. Trophic economics In fisheries: assessment of demand-supply relationships<br />
between predators and prey. Rev. Aquat. Sci. 2:55-81.<br />
Ney, J.J. 1993. Bioenergetic modeling today: growing pains on tl1e cutting edge. Trans. Amer.<br />
Fish. Soc. 122:736-748.<br />
Post, J.R. 1990. Metabolic allometry of larval and Juvenile yellow perch (Perea flavescens): In situ<br />
estimates and bioenergetic models. Can. J. Fish. Aquat. ScI. 47:554-560.<br />
. Rice, J.A., J.E. Breck, S.M. Bartell, and J.F. Kitchell. 1983. Evaiuating the constraints of<br />
temperature, activity and consumption on growth of largemouth bass. Env. Bioi. Fishes 9: 263<br />
275.<br />
. "..<<br />
.'"
Core Processes in Bioenergetics<br />
Rudstam, L.G., F.P. Binkowski, and M.A. Miller. 1994. A bioenergetics model for analysis of food<br />
consumption patterns of bloater in Lake Michigah. Trans. Amer. Fish.Soc. 123:344-357.<br />
Stewartr D.J.· and M. Ibarra. 1991. Predation and production by salmonlne fishes in Lake<br />
Michigan, 1978-88. Can. J. Fish. Aqua\. Sci. 48:909-922.<br />
Stewart, D.J., Weininger, D., Rottiers, D.V., and Edsall, T.A. 1983. An energetics model for lake<br />
trout, Salvelinus namaycush: Application to the Lake Michigan population. Can. J. Fish: Aqua\.<br />
ScI. 40:681-698.<br />
Thornton, K.W. and Lessem, A.S. 1978. A temperature algorithm for modifying biological rates.<br />
Trans. Amer. Fish. Soc. 107:284-287.<br />
Winberg, G. G. 1956. Rate of metabolism and food requirements of fishes. Byelorussian<br />
University, Minsk. 253p.' .<br />
2-11
Scaling Individual Bioenergetics to Populations<br />
3-2<br />
J:.. 400<br />
.- lh<br />
.... 300<br />
0<br />
I-<br />
G)<br />
..Q 200<br />
E ::s<br />
z 100<br />
JFMAMJJ<br />
Month<br />
Figure 1. Population mortality by mortality type in one year.<br />
A SON D<br />
Within Fish Bioenergetics 3.0, mortality is modeled for each cohort using a simple exponential<br />
decay model<br />
m't<br />
Nt = No e'<br />
where No and N, represent the number of fish at time zero and time t, respectively, and m is the<br />
total daily instantaneous rate of mortality that occurred within the population. When multiple<br />
sources of mortality act together on a cohort, each type of mortality,is applied to the cohort each<br />
day, and the. number surviving tlie combined mortality Is projected forward to the following day.<br />
Remember that While the daily instantaneous rates of mortality are l;ldditive (mna'"a' + m"hlng + ...),<br />
the actual probabilities of mortality are not. For instance, If the natural rate of mortality (n) is 30%<br />
per year, and the rate of fishing mortality (m) is 20% per year, the combined total mortality Is 45%<br />
per year (n+m-nm). This expression simply st;>tes that a ffsh can die from natural mortality or<br />
fishing mortality, but the same fish can not die from both types of mortality.<br />
Within Fish Bioenergetics 3.0, the order of dl;lily events for a fish is: eat, grow, spawn and die.<br />
Spawning and m0l1ality only occur if required by tha user input. The importance of this chronology<br />
will be triVial for most bioenergetic runs, however, the user shouid realize that dally consumption<br />
values will be calculated before the fish dies. The reduction in consumption associated with the<br />
Inclusion of mOl1ality in the Lake Perca yellow perch cohort is shown in<br />
Figure 2.·<br />
It Is important to realize that Fish Bioenergetics 3.0 is not a population·modei because we do not<br />
explicitiy consider recruitment. However, by accounting for mortality rates, the net predatory<br />
Impact effect of a group of fish Can be estimated. .
Extended Topics: Analyses of Nutrient<br />
Regeneration and Contaminant<br />
Accumulation<br />
The utility of reconstructing energy bUdgets of fishes to estimate predation rates in aquatic<br />
systems has been extended to allow estimation of flow rates-of other materials that are<br />
transferred through interactions of fishes and their prey. The impetus for this deveippmentderived<br />
from the recognition that fishes piay pivotal roles in transfers of limiting nutrients between<br />
ecosystem compartments (Kitchell et al. 1979), and because contaminant.accumulation In fish<br />
tissue that has potentially important toxicity implications for humans and wildlife that consume<br />
them (Cordle et al. 1982; Fein et al. 1984; Mac 1988). As with estimating the rates of energy<br />
transfer between food web components, estimating nitrogen and phosphorus regeneration rates<br />
and contaminant accumulation rates in fish tissues has proven difficult. As discussed in Chapters<br />
1 and 2, using measured growth rates as a constraint on energy bUdgets, we can calculate<br />
predation rates with relatively minimal errors. We capitalize on this strength of bioenergetic<br />
models to estimate flow of other materials through fishes.<br />
By coupling mass balance models tii bioenergetic models, we can estimate the rates at which<br />
materiais are transferred into and through fishes. The mass balance models that are coupled with<br />
energetic models fall Into two distinct types depending on the behavior of the material of interest<br />
in fish tissue. Some materials, for example nitrogen (N) and phosphorus (P), are maintained at<br />
relatively constant concentrations In fish tissue through homeostatic mechanisms. In these<br />
instances, the concentration of the material in fish tissue is usually known, and we are interested<br />
in the rates at which the material is transferred into fishes and the rate at which it is eliminated.<br />
The best example of this is evaiuating the role that fish play in lake nutrient (N and P) cycles by<br />
regenerating these primary production-limiting nutrients through excretion (Kraft 1992; Carpenter<br />
et al. 1992; Schind.ler.et al. 1993). By linking the elemental composition of fishes and their prey<br />
(e.g. Davis and Boyd 1915; Penczak 1!l80) to bioenergetics models, we can estimate nutrient<br />
regeneration rates by fishes.<br />
The other general class of materials which we are often interested are those that are<br />
pioaccumulated (I.e. not maintained at homeostatic concentrations). Whether a material is<br />
bioaccumulated is largely a function of its lipophiliclty that determines the efficiency with which It<br />
is eliminated from tissue. Examples include the bioaccumulation of heavy metals (e.g. mercury)<br />
and organic contaminants such as polychlorinated biphenyls (PCBs). In these instances, we are<br />
generally more concerned with predicting the concentration of the material in fish tissue and how<br />
different enVironmental conditions (e.g. varying temperatures', changes In diet or changes in .<br />
growth rate) alter concentrations. . .<br />
In this chapter we briefly describe the functions that are linked to the bioenergetics models<br />
described In Chapter 2, to estimate nutrient regeneration and contaminant bioaccumulation by<br />
fishes.
Analyses of Nutrient Regeneration and Contaminant Accumulation<br />
4.2 Contaminant Accumulation<br />
Fishes accumulate compounds by bioconcentration across their gills and through<br />
bioaccumulatlon from ingested food. Although some studies suggest that uptake of contaminants<br />
across the gills can be substantial (Post et at 1996), the bulk of accumulation usually occurs<br />
through extraction from ingested food (Rowan and Rasmussen 1992; Rasmussen et ai. 1990;<br />
Thomann and Connolly 1984; Thomann 1989; Rodgers 1994). Our modeling approach assumes<br />
that uptake from water through the gills is negligible compared to that taken up through dietary<br />
exposure.<br />
Estimating the accumulation of compounds that are not main1ained at homeostatic concentrations<br />
in fishes can be modeled by mass baiance models of uptake and elimination, to the bioenergetics<br />
models. Examples of bioaccumulated compounds include methyl-mercury (MeHg), and orga'nic<br />
contaminants such as polychlorinated biphenyls (PCBs).<br />
We present three'alternative methods to-modei contaminant accumulation in fishes. All three a;e<br />
relatively simple compared to other models that have been developed to account for loss and<br />
uptake processes in a more mechanistic fashion (e.g. Barber et at 1991). The methods we<br />
present assume that contaminant uptake from water is insignificant, and that fishes incorporate<br />
contaminants into tissue entirely due to uptake from ingested food. The first model we present<br />
assumes that elimination of contaminants from body tissue Is constant and that contaminant<br />
uptake can be modeled simply as a constant fraction of the amount of contaminants consumed<br />
by a fish. This first model Is the most parsimonious approach to estimating contaminant<br />
accumulation as it employs oniy one parameter to integrate across all possible uptake and loss<br />
processes of contaminants. We recommend using model 1 for simuiating accumulation of highly<br />
lipophilic organic contaminants such as PCBs, when the parameters for the more complex<br />
models are not known. The second accumulation model accounts for contaminant elimination<br />
explicitly and assumes that elimination rates are dependent on body size of tish (i.e. mass·<br />
specific elimination rates are inversely proportional to body size). The third contaminant model<br />
accounts for changes in elimination rates due to both body size and environmental temperature.<br />
Models 2 and 3 scale elimination rate with mass-specific metabolic rates. We suggest using<br />
models 2 and 3 to modei accumulation of contaminants that are relatively labile (e.g. mercury)<br />
and whose elimination kineticEl are better established.<br />
Model 1 - simple net trophic transfer efficiency with no elin:tination<br />
4·4<br />
Change in a predator's contaminant concentration ([X]p,ed)can be calcuiated as:<br />
dXprod Idt = C * [X)proy * TEx<br />
equation 4.5<br />
where C is the mass of prey consumed per unit time, [X]prey is the mean concentration of<br />
contaminant-X in the prey, and TEx is the transfer efficiency of the contaminant from prey to "<br />
predator. This transfer efficiency represents the net assimilation efficiency after accounting for all<br />
sources of elimination and transformation (Jackson and Schindler 1996).<br />
Jackson and Schindler (1996) estimated that TExfor total PCB transfer from prey fishes to Lake<br />
Michigan lake trout, chinook salmon and coho salmon were 0.55, 0.60 and 0.50 respectively. This<br />
means that, for example, 55% of the PCBs ingested by a lake trout are assimilated from prey<br />
tissue and incorporated Into the predator tissue.
)<br />
Analyses of Nutrient Regeneration and Contaminant Accumulation<br />
4·8<br />
Post, J.R., R Vandenbos, and D.J. McQueen. 19lJ6. UptE!ke rates of food·chain and waterboine<br />
mercury by fish: field measurements, a mechanistic model, and an assessment of uncertainties.<br />
Can. J. Fish. Aqua!. Sci. 53:395·4?7.<br />
Rasmussen,tl.B., RJ. Rowan, DRS. Lean, and J.H. Carey. 1990. Food chain structure in<br />
Ontario lakes determines PCB levels in lake trout (SalveJinus namaycush) and other pelagic fish.<br />
Can. J. Fish. Aqua!. Sci. 47:2030·2038.<br />
Rodgers, DW. 1994. You are what you eat and a little bit more: bioenergetics·based models of<br />
methylmercury accumulation in fish revisited. Pages 427·439 In C.J. Watras and JW. Huckabee<br />
(editors). Mercury pollution: integration and synthesis. Lewis PUblishers, CRC Press, Boca<br />
Raton, FL .<br />
Rowan, D.J., and J.B. Rasmussen. 1992. Why don't Great Lakes fish reflect environmental<br />
concentrations ot organic contaminants? • An analysis of between·lake variability in the ecological<br />
partitioning of PCBs and DDT. J. Great Lakes Res. 18:724·741.<br />
Schindler, D.E., J.F. Kitchell, X. He, S.R. Carpenter, J.R Hodgson, and K.L Cottingham. 1993.<br />
Food web structure and phosphorus cycling In lakes. Trans. Am. Fish. Soc. 122:756-772.<br />
Thomann, RV. 1989. Bioaccumulation model of organic chemical distribution. in aquatic food<br />
chains. Environmental Science & Technology 23:699-707.<br />
Thomann, RV., and J.P. Connolly. 1984. Model of PCB in the Lake Michigan lake trout food<br />
chain. Environmental Science & Technology 18:65,71.<br />
",.' .<br />
'"'.<br />
. -;',1
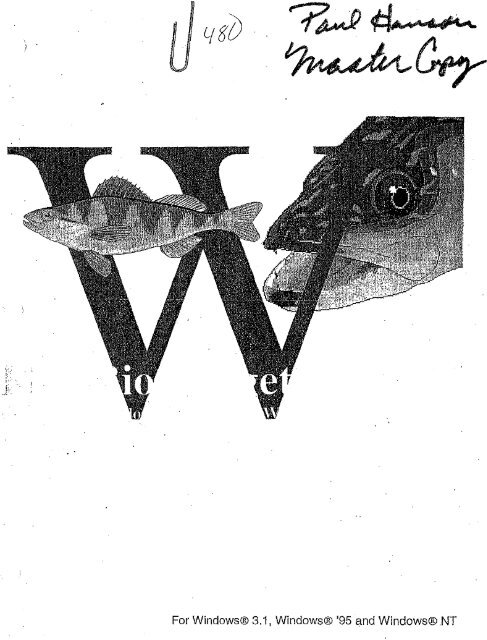
Before'you Begin<br />
1.1 General Conventions<br />
Object or Formatting<br />
Menu/Item<br />
Predator,<br />
Cohort file/document<br />
Description<br />
Perform the action described by the following text.<br />
1.2 New Features in Version 3.0<br />
Menu describes a main menu option, such as File or Edit, found at<br />
the top of the Fish Bioenergetics main window, and Item describes an<br />
option, such as New or Open, listed in the pop-down menu,<br />
The fish for which you are simulating bioenergetics. When you create<br />
a new cohort/document you seietta predator species,<br />
Document is a synonym for file, which represents aslmulated cohort<br />
The three terms are often interchanged. In Fish Bioenergetics 3,0 you<br />
can create two different fiie types, cohort and summary,<br />
• Unlimited number of cohorts<br />
• Unlimited combinations of cohorts<br />
• Unlimited number of prey<br />
• Additional predator species<br />
• Nutrient regeneration analysis<br />
• Contaminant accumulation analysis. "<br />
• First Impression built-in graphing program<br />
• Formula Orie built-in spreadsheet<br />
• Online help<br />
• , Runs in Windows 3.1, Windows '95 and Windows NT
Getting Started<br />
\<br />
2·2<br />
• Windows '95 or NT:'" Insert the CD into the CD drive (or disk 1 into drive A If<br />
installing from floppies). Seiect Add/Remove Programs from the Windows control<br />
panels and press the Install bulton. Be sure to select the setup.exe file located in the<br />
d':\win95 subdirectory. Alternatively, you can double click 1he setup.exe file on disk 1<br />
from within the Windows Explorer if you are installing from floppies.<br />
File Name<br />
regsvr32.exe<br />
data.bem<br />
bioen.exe<br />
perch:<br />
vcf132.ocx<br />
vcfl32.ocx<br />
msvcrt4D.dll<br />
mfc4D.dll<br />
0lepro32.dll<br />
Follow the prompts that the setup program provides, and Fish Bioenergetics 3.0 will<br />
install the program files on your hard disk, sample files in a SUbdirectory named<br />
Samples, and some system files in the Windows/System subdirectory. Finally, the<br />
setup program will create a Bioenergetics entry in the Programs menu under your<br />
Start bulton.<br />
Fish Bioenergetics 3.0 Installed Files<br />
Description<br />
software that registers Fish Bioenergetics<br />
with the Windows operating system<br />
species physiological parameters<br />
program executable'<br />
a number of perch sample files<br />
Formula One built-In spreadsheet<br />
First ImpreSSion built-in graphing<br />
Windows system file<br />
Windows system file<br />
Windows system file<br />
Installed Location<br />
temporarily in the program<br />
directory<br />
program directory<br />
program directory<br />
samples SUbdirectory<br />
Windows\system directory<br />
Windows\system directory<br />
Windows\system directory<br />
Windows\system directory<br />
Windows\system directory<br />
2.3 Software Overview<br />
Fish B/oenergetics 3.0 allows you to combine your field data with known physiological fish<br />
parameters to create simulations depicting the consumption and growth characteristics of<br />
your fish. To run a simulation, you need user input data that you've estimated (temperature,<br />
diet, prey energy density, etc.); user input parameters, such as the date range of your<br />
simulation and the start and final mass of your predator; and Fish Bioenergetics 3.0 to<br />
calculate daily consumption and growth.
)<br />
Getting Started<br />
2.4 Starting Bioenergetics<br />
TD start Fish BIDenergetics 3.0, simply dDuble click the Fish Bioenergetics 3.0 icon located In the<br />
Bioenergetics group (Windows 3.1) or the Program menu under the Start button (Windows '95 or<br />
NT).<br />
2.5 Sample Data and Bioenergetics Run<br />
2·4<br />
All Df the examples used in the foliDwing chapters pertain to the simulatiDn (PERCH.RUN) of a<br />
hYPDthetical yellDw perch populatiDn living h Lake Perea. The data represent a cDhDrt of age-3<br />
perch which grDw from 60 g on June 1 (Simulation day 1) to 90 g on May 31 of the fDIlDwing year.<br />
The initial perch pDpulation size is 10,000 with a natural mortality rate Df 30% per year, and a<br />
harvest mortality rate Df 25% during the fishing seaSDn (June 1 tD OctDber 1'5) (PERCH.MOR).<br />
The diet (PERCH.DIE) gradually changes frDm all invertebrates on June 1 to all fish on December<br />
1 with the perch remaining exclusively piscivDrDus tD the end of the year. The energy density of .<br />
. both predator (PERCH.PDC) and prey (PERCH.PYC) remain constant throughout the year. The<br />
perch reside In a temperate lake where seasonal water temperatures range from 4 DC in the<br />
Winter to 23 DC in the summer (PERCH.TEM). Industrial development has polluted the waters of<br />
Lake Perea such that the perch population accumulates PCBs from their diet (PERCH.PYX) at a<br />
constant aSSimilation efficiency of (PERCH.AEX). In addition, these perch act as a vector for<br />
nitrogen and phosphorus transport between the littoral zone (Where they consume their prey) and<br />
the open lake. Files describing the nitrogen and phosphorus content Df the perch (PERCH.PDN<br />
and PERCH,PDP) and their prey (PERCH.PYN and PERCH.PYP), and the gross assimilation<br />
efficiency (PERCH.AEN and PERCH.AEP) are proVided.
3.2 User Input Data Files<br />
Learning Bioenergetics<br />
User inp·ut data files contain information<br />
that youmay have collected in the field,<br />
retrieved from your historical archives,<br />
or pUlled from scientific journals. These<br />
data files are created outside of Fish<br />
Bioenergetics 3.0 and are loaded by the<br />
software during setup of the<br />
bioenergetics simulation. The data files<br />
that you need to run a simulation<br />
depend on the compleXity of the<br />
simulation. For example, if you're<br />
interested only in the predator's consumption of a specific prey item, then· you'll need only<br />
Temperature, Diet, Prey energy density (and pos?Jblypredator energy density); however, if<br />
you're also interested in the quantity of PCBs that the predator consumed because of Its diet,<br />
you'll need to add Prey concentration and AssimilatIon efficiency files for your contaminants.<br />
Below is a table of all possibie user input data files. No matter how many files you need, keep in<br />
mind that allinpul data files must meet the follOWing criteria:<br />
• tab delimited<br />
• first line must be column headers<br />
• first column must be day<br />
In addition, all data files have the following criteria In common:<br />
• any non-number indicates no data<br />
• days do not need to be contiguous<br />
• days can encompass any valid integer range<br />
3·3
3.3 User Input Data Files - Samples<br />
Learning Bioenergetics<br />
Sample input flies created from Excel® spreadsheets and saved as tab delimited text files.<br />
Temperature Input file<br />
Diet input file<br />
Prey energy density input file<br />
Predator energy density Input file .<br />
3-5
Learning Bioenergetics<br />
3-6<br />
Mortality<br />
Phosphorus concentration in prey items<br />
J'ihosphorus assimilation efficiencies of prey items<br />
Phosphorus concentration in predator<br />
Nitrogen concentrations in prey items<br />
.,,,:"<br />
.....
Nitrogen assimilation efficiencies of preY Items<br />
Nitrogen concentration of predator<br />
Contaminant concentrations in prey items<br />
Contaminant assimilation efficiencies in prey items<br />
Learning Bioenergetics<br />
3-7
Learning Bioenergetics.<br />
Fr the most part, these parameters have been determined experimentally in the laboratory and<br />
do not change. You do not need to edit or even view any of the physiological parameters while.<br />
running your simuiation; however, you can change their values. Fr a more in-depth discussion of<br />
the parameter definitions, derivations and applications, read sectiDn 1, chapter 2 Df the<br />
dDcumef.ltation, Core Processes in Bioenergetics. FDr a listing of the parameter values of different<br />
species, see Appendix A, Fish Physiological Parameters.<br />
.. Select EdillPhyslological parameter defaults to view the physiolDgical parameter<br />
database. Note that the database will be permanently altered by any changes you make to these<br />
data; however, making changes in the database will have nD effect Dn physiolDgical parameters in<br />
cohort files that already exist.<br />
Interface for editing the physiological pararneter database.<br />
A conservative approach to editing a species' physiolDgical parameters Is to copy the species of<br />
Interest and give It a new name, thus allowing you to test your changes before committing to<br />
permanently updating the database. You can always refer to Appendix A to view the original<br />
parameters.<br />
3.6 Putting it All Together<br />
A file Is a cohort: The mDst fundamental unit of analysis is a cohort. In Fish Bioenergetics 3.0, a<br />
cohort is a single species of fish in a specific life stage, such as an adult perch. A cohort can<br />
represent one fish or many fish. In Fish Bioenergetics 3.0, each file is a cohort. You create a<br />
cDhDrt when you open a new file; load your user Input data, and use thi:l software's physiological<br />
parameters appropriate for YDur species to analyze your data and make predictiDns. Multiple<br />
cDhorts are created by creating mUltiple files, and you analyze the results of multiple CDil0rts by<br />
. creating a second file type called a summary file.<br />
3-9<br />
....
Creating a Cohort<br />
4.1 The Five Major Steps<br />
In general, you need to complete five steps to create and analyze a new cohort. Although each<br />
one of these steps can require some detailed information, you usually can successfully create a<br />
new cohort by hitting toolbar icons in the order shown beiow and accepting the default vaiues.<br />
Being able to create a new cohort assumes that you've created your input data files and have<br />
given some thought to your user input parameters.<br />
Icons will appear on the toolbar oniy after the previous icon has been selected and the ensuing<br />
steps have been completed. In other words, you'll be able to select only icon 1 when you first start,<br />
but after you've completed that step, you'll be able. to select icon 2.<br />
1. New file Icon allows you to select a species and create a new cohort or summary<br />
2. Setup icon selects· options and loads data<br />
3. P·value icon estimates the proportion of maximum consumption required to produce the input<br />
growth<br />
4. Run icon executes a Bioenergetics run<br />
5. Graph or Spreadsheet icon generates output .<br />
4.2 Step 1: New Cohort and Select a Species<br />
* From the main Fish Bioenergetics 3.0 window, select File/New or press the new-file icon.<br />
The folloWing window will appear.
4.3 Step 2: Setup<br />
Creating a Cohort<br />
There ara three major steps to setting up your cohort: S!mulation Setup, Data File Setup, and<br />
Species Setup.<br />
.. Select Setup from the main menu, and the following drop-down menu appears.<br />
You'll see the three major setiJp steps (BfOenergetics Run setup will be covered later in this<br />
chapter). Depending on how far you've progressed through the setup process, some of these<br />
setup options might be grayed. As you complete each setup step, starting with SImulation,<br />
additional setup steps will become available. Pressing the setup icon from the toolbar has the<br />
same effect as selecting Setup/Simulation from the.main window.<br />
Simulation<br />
.. Select either Setup/Simulation or the setup icon from the tootbar. The Simulation Setup<br />
window appears.<br />
4·3
Creating a Cohort<br />
4-4<br />
.. Press OK to accept the default values, or you can modify the Simulation Setup options to fit<br />
your specific needs.<br />
Run Options<br />
Show phys,iologiGal parameters in species setup: Check this box if you would like to see and<br />
be able to edit the fish physlologlcai parameters that have been copied from the software<br />
database into your new cohort. Although you will be able to .edlt these parameters, you should do<br />
so with the understatJding that you're changing the basic physiology of the fish. Do not worry about<br />
corrupting the software database, because the parameters presented to you In a cohort file are a<br />
copy of the originals from the database. To view the original database values', select<br />
Edit/PhysiologIcal parameter defaults.<br />
Input/Output energy as Joules: This box is checked by default. Keep in mind that data from the<br />
two input data files, prey energy density and predator energy density, must be consistent with your<br />
seleclion in this check box. If you decide to use the defauli predator energy density that's provided<br />
with Fish Bioenergetics 3.0 instead of inputting your own data, the software will automatically<br />
convert the energy density to the appropriate units. If you deactivate this box, you must use<br />
calories as the currency of energy (one cal = 4.186 jouies). .<br />
P-value Estimation Method: Estimating the P-value really means determining the average<br />
proportion of maximal consumption that your cohort maintained to change from its start weight to<br />
its final weight during the duration of your simulation. For example, your cohort might grow from<br />
60 to 90 grams 'in a year. Based on your Input data flies and the basic physiology of your cohort, it<br />
might have a maximum consumption of 5,600 grams of prey per year. Let's say that your fish ate<br />
at Its maximum consumption rate (which is equivalent to a P-value of 1), Using a P-value of 1, the<br />
software would calculate your cohort's growth from 60 to 2,155 grams In a year. Well, your fish did<br />
.' :.:<br />
.. 1,
Creating a Cohort<br />
not grow to 2,155 grams, it grew to 90 grams, and so the software would try a P-value equal to 0.5<br />
(or 50% of maximal consumption). The software iteratively recalculates the growth of your fish<br />
based on different P-values until it finds a P-value (or proportion of maximal consumption) that<br />
aliows your fish to grow from 60 to 90 grams. Once the software has determined the P-value, It, '<br />
can use-that P-value in subsequent Run calculations.<br />
Calculating a P-value based on a change In mass is the most common method; however, you<br />
have the option of calculating your P-value based on total consumption during your simulation. For<br />
example, your cohort might grow to some unknown mass based on a known yearly consumption<br />
of 1,400 grams of food and a start mass of 200 grams, Based on your input data files and the<br />
basic physiology of your fish, it might have a maximum consumption (which is equivalent to a Pvalue<br />
of 1) of 6,800 grams of prey per year. Since your cohort didn't consume 6,800' grams of<br />
prey, the software will use a lower P-value .and recalculate total consumption and repeat the<br />
process until calculated consumption equals the consumption of 1,400 grams that you entered.<br />
The resulting P-value might be around 0.48.<br />
• Fit to end weight: Check this option if you would like the software to calculate your'<br />
cohort's P-vaiue (proportion of maximal consumption) based on its change in mass<br />
during the simulation.<br />
• Fit to consumption: Check this option If you would like the software to calculate<br />
your cohort's P-value (proportion of maximal consumption) based on its total<br />
consumption of prey during the simulation.<br />
Additional Analyses: With the possible exception of Input predator energy density, the<br />
additional analyses are optional.<br />
• Input predator energy density: Predator energy density is the joules per gram wet<br />
body mass of your fish. in the real world your cohort's energy density wili fluctuate<br />
over time. If you have prepared a predator energy density inpui file that represents<br />
these changes, then select the Input predator energy density option and you'li be<br />
prompted for that file in the User Input Data Files setup. otherwise, you can accept<br />
the default value copied from the software's database for this species. If the<br />
software's database contains no default energy density, then you will be required to<br />
select this option.<br />
• Spawning: Does your cohort spawn during your simulation? If so, select this option<br />
, and you'll be prompted for the spawn day and percent body mass spawned in the<br />
User Input Parameters setup.<br />
'. Population mortality,: Your cohort can represent a population of fishes if you select<br />
this option. This option assumes that you will provide mortality data (in the form of<br />
percent of popUlation dying over time) during the User Input Data Files setup.<br />
• Nitrogen and phosphorus analysis: Select this option if you would like to<br />
determine the conversion of nitrogen and phosphorus from that which is contained in<br />
the prey's flesh to that which is regenerated by the pred.ator. If you select this anaiysis<br />
you will be prompted for prey concentration input data files and assimilation efficiency<br />
input data files during the User Input Data Flies setup.<br />
• Contaminant analysis: Select this option if you would like to model the changes in<br />
contaminant concentration in the predator based on the contaminant concentrations<br />
in its prey. If you select this anaiysis you wili be promptE1d for a prey concentration<br />
input data file and an assimilation efficiency input data file during the User Input Data<br />
Files setup. In addition, you must decide upon the mechanism by which the predator<br />
will eiiminate some of the contaminants it has consumed.<br />
• Net assimilation efficiency: Select this option if your predator will<br />
assimilate contaminants based soleiy upon data provided in the contaminant<br />
4-5
Creating a Cohort<br />
assimilation input data fila. The remaining contaminants are eliminated. You<br />
will need to know the initial predator concentration for the User Input<br />
Parameters setup.<br />
• Gross assimilation efficiency + constant elimination: If your predator<br />
assimilates at a rate indicated In your contaminant assimilation input data file,<br />
and yet loses some of those assimilated contaminants at a constant rate,<br />
select this option. You will need to know the initial predator concentration, and<br />
the elimination and allometric constants for the User Input Parameters<br />
setup.<br />
• Gross assimilation efficiency + T-dependent elimination: If your predator<br />
assimilates at a rate indicated in your contaminant assimilation input data file, .<br />
and yet loses some of those assimilated cOntaminants at a rate that's<br />
dependent upon temperature, seiect this option. You will need to know the<br />
initiai predator concentration, the elimination and ailometri6 constants, and<br />
the base temperature for elimination for the·User Input Parameters setup.<br />
Maintenance temperature: Ypu can input atemperature (in degrees Celsius) beiow which your<br />
cohort will not survive. The software will then substitute this temperature whenever your user input<br />
data temperatures drop beiow this temperature. .<br />
User Input Data Files<br />
4-6<br />
.. Select Setup/User Input Data Flies from the main menu.<br />
If you originally started the setup process from Setup/Simulation or the setup Icon, you<br />
automatically will be forwarded into User Input Data Files setup when you select OK from<br />
Simulation setup. Otherwise, you can select SetuplUser Input data files from the program's<br />
main menu.
Load Data via Manual Entry:<br />
... Check the Manual entry box and press<br />
the Edit Qulton that appears.<br />
This option allows you to type your data into a<br />
spreadsheet that pops-up. The data must<br />
conform to the same ruies that apply to user<br />
input data flies.<br />
Load Data via Data Files:<br />
.. Press the Browse button or type the full<br />
path and file name in the text box.<br />
You can type in the fuli paths of your user input<br />
data files, or you can press the Browse button<br />
and search for your data files. If you did not<br />
seiect nitrogen and phosphorus analysis or<br />
contaminant analysis within the Run Options<br />
setup, you will not see the nitrogen and<br />
phosphorus Data Files and Contaminant Data<br />
Files tabs. You will aiways need to provide<br />
temperature, diet and prey energy density files.<br />
Depending upon the additionai analyses<br />
Nitrogen AnalYsis. ,:<br />
Preyconcentratio'n>, '.,<br />
Assimilationefficilincy,'" ....<br />
Predator ooncentrat/oii: " .<br />
Contaminants Aaalysls .....<br />
Prl?yconoentration ·:'c· ;.,<br />
Assimilation.efficierlCY<br />
;taiicizedfiles are optional'and' ..... :..•;;<br />
dependent upon the"type :of":analysis ,'-:"<br />
you are running.· . ". . ::.:.)<br />
Creating a Cohort<br />
you've selected in the Run Options setup, you might have to provide other files as well. For a<br />
complete discussion of User input Data Files, see section 3.2, User input data fiies. Note that data<br />
files are loaded as soon as you exit the text fieid that applies to your file name or as soon as<br />
you've completed the Browse function for thalflle. Once you've loaded your data, you can check<br />
the Manual entry box and press the Edit button that appears to view or edit yoar data.<br />
.. Select'OK to move onto User Input Parameters setup (don't forget nitrogen and phosphorus.<br />
and contaminant files when applicable).<br />
User Input Parameters<br />
.. Select Setup/User Input Parameters from the main menu.<br />
If you were previously. editing the User Input Data Files setup, you would automatically have<br />
been forwarded into User Input Parameters when you seiected OK from user Input Data Flies<br />
. setup, The'sheet that pops-up can colitain as many as three tabbed dialogs depending upon the<br />
optionsyou selected in Run Options setup. .<br />
..1'-<br />
4-7
Creating a Cohort<br />
4-8<br />
Individual.and Population Parameters<br />
You must provide data for at least four of the six fields (P-vaiue Is for your information only, and<br />
Initial population size is available if you selected Mortality in your Run setup).<br />
• First day (integer): The first day of your simulation. The value must be greater than<br />
or equal to all beginning dates in your user input data files.<br />
• Final day (integer): The finai day of your simulation. The value must be less than or<br />
equal to ail the final dates in your user input data files.<br />
• Start weight (grams): The mass of your fish before you run your analysis. If your<br />
analysis runs from day 1 through day 200, start weight would be the weight of your<br />
fish at the beginning of day 1. Incidentally, start weight and final weight apply to a<br />
, single fish and are simply multiplied by the number of fish in a cohort to equal the<br />
mass of the starting population. '<br />
• Final weight (grams) (alternatively Total consumption): The mass in grams of<br />
your fish when your analysis finishes. Although final weight is required entry, it is used<br />
oniy for estimatin'g proportion of total possible consumpti9[1 (P-value estimate), and<br />
not for actual predictive analyses. An alternative analysis Would be to estimate the Pvaiue<br />
and the final weight based on a known total consumption. In this case', you<br />
would first indicate Fit to consumption in Simulation Setup and then enter the total<br />
consumption of your fish in this field. '<br />
• Initial population size: The number of fish In your cohort Immediateiy before the '<br />
beginning of your simulation.<br />
"'-once you've entered your parameters, seiect another pa'rameier sheet if available; such as<br />
Spawning or Contaminants, or select OK.
Spawning<br />
Creating a Cohort<br />
The Spawning parameter page is available only when you've selected Spawning as an option in<br />
your Run setup. You must provide data for both fields.<br />
• Day of spawning (integer): This is the day during your simulation when all fish in<br />
the cohort spawn, Spawning day mOst be greater than or equal to Start day and less<br />
than or equal to Final day.<br />
• Percentage of weight spawned (%): Enter the percent of your cohorts mass that Is<br />
lost due to spawning.<br />
.• Once you've entered your parameters, select another parameter sheet if aVi3.i1able, such as<br />
Contaminants, or select OK, .<br />
Contaminants<br />
4"9
J<br />
Creating a Cohort<br />
4·12<br />
How the P-value estimate calculation works<br />
Try a new P-value until<br />
Final weight - Start weight'" Total growth<br />
In pseudocode, the calculation runs as follows:<br />
Until calculated growth =observed growth (final weight - start weight) do:<br />
{ .<br />
}<br />
Guess ata P-value<br />
For the total number ofsimulation days do:<br />
{<br />
Use the P-value to calculate growth<br />
increment to the next day<br />
Total growth =previous growth plus today's growth<br />
}<br />
If total growth does not equal observed growth, repeat with a new P-value<br />
Note that the P-vaJue is cOlisidered·acceptable when the percent difference between estimated<br />
total growth and observed growth is less than or equal to 0.001%<br />
. :',"<br />
', ...
4.5 Step 4: Executing a Bioenergetics Run<br />
Creating a Cohort<br />
.. Select either P/Run/Run Bioenergetics orthe R icon from the toolbar. The Bioenergetics<br />
Run Setup window appears.<br />
.. Select either Constant P-value or Constant ration in the Run Setup and press OK.<br />
Fish Bioenergetics 3,0 will calcuiate a Bioenergetics Run and display it in the Bioen Run portion of<br />
the cohort window and change the status light from red and "Update!" to green and "Ready,"<br />
The P-Eslimate values and the Bioen Run values mayor may not be the same depending on<br />
whether or not you used the P-value from the P-value Estimate in your Bioenergetics Run. Even "if<br />
you do use tile same P-value, your results may be sllghtiy different (percent difference < 0.5 0/0)<br />
because of rounding that occurs in the daily calculations. The values present on the screen<br />
represent just a few 01 the most commonly viewed variables and are intended to give you a qUick<br />
iook at your results. "<br />
4-13 .
Creating a Cohort<br />
4.6 Step 5: Graphing the Output and Generating an<br />
Output Spreadsheet<br />
Creatinga graph or generating spreadsheet output requires two major steps: 1) Setup, which<br />
includes selecting the output fields, how they will be zeroed, and the output interval; 2)<br />
Graph/Spreadsheet, which is the graphic or spreadsheet that you generate. Fish Bioenergetics.<br />
3.0 includes two add-in programs, Formula One and First impression, that help you view your<br />
results as a spreadsheet and graph your results as a chart. Both programs provide standard file<br />
functions, such as saving, opening, importing, etc. and are invoked automaticaliy when you seiect<br />
the Graph or Spreadsheet output options.<br />
Graph Output Setup (Spreadsheet Output Setup)<br />
... Select either Graph/Spreadsheet·Graj:ih Results or the Graph·icon from the:tooibar. The<br />
Graph Output Setup window appears..<br />
Graph Setup (Spreadsheet)<br />
. Available Fields: The list of fields, in alphabetical order, that are available to be graphed.<br />
Fields to Graph (Fields to Display): The fields that are actualiy going to be graphed. The data<br />
from the first field in the list wili represents the x-axis. The data from the second field represents<br />
the left y-axis, and the third field the right y-axis. Any flel.ds in the list after the first three will be<br />
graphed on· the second y-axis and wili use the scaling of the third field. It foliows that any fields .<br />
after the third in the list should have data with values similar In scale to the data of the third field.<br />
Display file header (spreadsheet output only): When this box Is checked, Fish Bioenergetics<br />
3.0 will include Information about the current file, such as the file name, date, and time in the<br />
spreadsheet output.<br />
4·17
)<br />
Creating a Cohort<br />
4-18<br />
Display cohort parameters (spreadsheet output only): When this box Is checked, Fish<br />
Bioenergetics 3.0will include all user input and physiological parameters in the spreadsheet.<br />
output.<br />
Zeroing<br />
•<br />
Never: The data simply accumulate throughout the entire analysis.<br />
After every day: The cumulative data are retumed to zero every day.<br />
After Interval· day of simulation: When this option is selected, cumulative data will be reset to<br />
zero after every nth simulation day, where n equals a value that you enter into the days field.<br />
After interval· day of year: When this option is selected, cumulative data will be reset to zero<br />
after every nth day of year, where n equals a value that you enter Into the days field.<br />
Days: The number of days in an interval when either After interval" day of year or After<br />
Interval· day of simulation is selected.<br />
First analysis day: For information only· the first analysis day in the summary.<br />
Final analysis day: For Information only - the final analysis day in the summary.
)<br />
.Output Interval<br />
Creating a Cohort<br />
Set interval- day of simulation: Output will be generated only for those days that equal the<br />
simulation start day + x, where x equals the value typed in the Days field.<br />
Set interval - day of year: Output will be generated only for those days that equal the day of year·<br />
+ x, where x equals the value typed in the Days field.<br />
End of mortality period: This option provides output only on those days when a mortality period<br />
has ended. For example, if fishing mortality ended on day 200 of your simulation and natural<br />
mortality ended on day 365 of your simulation, the software would generate three data points, day<br />
1, day 200, and day 365.<br />
End of every 365 1h day of year: Assuming ¥our assimilation spans at least 365 days, you can<br />
select this option to see data only on the 365 h day of year. .<br />
End of each cohort: This option applies only to Summary files.<br />
Every day (default): Select this option if you would like output gElnerated for each day of the<br />
simulation.<br />
Days: Enter the number of days in your Interval·when you've selected either Set interval .·d1lY of<br />
year or Set interval - day of simulation.<br />
First output day: If yoU would like to limit the range of days in your output, enter the first day of<br />
that range in this field.<br />
Final output day: if you would like to limit the range of days in your output, enter the final day of<br />
that range in this field.<br />
4-19
Creating a Summary - Analyzing Multiple<br />
Cohorts<br />
You might be interested in the overall characteristics of a fish that passes through more than one<br />
life stage, or maybe you would like to determine the predation of a particular prey Item by more<br />
than one cohort. Creating a summary allows you to combine the calculations of more than one<br />
cohort into one file.<br />
Why create a summary? To understand why a summary provides useful information about your<br />
analysis, you must first recall the definition of a cohort. A cohort file represents a single species of<br />
fish at a single life stage, such as an adult perch. The cohort can represent one fish or many fish.<br />
But let's say that your anaiysis includes the same species of fish at two different life stages, ·and<br />
you're interested in the total prey consumption by both life stages. You could create two separate<br />
cohort files, generate consumption output for each cohort, and add the outputs manually. A<br />
summary file makes this process easier.
5.2 Step 1: New Summary Setup<br />
Creating a Summary - Analyzing Multiple Cohorts<br />
.. From the main Fish Bioenergetics 3.0 window, select File/New or press the new-file icon.<br />
The following window will appear.<br />
Fish Bioenergetics 3.0 presents two options for new files, Cohort and Summary. A cohort file<br />
represents a single species of fish at a single life stage, such as an adUlt perch. The cohort can<br />
represent one fish or many fish. A summary file allows you to summarize information from several<br />
open cohort files. For example, you might have two cohort flies open - juvenile perch and adult<br />
perch. Within each cohort file you can determine the consumption by that cohort and its<br />
popUlation, but you might be Interested in determining the overall consumption by both juvenile<br />
and adult perch over the same time period. The summary file facilitates this type of calculation.<br />
.. Highlight Summary and press OK. Fish Bioenergetics 3.0 will open a window similar to the<br />
foilowing.<br />
5-3
Creating a Summary - Analyzing Multiple Cohorts<br />
Minor Setup<br />
5-4<br />
Link summary to original cohorts: When this box is checked (default) then the following are<br />
true:<br />
• Any changes made to the individual cohorts are automatically updated in the<br />
summary<br />
• When a new cohort file is created, it is automatically displayed in the Available<br />
cohorts window of the summary file<br />
• When a cohort file is closed, it is automatically removed from the summary file<br />
Available Cohorts: Any cohort files that are currently open are displayed in this window on the<br />
lett side of the summary window. If a file is listed in this window, it is not inciuded in summary<br />
calculations. These tiles need to be moved to the Summarized Cohorts window to be included in<br />
the summary analysis.<br />
Summarized Cohorts: Any cohorts that are listed in the Summarized Cohorts window are<br />
included in the summary calculations. When cohorts are run in series, the cohorts are linked<br />
sequentially from top to bottom.<br />
Status: The Status lights indicate Whether or not the summarized cohorts have current P-value<br />
calculations and current Bioenergetics Runs. Only the Runs light has to be green for summary<br />
calculations to be executed.<br />
Summary Method: Cohorts can be run in either series or parallel:<br />
• Series: In series, the total number of days in the summary equals the sum of all the<br />
days in the anaiyzed cohorts, and each data point from each cohort becomes a data<br />
point in the summary.<br />
• Parallel: In parallel, analysis days are matched among all the cohorts, and the data<br />
from the same days are added together. The start analysis day will equal the earliest<br />
start day from the cohorts, and the final analysis day will equal the latest final day<br />
from the cohorts. .
Output Interval<br />
Creating a Summary - Analyzing Multiple Cohorts<br />
Set interval· day of simulation: Output will be generated only for those days that equal the<br />
simulation start day + x, where x equais the value typed in the Days field.<br />
Set interval - day of year: Output will be generated only for those days that equal the day of year<br />
+ x, where x e\1uals the value typed in the Days field.<br />
End of mortality period: This option provides output only on those days when a mortality period<br />
has ended. For exampie, if fishing mortality ended on day 200 of your simulation and naturai<br />
mortality ended on day 365 of your simulation, the software would generate three (jOlla points, day<br />
1, day 200, and day 365.<br />
End oi every 365 1h day of year: Assuming xour assi!?ilatipn spans at least 365 days, you can<br />
select this option to see data onlyon the 365 ' day of year. .<br />
End of each cohort; Your summary file will probabiy contain multiple ·cohoI1S. If you're running<br />
your analysis in series, and you would like to see data only on the last ·dflY of each Individual .<br />
cohort's simulation, select this option.<br />
Every day (default): Select this option if you would like output generated for each day of the<br />
simulation.<br />
Days: Enter the number of days in your interval when you've selected'either Set interval- day of<br />
year or Set interval· day of slmuial1on.<br />
First output day: If you would like to limit the range of days in your output, enter the first day of<br />
that range In this field.<br />
Final output day: If you would like to limit the range of days in your output, enter ·the final day of<br />
that range in this fieid.<br />
5-7
Populations and Mortality<br />
Fish Bioenergetics 3.0 allows you to extrapolate the simulation results of a single fish to an entire<br />
population of fishes, while at the same time accounting for mortality in the population. Recall that<br />
a cohort can be a single fish or a group of fish of the same species in fuel same life stage. To<br />
analyze a cohort that has more than one fish, you simply need to perform two setup steps: 1)<br />
Indicate that you would like to Include mortality calculations In your simulation; and 2) Enter<br />
mortality user input data. .<br />
6.1 Mortality Setup and User Input Data<br />
.. From the main Fish Bioenergetics 3.0 window, select Setup/Simulation or press the setup<br />
icon. The following window will appear.<br />
.. Check the Population mortality checkbox within Additlonal Analyses. Press the OK<br />
bUllon, and the User Input Data Files window appears.
)<br />
Populations and Mortality<br />
6·2<br />
You'll see that the Mortality box becomes available. Load user input mortality data by either<br />
browsing for a tab delimited text file or by entering the data manuaily.<br />
Mortality user input data<br />
Although the format for entering mortality user input data is the same as for other data files, the<br />
software interprets the data difterently. To N1ustrate this difference, let's compare the following<br />
mortality user input file and temperature user input file.<br />
Mortality file Temperature file
)<br />
Nitrogen and Phosphorus Analysis<br />
• Check the Nitrogen and phosphorus analysis checkbox within Additional Analyses.<br />
Press the OK button, and the User Input Data Flies window appears.<br />
You'll see that the Nand P Data Flies tab becomes available. Load user input data by either<br />
browsing for a tab delimited text file or by entering the data manually.<br />
Nitrogen and Phosphorus user input data<br />
User input data for N-P analysis follows the same set of rules that applies to other user input data<br />
,as explained in chapter three. You'll also find analogies between the type of data entered for<br />
basic bioenergetics and for N-P analysis. For example, in basic bioenergetics you need data for<br />
the prey energy concentration and the predator energy concentration; whereas, in N-P analysis<br />
you also need data for prey nitrogen and phosphorus concentrations and predator nitrogen and<br />
phosphorus concentrations. '<br />
The difference between basic bioenergetics calculations and N-P calculations is in the<br />
assimilation of consumed nitrogen and phosphorus into the predator's tissue. This assimilation is<br />
quantified in the user input data file, Assimilation efficiency. The values for assimilation<br />
efficiency range from 0 to 1, with a typical value being around 0.7. This means that 30%'of<br />
consumed nutrients are lost as feces and 70% are available for growth and excretion. For an<br />
example of N-P assimilation efficiencies, see section 3.2 Vser Input Data Flies.<br />
7.2 Phosphorus and Nitrogen Calculations<br />
7·2.<br />
Fish Bioenergetics 3.0 applies the N-P calculations to the results of the basic bioenergetics<br />
calculations. Recall that bioenergetics is based on the following energy allocation equation:<br />
Consumption = Growth +Respiration +SDA +Egestlon + Excretion<br />
or<br />
C = G + R + SDA + F + V (where F =egestion and V =excretion)
Nitrogen and Phosphorus Analysis<br />
Consumed phosphorus and nitrogen follows a similar but slightly simplified path. It has three<br />
fates: 1) assimilation into the predator's tissue (G); 2) loss in feoes (F); 3) exoretlon in urine (U) <br />
nutrients are not lost as a result of respiration or speoific dynamic aotion (R and SDA<br />
respectively). These fates oan be quantified in the equation (we'll use phosphorus as ",n<br />
examplet:<br />
where<br />
C p '" mass of P consumed (g)<br />
Gp '" mass of P allooated to growth (g)<br />
Fp '" mass of P lost in feoes (g)<br />
Up'" mass of P lost in urine (g)<br />
_Beoause exoreted nutrients are available for uptake by aquatio primary produoers, we're usually<br />
interested in rearranging the equation-to solve for U: "<br />
We oan aooount for feoal losses through assimilation effioienoy, and thus simplify the equation as<br />
follows:<br />
where<br />
Results<br />
AE p '" assimilation effioienoy read from the user input data file<br />
C p '" mass oonsumption of prey from basic bioenergeuos oaloulations multiplied by the<br />
user input prey oonoentrations of P<br />
G p '" predator growth mass from basic bioenergetios oaloulations multiplied by the user<br />
input predator oonoentration bf P .<br />
7-3
Nitrogen and Phosphorus Analysis<br />
7·4<br />
Once you've executed a bioenergetics run, you can view the N"P output variables by selecting<br />
either the graph or text output options and highlighting the variables of choice.
Contaminant Analysis<br />
Fish Bioenergetics 3.0 allows you to extend the basic bioenergetics calculations to in.clude<br />
contaminant analysis. Section 1, chapter 4, Extended Topics: Nutrient and Contaminant<br />
Analyses describes in detaii the science underlying this analysis. To perform the contaminant<br />
analysis, you simply need to perform three setup steps; 1) Indicate that you wouid like to include<br />
this calculations in your simulation; 2) Provide the appropriate user input data; and 3) Enter user<br />
input parameters.<br />
8.1 Setup, User Input Data, and User Input Parameters<br />
.. From the main Fish Bioenergetics 3.0 Window, select Setup/Simulation or press the setup<br />
icon. The following window will appear.<br />
.. Check the Contaminant analysis checkbox Within Additional Analyses. The radio buttons<br />
immediately below the checkbox become available and require that you select one of the<br />
foilowing three options. .<br />
• Net assimilation efficiency: Select this option if your predator wiil<br />
assimilate contaminants based solely upon data provided in the contaminant<br />
assimiiatlon input data file, The remaining contaminants are eliminated. You
Contaminant Analysis<br />
8-2<br />
will need to know the initial predator concentration for the User Input<br />
Parameters setup. .<br />
• Gross assimilation efficiency + constant elimination: Ifyour predator<br />
assimilates at a rate indicated in your contaminant assimilation Input data file,<br />
and yet loses some of those assimilated contaminants at a constant<br />
allometrically scaled rate, select this option. You wili need to know the initial<br />
predator concentration, and the elimination and aliDmetric constants fDr the<br />
User Input Parameters setup.<br />
• Gross assimilation efficiency + T-dependent elimination: If your predatDr<br />
assimilates at a rate indicated in your cDntamlnant assimilation input data file,<br />
and yet loses SDme Df thDse assimilated contaminants at a rate that's<br />
dependent upon allometry and temperature, select this option. You will need<br />
to knDw the initial predator concentration, the elimlnatiDn and allometric<br />
cDnstants, and the base temperature for eliminatlDn for the User Input<br />
Parameters setup.<br />
.. Press the OK bultDn, and the User Input Data Files window appears.<br />
The Contaminant Data I=lIes tab becomes available. Load user input data by either browsing.for<br />
a tab delimited text file Dr by entering the data manually•<br />
.. Press the OK buttDn, and the User Input Parameters window appears.
Contaminant Analysis<br />
.. Enter an initial predator concentration (or accept the default of 0), and enter the appropriate<br />
data in the additional edit boxes that have been activated for input. Note that activation of an edit<br />
box'is dependent upon the type of elimination selected in your initial setup. Following are· .<br />
descriptions of the possible user input parameters:<br />
• Initial predator concentration (mglkg): The concentration of contaminants in your<br />
predator immediately before the simulation begins. .<br />
• Allometric constant: Mass dependence of contaminant elimination.<br />
• Elimination constant (g-l;/d): Base line elimination rate.<br />
• Base temperature for elimination (degrees C): Scales the temperature<br />
dependence of elimination.<br />
.. Once you've entered your parameters, select OK.<br />
Contaminant user input data<br />
User input data for contaminant analysis follows the same set of rules that applies to other user<br />
input data as explained in chapter three. You'll also find analogies between the type of data<br />
entered for basic bioenergetics and for contaminant analysis. For example, in basic bioenergetics<br />
you need data for the prey energy concentration and the predator energy concentration; whereas,<br />
in contaminant analysis you need data for prey contaminant concentrations.<br />
. The differences between basic bioenergetics calculations and contaminant calculations is in the<br />
assimilation and bioaccumulation of consumed contaminants. The assimilation Is quantified in the'<br />
user input data file, Assimilation efficiency, and the bioacci.lmulation is quantified by the type of<br />
contaminant elimination selected its accompanying user input parameters. The values for<br />
assimilation efficiency range from 0 to 1, Wjtll a typical value being around 0.7. For an eXllmple of<br />
contaminant assimilation efficiencies, see section 3.2 User Input Data Fifes. .<br />
B-3
j<br />
.," '<br />
Schindler, D.W., A.S. Clark, and l.R. Gray. 1971. Seasonal caloric values of freshwater<br />
zooplankton, as determi.ned with a Phillipson bomb calorimeter modH1ed for small samples. J.<br />
Fish. Res. Bd. Canada 28: 559-564.<br />
Snow, N.B. 1972. The 'effect of season and animal size on tile caloric content ofDaphnia<br />
pulicaria. Limnol. Oceanogr. 17: 909-913.<br />
Stewart, D.l. and F.P. Biulcowsld. 1986. Dynamics of co'nsumption and food conversion by<br />
Lake Michigan alewives: an energetic modeling syl1tbesis. Trans. AIDer. Fish. Soc. 115: 643<br />
661.<br />
Vijverberg, J. and T.R. Frank. 1976. The chemical composition and energy contents of<br />
copepods and c1adocerans in relation.to their size. Freshwat. BioI. 6: 333-345.<br />
Wissing, T.E. and A.D. Hasler. 1968. Calorific values of some inveliebrates in Lalce Mendota,<br />
Wisconsin. 1. Fish. Res. Bd.Canada25: 2515-2518.<br />
Wissing, T.E. and A.D. Hasler. 1971. Intraseasonal change in caloric content of some<br />
freshwater invertebrates. Ecology 52: 371-373 ..<br />
" ",'
Appendix C - Nitrogen and Phosphorus<br />
Concentrations for Selected Prey Species<br />
Prey • P concentration N concentration Source<br />
(% of wet mass) (% of wet mass)<br />
copepods 0.072 1.38 Andersen and Hessen (1991)<br />
Bosmina 0.096 1.14 Andersen and Hessen (1991)<br />
perlphylon 0.05-0.1 0.7 -Penczak (1985)<br />
dipterans 0.11 1.22 Nakashima and Leggatt (1980), Pencza!<<br />
(1985)<br />
crayfish 0.16 1.6 Nakashima and Leggett (1980), Penczak<br />
(1985)<br />
Daphnia 0.17 1.14 Andersen and Hessen (1991)<br />
Mysis 0.18 1.72 Nakashima and Leggett (1980), Penczak<br />
(1985)<br />
amphipods 0.18 1.72 Nakashima and Leggett (1980), Penczak<br />
(1985)<br />
odonats larvae 0.18 3.03 Penczak (1985)<br />
YOYfish 0.3-0.5 1.5-2.5 Kraft (1992)<br />
fish 0.5 2.54 Penczak (1985), Davis and Boyd (1975)
publications That Reference Bioenergetics<br />
Karas, P., and G. Thoresson. 1992. An Application of a Bioenergetics Model to Eurasian Perch (Perca<br />
Fluviatilis L). Journal Of Fish Biology 41 :217-230.<br />
Korhonen, P., M. Virtanen, and T. Schuitz. 1995. Bioe.nergetlc Calculation of Mercury Accumulation in<br />
Fish. Water Air And E).oil Pollution BO:1-4.<br />
Kraft, C.E. 1992. Estimates of Phosphorus and Nitrogen Cycling by Fish Using a Bioenergetics<br />
Approach. Can. J. Fish. Aquat. Sci. 49:2596-2604.<br />
Labar, G W. 1993. Use of Bioenergetics Models to Predict the Effect of increased Lake Trout Predation<br />
on Rainbow Smelt Following Sea Lamprey Control. Trans. Am. Fish. Soc. 122:942-950.<br />
Lantry, B.F., and D.J. Stewart. 1993. Ecological Energetics of Rainbow Smelt in the Laurentian Great<br />
Lakes - An Interlake Comparison. Trans. Am. Fish. Soc. 122:951-976.<br />
Leavitt, P.R., D.E. Schindler, A.J. Paul, and A.K. Hardie. 1994. Fossil Pigment Records of Phytoplankton<br />
in Trout-Stocked Alpine Lai
Publications That Reference Bioenergetics<br />
Schindler, D.E., J.F. Kitchell, X. He, and S.R. Carpenter. 1993: Food-Web Structure and Phosphorus<br />
Cycling in Lakes. Trans. Am. Fish. Soc. 122:756-772.<br />
Schneider, DW. 1992. A Bioenergetics Model of Zebra Mussel, Dreissana- Polymorpha, Growth in the<br />
Great-Lakes. Can. J. Fish. Aquat. Sci. 49:1406-1416.<br />
Schultz, T., P. Korhonen, and M. Virtanen. 1995. Mercury Modei Used for Assessment of Dredging<br />
Impacts. Water Air And Soli Pollution 80:1-4.<br />
Shuter, B.J., and J.R. Post. 1990. Climate, Population Viability, and the Zoogeography of Temperate<br />
Fishes. Trans. Am. Fish. Soc. 119:314-336.<br />
Stewart, D.J., and M. Ibarra. 1991. Predation and Production by Salmonine Fishes in Lake- Michigan,<br />
1978-88. Can. J. Fish. Aquat. Sci. 48:909-922. .<br />
Stow, C.A., and S.R. Carpenter. 1994. PCB Ac.cumulatlon in Lake-Michigan Coho and Chinook Salmon<br />
Individual-Based Models Using AliometricfReliltionshlps. Environ. Sci.·& Technol. 28:1543-1549.<br />
Trudel, M., and D. Boisclair. 1996. Estimation of Fish Activity Costs Using Underwater Video Cameras.<br />
Journal Of Fish Biology 48:40-53.<br />
Trudel, M., and D. Boisclair. 1993. An in-Situ Evaluation 01 the Day-to-Day Variation in the Quantity of<br />
Food Consumed by Fish. Can. J. Fish. Aquat. Sci. 50:2157-2165.<br />
Trudel, M., and D. Boisclair. 1994. Seasonal Consumption by Dace (Phoxinus-EOS X P-Neogaeus) - A<br />
comparison Between Field and Bioenergetic Model Estimates. Can. J. Fish. Aquat. ScI. 51 :2558-2567.<br />
Turner, A.M., and G.G. Millelbach. 1990:· Predator Avoidance and Community Structure - Interactions<br />
Among Piscivores, Planktlvores, and Plankton. Ecoiogy 71 :2241-2254.<br />
Waiters, C.J., and J.R. Post. 1993. Density-Dependent Growth and Competitive Asymmetries in Size<br />
Structured Fish Populations - A Theoretical-Model and Recommendations lor Field Experiments. Trans.<br />
Am. Fish. Soc. 122:34-45.<br />
Wu; L., and D.A. Culver. 1994. Daphnia Popuiation-Dynamics in Western Lake Erie - Regulation by Food·<br />
Limitation and Yellow Perch Predation. J. Gt Lakes Res. 20:537-545.<br />
E-G<br />
..",. '....., .. :<br />
".:.:" ,.:::-.
Index - Section 2<br />
A<br />
allometry, 4-11, 8-2<br />
assimilation efficiency, 2-4, 3-4, 4-5, 4-6, 7-2,7-3,8-1,8-2,8-3,8-4<br />
B<br />
base temperature, 4-6, 8-2<br />
bioaccumulatlon, 8-3<br />
bioenergetics run, 6-3,7-4, 8-5<br />
C<br />
calories, 4-4<br />
cohort, 4-1, 4-2,4-3,5-1,5-3,6-1, 6-3, 7-3, 8-5<br />
consumption, 4-4, 4-5, 4-11, 4-15, 4-.16<br />
contaminant; 3-8, 4-5, 4-6; 4-7, 4c10, 4-14, 7-3, 8'1, 8-2, 8-3, 8-4, 8'5<br />
o data files, 3-1, 3-2, 3-3, 3-8, 4-1, 4-4,4-5,4-7,4-8,6-2<br />
diet, 2-2, 2-4, 3-1, 3-2, 3-3,3-4,4-7<br />
document, 1-1, 3-10, 5-1, 5-8<br />
E<br />
edit, 3-9, 4-4, 4-7, 8-3<br />
egestion, 4-14, 4-16, 7-3, 8-4, 8-5<br />
. elimination, 3-8; 4-6,-4-10,8-2,8-3,8-4<br />
energy density, 2-2, 2-4, 3-2, 3-3, 3-4, 3-5, 4-4, 4-5,4-7,4-15<br />
examples, 2-4, 3-2, 3-8, 4-5, 5-3, 5-7, 6-3<br />
exoretion, 4-14,4-16, 6-3,7-2,7-3, B-4, 8-5<br />
F<br />
feoes, 7-2,7-3, B-4<br />
file, 1-1,2-1; 2-2, 3-1, 3-2, 3-3, 3-4, 3-5, 3-10, 4-1, 4-2, 4-7, 4-21, 5-1, 5-3, 5-8, 6-2, 7-2, 8-2<br />
fi.nal day, 3-8, 4-8, 4-14, 4-19, 5-4, 5-7,7-3<br />
final weight, 3c1, 3-8, 4-4, 4-8, 4-11, 4-12<br />
.first day, 3-1, 3-B, 4-8, 4-19, 5-7<br />
FQrmula One, '1'1,2-2,4-17<br />
M<br />
manual entry, "4-8