development of earth fissures in picacho basin, pinal county, arizona ...
development of earth fissures in picacho basin, pinal county, arizona ...
development of earth fissures in picacho basin, pinal county, arizona ...

You also want an ePaper? Increase the reach of your titles
YUMPU automatically turns print PDFs into web optimized ePapers that Google loves.
DEVELOPMENT OF EARTH FISSURES<br />
IN PICACHO BASIN, PINAL COUNTY,<br />
ARIZONA FROM 1959 TO 1989<br />
A Report to the U.S. Bureau <strong>of</strong> Reclamation and<br />
the Arizona Department <strong>of</strong> Transportation<br />
by<br />
Steven Slaff, Garrett W. Jackson, and Philip A. P<strong>earth</strong>ree<br />
Arizona Geological Survey<br />
Open-File Report 89-10<br />
December 1989<br />
Arizona Geological Survey<br />
416 W. Congress, Suite #100, Tucson, Arizona 85701<br />
This report is prelim<strong>in</strong>ary and has not been edited<br />
for reviewed for conformity with Arizona Geological Survey standards
TABLE OF CONTENTS<br />
Introduction 1<br />
Purpose . . 3<br />
Geographic Sett<strong>in</strong>g. . . . . . . . . . . . . . . . . . . . . . . . . . . . . . . . . .. 5<br />
Geologic Sett<strong>in</strong>g . . . . . '.' . . . . . . . . . . . . . . . . . . . . . . . . 6<br />
Quaternary Geology and Geomorphology. . . . . . . . . . . . . . . . . . 6<br />
Stratigraphy . 7<br />
Hydrologic Sett<strong>in</strong>g 9<br />
Research Approach . 10<br />
F<strong>in</strong>d<strong>in</strong>gs . . . . . . 11<br />
Spatial Distribution <strong>of</strong> Earth Fissures. . . . . . . . . . 15<br />
Morphological Indicators <strong>of</strong> Relative Earth-Fissure Age. 15<br />
1) Very Young Fissures. . . . . . . . . . . . . . . . . . . . . . . . . . .. 15<br />
2) Young Fissures . . . . . . . . . . . . . . . . . . . . . . . . . . . . .. 16<br />
3) Mature Fissure. . 16<br />
4) Old Fissures. . . . . . . . . . . . . . . . . . . . . . . . . . . . . . .. 20<br />
5) Very Old Fissures . . . . . . . 20<br />
Fissure Evolution and Reactivation . . . . . . . . . . . . . . . . . . . . . 20<br />
Recognition <strong>of</strong> Incipient Earth Fissures on Aerial Photographs 23<br />
Recognition <strong>of</strong> Earth Fissures on Radar Imagery. . 25<br />
Rates and Patterns <strong>of</strong> Earth-Fissure Development. 25<br />
Methodology. . . . . . . . . . . . . . . . . 26<br />
Propagation Rates . . . . . . . . . . . . . . . . . . . . . . . . . . . . .. 26<br />
Activity Rates . . . . . . . . . . . . . . . . . . . . . . . . . . . . . . .. 26<br />
Total Propagation Rates . . . . . . . . . . . . . . . . . . . . . . . . . .. 28<br />
Activity Rates and Variations <strong>in</strong> Annual Precipitation . . . . . . . . . . . . .. 32<br />
Activity Rates and Intense Precipitation Events. . . . . . 32<br />
Influence <strong>of</strong> Surficial Deposits on Earth-Fissure Development. 35<br />
Summary. . . . . . . . . . . . . . . . . . . . . . . . . . . . . . . . . . . . .. 35<br />
Acknowledgements. . . . . . . . . . . . . . . . . . . . . .. . . . . . . . . . . .. 36<br />
References. . . . . . . . . . . . . . . . . . . . . . . . . . . . . . . . . . . . .. 36
Figure 1<br />
Plate 1<br />
Plate 2<br />
Plate 3<br />
Plate 4<br />
Plate 5<br />
Plate 6<br />
Figure 2<br />
Figure 3<br />
Table 1<br />
Figure 4<br />
Figure 5<br />
Figure 6<br />
Figure 7<br />
Figure 8<br />
Figure 9<br />
Figure 10<br />
Figure 11<br />
Figure 12<br />
Figure 13<br />
Figure 14<br />
Figure 15<br />
Figure 16<br />
Figure 17<br />
Table 2<br />
Figure 18<br />
Table 3<br />
LIST OF ILLUSTRATIONS<br />
Location Map . . . . . . ., 2<br />
Red Rock NW Orthophotoquad Fissure Map . separate<br />
Picacho Reservoir Orthophotoquad Fissure Map . separate<br />
Valley Farms Orthophotoquad Fissure Map. separate<br />
Eloy NE Orthophotoquad Fissure Map . separate<br />
Eloy North Orthophotoquad Fissure Map. separate<br />
Casa Grande Mtns. Orthophotoquad Fissure Map . separate<br />
Very young fissure (photo). . . . . . . . . .. 4<br />
Stratigraphic and Structural Section <strong>of</strong> Picacho Bas<strong>in</strong> 8<br />
Morphologic Data for Selected Fissures . . . . . . . . . . . . . . . .. 12<br />
Very young fissure (photo). . . . . . . . . . . . . . . . . . . . . . . . 17<br />
Very young fissure morphology (photo) 17<br />
Young fissure (photo) 18<br />
Young fissure (photo) 18<br />
Mature fissure morphology (photo). 19<br />
Mature fissure (photo). . . . . . . 19<br />
Old fissure (photo) . 21<br />
Old fissure (photo) . 21<br />
Very old fissure (photo) . . . . . . . . . . . . . . . . . . . . . . . . . 22<br />
Very old fissure morphology (photo) ..... . 22<br />
Reactivated fissure with younger cracks (photo) .24<br />
Reactivated fissure with bench (photo) . . . . . 24<br />
Histogram <strong>of</strong> Individual Fissure Propagation Rates . 27<br />
Histograms <strong>of</strong> Numbers <strong>of</strong> Active Fissures, Individual<br />
Fissure Propagation Rates on the East and West Sides<br />
<strong>of</strong> the Bas<strong>in</strong>, and Regional Average Annual Precipitation . . . . . . . . . . 29<br />
Summary <strong>of</strong> Changes <strong>in</strong> Fissure Activity with Time . . . . . . . . . . . . 30<br />
Graph <strong>of</strong> Cumulative Fissure Lengths on the East<br />
and West Sides <strong>of</strong> the Bas<strong>in</strong> 31<br />
Correlation <strong>of</strong> Intense Storms and Fissure Activity. . . . . . . . . . . . . 34
INTRODUCTION<br />
Earth <strong>fissures</strong> are open surficial tension cracks <strong>in</strong> unconsolidated and semi-consolidated<br />
sediments that may display vertical and/or horizontal displacement. Earth <strong>fissures</strong> have<br />
become <strong>in</strong>creas<strong>in</strong>gly common <strong>in</strong> the sediment-filled bas<strong>in</strong>s <strong>of</strong> southern Arizona where ground<br />
water is be<strong>in</strong>g removed at high rates. Water-table altitude decl<strong>in</strong>e result<strong>in</strong>g from withdrawal<br />
<strong>of</strong> large quantities <strong>of</strong> ground water causes compaction <strong>of</strong> aquifer sediments, and aquifer<br />
compaction leads to land-surface subsidence. Differential subsidence produces stresses <strong>in</strong><br />
sediments, and <strong>fissures</strong> develop where horizontal stresses are relatively large (Strange, 1983).<br />
Earth <strong>fissures</strong> have damaged a variety <strong>of</strong> facilities <strong>in</strong> southern Arizona dur<strong>in</strong>g the past 60<br />
years. The formation <strong>of</strong> <strong>fissures</strong> is one <strong>of</strong> several geologic hazards that must be recognized,<br />
understood, and overcome <strong>in</strong> order to construct and ma<strong>in</strong>ta<strong>in</strong> reliable roads, build<strong>in</strong>gs, utility<br />
systems, and other structures. Under contract to the U.S. Bureau <strong>of</strong> Reclamation (USBR), the<br />
Arizona Geological Survey (AZGS) conducted an evaluation <strong>of</strong> <strong>earth</strong>-fissure <strong>development</strong> <strong>in</strong> a<br />
portion <strong>of</strong> Picacho bas<strong>in</strong> (also called Eloy bas<strong>in</strong> or the lower Santa Cruz River bas<strong>in</strong>) <strong>in</strong> order<br />
to determ<strong>in</strong>e <strong>development</strong> patterns and rates. The locations <strong>of</strong> Picacho bas<strong>in</strong> and the portion<br />
<strong>of</strong> the bas<strong>in</strong> studied are shown <strong>in</strong> Figure 1.<br />
The area was chosen for this <strong>in</strong>vestigation because the Arizona Department <strong>of</strong> Transportation<br />
(ADOT) has obta<strong>in</strong>ed twelve sets <strong>of</strong> aerial photographs <strong>of</strong>it dur<strong>in</strong>g the past 30 years and the<br />
USBR's Central Arizona Project (CAP) aqueductextends through a nearby portion <strong>of</strong> Picacho<br />
bas<strong>in</strong>. The aerial photographs allow detailed spatial and temporal patterns <strong>of</strong> <strong>earth</strong>-fissure<br />
<strong>development</strong> to be determ<strong>in</strong>ed. These patterns are displayed graphically <strong>in</strong> Plates 1 through 6<br />
and are discussed below <strong>in</strong> the F<strong>in</strong>d<strong>in</strong>gs section. In general, the rates <strong>of</strong> formation <strong>of</strong> new<br />
<strong>fissures</strong> and lengthen<strong>in</strong>g <strong>of</strong> exist<strong>in</strong>g <strong>fissures</strong> were highest dur<strong>in</strong>g the late 1960's, mid-1970's,<br />
and late 1980's. The rates were lowest dur<strong>in</strong>g the late 1970's and early to mid-1980's. There<br />
is reasonably good correlation <strong>of</strong> the amount <strong>of</strong> <strong>in</strong>tense precipitation <strong>in</strong> Picacho bas<strong>in</strong> and the<br />
number <strong>of</strong> newly developed <strong>earth</strong> <strong>fissures</strong>. Generalized morphological characteristics have been<br />
identified which allow the relative age <strong>of</strong> a fissure to be estimated, but other variables, such<br />
as sediment gra<strong>in</strong> size and regional slope direction, must also be taken <strong>in</strong>to account. Most<br />
very young <strong>earth</strong> <strong>fissures</strong> cannot be identified on 1:24,000 or smaller-scale aerial photographs<br />
even if the <strong>in</strong>terpreter knows exactly where to look.<br />
1
112°<br />
33°<br />
112°<br />
\<br />
Stanfield'- ...<br />
\<br />
84 ---<br />
-----\@"..<br />
10 {) IOKM<br />
HHHAR!<br />
E3 t==! t-=:1 E3 E3<br />
10<br />
o<br />
10MI<br />
--'" '-.'._.'.<br />
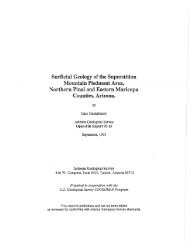
Figure 1. Location map show<strong>in</strong>g approximate extent (shaded) <strong>of</strong> Picacho bas<strong>in</strong>, southcentral<br />
Arizona. The area <strong>in</strong>cluded <strong>in</strong> the study is shown with the cross pattern.<br />
2<br />
""I I<br />
I
Some <strong>earth</strong> <strong>fissures</strong> <strong>in</strong>itially appear as l<strong>in</strong>ear or arcuate, narrow (up to 3 cm- [1.2 <strong>in</strong>.-] wide),<br />
discont<strong>in</strong>uous or en echelon cracks tens to hundreds <strong>of</strong> meters (tens to thousands <strong>of</strong> feet)<br />
long (Figure 2). Other <strong>fissures</strong> are first expressed as series <strong>of</strong> shallow (up to 30 cm- [l ft-]<br />
deep) circular to elongate depressions. Dur<strong>in</strong>g <strong>in</strong>tense ra<strong>in</strong>storms and large human-<strong>in</strong>duced<br />
water discharges, <strong>fissures</strong> erode <strong>in</strong>to so-called fissure gullies (Kam, 1965) as sediment erodes<br />
from the land surface and from the walls <strong>of</strong> the fissure and is deposited at depth. The<br />
maximum dimensions <strong>of</strong> a fissure gully are determ<strong>in</strong>ed by the sediment storage capacity <strong>of</strong> the<br />
fissure, and have reached at least 10 m (33 ft) wide, 6 m (20 ft) deep, and 300 m (984 ft)<br />
long <strong>in</strong> Picacho bas<strong>in</strong>. Some <strong>fissures</strong> apparently develop at depth and propagate upward,<br />
whereas others may open <strong>in</strong>itially at the ground surface and then extend downward (Anderson,<br />
1986).<br />
Fissures <strong>in</strong> surficial sediments may be caused by a number <strong>of</strong> other processes <strong>in</strong> addition to<br />
the sequence <strong>of</strong> ground-water withdrawal, aquifer compaction, and land-surface subsidence.<br />
Other causative processes <strong>in</strong>clude: 1) <strong>earth</strong>quakes; 2) horizontal seepage forces; 3) natural<br />
compaction; 4) horizontal contraction; 5) dessication; and, 6) hydrocompaction (vertical collapse<br />
<strong>of</strong> low-density near-surface sediments <strong>in</strong> response to a large and/or sudden application <strong>of</strong><br />
water) (Anderson, 1986). Fissures caused by dessication and hydrocompactionare common <strong>in</strong><br />
southern Arizona bas<strong>in</strong>s, but their dimensions are considerably smaller than those caused by<br />
water-table altitude decl<strong>in</strong>e, aquifer compaction, and land subsidence. Only those features<br />
associated with water-table altitude decl<strong>in</strong>e are referred to as <strong>fissures</strong> or <strong>earth</strong> <strong>fissures</strong> <strong>in</strong><br />
this paper.<br />
The earliest detailed published report <strong>of</strong> an <strong>earth</strong> fissure occurr<strong>in</strong>g <strong>in</strong> Arizona is Leonard's<br />
(1929) description <strong>of</strong> a feature that formed 4.8 km (3 mi) southeast <strong>of</strong> the town <strong>of</strong> Picacho <strong>in</strong><br />
September 1927. It was approximately 305 m (1000 ft) long, up to 0.9 m (3 £1) wide, and up<br />
to 4.6 m (15 ft) deep. Another fissure nearby is more than 15.8 km (9.8 mi) long at present,<br />
and is the longest <strong>earth</strong> fissure <strong>in</strong> Picacho bas<strong>in</strong> (see Plates 1 and 2). Many other <strong>fissures</strong><br />
have developed <strong>in</strong> the bas<strong>in</strong> s<strong>in</strong>ce the 1920's; the comb<strong>in</strong>ed length <strong>of</strong> all <strong>fissures</strong> <strong>in</strong> the<br />
portion <strong>of</strong> the bas<strong>in</strong> covered <strong>in</strong> this report is >100 km (62 mi) at present.<br />
PURPOSE<br />
There are several goals <strong>of</strong> the project. The ultimate aim is to ga<strong>in</strong> a better understand<strong>in</strong>g <strong>of</strong><br />
<strong>fissures</strong> and the processes that create and modify them so that they will be less hazardous to<br />
3
Figure 2. This very young fissure<br />
(16332b on Table 1) is a s<strong>in</strong>uous<br />
discont<strong>in</strong>uous crack less than 1 cm<br />
(004 <strong>in</strong>.) wide at this po<strong>in</strong>t. See<br />
Plate 6 for location.<br />
4
people and property. Picacho bas<strong>in</strong> was chosen because many sets <strong>of</strong> aerial photographs were<br />
taken along the same flight l<strong>in</strong>e between 1959 and 1989. (No <strong>fissures</strong> were identified on air<br />
photos taken <strong>in</strong> 1936 which cover two isolated parts <strong>of</strong> the bas<strong>in</strong>). Picacho bas<strong>in</strong> was also<br />
chosen because it has an abundance <strong>of</strong> <strong>fissures</strong> <strong>of</strong> various ages, it is readily accessible,<br />
considerable work has been done there previously, and because a portion <strong>of</strong> CAP aqueduct is<br />
located nearby.<br />
Other goals <strong>of</strong> the study <strong>in</strong>clude the follow<strong>in</strong>g: 1) determ<strong>in</strong>e whether <strong>in</strong>cipient or very young<br />
<strong>fissures</strong> may be identified by <strong>in</strong>spect<strong>in</strong>g air photos; 2) assess the roles <strong>of</strong> heavy precipitation<br />
and variations <strong>in</strong> annual climate <strong>in</strong> fissure formation and <strong>development</strong>; 3) determ<strong>in</strong>e if soil and<br />
sediment type affect fissure form and/or <strong>development</strong>; and, 4) attempt to develop a<br />
generalized set <strong>of</strong> time-dependent morphologies that <strong>fissures</strong> exhibit as they age. This is a<br />
pilot project. It is anticipated that related work will be done <strong>in</strong> the future to reduce the<br />
hazards presented by new fissure <strong>development</strong> and exist<strong>in</strong>g <strong>fissures</strong> <strong>in</strong> southern, central, and<br />
western Arizona.<br />
GEOGRAPHIC SETTING<br />
Picacho bas<strong>in</strong> is a low-ly<strong>in</strong>g alluviated expanse <strong>of</strong> approximately 1165 square kilometers (450 sq<br />
mi) <strong>in</strong> P<strong>in</strong>al County, south-central Arizona. Picacho bas<strong>in</strong> is an <strong>in</strong>formal name for a broad<br />
region that does not co<strong>in</strong>cide with the boundaries <strong>of</strong> any s<strong>in</strong>gle ground-water bas<strong>in</strong>. It is a<br />
large physiographic bas<strong>in</strong> bounded on the north by the Santan Mounta<strong>in</strong>s, on the east by the<br />
Picacho Mounta<strong>in</strong>s, on the south by the Silver Bell and West Silver Bell Mounta<strong>in</strong>s, on the<br />
west by the Sawtooth, Silver Reef, and Casa Grande Mounta<strong>in</strong>s, and on the northwest by the<br />
Sacaton Mounta<strong>in</strong>s (Figure 1). Bas<strong>in</strong> altitudes range from 549 m (1800 ft) south <strong>of</strong> Picacho<br />
Peak to 427 m (1400 £1) at Casa Grande. Picacho bas<strong>in</strong> slopes gently down to the northwest<br />
and is dra<strong>in</strong>ed by the Santa Cruz River and a number <strong>of</strong> smaller ephemeral streams. The Gila<br />
River flows across the northernmost portion <strong>of</strong> the bas<strong>in</strong>. The area receives an average <strong>of</strong><br />
208 mm (8.2 <strong>in</strong>.) <strong>of</strong> precipitation per year, based on data collected at five stations for periods<br />
<strong>of</strong> 16 to 41 years end<strong>in</strong>g <strong>in</strong> 1972 (Sellers and Hill, 1984). Slightly more than one half <strong>of</strong> the<br />
annual precipitation arrives from the south and southeast with convective thunderstorms dur<strong>in</strong>g<br />
the summer months. The rema<strong>in</strong>der is brought ma<strong>in</strong>ly from the west by large-scale cyclonic<br />
(frontal) storms dur<strong>in</strong>g the l:;ooler half <strong>of</strong> the year.<br />
Access is excellent to most <strong>of</strong> the parts <strong>of</strong> Picacho bas<strong>in</strong> <strong>in</strong>cluded <strong>in</strong> this study. The area is<br />
5
eolian deposits (see Plates 1-6 for descriptions). Piedmont terraces occur at low altitudes and<br />
are associated with axial dra<strong>in</strong>ages. Relative ages <strong>of</strong> terraces were determ<strong>in</strong>ed only by<br />
exam<strong>in</strong><strong>in</strong>g soil-pr<strong>of</strong>ile <strong>development</strong> because <strong>of</strong> the lack <strong>of</strong> relative altitude differences between<br />
terraces <strong>of</strong> different ages and because agriculture has extensively modified many <strong>of</strong> the<br />
landforms. Climatically <strong>in</strong>duced changes <strong>in</strong> stream power have produced a series <strong>of</strong> alluvial<br />
fans which emanate from the mounta<strong>in</strong>s on the periphery <strong>of</strong> the bas<strong>in</strong> and have steeper<br />
gradients than the piedmont terraces. Eolian landforms <strong>in</strong>clude relict dunes and deflation<br />
pits. These deposits typically are found <strong>in</strong> low-ly<strong>in</strong>g areas. They are extensive near Picacho<br />
Reservoir, creat<strong>in</strong>g a gently undulat<strong>in</strong>g to hummocky surface with low dra<strong>in</strong>age density. Relief<br />
between the dunes and deflation pits is up to 2 m (6.1 ft).<br />
Like the piedmont terraces, alluvial fans <strong>of</strong> different ages do not show large or abrupt<br />
altitude differences: Although older fans tend to occur higher on the piedmont slopes,<br />
altitudes <strong>of</strong> adjacent fans <strong>of</strong> different ages are similar. Fan ages are estimated based on<br />
dra<strong>in</strong>age patterns and the <strong>development</strong> <strong>of</strong> desert pavement, rock varnish, and soil pr<strong>of</strong>iles.<br />
Most piedmont terraces are composed <strong>of</strong> sediment that is too f<strong>in</strong>e-gra<strong>in</strong>ed to develop varnish<br />
or pavement.<br />
Throughout the Quaternary, the areal dra<strong>in</strong>age has been dom<strong>in</strong>ated by discont<strong>in</strong>uous ephemeral<br />
streams. The Santa Cruz River itself may be viewed as a large ephemeral stream that usually<br />
term<strong>in</strong>ates <strong>in</strong> Picacho bas<strong>in</strong>. Its fan has shifted across the bas<strong>in</strong> s<strong>in</strong>ce at least middle<br />
Pleistocene time (approximately 500,000 years ago). The general pattern <strong>of</strong> fan migration can<br />
be seen <strong>in</strong> the distribution <strong>of</strong> piedmont terraces <strong>of</strong> different ages (see Plates 1-6). Tl is<br />
commonly found <strong>in</strong> the northeast, T2 is most extensive <strong>in</strong> the central and north-central bas<strong>in</strong>;<br />
T3 is found primarily <strong>in</strong> the south-central and southwest parts <strong>of</strong> the bas<strong>in</strong>, and Y is most<br />
abundant <strong>in</strong> the southernmost part <strong>of</strong> the bas<strong>in</strong> (much <strong>of</strong> this is not with<strong>in</strong> the mapped area).<br />
Thus the locus <strong>of</strong> deposition seems to have moved from the north and northeast to the south<br />
and southwest. This migration resembles the depositional pattern <strong>of</strong> smaller alluvial fans,<br />
which migrate to ma<strong>in</strong>ta<strong>in</strong> a gradient sufficient to transport their sediment loads. McClellan<br />
Wash seems to have behaved similarly.<br />
Stratigraphy<br />
Picacho bas<strong>in</strong> is a deep structural trough filled with terrigenous deposits <strong>of</strong> middle and late<br />
Cenozoic age (Figure 3). Units that pre-date the Bas<strong>in</strong> and Range disturbance <strong>in</strong>clude<br />
7
Precambrian, Paleozoic, and Mesozoic igneous, metamorphic, and sedimentary rocks, early to<br />
middle Tertiary igneous <strong>in</strong>trusive and metamorphic rocks, and middle Tertiary volcanic and<br />
sedimentary rocks. These units make up the down-dropped floor and walls <strong>of</strong> the bas<strong>in</strong>, most<br />
<strong>of</strong> the pediments, and the mounta<strong>in</strong>s.<br />
Overly<strong>in</strong>g the bas<strong>in</strong> floor is approximately 2335 m (7660 ft) <strong>of</strong> bas<strong>in</strong> fill, which is divided <strong>in</strong>to<br />
lower and upper units based on structural and stratigraphic characteristics (Scarborough and<br />
Peirce, 1978). Lower bas<strong>in</strong> fill is subdivided <strong>in</strong>to a lower part and an upper part. Based on<br />
<strong>in</strong>formation from a 3103 m-deep (10,180 ft-deep) borehole drilled <strong>in</strong> Picacho bas<strong>in</strong> by Chevron<br />
USA Inc., the lower part <strong>of</strong> the lower bas<strong>in</strong> fill is 1824 m (5985 ft) <strong>of</strong> bedded anhydrite with<br />
m<strong>in</strong>or shale. The upper part is 219 m (720 ft) <strong>of</strong> claystone with m<strong>in</strong>or gypsum and anhydrite<br />
overly<strong>in</strong>g halite. Lower bas<strong>in</strong> fill was deposited <strong>in</strong> an <strong>in</strong>ternally dra<strong>in</strong>ed bas<strong>in</strong> dur<strong>in</strong>g the<br />
Bas<strong>in</strong> and Range disturbance, between approximately 13 Ma and 7 Ma.<br />
The lower part <strong>of</strong> the upper bas<strong>in</strong> fill, deposited while tectonic activity waned and then<br />
ceased, consists <strong>of</strong> approximately 291 m (955 ft) <strong>of</strong> claystone with m<strong>in</strong>or gypsum and<br />
anhydrite. These sediments are similar to the underly<strong>in</strong>g upper part <strong>of</strong> the lower bas<strong>in</strong> fill,<br />
and also probablywere deposited <strong>in</strong> a closed bas<strong>in</strong>. The distribution <strong>of</strong> the coarse- and f<strong>in</strong>e<br />
gra<strong>in</strong>ed facies was strongly <strong>in</strong>fluenced by the locations <strong>of</strong>major sources <strong>of</strong> clastic material:<br />
The coarse-gm<strong>in</strong>ed facies was deposited closer to pr<strong>in</strong>cipal sources <strong>of</strong> detritus. The upper<br />
part <strong>of</strong> the upper bas<strong>in</strong> fill is made up <strong>of</strong> 201 m (660 ft) <strong>of</strong> gravel and sand which were<br />
deposited by a gradually aggrad<strong>in</strong>g, regionally <strong>in</strong>tegrated dra<strong>in</strong>age system. Upper bas<strong>in</strong> fill<br />
was deposited after approximately 7 Ma (Pool, 1986). Alluvium <strong>of</strong> the Santa Cruz River is up<br />
to 30 m (100 ft) thick and is found with<strong>in</strong> 3.2 km (2 mi) <strong>of</strong> the present river channel (Pool,<br />
1986).<br />
HYDROLOGIC SETTING<br />
Potentially water-bear<strong>in</strong>g units <strong>of</strong> Picacho bas<strong>in</strong> <strong>in</strong>clude alluvium, bas<strong>in</strong> fill, and some <strong>of</strong> the<br />
older consolidated rocks (Precambrian, Paleozoic, and Mesozoic igneous, metamorphic, and<br />
sedimentary rocks). The older rocks owe their (secondary) permeability to fractures. The<br />
highest discharge rates are obta<strong>in</strong>ed from wells <strong>in</strong> saturated coarse-gra<strong>in</strong>ed alluvium, but the<br />
enormous volume and widespread occurrence <strong>of</strong> bas<strong>in</strong> fill make it the most important aquifer.<br />
Ground water is unconf<strong>in</strong>ed <strong>in</strong> most <strong>of</strong> the aquifers; it is conf<strong>in</strong>ed or semiconf<strong>in</strong>ed <strong>in</strong> sand and<br />
gravel lenses with<strong>in</strong> the f<strong>in</strong>e-gra<strong>in</strong>ed facies <strong>of</strong> the bas<strong>in</strong> fill and with<strong>in</strong> deep portions <strong>of</strong> the<br />
9
f<strong>in</strong>e-gra<strong>in</strong>ed facies.<br />
The depth to the water table <strong>in</strong> 1977 ranged from 30 m to 61 m (100 £1 to 200 ft) below<br />
ground surface near Casa Grande to 122 m to 152 m (400 £1 to 500 ft) near Picacho<br />
(Konieczki and English, 1979). In general, depth to ground water <strong>in</strong>creases from the bas<strong>in</strong><br />
center to the bound<strong>in</strong>g mounta<strong>in</strong>s. Significant rates <strong>of</strong> ground-water withdrawal began <strong>in</strong><br />
Arizona around 1910 (Schumann and Poland, 1970). The withdrawal rate has greatly exceeded<br />
the rate <strong>of</strong> natural and artificial recharge s<strong>in</strong>ce the late 1930's (Strange, 1983). Between 1923<br />
and 1977, water tables decreased <strong>in</strong> altitude by 30 m (100 £1) near £loy, by 91 m (300 ft) near<br />
Picacho, and by almost 152 m (500 £1) near Stanfield, which is 19.3 km (12 mi) west <strong>of</strong> Casa<br />
Grande (Konieczki and English, 1979). Rates <strong>of</strong> water-table altitude decl<strong>in</strong>e as high as 3 m (10<br />
ft) per year have been measured.<br />
As water-table altitude decreases, hydrostatic pressure on dewatered sediments decreases and<br />
effective load <strong>in</strong>creases. Hydrostatic pressure is transmitted to the base <strong>of</strong> the sediments<br />
through pore water, whereas effective load is transmitted through po<strong>in</strong>ts <strong>of</strong> contact between<br />
sediment gra<strong>in</strong>s. Increased effective load causes compaction by reorient<strong>in</strong>g gra<strong>in</strong>s <strong>in</strong> sediments<br />
that were not previously packed as tightly as possible. Compaction at depth causes subsidence<br />
<strong>of</strong> the ground surface. The entire study area.subsided a m<strong>in</strong>imum <strong>of</strong> 0.49 m (1.6 ft) between<br />
1905 and 1977, and a site 4.8 km (3 mi) south <strong>of</strong> Eloy subsided 3.8 m (12.5 ft) dur<strong>in</strong>g the same<br />
period (Laney and others, 1978).<br />
RESEARCH APPROACH<br />
The study began with a review <strong>of</strong> pert<strong>in</strong>ent literature. Much is available, and the AZGS is<br />
presently compil<strong>in</strong>g an exhaustive bibliography <strong>of</strong> references perta<strong>in</strong><strong>in</strong>g to <strong>earth</strong> <strong>fissures</strong>. The<br />
literature reviewed <strong>in</strong>cluded climatic records that were used to determ<strong>in</strong>e the relationship<br />
between <strong>in</strong>tense precipitation events, total annual precipitation, and the formation or<br />
elongation <strong>of</strong> <strong>fissures</strong>.<br />
Eleven sets <strong>of</strong> black and white and one set <strong>of</strong> color aerial photographs were exam<strong>in</strong>ed<br />
stereoscopically to identify and locate <strong>fissures</strong> and to monitor changes <strong>in</strong> the <strong>fissures</strong> over<br />
time. The nom<strong>in</strong>al scale <strong>of</strong> the photos is 1:24,000; they were taken <strong>in</strong> 1959, 1963, 1967, 1969,<br />
1971, May and December 1975,1976,1978,1985,1987, and 1989. The older photos were<br />
10
exam<strong>in</strong>ed first, so that knowledge <strong>of</strong> the locations <strong>of</strong> more-recently formed <strong>fissures</strong> would not<br />
bias the <strong>in</strong>terpretations. Then, after exam<strong>in</strong><strong>in</strong>g the more recent photos, the older photos<br />
were viewed aga<strong>in</strong> to see if <strong>in</strong>cipient <strong>fissures</strong> could be recognized earlier <strong>in</strong> time once the<br />
<strong>in</strong>terpreter had learned where to look for them.<br />
Many <strong>of</strong> the mapped <strong>fissures</strong> were visited <strong>in</strong> the field between February and July 1989. The<br />
locations and lengths <strong>of</strong> the <strong>fissures</strong> were verified, photographs were taken, and morphologic<br />
data were collected (see Table 1). A few <strong>fissures</strong> were discovered dur<strong>in</strong>g the field check<strong>in</strong>g<br />
which do not appear on the aerial photographs because they are young, narrow, and lack<br />
vegetation concentrations. Surficial deposits were mapped on aerial photographs and verified<br />
<strong>in</strong> the field. Reconnaissance check<strong>in</strong>g <strong>of</strong> soil pr<strong>of</strong>iles, desert pavement, rock varnish, gra<strong>in</strong><br />
size distribution, and sediment composition were used to dist<strong>in</strong>guish various deposits.<br />
FINDINGS<br />
The results <strong>of</strong> this study <strong>in</strong>clude: 1) the <strong>development</strong> <strong>of</strong> a morphologic framework with which<br />
to assess relative ages <strong>of</strong> <strong>fissures</strong>; 2) an evaluation <strong>of</strong> whether all exist<strong>in</strong>g <strong>fissures</strong> may be<br />
recognized on 1:24,000-scale aerial photographs; 3) the determ<strong>in</strong>ation <strong>of</strong> rates <strong>of</strong> fissure<br />
<strong>development</strong> dur<strong>in</strong>g the past 30 years; and, 4) the correlation <strong>of</strong> certa<strong>in</strong> aspects <strong>of</strong> climate<br />
with fissure <strong>development</strong>.<br />
It is apparent that many <strong>fissures</strong> progress through a sequence <strong>of</strong> morphologic stages as they<br />
develop. However, evidence <strong>in</strong>dicat<strong>in</strong>g reactivation <strong>of</strong> <strong>fissures</strong> was discovered at more than<br />
one-third <strong>of</strong> the sites exam<strong>in</strong>ed <strong>in</strong> the field. Many <strong>fissures</strong> exhibit variations <strong>in</strong> morphology<br />
along their lengths. Although this may be related to characteristics <strong>of</strong> different surficial<br />
deposits through which the <strong>fissures</strong> extend, many <strong>fissures</strong> actually are different ages at<br />
different po<strong>in</strong>ts. Field studies <strong>in</strong>dicate that it is difficult to detect <strong>in</strong>cipient <strong>fissures</strong> on<br />
1:24,000-scale air photos, s<strong>in</strong>ce a few very young <strong>fissures</strong> were found <strong>in</strong> the field that are not<br />
detectable on the photos. The rates <strong>of</strong> <strong>development</strong> <strong>of</strong> new <strong>fissures</strong> and propagation <strong>of</strong><br />
exist<strong>in</strong>g <strong>fissures</strong> varied by more than an order <strong>of</strong> magnitude dur<strong>in</strong>g the 30-year study period.<br />
Rates <strong>of</strong> formation <strong>of</strong> new <strong>fissures</strong> appear to correlate positively with the frequency <strong>of</strong><br />
<strong>in</strong>tense precipitation events. There also may be an <strong>in</strong>verse relationship between the rate <strong>of</strong><br />
fissure <strong>development</strong> and the amount <strong>of</strong> annual precipitation. In some cases, surficial deposits<br />
exert a strong <strong>in</strong>fluence on fissure form. Each <strong>of</strong> these topics is discussed <strong>in</strong> more detail<br />
below.<br />
11
-tv<br />
Refer.<br />
No.<br />
16332b<br />
26721b<br />
26721a<br />
26712<br />
26711<br />
14421<br />
832<br />
1522<br />
16332a<br />
332<br />
14411<br />
9311b<br />
28351<br />
833<br />
16321<br />
3451<br />
10321<br />
834<br />
23322<br />
9311a<br />
28341<br />
Width (m)<br />
M<strong>in</strong> Max Avg<br />
0.1<br />
0.1<br />
0.2<br />
0.1<br />
0.5<br />
0.5<br />
0.5<br />
1.0<br />
0.5<br />
3.0<br />
0.1<br />
2.5<br />
0.1<br />
0.2<br />
3.0<br />
2.5<br />
1.8<br />
2.0<br />
1.0<br />
1.0<br />
1.8<br />
2.1<br />
4.0<br />
9.0<br />
2.5<br />
3.5<br />
4.0<br />
10.0<br />
4.0<br />
>1.4<br />
5.0<br />
0.01<br />
0.01<br />
0.3<br />
0.7<br />
0.7<br />
0.8<br />
0.5<br />
1.5<br />
2.0<br />
3.0<br />
1.7<br />
3.0<br />
1.0<br />
3.9<br />
Depth (m)<br />
M<strong>in</strong> Max Avg<br />
1.0<br />
0.6<br />
0.3<br />
0.1<br />
0.1<br />
0.2<br />
0.1<br />
0.5<br />
0.2<br />
0.2<br />
0.2<br />
0.8<br />
3.3+<br />
1.3<br />
0.8<br />
2.1<br />
1.5<br />
6.1<br />
2.1<br />
3.5<br />
4.5<br />
4.0<br />
3.7<br />
2.5<br />
2.2<br />
2.0<br />
2.0<br />
>1.7<br />
1.7<br />
1.6<br />
0.8<br />
0.4<br />
1.0<br />
0.7<br />
1.5<br />
0.8<br />
2.2<br />
1.2<br />
1.3<br />
0.6<br />
1.3<br />
Wall<br />
Slope<br />
vt<br />
vt<br />
vt-vt+<br />
st<br />
st<br />
vt-gn<br />
vt<br />
vt<br />
vt<br />
est<br />
vt-v st<br />
vt<br />
vt<br />
vt-gn<br />
st-vt<br />
"gn-vt<br />
vt-vt+<br />
gn-vt<br />
vt-gn<br />
st<br />
Floor Head·<br />
Topo· Cut<br />
graphy Length<br />
e ir<br />
e ir<br />
e ir<br />
fl<br />
fl-hm<br />
ir-fl<br />
vir<br />
ir<br />
ir<br />
ir<br />
hm<br />
vir<br />
fl, hm<br />
sm-hm<br />
hm<br />
fl-hm<br />
sm-ir<br />
sm-ir<br />
ir<br />
fl-s ir<br />
o<br />
o<br />
3<br />
7<br />
8<br />
4<br />
o<br />
3<br />
8<br />
27<br />
75<br />
10<br />
25<br />
React·<br />
ivation<br />
Features<br />
N<br />
N<br />
Y<br />
Y<br />
N<br />
Y<br />
N<br />
Y<br />
N<br />
N<br />
N<br />
N<br />
Y<br />
Y<br />
N<br />
Bench<br />
Above<br />
Floor<br />
N<br />
N<br />
N<br />
N<br />
N<br />
N<br />
N<br />
N<br />
N<br />
N<br />
Y<br />
Y<br />
Y<br />
Y<br />
Y<br />
Vert.<br />
Dsplce·<br />
mnt<br />
N<br />
N<br />
N<br />
N<br />
N<br />
N<br />
Y?<br />
N<br />
N<br />
N<br />
N<br />
N<br />
N<br />
N<br />
N<br />
N<br />
N<br />
N<br />
0.7<br />
N<br />
Predom.<br />
Gra<strong>in</strong><br />
Size<br />
sisa<br />
sisa<br />
sisa<br />
sisa<br />
sisa<br />
si f sa<br />
si f sa<br />
sisa<br />
gr<br />
sa si<br />
sisa<br />
sisa<br />
si cI sa<br />
sa si<br />
sasi<br />
si f sa<br />
sa si<br />
sisa<br />
sa si<br />
cI si<br />
Stand· Morpho<strong>in</strong>g<br />
logic<br />
Water Age<br />
Table 1. Morphologic data from selected <strong>earth</strong> <strong>fissures</strong> <strong>in</strong> Picacho bas<strong>in</strong>. Abbreviations are expla<strong>in</strong>ed at the end <strong>of</strong> the table. All measurements<br />
are reported <strong>in</strong> meters.<br />
N<br />
N<br />
N<br />
N<br />
N<br />
N<br />
N<br />
N<br />
N<br />
N<br />
N<br />
N<br />
N<br />
N<br />
N<br />
Y<br />
N<br />
N<br />
N<br />
Y<br />
2<br />
2<br />
2<br />
2<br />
2<br />
2<br />
2<br />
2<br />
2<br />
2<br />
2<br />
3<br />
3<br />
3<br />
3<br />
3<br />
3<br />
3<br />
3
Spatial Distribution <strong>of</strong> Earth Fissures<br />
Many <strong>earth</strong> <strong>fissures</strong> form where alluvium thickness changes abruptly. This <strong>in</strong>cludes the<br />
follow<strong>in</strong>g sett<strong>in</strong>gs: 1) buried faults; 2) sites where bedrock is locally relatively shallowly<br />
buried (such as <strong>in</strong>selbergs, which are outly<strong>in</strong>g bedrock bodies that are connected with the<br />
pr<strong>in</strong>cipal mounta<strong>in</strong> mass at depth); 3) buried pediment edges; and, 4) convex-topped positive<br />
gravity anomalies (Christie, 1978). Compar<strong>in</strong>g Plates 1 through 6 with gravity maps <strong>of</strong> the<br />
region (for example, Oppenheimer, 1980) shows that many Picacho bas<strong>in</strong> <strong>fissures</strong> are located at<br />
sites <strong>of</strong> marked changes <strong>in</strong> alluvium thickness. Most <strong>of</strong> these sites occur close to the<br />
mounta<strong>in</strong>s near the perimeter <strong>of</strong> the bas<strong>in</strong>, and the <strong>fissures</strong> trend subparallel to the bas<strong>in</strong><br />
boundary.<br />
Differential subsidence and <strong>earth</strong> <strong>fissures</strong> also occur <strong>in</strong> the central parts <strong>of</strong> the bas<strong>in</strong>, away<br />
from areas <strong>of</strong> abrupt alluvium-thickness change. These <strong>fissures</strong> are probably related to<br />
sedimentological and/or hydrologic changes <strong>in</strong> the bas<strong>in</strong> fill along relatively short horizontal<br />
distances (Anderson, 1986). Such conditions may <strong>in</strong>clude changes <strong>in</strong> gra<strong>in</strong> size, quantity and<br />
composition <strong>of</strong> matrix or cement, and aquifer thickness, water content, or water depth.<br />
Aquifer sediments conta<strong>in</strong><strong>in</strong>g alarge.percentage<strong>of</strong>silt andclay are particularly susceptible to<br />
compaction.<br />
Morphological Indicators <strong>of</strong> Relative Earth-Fissure Age<br />
Earth <strong>fissures</strong>, once formed, may follow one or more <strong>of</strong> a number <strong>of</strong> paths <strong>of</strong> <strong>development</strong> and<br />
modification. Changes <strong>in</strong> fissure morpholgy over time depend on factors such as<br />
bedrock/alluvium bas<strong>in</strong> geometry, sedimentology <strong>of</strong> alluvium, orientation <strong>of</strong> the fissure with<br />
respect to surficial dra<strong>in</strong>age pattern, regional and local slope, size <strong>of</strong> watershed, weather<br />
patterns, and magnitude and rate <strong>of</strong> local and regional subsidence. The path <strong>of</strong> fissure<br />
<strong>development</strong> that appears to be the most common <strong>in</strong> Picacho bas<strong>in</strong> consists <strong>of</strong> the five stages<br />
described below. Characteristics which typify each morphologic age group (1 through 5) are<br />
summarized <strong>in</strong> Table 1.<br />
1) Very Young Fissures. Narrow (up to 12 cm- [4.7 <strong>in</strong>.-] wide) discont<strong>in</strong>uous cracks, pits,<br />
and depressions form at the ground surface either preced<strong>in</strong>g or follow<strong>in</strong>g fissure formation at<br />
depth. Portions <strong>of</strong> the <strong>in</strong>itial fissure may be up to 1 m (3.3 ft) wide. The overall length is<br />
15
up to 500 m (1640 ft) or more. Fissure walls are very steeply slop<strong>in</strong>g or vertical (Figures 4<br />
and 5), and <strong>fissures</strong> may be several meters (tens <strong>of</strong> feet) to tens <strong>of</strong> meters (scores <strong>of</strong> feet)<br />
deep (Strange, 1983). It has been postulated that some <strong>fissures</strong> may extend from the ground<br />
surface to the orig<strong>in</strong>al water table that was present before excessive ground water extraction<br />
dra<strong>in</strong>ed the aquifer (Holzer and Davis, 1976). Very young <strong>fissures</strong> <strong>in</strong>terrupt dra<strong>in</strong>age channels<br />
that cross them and display no "tributary" dra<strong>in</strong>ageways (headcuts) that feed <strong>in</strong>to the <strong>fissures</strong>.<br />
They have no concentrations <strong>of</strong> vegetation along them, but there may be disrupted plants<br />
which have fallen or shifted. Some display series <strong>of</strong> en echelon cracks. The bottoms <strong>of</strong> very<br />
young <strong>fissures</strong> (where observable) are steeply slop<strong>in</strong>g, irregular, and V-shaped. In other cases,<br />
coherent down-dropped "graben" blocks occur.<br />
2) Young Fissures. Fissures that have existed for some time have been modified by the<br />
processes <strong>of</strong> erosion, sedimentation, and mass wast<strong>in</strong>g. They are wider (approximately 1 m<br />
[3.3 ft] to 3 m [9.8 ft] wide), more cont<strong>in</strong>uous, and <strong>in</strong> some cases longer than very young<br />
<strong>fissures</strong>. The widen<strong>in</strong>g is accomplished by mass wast<strong>in</strong>g and erosion,which also reduce wall<br />
slope angles slightly as fissure gullies beg<strong>in</strong> to form (Figure 6). Deposition <strong>of</strong> sediment<br />
smooths out irregularities <strong>of</strong> floors and beg<strong>in</strong>s to change V-shaped cross sections to U -shaped<br />
pr<strong>of</strong>iles (Figure 7). Earth-fissure formation causes a local lower<strong>in</strong>g <strong>of</strong> base level for streams<br />
that formerlyflowedacross·an undisturbed surface;·That tends to cause channel down-cutt<strong>in</strong>g<br />
(erosion) by the stream upslope from the fissure, and deposition <strong>of</strong> sediment <strong>in</strong> the fissure.<br />
Dur<strong>in</strong>g run<strong>of</strong>f events,headcuts form at the fissure and advance upslope. Some headcuts form<br />
on the downslope sides <strong>of</strong> <strong>fissures</strong> and advance downslope by revers<strong>in</strong>g the local dra<strong>in</strong>age<br />
slope direction. S<strong>in</strong>ce <strong>fissures</strong> catch and reta<strong>in</strong> run<strong>of</strong>f, vegetation beg<strong>in</strong>s to concentrate <strong>in</strong><br />
and along them. As they age, <strong>fissures</strong> may lengthen and/or become reactivated and develop<br />
systems <strong>of</strong> subparallel cracks and pits (discussed below).<br />
3) Mature Fissures. Older <strong>fissures</strong> express the cont<strong>in</strong>ued operation <strong>of</strong> the processes described<br />
above. Widths <strong>in</strong>crease to the 2 m to 4 m (6.6 ft to 13.1 ft) range as gullies are fully<br />
expressed. Most mature <strong>fissures</strong> are cont<strong>in</strong>uous features, and their walls slope less steeply<br />
than before unless the sediment is cohesive. They are shallower, with flatter, less hummocky<br />
floors because deposition has partially filled the gullies. Their cross sections are U -shaped<br />
and more regular (Figure 8). Headcuts extend small "tributary" dra<strong>in</strong>age channels farther from<br />
the <strong>fissures</strong>. Preexist<strong>in</strong>g streams that orig<strong>in</strong>ally crossed the area are disrupted and locally<br />
steepened <strong>in</strong> response to the fissure-imposed base-level fall. Dense vegetation, which makes<br />
older <strong>fissures</strong> appear strik<strong>in</strong>g on aerial photographs, l<strong>in</strong>es the features (Figure 9). Individual<br />
16
Figure 6. Young fissure (9311b on Table 1), which has<br />
undergone erosion and mass wast<strong>in</strong>g, is wider and has less<br />
steeply slop<strong>in</strong>g walls than a very young fissure. See Plate<br />
2 for location.<br />
Figure 7. Young fissure (1522 on<br />
Table 1) is becom<strong>in</strong>g a fissure gully.<br />
See Plate 1 for location.<br />
18
Figure 8. Flat floor and V-shaped<br />
cross section typical <strong>of</strong> mature<br />
morphology. This fissure (332 on<br />
Table 1) is classified as young based<br />
on a consideration <strong>of</strong> all <strong>of</strong> its<br />
morphologic parameters. See Plate 1<br />
for location.<br />
Figure 9. Mature fissure (833 on<br />
Table 1) show<strong>in</strong>g large width, Vshaped<br />
cross section, and abundant<br />
vegetation. Good example <strong>of</strong> a<br />
fissure gully. See Plate 1 for<br />
location.<br />
19
Figure 10. Old fissure (28331 on Table 1) is shallow<br />
because <strong>of</strong> <strong>in</strong>fill<strong>in</strong>g by sediment. Notice flat floor, gently<br />
slop<strong>in</strong>g wall on right, and presence <strong>of</strong> vegetation. See Plate<br />
1 for location.<br />
Figure 11. Old fissure (8311b on Table 1) is charJcterized<br />
by smooth slopes, large width, shallow depth, and roundet.i<br />
or<strong>of</strong>ile. Large plants l<strong>in</strong>e the fissure. See Pbte 1 for<br />
location.<br />
21
Figure 12 Very old fissure (6431 on Table 1) appears as a<br />
barely discernible swale l<strong>in</strong>ed with widely scattered<br />
creosotebush. See Plate 6 for location.<br />
Figure 13. Very old portion <strong>of</strong> an old fissure (6411 on<br />
Table 1) is subtle and almost completely filled with<br />
sediment. A band <strong>of</strong> concentrated vegetation is the most<br />
strik<strong>in</strong>g <strong>in</strong>dication <strong>of</strong> the feature's presence. See Plate 6<br />
for location.<br />
22
than time also help to determ<strong>in</strong>e the shapes <strong>of</strong> <strong>fissures</strong>. Many appear to have proceeded<br />
through the five stages <strong>of</strong> <strong>development</strong> (for example, the long fissure that formed before<br />
August 1959, extends to the northwest, and is located 0.8 km [0.5 mil south <strong>of</strong> the 1-10/1-8<br />
<strong>in</strong>terchange on Plate 6). Others have developed differently. Fissures such as portions <strong>of</strong> the<br />
one portrayed on Plate 5 at 32 deg. 49' north latitude and III deg. 22' west longitude have<br />
reta<strong>in</strong>ed nearly the same appearance on the air photos over the past 30 years. Some have<br />
cont<strong>in</strong>ued to lengthen and have developed subsidiary, <strong>in</strong>tersect<strong>in</strong>g cracks that make them more,<br />
rather than less, prom<strong>in</strong>ent on air photos as time goes on. An example ot this type <strong>of</strong><br />
feature, called a reactivated fissure, is shown on Plate 1 at 32 deg. 41' north latitude and III<br />
deg. 27' west longitude. The 30-year time span for which aerial photographs <strong>of</strong> Picacho bas<strong>in</strong><br />
were available for this study is too short a period <strong>in</strong> which to document the patterns <strong>of</strong><br />
<strong>development</strong> <strong>of</strong> those <strong>earth</strong> <strong>fissures</strong> that were already well established <strong>in</strong> 1959.<br />
Evidence <strong>of</strong> reactivation <strong>of</strong> <strong>earth</strong> <strong>fissures</strong> was discovered at 20 <strong>of</strong> the 51 field sites visited.<br />
Reactivation is manifested <strong>in</strong> two ways: 1) Younger cracks, pits, and/or depressions occur<br />
adjacent and subparallel to a fissure. Such features found along very young <strong>fissures</strong> merely<br />
<strong>in</strong>dicate on-go<strong>in</strong>g <strong>development</strong>, but along subdued older <strong>fissures</strong> they demonstrate reactivation<br />
(Figure 14). Subparallel surficial cracks may represent only a s<strong>in</strong>gle fissure at depth. 2) One<br />
or more benches exist above the bottom <strong>of</strong>the ma<strong>in</strong> fissure gully (Figure 15). Such benches<br />
may show the location <strong>of</strong> a previously formed fissure floor which has been broken by<br />
renewed tension (<strong>in</strong>dicat<strong>in</strong>g reactivation). Alternatively, they may be simply bridges that<br />
formed as the fissure filled with sediment which was subsequently partially removed by<br />
erosion, or they may result from delayed compaction <strong>of</strong> fill sediment (not related to<br />
reactivation). Benches above the floors <strong>of</strong> "tributary" stream channels empty<strong>in</strong>g <strong>in</strong>to fissure<br />
gullies, however, do <strong>in</strong>dicate possible reactivation.<br />
Recognition <strong>of</strong> Incipient Earth Fissures on Aerial Photographs<br />
One <strong>of</strong> the purposes <strong>of</strong> this <strong>in</strong>vestigation was to determ<strong>in</strong>e if <strong>in</strong>cipient or very young <strong>fissures</strong><br />
may be identified by <strong>in</strong>spect<strong>in</strong>g air photos. Unfortunately, <strong>in</strong> most cases they cannot be<br />
identified even when h<strong>in</strong>dsight dictates exactly where to look. The small widths and lack <strong>of</strong><br />
concentrated vegetation along these <strong>fissures</strong> render them <strong>in</strong>visible on 1:24,000-scale air photos.<br />
The young fissure' at 47 deg. 30' north latitude and III deg. 39' 45" west longitude on Plate 6<br />
was discovered unexpectedly <strong>in</strong> the field dur<strong>in</strong>g March 1989. It may be fa<strong>in</strong>tly visible on the<br />
1987 air photos (know<strong>in</strong>g where to look), but if it had not been mapped <strong>in</strong> the field it<br />
23
Figure 14. Young and very young cracks (9311b on Table<br />
1) <strong>in</strong>dicate that the old fissure located outside <strong>of</strong> the field<br />
<strong>of</strong> view to the left has been reactivated recently. See<br />
Plate 2 for location.<br />
Figure 15. Crack <strong>in</strong> foreground<br />
resulted from reactivation <strong>of</strong> this·<br />
fissure (834 on Table 1). The bench<br />
on either side <strong>of</strong> the crack is the<br />
former fissure floor, and the top <strong>of</strong><br />
the wall <strong>in</strong> the background is the<br />
orig<strong>in</strong>al ground surface. See Plate 1<br />
for location.<br />
24
certa<strong>in</strong>ly would not have been shown on Plate 6.<br />
Larger-scale air photos are <strong>of</strong> some use <strong>in</strong> locat<strong>in</strong>g very young or <strong>in</strong>cipient <strong>fissures</strong>. Good<br />
quality enlargements up to lOX the scale <strong>of</strong> the orig<strong>in</strong>al photograph (1:2,400 for 1:24,000-scale<br />
photos) may be made from some negatives, but are difficult to view stereoscopically. ADOT<br />
personnel have enlarged photos taken at a scale <strong>of</strong> 1:1,920 to a scale <strong>of</strong> 1:192 (1 em = 1.9 m<br />
or 1 <strong>in</strong>. = 16 ft) for site-specific <strong>in</strong>spection <strong>of</strong> a mature fissure <strong>in</strong> Maricopa County. ADOT<br />
supplied 5X and lOX enlargements <strong>of</strong> selected 1:24,000-scale air photos <strong>of</strong> Picacho bas<strong>in</strong>. The<br />
enlargements show exceptional detail, allow<strong>in</strong>g the <strong>in</strong>terpreter to p<strong>in</strong>po<strong>in</strong>t sites <strong>of</strong> active<br />
fissure <strong>development</strong>. Many young <strong>fissures</strong> that lack vegetation concentrations can be<br />
identified and, <strong>in</strong> some cases, <strong>in</strong>cipient <strong>fissures</strong> can be recognized. Future studies may <strong>in</strong>volve<br />
detailed analyses <strong>of</strong> these enlarged photos and field check<strong>in</strong>g <strong>in</strong> an attempt to locate all<br />
<strong>fissures</strong> <strong>in</strong> the critical area near Brady and Picacho Pump Stations on the CAP aqueduct (Plate<br />
2).<br />
It is impractical to use enlarged air photos for fissure identification <strong>in</strong> regional <strong>in</strong>vestigations.<br />
For such studies, the approach taken by Anderson (1986) is useful. By evaluat<strong>in</strong>g the<br />
distributions <strong>of</strong> conditions known to promote formation <strong>of</strong> <strong>earth</strong> <strong>fissures</strong>, he predicted areas<br />
where <strong>fissures</strong> are likely to form <strong>in</strong>the future. Those areas may be photographed atlarge<br />
scales and field checked regularly.<br />
Recognition <strong>of</strong> Earth Fissures on Radar Imagery<br />
Side-look<strong>in</strong>g airborne radar imagery was evaluated as a potential tool for identify<strong>in</strong>g <strong>fissures</strong><br />
(Litton Aero Service and Goodyear Aerospace, 1972). It proved not to be useful at the<br />
largest scale (1:62,500) at which coverage <strong>of</strong> Picacho bas<strong>in</strong> is available. Land-surface features<br />
appear gra<strong>in</strong>y and fuzzy, and only the longest, heavily vegetated, and best-established <strong>fissures</strong><br />
are visible.<br />
Rates and Patterns <strong>of</strong> Earth-Fissure Development<br />
Repeated aerial photographic surveys flown along the path <strong>of</strong> Interstate Highway 10 through<br />
Picacho bas<strong>in</strong> from 1959 to 1989 provide a data base with which to explore some facets <strong>of</strong><br />
<strong>earth</strong>- fissure <strong>development</strong> with time. As described above, <strong>fissures</strong> recognizable on air photos<br />
were mapped for each moment <strong>in</strong> time represented by the photographs. This process<br />
25
documented the formation and lengthen<strong>in</strong>g <strong>of</strong> <strong>in</strong>dividual <strong>fissures</strong>, which provided data with<br />
which to evaluate temporal variations <strong>in</strong> fissure <strong>development</strong> rate. The magnitudes <strong>of</strong> average<br />
and extreme fissure-<strong>development</strong> rates are now known. These data were compared with<br />
climatic records to see if correlations exist.<br />
Methodology. Field work conducted <strong>in</strong> 1989 <strong>in</strong>dicates that <strong>in</strong>terpretation <strong>of</strong> air photos<br />
faithfully reveals young, mature, and old <strong>fissures</strong> (age groups 2, 3, and 4) because they tend<br />
to be fairly cont<strong>in</strong>uous and have dist<strong>in</strong>ctive vegetation associated with them. Very young<br />
(age group 1) and very old (age group 5) <strong>fissures</strong> may not be evident on aerial photographs.<br />
Fissures were mapped on each set <strong>of</strong> air photos and then were compared with those mapped<br />
on older sets <strong>of</strong> photos <strong>of</strong> the same area; newly developed <strong>fissures</strong> were noted and<br />
transferred to 1:24,000-scale orthophotoquads. Lengths <strong>of</strong> <strong>fissures</strong> developed between aerial<br />
photo surveys were then measured on orthophotoquads on the east and west sides <strong>of</strong> Picacho<br />
bas<strong>in</strong> (portions <strong>of</strong> the Newman Peak [Red Rock NW orthophotoquad] and Casa Grande Mts.<br />
quadrangles). The number <strong>of</strong> active <strong>fissures</strong> and their lengths were summed, respectively, for<br />
each <strong>of</strong> the ten <strong>in</strong>tervals between air photo surveys. "Active" <strong>fissures</strong> refers to both<br />
lengthened and previously undetected ones. Intervals between photo surveys vary<br />
substantially; both the numbers <strong>of</strong> active <strong>fissures</strong> and their amounts <strong>of</strong> lengthen<strong>in</strong>g were<br />
normalized to rates per year <strong>in</strong> orderto evaluate temporal variations <strong>in</strong> <strong>development</strong>.<br />
Propagation Rates. Rates <strong>of</strong> lengthen<strong>in</strong>g (or gap-fill<strong>in</strong>g) vary substantially from air photo<br />
survey <strong>in</strong>terval to <strong>in</strong>terval. The average propagation rate <strong>of</strong> <strong>in</strong>dividual <strong>fissures</strong> over the<br />
entire 29.5-year period <strong>of</strong> record is approximately 76 m/yr (249 ft/yr). This rate was<br />
calculated by divid<strong>in</strong>g the total length <strong>of</strong> <strong>fissures</strong> that developed dur<strong>in</strong>g each <strong>in</strong>terval<br />
between air photo surveys by the number <strong>of</strong> <strong>fissures</strong> that lengthened dur<strong>in</strong>g each <strong>in</strong>terval;<br />
<strong>fissures</strong> that were not active were not <strong>in</strong>cluded <strong>in</strong> the calculations. Average rates range from<br />
approximately 100 m/yr (330 ft/yr) dur<strong>in</strong>g the past two years to approximately 20 m/yr (66<br />
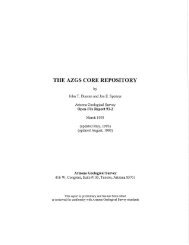
ft/yr) between 1978 and 1985 (Figure 16). The maximum propagation rate <strong>of</strong> any fissure <strong>in</strong><br />
the study area is 529 m/yr (1736 ft/yr). Dur<strong>in</strong>g the <strong>in</strong>terval from 1976 to 1985, no fissure<br />
lengthened more rapidly than 70 m/yr (230 ft/yr). Clearly, <strong>fissures</strong> may propagate rapidly, and<br />
apparently they tend to lengthen most rapidly dur<strong>in</strong>g <strong>in</strong>tervals when many <strong>fissures</strong> are active<br />
(see below for further discussion).<br />
Activity Rates. The number <strong>of</strong> active <strong>fissures</strong> (that is, newly detected or newly lengthened)<br />
dur<strong>in</strong>g each <strong>in</strong>terval between air photo surveys is another measure <strong>of</strong> temporal variation <strong>in</strong><br />
26
600<br />
500<br />
400<br />
m/yr 300<br />
200<br />
100<br />
• average<br />
!iii maximum<br />
0+--"'1'"<br />
Aug- Dec- Aug- Jun- Nov- May- Dec- Jan- May- Aug- Mar-<br />
59 63 67 69 71 75 76 78 85 87 89<br />
Figure 16. Propagation rates <strong>of</strong> <strong>in</strong>dividual <strong>fissures</strong> <strong>in</strong> the portions <strong>of</strong> Picacho bas<strong>in</strong> covered by<br />
repeated aerial photo surveys. "Average "values represent the average rate <strong>of</strong> lengthen<strong>in</strong>g <strong>of</strong><br />
those <strong>fissures</strong> that were active dur<strong>in</strong>g any given <strong>in</strong>terval; "maximum" values are the maximum<br />
rate <strong>of</strong> lengthen<strong>in</strong>g observed for any fissure dur<strong>in</strong>g the same <strong>in</strong>terval. The average rate <strong>of</strong><br />
lengthen<strong>in</strong>g for all <strong>fissures</strong> active between 1959 and 1989 is 76 m/yr.<br />
27
fissure <strong>development</strong> <strong>in</strong> Picacho bas<strong>in</strong>. The number <strong>of</strong> active <strong>fissures</strong> per year has varied<br />
substantially dur<strong>in</strong>g the past 30 years. Fissure activity reached its highest rate <strong>in</strong> the past<br />
one-and-a-half years (from Aug. 1987 to Mar. 1989). Similar activity rates were common<br />
dur<strong>in</strong>g the mid- and late 1960's and the mid-1970's (Figure 17; Table 2). The period from 1978<br />
to 1985 was one <strong>of</strong> very low levels <strong>of</strong> fissure activity. The early 1960's and early 1970's were<br />
times <strong>of</strong> <strong>in</strong>termediate rates. M<strong>in</strong>imum and maximum rates <strong>of</strong> activity per year differ by more<br />
than an order <strong>of</strong> magnitude, and this variation has occurred with<strong>in</strong> the past 12 years.<br />
Patterns <strong>of</strong> fissure activity are more complex if the east and west sides <strong>of</strong> Picacho bas<strong>in</strong> are<br />
considered separately. The mid- and late 1960's was the period <strong>of</strong> maximum activity <strong>in</strong> the<br />
Casa Grande Mts. quadrangle, on the west side <strong>of</strong> the bas<strong>in</strong>. Dur<strong>in</strong>g this <strong>in</strong>terval the Newman<br />
Peak quadrangle (Red Rock NW orthophotoquad), on the east side <strong>of</strong> the bas<strong>in</strong>, experienced<br />
moderate to low levels <strong>of</strong> fissure activity. In the early to mid-1970's the situation was<br />
reversed, with high rates <strong>of</strong> activity <strong>in</strong> the Newman Peak quadrangle and low to moderate<br />
rates <strong>in</strong> the Casa Grande Mts. quadrangle. Thus, the east and west sides alternately<br />
experienced moderate to high rates dur<strong>in</strong>g these <strong>in</strong>tervals. There has been little difference <strong>in</strong><br />
rates <strong>of</strong> fissure activity on either side <strong>of</strong> the bas<strong>in</strong> s<strong>in</strong>ce 1976.<br />
Total PropagationRates.. The most quantitative measure <strong>of</strong>activity is the total length <strong>of</strong><br />
<strong>fissures</strong> that developed between air photo surveys. This measure, also normalized to rate <strong>of</strong><br />
lengthen<strong>in</strong>g per year, reveals the same generalpatterns as the number <strong>of</strong> active <strong>fissures</strong> per<br />
year discussed above. The highest rate <strong>of</strong> fissure-lengthen<strong>in</strong>g occurred dur<strong>in</strong>g the 1963-1967<br />
<strong>in</strong>terval, but the rate dur<strong>in</strong>g the 1987-1989 <strong>in</strong>terval is almost as high (Table 2; Figures 17 and<br />
18). In the 1960's, primarily the west side <strong>of</strong> Picacho bas<strong>in</strong> experienced high rates <strong>of</strong> activity,<br />
and the east side was more active dur<strong>in</strong>g the early to mid-1970's. The east and west sides<br />
exhibited nearly identical rates from 1977 to the present, with very little lengthen<strong>in</strong>g<br />
occurr<strong>in</strong>g between 1977 and 1985, and <strong>in</strong>creas<strong>in</strong>g rates s<strong>in</strong>ce 1985.<br />
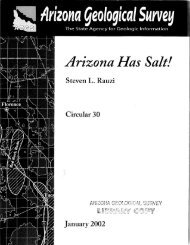
Substantial numbers <strong>of</strong> <strong>fissures</strong> existed on both sides <strong>of</strong> Picacho bas<strong>in</strong> prior to 1959. In the<br />
area covered by repeated air photo surveys on the east side <strong>of</strong> the bas<strong>in</strong>, approximately 46 km<br />
(29 mi) <strong>of</strong> <strong>fissures</strong> were recorded on the 1989 photographs; about 32% <strong>of</strong> these (15 km [9 miD<br />
existed <strong>in</strong> 1959. On the west side, approximately 70 km (44 mi) <strong>of</strong> <strong>fissures</strong> were observed on<br />
the 1989 photographs, and about 39% <strong>of</strong> these (27 km [17 miD existed by 1959. Thus, each<br />
side has undergone a similar pattern <strong>of</strong> <strong>development</strong>, but the west side has had consistently<br />
greater cumulative fissure length (Figure 18).<br />
28
Fissures<br />
active<br />
per year<br />
30 -East Side<br />
25 II1Im West Side<br />
20 em Both sides<br />
15<br />
10<br />
6000<br />
Fissure<br />
lengthen<strong>in</strong>g 3000<br />
(m/yr)<br />
2000<br />
5<br />
0 Aug Dec Aug Jun Nov May Dec Jan May Aug Mar<br />
59 63 67 69 71 75 76 78 85 87 89<br />
year <strong>of</strong> photographs<br />
-East Side<br />
5000 IIImI West Side<br />
4000 mm Both Sides<br />
1000<br />
40<br />
Regional<br />
Average<br />
Precipitation 20<br />
(cm/yr)<br />
0<br />
I-<br />
o<br />
1959<br />
Aug- Dec- Aug- Jun- Nov- May- Dec- Jan- May- Aug- Mar-<br />
59 63 67 69 71 75 76 78 85 87 89<br />
year <strong>of</strong> photoaraphs<br />
I I<br />
63<br />
67<br />
I<br />
71<br />
year<br />
75<br />
79<br />
83 1986<br />
Figure 17. Active <strong>fissures</strong> and lengths <strong>of</strong> <strong>fissures</strong> developed on the east and west sides <strong>of</strong> Picacho<br />
bas<strong>in</strong>, and regional trends <strong>in</strong> annual precipitation for the years s<strong>in</strong>ce 1959. Rates are normalized to an<br />
annual basis because <strong>of</strong> the different <strong>in</strong>tervals between aerial photo surveys.<br />
29
VJ<br />
0<br />
PHOTO DATE Aug 59 Dec 63 Aug 67 Jun 69 Nov 71 May 75 Dec 76 Jan 78 May 85 Aug 87 Mar 89<br />
TOTAL LENGTH (E) 14.8 4.0 5.6 2.3 2.5 5.8 3.6 0.1 1.4 2.0 3.5<br />
PER INTERVAL (W) 27.6 5.9 13.0 4.4 7.8 1.1 1.7 0.5 0.7 3.0 3.9<br />
(km) (Total) 42.4 9.9 18.6 6.7 10.3 6.9 5.3 0.6 2.1 5.0 7.4<br />
CUMULATIVE 14.8 18.8 24.4 26.7 29.2 35.0 38.6 38.7 40.1 42.1 45.6<br />
LENGTH (km) 27.6 33.5 46.5 50.9 58.7 59.8 61.5 62.0 62.7 65.7 69.6<br />
42.4 52.3 70.9 77.6 87.9 94.8 100.1 100.7 102.8 107.8 115.2<br />
RATE ( E) 0.9 1.5 1.3 1.0 1.7 2.3 0.1 0.2 0.9 2.2<br />
OF LENGTHENING (W) 1.4 3.5 2.4 3.2 0.4 1.0 0.4 0.1 1.3 2.5<br />
(km/yr) (Total) 2.3 5.0 3.7 4.2 2.1 3.3 0.5 0.3 2.2 4.7<br />
NO. OF (E) 12 26 13 10 32 20 3 8 11 26<br />
ACTIVE (W) 19 58 26 35 14 16 3 7 16 21<br />
FISSURES (Total) 31 84 39 45 46 36 6 15 27 47<br />
FISSURES 2.77 7.09 7.09 2.15 9.14 12.63 2.77 1.09 4.89 16.42<br />
ACTIVE 4.38 15.82 14.18 14.48 4.00 10.11 2.77 0.95 7.11 13.26<br />
PER YEAR 7.15 22.91 21.27 16.63 13.14 22.74 5.54 2.05 12.00 29.68<br />
Table 2. Variations <strong>in</strong> fissure activity with time on the east (E) and west (W) sides <strong>of</strong> Picacho bas<strong>in</strong>. Activity is represented by length <strong>of</strong> <strong>fissures</strong> developed<br />
and numbers <strong>of</strong> <strong>fissures</strong> active between aerial photo surveys. Rates <strong>of</strong> fissure <strong>development</strong> normalized to an annual basis were calculated to evaluate<br />
temporal patterns <strong>of</strong> fissure activity. All measures <strong>of</strong> fissure activity <strong>in</strong>dicate that the period from about 1977 to 1985 was one <strong>of</strong> very low fissure activity.
120<br />
100<br />
total<br />
fissure<br />
80<br />
length<br />
(km)<br />
60<br />
40<br />
20<br />
BOTH<br />
SIDES<br />
WEST SIDE<br />
EAST SIDE<br />
o 1959 1964 1969 1974 1979 1984 1989<br />
year<br />
Figure 18. Cumulative lengths <strong>of</strong> <strong>earth</strong> <strong>fissures</strong> measured from repeated aerial photo·surveys,<br />
Newman Peak and Casa Grande Mounta<strong>in</strong>s 7 1/2' quadrangles on the east and west sides <strong>of</strong> the<br />
bas<strong>in</strong>, respectively. The slopes <strong>of</strong> the curves are the rates <strong>of</strong> fissure lengthen<strong>in</strong>g. There are some<br />
differences <strong>in</strong> the rates <strong>of</strong> fissure <strong>development</strong> on the east and west sides <strong>of</strong> the Picacho bas<strong>in</strong> <strong>in</strong><br />
the 1960's; both sides <strong>of</strong> the bas<strong>in</strong> had very low rates <strong>of</strong> fissure <strong>development</strong> <strong>in</strong> the late 1970's and<br />
early 1980's, and rates <strong>of</strong> fissure <strong>development</strong> have <strong>in</strong>creased on both sides <strong>in</strong> the late 1980's.<br />
31
Activity Rates and Variations <strong>in</strong> Annual Precipitation. Temporal patterns <strong>of</strong> fissure activity<br />
are compared with climatic data to see if a relationship exists. One aspect <strong>of</strong> climate that<br />
may be used is average annual ra<strong>in</strong>fall <strong>in</strong> the region <strong>in</strong>clud<strong>in</strong>g and surround<strong>in</strong>g Picacho bas<strong>in</strong>.<br />
Average precipitation data from 1959 to 1986 (1986 is the most recent year for which data are<br />
readily available) were compiled for n<strong>in</strong>e weather stations <strong>in</strong> south-central Arizona to reflect<br />
general patterns <strong>of</strong> regional precipitation. There are substantial differences <strong>in</strong> annual<br />
precipitation at stations which are located fairly close to eachother. Nonetheless, the regional<br />
average precipitation (Figure 17) shows that the early 1960's was relatively dry, the mid-1960's<br />
through the early 1970's had both wet and dry years, the rest <strong>of</strong> the 1970's was relatively dry<br />
with one very wet year (1978), and 1982 through 1986 was relatively wet with one very wet<br />
year (1983).<br />
Comparison <strong>of</strong> the patterns <strong>of</strong> fissure <strong>development</strong> described above with annual ra<strong>in</strong>fall<br />
patterns suggests that there is a general relationship between relatively dry <strong>in</strong>tervals and high<br />
rates <strong>of</strong> fissure activity dur<strong>in</strong>g the 1970's and 1980's. The relatively dry early and mid-1970's<br />
was a time <strong>of</strong> rapid fissure <strong>development</strong>. The <strong>in</strong>terval from 1978 to 1985 had two very wet<br />
years and several relatively wet years; itwasa period <strong>of</strong> m<strong>in</strong>imal fissure <strong>development</strong>. This<br />
tentative relationship breaks down <strong>in</strong> the 1960's;.however, because therelatively dry early<br />
1960's was an <strong>in</strong>terval <strong>of</strong> moderate rates <strong>of</strong> fissure <strong>development</strong>, and the relatively wet mid<br />
1960's was a time <strong>of</strong> high rates <strong>of</strong> <strong>development</strong>. Fissure <strong>development</strong> rates on only the east<br />
side <strong>of</strong> Picacho bas<strong>in</strong> show a somewhat stronger <strong>in</strong>verse relationship with general amounts <strong>of</strong><br />
annual precipitation throughout the period from 1959 to 1986.<br />
It is reasonable to theorize that relatively dry years may correlate with periods <strong>of</strong> rapid<br />
fissure <strong>development</strong>. Dry <strong>in</strong>tervals could result <strong>in</strong> more ground-water pump<strong>in</strong>g (to susta<strong>in</strong><br />
crops) and less recharge <strong>of</strong> the aquifers. It is clear, however, that any relationship between<br />
annual precipitation, decl<strong>in</strong>e <strong>of</strong> the water-table altitude, and fissure <strong>development</strong> would be<br />
complicated by other factors. With additional research we <strong>in</strong>tend to <strong>in</strong>vestigate other factors<br />
that might affect rates <strong>of</strong> fissure <strong>development</strong>. Such factors <strong>in</strong>clude annual temperature,<br />
discharge <strong>of</strong> the Santa Cruz and Gila Rivers (represent<strong>in</strong>g recharge potential), water-table<br />
altitude change, and land-surface subsidence.<br />
Activity Rates and Intense Precipitation Events. S<strong>in</strong>ce Leonard (1929) reported the<br />
appearance <strong>of</strong> an <strong>earth</strong> fissure <strong>in</strong> 1927 follow<strong>in</strong>g a severe ra<strong>in</strong>storm, other workers have<br />
32
commented on the relationship between <strong>in</strong>tense precipitation events and fissure <strong>development</strong>.<br />
Old <strong>in</strong>filled <strong>fissures</strong> reopened <strong>in</strong> 1960 when ra<strong>in</strong> from an <strong>in</strong>tense storm collected <strong>in</strong> two<br />
shallow bas<strong>in</strong>s near the Casa Grande Mounta<strong>in</strong>s (Pashley, 1961). A fissure damaged the CAP<br />
aqueduct near Marana High School <strong>in</strong> Avra Valley <strong>in</strong> October 1988. Although only moderate<br />
ra<strong>in</strong>fall occurred at the site on October 14 and 15, water ponded to a depth <strong>of</strong> 0.3 to 1.0 m (1<br />
to 3.3 ft) near the base <strong>of</strong> an <strong>earth</strong>en dike adjacent to the aqueduct (Gary Ditty, pers. comm.,<br />
1988). By October 17, the fissure had opened and the water had dra<strong>in</strong>ed <strong>in</strong>to it.<br />
Records <strong>of</strong> severe storms dur<strong>in</strong>g the past 30 years <strong>in</strong> the vic<strong>in</strong>ity <strong>of</strong> Picacho bas<strong>in</strong> were<br />
evaluated <strong>in</strong> order to explore the relationship between <strong>in</strong>tense precipitation events and <strong>earth</strong><br />
fissure <strong>development</strong>. The numbers <strong>of</strong> major storms and periods <strong>of</strong> concentrated precipitation<br />
that occurred dur<strong>in</strong>g the <strong>in</strong>tervals between air photo surveys were determ<strong>in</strong>ed from<br />
climatological records (Sellers and Hill, 1984; Sellers et aI., 1985; NOAA, 1959-1986). These<br />
data were compared with the numbers <strong>of</strong> <strong>fissures</strong> which were newly detected or newly<br />
lengthened dur<strong>in</strong>g the same <strong>in</strong>terval (Table 3). The number <strong>of</strong> storms, the number <strong>of</strong> new<br />
<strong>fissures</strong> that developed, and the number <strong>of</strong> exist<strong>in</strong>g <strong>fissures</strong> that propagated dur<strong>in</strong>g each<br />
<strong>in</strong>terval were characterized as many, some, or few. Correlations were designated as good,<br />
fair, or poor based on the similarity between characterizations <strong>of</strong> storm and fissure activity<br />
(for example, many storms and many active <strong>fissures</strong> isa good correlation; many storms and<br />
some active <strong>fissures</strong> is a fair correlation; many storms and few active <strong>fissures</strong> is a poor<br />
correlation).<br />
A reasonably good qualitative correlation exists between the occurrence <strong>of</strong> major storms and<br />
the <strong>in</strong>itial appearance <strong>of</strong> <strong>fissures</strong> <strong>in</strong> Picacho bas<strong>in</strong> (Table 3). Of the eight <strong>in</strong>tervals for which<br />
data are available, four show a good correlation, two show a fair correlation, and two<br />
correlate poorly. These relationships support previous workers' suggestions <strong>of</strong> a connection<br />
between <strong>in</strong>tense precipitation and fissure formation. The correlation between major storm<br />
activity and propagation <strong>of</strong> exist<strong>in</strong>g <strong>fissures</strong> is not very good; the correlation between major<br />
storm activity and number <strong>of</strong> active <strong>fissures</strong> is only slightly better. These relationships imply<br />
that <strong>in</strong>itial fissure <strong>development</strong> and subsequent propagation are controlled by several factors,<br />
<strong>in</strong>clud<strong>in</strong>g storm activity. There is apparently an <strong>in</strong>creased likelihood <strong>of</strong> new <strong>fissures</strong> form<strong>in</strong>g<br />
dur<strong>in</strong>g and immediately follow<strong>in</strong>g <strong>in</strong>tense precipitation events. However, local water-table<br />
decl<strong>in</strong>e, which is a function <strong>of</strong> ground-water pump<strong>in</strong>g and recharge rates, is also undoubtedly<br />
a major <strong>in</strong>fluence on rates <strong>of</strong> fissure <strong>in</strong>itiation and propagation.<br />
33
Photo no. <strong>of</strong> new <strong>fissures</strong> <strong>fissures</strong> Correlation with Storms<br />
Date <strong>in</strong>tense <strong>fissures</strong> extended active new <strong>fissures</strong> all active<br />
storms per year per year per year <strong>fissures</strong> extended <strong>fissures</strong><br />
Many (M): > 5 > 11 > 11 > 30<br />
Some (S): 3 to 5 6 to 11 5 to 11 10 to 30<br />
Few (F): < 3 < 6 < 5 < 10<br />
Dec-63 8 6.7 4.4 11.1 * *<br />
M S F S<br />
Aug-67 6 13.4 6 19.4 + * *<br />
M M S S<br />
Jun-69 1 26.2 12.5 38.7<br />
F M M M<br />
Nov-71 3 10.3 5 15.3 + + +<br />
S S S S<br />
May-75 4 6.6 6 12.6 + + +<br />
S S S S<br />
Dec-76 2 7.6 22.7 30.3 *<br />
F S M M<br />
Jan-78 1 3.7 3.7 7.4 + + +<br />
F F F F<br />
May-85 11 1.4 0.7 2.1<br />
M F F F<br />
TOTALS: GOOD (+) 4 3 3<br />
FAIR (*) 2 1 2<br />
POOR (-) 2 4 3<br />
Table 3. Frequency <strong>of</strong> <strong>in</strong>tense precipitation events <strong>in</strong> the Picacho bas<strong>in</strong> area and fissure activity. Numbers <strong>of</strong><br />
<strong>in</strong>tense storms between aerial photo surveys were determ<strong>in</strong>ed from weather records (Sellers and Hill, 1984;<br />
Sellers et ai, 1985). Frequencies <strong>of</strong> <strong>in</strong>tense storms and rates <strong>of</strong> fissure activity are characterized as many (M),<br />
some (S), or few (F). Correlations between storm frequencies and fissure activity are based on the relative<br />
similarities (for example, many storms, many new <strong>fissures</strong>, good correlation; many storms, few new <strong>fissures</strong>, poor<br />
correlation) .<br />
34
Influence <strong>of</strong> Surficial Deposits on Earth-Fissure Development<br />
Another purpose <strong>of</strong> the <strong>in</strong>vestigation was to determ<strong>in</strong>e if soil and sediment type affect fissure<br />
form and/or <strong>development</strong>. There is clearly a connection between sediment type and fissure<br />
form. Truly noncohesive sediments (such as loose sand) form elongated depressions rather<br />
than <strong>fissures</strong>. At the other extreme, soils with very thick, well developed petrocalcic (caliche)<br />
horizons may possess enough tensile strength to stop a fissure from form<strong>in</strong>g <strong>in</strong> them. Most<br />
older surficial deposits are more <strong>in</strong>durated than younger deposits, primarily ow<strong>in</strong>g to calcic<br />
soil horizons, so the walls <strong>of</strong> <strong>fissures</strong> developed <strong>in</strong> them are more resistant to erosion.<br />
Fissures <strong>in</strong> sediment composed <strong>of</strong> silt and sand with little cohesion tend to lose their orig<strong>in</strong>al<br />
wall slopes and floor forms much more quickly than those developed <strong>in</strong> coarser-gra<strong>in</strong>ed<br />
deposits. Several <strong>fissures</strong> illustrate these relationships: One located to the west <strong>of</strong> Picacho<br />
Peak (332 <strong>in</strong> Table 1) occurs <strong>in</strong> partly consolidated, coarse gravelly alluvial-fan deposits (unit<br />
f2 on Plate 1). It developed before December 1975. However, it appears to be quite young<br />
because the soil and sediment tend to preserve its very steep walls, rough irregular floor, its<br />
relatively narrow width and great depth. Conversely, some <strong>fissures</strong> that are young appear to<br />
be old. Fissure 6442 <strong>in</strong> Table 1 occurs <strong>in</strong> a deposit <strong>of</strong> predom<strong>in</strong>antly silty clay (unit T2 on<br />
Plate 6). Even though the fissure formed·between 1971 and 1975, it has gently slop<strong>in</strong>g walls,<br />
a flat floor, and is very shallow.<br />
Soil and sedimenttype seem to have little effect on fissure <strong>development</strong> and propagation<br />
rates. At several locations <strong>in</strong> Picacho bas<strong>in</strong>, afissure that developed dur<strong>in</strong>g a s<strong>in</strong>gle <strong>in</strong>terval<br />
between air photo surveys extends across two or more types <strong>of</strong> deposits. Each surficial map<br />
unit is cut by at least one fissure <strong>in</strong> the bas<strong>in</strong>, imply<strong>in</strong>g that all surficial deposits <strong>in</strong> the<br />
area are susceptible to fissure <strong>development</strong>.<br />
SUMMARY<br />
In summary, <strong>earth</strong> <strong>fissures</strong> pose a significant hazard to eng<strong>in</strong>eered structures <strong>in</strong> Picacho bas<strong>in</strong>.<br />
Many <strong>of</strong> the <strong>fissures</strong> occur near the edges <strong>of</strong> the bas<strong>in</strong> and adjacent to isolated bedrock<br />
outcrops. Fissure morphology is related to fissure age and to other factors <strong>in</strong>clud<strong>in</strong>g<br />
subsidence rate, weather patterns, and fissure orientation with respect to surficial dra<strong>in</strong>age<br />
pattern. Rates <strong>of</strong> fissure lengthen<strong>in</strong>g <strong>in</strong> the portions <strong>of</strong> the bas<strong>in</strong> covered <strong>in</strong> this report<br />
varied from 296 m/yr (971 ft/yr) between 1978 and 1985 to 5068 m/yr (16,627 ft/yr) between<br />
1963 and 1967. The average lengthen<strong>in</strong>g rate for all active <strong>fissures</strong> dur<strong>in</strong>g the past 30 years<br />
35
is 76 m/yr/fissure (250 ft/yr/fissure). Variations <strong>in</strong> rates <strong>of</strong> fissure <strong>development</strong> with time<br />
appear to correlate <strong>in</strong>versely with general trends <strong>in</strong> annual precipitation. Intense storms (and<br />
run<strong>of</strong>f pond<strong>in</strong>g) probably trigger the appearance <strong>of</strong> new <strong>fissures</strong>, so facilities and their<br />
surround<strong>in</strong>gs should be <strong>in</strong>spected carefully at such times. Surficial deposits affect the forms<br />
<strong>of</strong> <strong>fissures</strong> but have little <strong>in</strong>fluence on rates <strong>of</strong> lengthen<strong>in</strong>g and formation <strong>of</strong> new <strong>fissures</strong>.<br />
Future studies might address the follow<strong>in</strong>g topics: 1) rates, amounts, and locations <strong>of</strong> water<br />
table drawdown with respect to fissure locations and propagation rates; 2) temporal and spatial<br />
patterns <strong>of</strong> <strong>development</strong> <strong>of</strong> geographic groups <strong>of</strong> <strong>fissures</strong> (for example, do groups tend to<br />
lengthen rapidly and then develop more complicated patterns?); 3) prediction <strong>of</strong> future<br />
patterns (and possibly rates) <strong>of</strong> formation <strong>in</strong> areas <strong>of</strong> currently active <strong>fissures</strong> us<strong>in</strong>g large<br />
scale aerial photographs, extensive field-check<strong>in</strong>g <strong>of</strong> suspect features, and geophysical,<br />
sedimentological, and other data.<br />
ACKNOWLEDGEMENTS<br />
Several <strong>in</strong>dividuals have contributed to the success <strong>of</strong> this project. Carl W<strong>in</strong>ikka, recently<br />
retired from ADOT, generously shared his time and knowledge. Carrie Mosley <strong>of</strong> the USDA<br />
Soil ConservationService Casa Grande <strong>of</strong>fice supplied aerial photographs taken <strong>in</strong>19360ftwo<br />
isolated portions <strong>of</strong> Picacho bas<strong>in</strong>. Chris Hanes <strong>of</strong> the same <strong>of</strong>fice supplied unpublished (<strong>in</strong><br />
press) soil survey maps <strong>of</strong> the bas<strong>in</strong>. Gary Ditty, USBR, provided access to and <strong>in</strong>formation<br />
about an <strong>earth</strong> fissure that caused m<strong>in</strong>or damage to one <strong>of</strong> the CAP aqueducts dur<strong>in</strong>g October<br />
1988. Sam Bartlett, also with the USBR, oversaw the contract and provided valuable<br />
suggestions. Their help is much appreciated. This project was partially funded by the U.S.<br />
Bureau <strong>of</strong> Reclamation.<br />
REFERENCES<br />
Anderson, S.R., 1986, Potential for aquifer compaction, land subsidence, and <strong>earth</strong> <strong>fissures</strong> <strong>in</strong><br />
the Tucson bas<strong>in</strong>, Pima County, Arizona: U.S. Geological Survey Open File<br />
Report 86-0482, scale 1:250,000.<br />
Christie, F.l., 1978, Analysis <strong>of</strong> gravity data from Picacho Bas<strong>in</strong>, P<strong>in</strong>al County, Arizona:<br />
unpublished M.S. thesis, University <strong>of</strong> Arizona, Tucson, 105 p.<br />
Dick<strong>in</strong>son, W.R. and Shafiqullah, M., 1989, K-Ar and F-T ages for syntectonic mid Tertiary<br />
volcanosedimentary sequences associated with the Catal<strong>in</strong>a core complex and<br />
San Pedro trough <strong>in</strong> southern Arizona: New Mexico Bureau <strong>of</strong> M<strong>in</strong>es and<br />
36
M<strong>in</strong>eral Resources and Nevada Bureau <strong>of</strong> M<strong>in</strong>es and Geology Isochron/West, no.<br />
52, p. 15-27.<br />
Ditty, G.A., 1988, Chief, Canals/Pipel<strong>in</strong>e Branch, U.S. Bureau <strong>of</strong> Reclamation, Central Arizona<br />
Project, personal communication.<br />
Eberly, L.D. and Stanley, T.B., Jr., 1978, Cenozoic stratigraphy and geologic history <strong>of</strong><br />
southwestern Arizona: Geological Society <strong>of</strong> America Bullet<strong>in</strong>, v. 89, p. 921-940.<br />
Freethey, G.W., Pool, D.R., Anderson, T.W., and Tucci, Patrick, 1986, Description and<br />
generalized distribution <strong>of</strong> aquifer materials <strong>in</strong> the alluvial bas<strong>in</strong>s <strong>of</strong> Arizona<br />
and adjacent parts <strong>of</strong> California and New Mexico: U.S. Geological Survey<br />
Hydrologic Investigation Atlas HA-663, 4 sheets, scale 1:500,000.<br />
Holzer, T.L., 1981, Preconsolidation stress <strong>of</strong> aquifer systems <strong>in</strong> areas <strong>of</strong> <strong>in</strong>duced land<br />
subsidence: Water Resources Research, v. 17, no. 3, p. 693-704.<br />
Holzer, T.L. and Davis, S.N., 1976, Earth <strong>fissures</strong> associated with water-table decl<strong>in</strong>es (abs):<br />
Geological Society <strong>of</strong> America Abstracts with Programs, v. 8, no. 6, p. 923-924.<br />
Kam, William, 1965, Earth cracks-a cause <strong>of</strong> gully<strong>in</strong>g, Geological Survey research, 1965, chap.<br />
B: U.S. Geological Survey Pr<strong>of</strong>essional Paper 525-B, p. 122-125.<br />
Konieczki, A.D. and English, C.S., 1979, Maps show<strong>in</strong>g ground water conditions <strong>in</strong> the lower<br />
Santa Cruz area, P<strong>in</strong>al, Pima, and Maricopa Counties, Arizona - 1977: U.S.<br />
Geological Survey Water Resources Investigations 79-56, scale 1:125,000.<br />
Laney, KL., Ramond, KH., and W<strong>in</strong>ikka,C.C., 1978, Maps show<strong>in</strong>g water-level decl<strong>in</strong>es,land<br />
subsidence, and <strong>earth</strong> <strong>fissures</strong> <strong>in</strong> south-central Arizona: U.S. Geological Survey<br />
Water Resources Investigations 78-83, 2 sheets.<br />
Larson, M.K. and Pewe, T.L., 1983, Earth <strong>fissures</strong> and land subsidence hazards <strong>in</strong> northeast<br />
Phoenix: Arizona Bureau <strong>of</strong> Geology and M<strong>in</strong>eral Technology, Fieldnotes, v.l3,<br />
no. 2, p. 8-11.<br />
Leonard, R.J., 1929, An <strong>earth</strong> fissure <strong>in</strong> southern Arizona: Journal <strong>of</strong> Geology, v. 37, no. 8, p.<br />
765-774.<br />
Litton Aero Service and Goodyear Aerospace, 1972, Side-look<strong>in</strong>g airborne radar mosaics, X<br />
band, Red Rock - Tortolita Mounta<strong>in</strong>s and Casa Grande - Signal Peak, sheets<br />
E6 and F7, scale 1:62,500.<br />
National Oceanic and Atmospheric Adm<strong>in</strong>istration, 1959-1986, Climatological data annual<br />
summaries - Arizona, v. 63-90, National Climatic Data Center, Asheville, NC.<br />
Oppenheimer, J.M., 1980, Gravity model<strong>in</strong>g <strong>of</strong> the alluvial bas<strong>in</strong>s, southern Arizona: unpublished<br />
M.S. thesis, University <strong>of</strong> Arizona, Tucson, 81 p.<br />
Pashley, E.F., Jr., 1961, Subsidence cracks <strong>in</strong> alluvium near Casa Grande, Arizona: Arizona<br />
Geological Society Digest, v. 4, p. 95-101.<br />
Pool, D.R., 1986, Aquifer geology <strong>of</strong> alluvial bas<strong>in</strong>s <strong>of</strong> Arizona, <strong>in</strong>: Regional aquifer systems <strong>of</strong><br />
37