Identifying Stored-Grain Insects Using Near-Infrared Spectroscopy
Identifying Stored-Grain Insects Using Near-Infrared Spectroscopy
Identifying Stored-Grain Insects Using Near-Infrared Spectroscopy

Create successful ePaper yourself
Turn your PDF publications into a flip-book with our unique Google optimized e-Paper software.
168 JOURNAL OF ECONOMIC ENTOMOLOGY Vol. 92, no. 1<br />
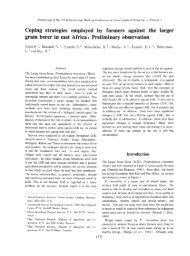
Fig. 1. Correlation spectra for primary versus secondary<br />
stored-grain insects.<br />
grain beetle (55% correct) in the pair-wise comparison<br />
(Table 2) and the sawtoothed grain beetle versus<br />
all others (30% correct) in the 11-way classiÞcation<br />
(Table 3). Thus, the calibrations developed using neural<br />
network and broadest groupings (primary versus<br />
secondary) resulted in the highest classiÞcation accuracy.<br />
When examining the effect of wavelength regions<br />
on classiÞcation accuracies, the PLS results showed<br />
that data within the visible wavelength region did not<br />
improve classiÞcations or reduce the number of factors<br />
needed for calibrations (data not shown). Fewer<br />
factors are desirable because less information is<br />
needed to explain variability in the data. For example,<br />
for the primary versus secondary comparison, the calibration<br />
models developed using either the NIR or<br />
NIR plus visible wavelengths both resulted in 96.4% of<br />
insects correctly classed. The number of factors<br />
needed for the NIR and NIR plus visible region calibrations<br />
were 8 and 17 factors, respectively. Fewer<br />
factors when using only the NIR region likely occurred<br />
because there is little visible difference between<br />
many of the insect categories. Thus, including<br />
the visible region contributed no additional useful<br />
information.<br />
Further information about wavelengths contributing<br />
to classiÞcations can be derived from PLS correlation<br />
plots and factor weights. Correlation plots show<br />
that wavelengths of 450Ð700 nm, 900Ð1,400 nm, and<br />
1,500Ð1,700 nm were more highly correlated to insect<br />
species than other wavelengths (Fig. 1).<br />
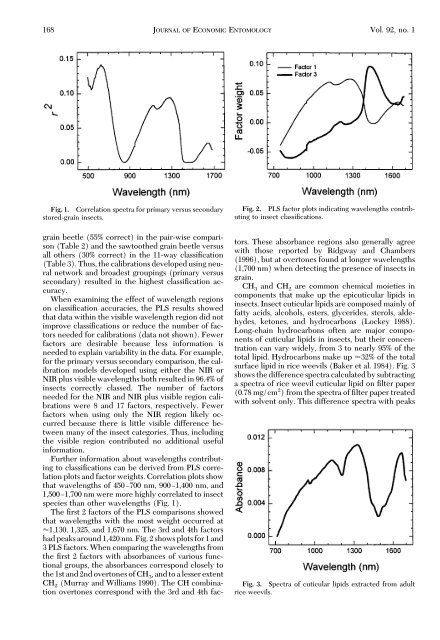
The Þrst 2 factors of the PLS comparisons showed<br />
that wavelengths with the most weight occurred at<br />
1,130, 1,325, and 1,670 nm. The 3rd and 4th factors<br />
had peaks around 1,420 nm. Fig. 2 shows plots for 1 and<br />
3 PLS factors. When comparing the wavelengths from<br />
the Þrst 2 factors with absorbances of various functional<br />
groups, the absorbances correspond closely to<br />
the 1st and 2nd overtones of CH 3, and to a lesser extent<br />
CH 2 (Murray and Williams 1990). The CH combination<br />
overtones correspond with the 3rd and 4th fac-<br />
Fig. 2. PLS factor plots indicating wavelengths contributing<br />
to insect classiÞcations.<br />
tors. These absorbance regions also generally agree<br />
with those reported by Ridgway and Chambers<br />
(1996), but at overtones found at longer wavelengths<br />
(1,700 nm) when detecting the presence of insects in<br />
grain.<br />
CH 3 and CH 2 are common chemical moieties in<br />
components that make up the epicuticular lipids in<br />
insects. Insect cuticular lipids are composed mainly of<br />
fatty acids, alcohols, esters, glycerides, sterols, aldehydes,<br />
ketones, and hydrocarbons (Lockey 1988).<br />
Long-chain hydrocarbons often are major components<br />
of cuticular lipids in insects, but their concentration<br />
can vary widely, from 3 to nearly 95% of the<br />
total lipid. Hydrocarbons make up 32% of the total<br />
surface lipid in rice weevils (Baker et al. 1984). Fig. 3<br />
shows the difference spectra calculated by subtracting<br />
a spectra of rice weevil cuticular lipid on Þlter paper<br />
(0.78 mg/cm 2 ) from the spectra of Þlter paper treated<br />
with solvent only. This difference spectra with peaks<br />
Fig. 3. Spectra of cuticular lipids extracted from adult<br />
rice weevils.