2006 Annual Report
2006 Annual Report
2006 Annual Report

You also want an ePaper? Increase the reach of your titles
YUMPU automatically turns print PDFs into web optimized ePapers that Google loves.
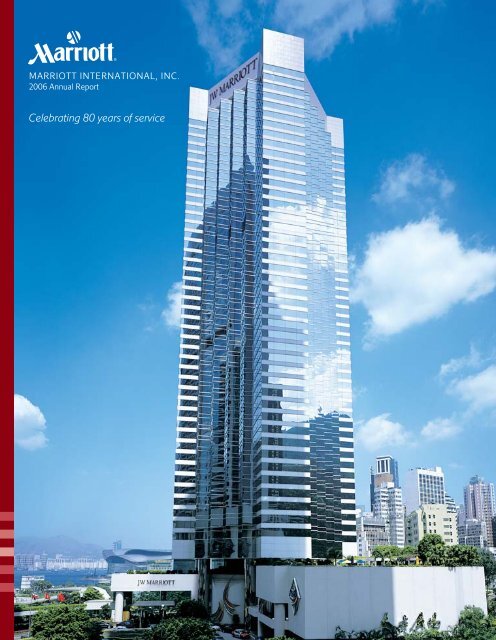
MARRIOTT INTERNATIONAL, INC.<br />
<strong>2006</strong> <strong>Annual</strong> <strong>Report</strong><br />
Celebrating 80 years of service
MARRIOTT. . . the place to be.<br />
Celebrating 80 years of service<br />
As Marriott embarks on its 80th year as a hospitality provider, its long and distinguished history of innovation and growth provides a remarkable<br />
insight into what lies ahead. As a lodging leader, Marriott has a tradition of providing exceptional quality, service and value at more than 2,800<br />
hotels. Yet, it is innovation that perpetually drives the company forward—by providing a product that is relevant and current to meet the changing<br />
expectations, tastes and comfort trends of our guests. Marriott’s capacity for adaptability was clearly evident in the <strong>2006</strong> renovation and<br />
reopening of the Hurricane Wilma-ravaged JW Marriott Cancun Resort & Spa (shown below), whose new windows can now withstand<br />
Category Five hurricane winds.<br />
ON THE COVER: The JW Marriott Hotel Hong Kong was the<br />
company’s first hotel in Asia nearly 20 years ago. Today,<br />
it stands among more than 80 Marriott-branded hotels<br />
in Asia, which continues to be a source of tremendous<br />
growth for Marriott, with a forecasted addition of more<br />
than 11,000 hotel rooms by the end of 2009.<br />
CONTENTS<br />
Brand Overview.......................................................................... 2<br />
Executive Letter.......................................................................... 9<br />
Financial Review ........................................................................ 11<br />
Financial Statements ................................................................ 37<br />
Notes to Financial Statements.............................................. 41<br />
Shareholder Return Performance Graph .......................... 63<br />
Quarterly Financial Data ......................................................... 64<br />
Selected Historical Financial Data ....................................... 65<br />
Non-GAAP Financial Measure Reconciliation ................. 66<br />
Management’s <strong>Report</strong>s ........................................................... 68<br />
<strong>Report</strong>s of Independent Registered<br />
Public Accounting Firm....................................................... 69<br />
Directors and Officers .............................................................. 70<br />
Corporate Information............................................................. 71<br />
Social Responsibility................................................ Back Cover<br />
$0.96<br />
$0.52<br />
$0.87<br />
$0.97<br />
$1.24<br />
$1.45<br />
$1.66<br />
2000 2001 2002 2003 2004 2005 <strong>2006</strong><br />
DILUTED EARNINGS PER SHARE<br />
(From continuing operations. Reflects the<br />
June <strong>2006</strong>, two-for-one stock split. See<br />
Footnote No. 1, “Summary of Significant<br />
Accounting Policies,” for additional information.)<br />
382,599<br />
417,869<br />
442,926<br />
465,141<br />
482,186<br />
499,165<br />
513,832<br />
2000 2001 2002 2003 2004 2005 <strong>2006</strong><br />
LODGING ROOMS<br />
(excludes Ramada International franchised<br />
rooms as the brand was sold in 2004, and<br />
also excludes corporate housing rental units)<br />
18%<br />
10%<br />
12%<br />
13%<br />
14%<br />
16%<br />
22%<br />
2000 2001 2002 2003 2004 2005 <strong>2006</strong><br />
RETURN ON INVESTED CAPITAL (ROIC)<br />
(from continuing operations excluding<br />
the synthetic fuel segment)
Our Brands<br />
The Ritz-Carlton ® Hotel Company has enjoyed<br />
more than two decades as an award-winning,<br />
luxury hospitality organization. The Ritz-Carlton<br />
manages 60 award-winning hotels and resorts;<br />
private condominiums; fractional ownerships;<br />
golf communities with exclusive private homes;<br />
elegant spas; and highly successful restaurants.<br />
The Ritz-Carlton name has become synonymous<br />
with delivering the finest service and creating<br />
exceptional experiences for guests around<br />
the globe.<br />
Bulgari Hotels & Resorts ® , developed in partnership<br />
with jeweler and luxury goods designer Bulgari<br />
SpA, is a collection of sophisticated, intimate<br />
luxury properties located in exclusive destinations.<br />
Properties feature Bulgari’s striking contemporary<br />
interpretation of luxury design and cuisine. The<br />
Bulgari Resort Bali opened fall <strong>2006</strong> with 59<br />
private villas, two restaurants and comprehensive<br />
spa facilities in a spectacular sea-view setting.<br />
The JW Marriott ® Collection, the most distinctive<br />
hotels bearing the Marriott name, invites guests<br />
to enjoy a new dimension of luxury—from designer<br />
bedding and delectable dining to extraordinary<br />
spa and golf offerings — enhanced by exquisite<br />
environments, approachable elegance and attentive<br />
service at more than 35 locations worldwide.<br />
(PICTURED FROM TOP TO BOTTOM)<br />
Rome Marriott Grand Hotel Flora<br />
The Portman Ritz-Carlton, Shanghai<br />
SpringHill Suites Savannah Airport<br />
Residence Inn Model Kitchen<br />
Marriott’s Shadow Ridge ® (Marriott Vacation Club)<br />
SM<br />
Marriott ® Hotels & Resorts, the flagship brand,<br />
inspires your best performance during travel,<br />
engineering an experience with the services and<br />
human touches that help you achieve and revive.<br />
With 470 properties worldwide, Marriott provides<br />
a current approach to the classic hospitality that<br />
has made it a leading choice for travelers for over<br />
70 years.<br />
Marriott Resorts is our award-winning portfolio<br />
of distinctive properties — from colorful and exotic<br />
corners of the globe to exciting family playgrounds<br />
— designed for travelers seeking memorable and<br />
rewarding experiences. Marriott Resorts locations<br />
offer attentive service and exceptional amenities,<br />
many with world-class golf and spa facilities.<br />
Marriott Conference Centers provide the ultimate<br />
experience for small to mid-size meetings in<br />
distraction-free, retreat-style surroundings. Located<br />
near major U.S. cities, Marriott Conference Centers<br />
offer special meeting expertise and technical<br />
support as well as a variety of social and leisure<br />
environments, a combination that ensures creative<br />
and effective group events.<br />
Renaissance ® Hotels & Resorts keeps your life<br />
interesting during travel, offering stylish environments<br />
and opportunities to explore each unique destination<br />
along with the attentive service of an upscale hotel.<br />
At 135 worldwide Renaissance locations, every<br />
moment adds up to an interesting stay that fulfills<br />
your journey.<br />
Renaissance ClubSport ® , a new “lifestyle” concept,<br />
combines boutique-style ambience of Renaissance<br />
Hotels & Resorts with sleek, upscale, full-service<br />
fitness clubs. Renaissance ClubSport offers<br />
distinctive décor in guest rooms, imaginative<br />
dining, attentive service and world-class sports and<br />
fitness amenities. The fitness club is complimentary<br />
for guests and offers memberships to local<br />
communities. The first Renaissance ClubSport<br />
is located in Walnut Creek, Calif.; seven more<br />
properties are under development.
Courtyard by Marriott ® offers its guests exactly<br />
what they need to achieve their goals — and<br />
perform at their peak — when on the road. In<br />
more than 730 locations around the world,<br />
Courtyard provides an enabling environment that<br />
provides its guests “peace of mind,” connection<br />
and restoration.<br />
SpringHill Suites by Marriott ® offers spacious<br />
studio suites, expertly blending function with<br />
innovative and contemporary style. With more<br />
than 150 hotels, SpringHill Suites provides flexible<br />
design, inspiring service, and enhanced amenities<br />
to meet the needs of the growing upper-moderate<br />
segment of enjoyment-seeking travelers.<br />
Fairfield Inn by Marriott ® , Marriott’s most<br />
affordable brand, offers all the award-winning<br />
quality and hospitality of Marriott at a satisfying<br />
value. Fairfield Inn & Suites SM offers uniquely<br />
designed suites, an exercise room and enhanced<br />
amenities. There are nearly 520 Fairfield Inn<br />
hotels, including more than 160 Fairfield Inn &<br />
Suites locations throughout the United States.<br />
Residence Inn by Marriott ® , the leading extendedstay<br />
brand, helps guests feel connected while away<br />
from home. Spacious suites with full kitchens and<br />
separate areas for sleeping, working, relaxing and<br />
eating offer homelike comfort and functionality.<br />
Guests experience a true sense of community as<br />
they interact with our friendly staffs, enjoy our<br />
enhanced complimentary hot breakfast, and mingle<br />
at our evening social hours at more than 510 hotels.<br />
Moderate-tier, extended-stay guests find comfort<br />
in being self-sufficient and doing things their way.<br />
To sustain their life’s rhythm, TownePlace Suites by<br />
Marriott ® provides a place to unpack, settle in and<br />
connect to the local area. With a casual, residential<br />
atmosphere and a productive home office and full<br />
kitchen in every suite, at more than 120 hotels,<br />
TownePlace Suites is all about real living.<br />
Marriott Executive Apartments ® is the ideal<br />
solution for longer-stay trips in key international<br />
gateway cities. Offering studios to three-bedroom<br />
apartments in more than 15 locations, Marriott<br />
Executive Apartments delivers the comforts of<br />
home plus the indulgence of quality hotel services,<br />
including around-the-clock staffing, housekeeping<br />
and laundry service. The living areas offer fully<br />
equipped kitchens and dedicated work and<br />
relaxation areas.<br />
Marriott ExecuStay ® , a leading U.S. corporate<br />
apartment provider, offers temporary housing to<br />
travelers who prefer the spaciousness and privacy<br />
of an apartment for extended stays of 30 days or<br />
longer. With locations in most major, secondary<br />
and tertiary U.S. cities, ExecuStay finds the right<br />
solution for each traveler and delivers a fully<br />
furnished, accessorized apartment with as little<br />
as one day’s notice.<br />
Marriott Vacation Club SM (MVC) is the recognized,<br />
worldwide leader in the vacation ownership<br />
industry. The 45 MVC properties around the globe<br />
offer a lifetime of memorable vacations featuring<br />
one- to three-bedroom villas (depending on<br />
location) with living and dining areas, master<br />
bedroom and bath, balcony, full kitchen and<br />
washer/dryer. Flexible usage options include<br />
exchange to MVC resorts and trade for Marriott<br />
Rewards ® points.<br />
The Ritz-Carlton Club ® is a deeded, fractional<br />
ownership real estate offering combining the<br />
benefits of second home ownership with renowned<br />
Ritz-Carlton service. Designed as a private club,<br />
Members may access their home Club or other<br />
Ritz-Carlton Clubs. Locations: Aspen Highlands and<br />
Bachelor Gulch, Colo.; St. Thomas, U.S.V.I.; and Jupiter,<br />
Fla., as well as several future properties ranging from<br />
Kapalua Bay on Maui to Miami’s South Beach.<br />
Grand Residences by Marriott ® provides second<br />
home options through fractional real estate offerings<br />
and select private ownership opportunities. Designed<br />
for regional second home destinations, the brand is<br />
dedicated to providing carefree property ownership<br />
through Marriott management expertise and a<br />
variety of amenities and services. Locations:<br />
Panama City Beach, Fla.; South Lake Tahoe, Calif.;<br />
and London, England.<br />
Horizons by Marriott Vacation Club ® provides<br />
affordable vacation ownership, while offering a<br />
variety of amenities and activities for the entire<br />
family. Each villa includes living and dining areas,<br />
balcony, kitchen and washer/dryer. Horizons<br />
owners have a flexible usage program including<br />
exchange to other Marriott Vacation Club resorts,<br />
and the ability to trade for Marriott Rewards points.<br />
Locations: Orlando, Fla., and Branson, Mo.
As the brand catering to the “enjoyment” guest, Renaissance Hotels & Resorts properties<br />
strive to be even more expressive and relevant to customers who delight in imaginative<br />
settings and savvy service. At some locations, such as the Renaissance Schaumburg Hotel<br />
& Convention Center (shown above) outside of Chicago, guests are already experiencing<br />
the “great room” concept, a new take on lobbies that transforms a one-dimensional public<br />
space into inviting and comfortable zones for both business and leisure activities. At the<br />
Renaissance New York Hotel Times Square (right), a new “urban” room serves as a prototype<br />
for other hotels.
A Place to Savor<br />
Gone are the days of the old hotel coffee<br />
shop. Today, guests are seeking more<br />
than sustenance when they dine in a<br />
hotel restaurant, and Marriott delivers<br />
the culinary experience in a way that is<br />
exciting, contemporary and in concert<br />
with fresh and healthy dining trends.<br />
Marriott restaurants have become<br />
destinations unto themselves — for<br />
both guests and local residents — with<br />
street-side access, concept-driven<br />
menus and an ambience that is stylish,<br />
warm and innovative. Bars, too, now<br />
offer a hip, local vibe, with top-notch<br />
mixology programs, signature drinks<br />
and an intriguing urban style. The<br />
growing prestige of Marriott’s restaurants<br />
is attracting both celebrity chefs and<br />
rising stars, such as Jun Tanaka (shown<br />
above), Gordon Ramsey, Laurent<br />
Tourondel and Bradley Ogden.<br />
1331, the fashionable restaurant and bar at<br />
the JW Marriott Hotel Pennsylvania Avenue in<br />
Washington, DC<br />
4 | MARRIOTT INTERNATIONAL, INC. <strong>2006</strong>
A Place to Achieve<br />
At Marriott, we know our business<br />
guests are expert travelers, with a<br />
variety of needs and one common<br />
goal — to realize ultimate productivity<br />
while on the road, enjoying the journey<br />
along the way. To that end, Marriott is<br />
constantly creating ways to make<br />
business travel more convenient and<br />
satisfying. This year, Marriott<br />
introduced eFolio, so that guests<br />
can receive their hotel bills via email.<br />
Globally, Marriott has expanded the<br />
business-focused Courtyard brand,<br />
introducing a new prototype in<br />
France and launching an aggressive<br />
roll-out of the hotel “designed by<br />
business travelers” throughout Europe.<br />
These innovations have not gone<br />
unnoticed — in the <strong>2006</strong> TripAdvisor<br />
global survey, business travelers<br />
named Marriott the most preferred<br />
hotel for business trips.<br />
Courtyard Paris Colombes<br />
MARRIOTT INTERNATIONAL, INC. <strong>2006</strong> | 5
A Place to Recharge<br />
Marriott International offers nearly<br />
90 spas around the world, including<br />
locations at The Ritz-Carlton, JW Marriott<br />
Hotels & Resorts, Marriott Hotels &<br />
Resorts, and Renaissance Hotels &<br />
Resorts. In settings ranging from<br />
mountain retreats to cosmopolitan<br />
centers to beachside resorts, these spas<br />
help guests achieve that elusive harmony<br />
of mind and body. Each spa reflects the<br />
regional flavor of its location, providing<br />
guests with signature treatments and<br />
distinctive sanctuaries to recharge and<br />
revitalize. Guests at Marriott Hotels &<br />
Resorts spas can bring the experience<br />
home with an exclusive line of personal<br />
care products available for purchase on<br />
ShopMarriott.com.<br />
ABOVE: Renaissance Mumbai Hotel & Convention<br />
Centre. RIGHT: The Ritz-Carlton, Jakarta<br />
6 | MARRIOTT INTERNATIONAL, INC. <strong>2006</strong>
A Place to Let Go<br />
For many, leisure time is a precious<br />
commodity — every moment to be<br />
treasured and committed to memory.<br />
Marriott makes the leisure experience<br />
a pure pleasure — from initial planning<br />
to the moment of realization that this is<br />
what life is all about. With Marriott.com,<br />
the award-winning web site, visitors<br />
can search for the perfect getaway or<br />
vacation package, plan a wedding,<br />
create a honeymoon registry and track<br />
progress toward a desired vacation.<br />
Marriott fulfills the dream, with more<br />
than 135 resorts around the world,<br />
including 45 Marriott Vacation Club<br />
resorts in 29 exceptional destinations.<br />
Golf enthusiasts will find more than 70<br />
hotels and resorts offering golf on-site.<br />
Marriott’s Waiohai Beach Club ® ,<br />
Koloa in Kauai, Hawaii<br />
MARRIOTT INTERNATIONAL, INC. <strong>2006</strong> | 7
A Place to Succeed<br />
An essential function of Marriott’s success<br />
is our people — the associates whose<br />
talents, diverse cultures, backgrounds<br />
and more than 50 spoken languages<br />
are the essence of our vision to better<br />
serve the needs of our customers<br />
around the world. At Marriott, we<br />
celebrate not what makes us different,<br />
but what makes each of us special,<br />
and we are driven by a distinguished<br />
corporate culture that thrives on the<br />
professional development and upward<br />
mobility of our associates.<br />
As a testament to our uncompromising<br />
commitment to diversity excellence,<br />
Marriott established the Committee<br />
for Excellence. Its mission is to achieve<br />
significant progress in diversity and<br />
ensure Marriott’s position as a leader<br />
in this field. Drivers of success include<br />
the Committee’s focus on the diversity<br />
business case, accountability and<br />
measuring results. Specific goals are<br />
set annually and progress is monitored<br />
throughout the year. These accomplishments<br />
have been recognized by the<br />
NAACP, Black Enterprise, DiversityInc,<br />
Latina Style and Hispanic Business.<br />
8 | MARRIOTT INTERNATIONAL, INC. <strong>2006</strong>
To Our Shareholders<br />
J.W. MARRIOTT, JR.<br />
Chairman and<br />
Chief Executive Officer<br />
WILLIAM J. SHAW<br />
President and<br />
Chief Operating Officer<br />
MARRIOTT INTERNATIONAL ENJOYED AN EXCEPTIONAL<br />
year in <strong>2006</strong>, and we are celebrating 80 years in business and 50<br />
years of hotel industry leadership in 2007. As we look to the future,<br />
our continued growth will be defined by our premium brands and<br />
a commitment to innovation and service.<br />
The lodging demand environment has rarely been stronger.<br />
Modest hotel industry construction in urban locations in the United<br />
States in recent years ushered in improved pricing power in <strong>2006</strong>.<br />
North American company-operated comparable Revenue Per<br />
Available Room (RevPAR) increased nearly 9 percent in <strong>2006</strong>,<br />
largely driven by pricing. Including the impact of foreign exchange,<br />
international company-operated comparable RevPAR was stellar for<br />
the year, growing over 12 percent as the strong global economy<br />
drove international travel.<br />
In <strong>2006</strong>, our owners and franchisees added more than 23,000<br />
rooms to our system, demonstrating confidence in our brands. Over<br />
the next several years, we expect owners and franchisees will invest<br />
nearly $20 billion to expand the Marriott International system,<br />
attracted by guest preference for our products and strong room<br />
rates, occupancies and property-level profits.<br />
We also delivered impressive financial results in <strong>2006</strong>. With<br />
both unit expansion and RevPAR growth, management and franchise<br />
fee revenue increased 19 percent to a record $1.2 billion.<br />
Diluted earnings per share from continuing operations reached<br />
$1.66. Net cash provided by operating activities totaled $970 million<br />
and share repurchases and dividends returned nearly $1.7 billion<br />
to shareholders. Pre-tax return on invested capital (ROIC)<br />
reached 22 percent, exceeding our 20 percent goal well ahead<br />
of schedule. Adjusting our historical share prices to reflect the<br />
<strong>2006</strong> two-for-one stock split, our share price also reached a record<br />
high in <strong>2006</strong>.<br />
LEADING THE WAY<br />
This success is due to multiple factors. Our business model, broad<br />
brand portfolio, and innovative programs and initiatives give us a<br />
competitive advantage not easily matched.<br />
By managing and franchising rather than owning hotels, we can<br />
grow much faster, leveraging our management and brand-building<br />
capability. Faster unit growth, in turn, drives greater market share<br />
and brand equity, which encourages owners and franchisees to<br />
develop yet more hotels flying our flags.<br />
With 18 brands, Marriott has the broadest lodging and timeshare<br />
portfolio in the world. Our lodging brands operate with significant<br />
RevPAR premiums over competitors. Despite our industry leadership,<br />
we continue to innovate to make our products even better.<br />
Guests have enthusiastically embraced changes we’re making<br />
in our guest rooms — featuring luxurious bedding, the latest technology,<br />
including our new “plug and play” connectivity panel, and,<br />
now, a completely smoke-free environment in the United States<br />
and Canada. This year, we’ll introduce the “great room” — a revolutionary<br />
transformation of public space in select Marriott and<br />
Renaissance hotels, designed for today’s travelers, who smoothly<br />
transition between work and play. Besides enhancing the guest<br />
experience, we expect the “great room” to generate new incremental<br />
property-level revenue from food and beverage sales.<br />
At Renaissance Hotels & Resorts, our owners and franchisees<br />
are revitalizing the brand with nearly $2 billion of investment<br />
expected in new construction, property conversions and renovation<br />
projects worldwide over three years. The Renaissance Schaumburg<br />
Hotel & Convention Center, a signature property outside of Chicago,<br />
opened in <strong>2006</strong> and features the latest technological, architectural<br />
and “savvy service” innovations coming soon to other properties.<br />
The Renaissance New York Hotel Times Square is being dramatically<br />
renovated and will be the prototype for a cool, new urban look, and<br />
Eden Roc, a renowned Renaissance Resort and Spa in Miami<br />
Beach, will become one of the finest hotels in Florida.<br />
Our preeminent luxury brand, the Ritz-Carlton, is capitalizing on<br />
the demand for luxury goods. In Los Angeles, both a Ritz-Carlton<br />
and a JW Marriott hotel will be part of “LA Live,” a unique complex<br />
that will combine sports, retail, residential and convention center<br />
space opening in 2010. In Asia we have new Ritz-Carlton hotels<br />
planned for Tokyo, Shanghai and Beijing.<br />
Our Ritz-Carlton Club fractional and residential properties are<br />
increasingly popular with new projects in sales in the Bahamas,<br />
South Beach Miami, Hawaii and San Francisco. Some of our vacation<br />
ownership projects are structured as joint ventures enabling<br />
Marriott to apply its branding and hospitality expertise with relatively<br />
modest capital investment. We expect roughly one-third of our timeshare,<br />
fractional and residential contract sales to come from joint<br />
ventures by 2009, increasing profits while also increasing our ROIC.<br />
We continue to renovate and reinvent our limited-service brands.<br />
More than 500 Courtyard and Residence Inn hotels feature our newest<br />
generation of style and design, including new properties that have<br />
opened in the last few years as well as the nearly 250 Courtyard and<br />
Residence Inn properties that have completed renovations. An additional<br />
150 Residence Inn hotels are scheduled for renovation in<br />
2007. These renovated and reinvented hotels yield much higher<br />
guest satisfaction measurements and profits.<br />
MARRIOTT INTERNATIONAL, INC. <strong>2006</strong> | 9
The repositioned SpringHill Suites shows great promise as the<br />
preferred brand for active, style-conscious GenXers who enjoy<br />
travel and are looking for an upper-moderate tier hotel. Completely<br />
redesigned, the new concept will soon be introduced to many of the<br />
brand’s more than 150 existing hotels.<br />
TownePlace Suites, our moderate-priced extended-stay brand, has<br />
also been repositioned to better reflect its local surroundings, and the<br />
brand expects more than 90 renovations in the next 18 months. We<br />
also have great news to report on Fairfield Inn—our “prune and plant”<br />
strategy is working: nearly 40 hotels have left the system in the past<br />
two years, and a record 100 newly designed hotels are in the pipeline.<br />
Across all of our brands, we remain focused on finding innovative<br />
ways for technology to enhance the guest experience. Business<br />
travelers rave about “eFolio,” which provides emailed copies of<br />
hotel bills. At the Redmond Marriott Town Center in Washington,<br />
tech-savvy guests are checking in using handheld PDAs. In some<br />
Marriott and Renaissance hotel lobbies in North America, guests can<br />
print their airline boarding passes from dedicated computer stations<br />
— a service that is really “taking off.”<br />
Selling to customers the way they want to buy is as important as<br />
catering to them upon arrival, and we enjoy a tremendous strength<br />
in our distribution channels. In fact, Marriott.com is one of the top<br />
retail web sites in the world, generating property-level Internet sales<br />
of $4.3 billion in <strong>2006</strong>, 35 percent higher than 2005. Marriott.com<br />
accounted for 87 percent of the company’s Internet sales in <strong>2006</strong>.<br />
Our sales teams are recognized as the industry’s best, having just<br />
been named Selling Power magazine’s top global sales team of <strong>2006</strong>,<br />
and innovations at our Event Booking Centers have enhanced our<br />
outreach to smaller groups.<br />
Another important competitive advantage is Marriott Rewards, ®<br />
our award-winning guest loyalty program. With 26 million members<br />
and 2,700 participating properties in 65 countries and territories,<br />
Marriott Rewards is a powerful engine driving customer satisfaction,<br />
repeat business and the growth of our brands.<br />
LOOKING FORWARD<br />
In October in Paris, we held our first conference outside the United<br />
States for the investment community, where we presented the company’s<br />
business outlook through 2009. We described our bullishness<br />
about the capacity of our business model to deliver strong fee income<br />
and generate significant net cash from operating activities in varying<br />
RevPAR environments. We reviewed how diluted earnings per share,<br />
excluding our synthetic fuel business, could rise by 15 to 25 percent<br />
compounded over the next three years. And at the same time, our<br />
ROIC could reach the mid-to-high 20s in percentage terms by 2009.<br />
The robust cash flow from our business, combined with owner and<br />
franchisee preference for our brands, provides us with the flexibility<br />
and strength to opportunistically grow and improve our system, while<br />
returns to shareholders continue to increase.<br />
Over the next three years, we plan to add 85,000 to 100,000<br />
hotel rooms worldwide, with nearly a third of those opening outside<br />
North America. With a less than 1 percent market share outside the<br />
United States, Marriott’s experienced global development engine,<br />
proven business model of managing and franchising, and preferred<br />
brands should drive powerful growth. Economic growth in China<br />
and India has fueled huge middle classes that will travel as never<br />
before. By year-end 2009, we expect to have a portfolio totaling<br />
nearly 600,000 rooms, including 120,000 outside North America.<br />
In the shorter term, our all-important group business bookings<br />
have been off to a good start in the first few months of 2007, and<br />
10 | MARRIOTT INTERNATIONAL, INC. <strong>2006</strong><br />
our Marriott brand bookings for 2007, as compared to the prior year<br />
pace, are up nicely. With our product and service enhancements<br />
leading the way, we expect a good year.*<br />
MAKING A DIFFERENCE<br />
As a global leader in hospitality, Marriott takes its role as a corporate<br />
citizen very seriously. With our associates, we work with charitable<br />
organizations, governments and international agencies to help thousands<br />
of people around the world. This includes supporting programs<br />
that help educate and develop an emerging global workforce,<br />
benefiting both our communities and the company.<br />
In particular, Marriott supports and respects the protection of<br />
human rights. In fact, we amended our human rights policy in<br />
November. This includes standing against human trafficking and the<br />
exploitation of children. To help break the cycle of poverty that often<br />
makes at-risk youth vulnerable, Marriott supports programs and partnerships<br />
that train and help them find meaningful employment.<br />
Diversity across our enterprise remains an integral part of our success,<br />
and our board of directors helps drive our progress. The company<br />
has pledged to have 500 minority- and women-owned hotels<br />
in its system by 2010, and to spend $1 billion with diverse suppliers.<br />
At the end of <strong>2006</strong>, we had already reached $400 million in spending<br />
and had 400 hotels open or in the pipeline owned or managed<br />
by women or minorities.<br />
Marriott is committed to environmental stewardship, helping to<br />
preserve natural surroundings and reduce resource consumption.<br />
The U.S. Environmental Protection Agency (EPA) has recognized<br />
these efforts, naming Marriott an ENERGY STAR ® Partner of the<br />
Year for the last three years. Marriott was the first company to join<br />
the EPA’s Climate Leaders Program, pledging to reduce greenhouse<br />
gases by 6 percent per available room by 2010.<br />
OUR SPIRIT TO SERVE<br />
While we’ve set the stage with new products and services, a superior<br />
business model and financial strength, our success wouldn’t<br />
be possible without our more than 150,000 associates and their<br />
enduring “Spirit To Serve. ® ” We retain great talent in large part<br />
because of our strong company culture, which promotes opportunities<br />
for our associates.<br />
Opportunity has defined the Marriott legacy and inspires our<br />
future. As we mark our 80th anniversary year, Marriott has great<br />
reason to celebrate, with good economic trends, strong travel<br />
demand and our powerful growth engine pointing toward sustained<br />
outstanding performance. But as always, we’ll continue to innovate,<br />
look for ways to improve our business and better serve our customers.<br />
Because, as J. Willard Marriott, Sr. said when he and his<br />
wife, Alice S. Marriott, founded this company in 1927, “Success is<br />
never final.”<br />
J.W. MARRIOTT, JR.<br />
Chairman and Chief Executive Officer<br />
WILLIAM J. SHAW<br />
President and Chief Operating Officer<br />
* Please see “Risk Factors” later in this report for information about forward-looking statements,<br />
risks and uncertainties.
Risk Factors<br />
FORWARD-LOOKING STATEMENTS<br />
We make forward-looking statements in this report (see<br />
“Management’s Discussion and Analysis of Financial<br />
Condition and Results of Operations”) based on the beliefs<br />
and assumptions of our management and on information<br />
currently available to us. Forward-looking statements include<br />
information about our possible or assumed future results of<br />
operations which follow under the headings “Business and<br />
Overview,”“Liquidity and Capital Resources” and other statements<br />
throughout this report preceded by, followed by or<br />
that include the words “believes,”“expects,”“anticipates,”<br />
“intends,”“plans,”“estimates” or similar expressions.<br />
Forward-looking statements are subject to a number of<br />
risks and uncertainties that could cause actual results to differ<br />
materially from those expressed in these forward-looking<br />
statements, including the risks and uncertainties described<br />
below and other factors we describe from time to time in our<br />
periodic filings with the Securities and Exchange<br />
Commission. We therefore caution you not to rely unduly on<br />
any forward-looking statements. The forward-looking statements<br />
in this report speak only as of the date of this report,<br />
and we undertake no obligation to update or revise any forward-looking<br />
statement, whether as a result of new information,<br />
future developments or otherwise.<br />
RISKS AND UNCERTAINTIES<br />
We are subject to various risks that could have a negative<br />
effect on the Company and its financial condition. You should<br />
understand that these risks could cause results to differ<br />
materially from those expressed in forward-looking statements<br />
contained in this report and in other Company communications.<br />
Because there is no way to determine in<br />
advance whether, or to what extent, any present uncertainty<br />
will ultimately impact our business, you should give equal<br />
weight to each of the following.<br />
The lodging industry is highly competitive, which may impact<br />
our ability to compete successfully with other hotel and timeshare<br />
properties for customers. We generally operate in markets<br />
that contain numerous competitors. Each of our hotel<br />
and timeshare brands competes with major hotel chains in<br />
national and international venues and with independent<br />
companies in regional markets. Our ability to remain competitive<br />
and to attract and retain business and leisure travelers<br />
depends on our success in distinguishing the quality, value<br />
and efficiency of our lodging products and services from<br />
those offered by others. If we are unable to compete successfully<br />
in these areas, this could limit our operating margins,<br />
diminish our market share and reduce our earnings.<br />
We are subject to the range of operating risks common to the<br />
hotel, timeshare and corporate apartment industries. The profitability<br />
of the hotels, vacation timeshare resorts and corporate<br />
apartments that we operate or franchise may be<br />
adversely affected by a number of factors, including:<br />
(1) the availability of and demand for hotel rooms, timeshare<br />
interval, fractional and whole ownership products<br />
and apartments;<br />
(2) international, national and regional economic and<br />
geopolitical conditions;<br />
(3) the impact of war, actual or threatened terrorist activity<br />
and heightened travel security measures instituted<br />
in response to war, terrorist activity or threats;<br />
(4) the desirability of particular locations and changes in<br />
travel patterns;<br />
(5) travelers’ fears of exposure to contagious diseases,<br />
such as Avian Flu and Severe Acute Respiratory<br />
Syndrome (“SARS”);<br />
(6) the occurrence of natural disasters, such as earthquakes,<br />
tsunamis and hurricanes;<br />
(7) taxes and government regulations that influence or<br />
determine wages, prices, interest rates, construction<br />
procedures and costs;<br />
(8) the availability and cost of capital to allow us and<br />
potential hotel owners and joint venture partners to<br />
fund investments;<br />
(9) regional and national development of competing<br />
properties;<br />
(10) increases in wages and other labor costs, energy,<br />
healthcare, insurance, transportation and fuel, and<br />
other expenses central to the conduct of our business,<br />
including recent increases in energy costs; and<br />
(11) organized labor activities, which could cause the<br />
diversion of business from hotels involved in labor<br />
negotiations, loss of group business, and/or increased<br />
labor costs.<br />
Any one or more of these factors could limit or reduce the<br />
demand, or the prices we are able to obtain for hotel rooms,<br />
timeshare units and corporate apartments, or could increase<br />
our costs and, therefore, reduce the profit of our lodging<br />
businesses. Reduced demand for hotels could also give rise<br />
to losses under loans, guarantees and minority equity investments<br />
that we have made in connection with hotels that we<br />
manage. Even where such factors do not reduce demand, our<br />
profit margins may suffer if we are unable to fully recover<br />
increased operating costs from our customers.<br />
The uncertain pace and duration of the current growth environment<br />
in the lodging industry will continue to impact our<br />
financial results and growth. Both the Company and the lodging<br />
industry were hurt by several events occurring over the<br />
last several years, including the global economic downturn,<br />
the terrorist attacks on New York and Washington in<br />
September 2001, the global outbreak of SARS in 2003 and<br />
military action in Iraq. Although both the lodging and travel<br />
industries have now largely recovered from the depressed<br />
levels during those years, the duration, pace and full extent of<br />
the current growth environment remains unclear. Accordingly,<br />
our financial results and growth could be harmed if<br />
that recovery stalls or is reversed.<br />
Our lodging operations are subject to international, national<br />
and regional conditions. Because we conduct our business on<br />
a national and international platform, our activities are susceptible<br />
to changes in the performance of regional and<br />
MARRIOTT INTERNATIONAL, INC. <strong>2006</strong> | 11
global economies. In recent years, our business was hurt by<br />
decreases in travel resulting from recent economic conditions,<br />
the military action in Iraq and the heightened travel<br />
security measures that have resulted from the threat of further<br />
terrorism. Our future economic performance is similarly<br />
subject to the uncertain economic environment in the<br />
United States and other regions, the unknown pace of business<br />
travel that results and the occurrence of any future incidents<br />
in the countries where we operate.<br />
Our growth strategy depends upon third-party owners/operators,<br />
and future arrangements with these third parties may be<br />
less favorable. Our present growth strategy for development<br />
of additional lodging facilities entails entering into and maintaining<br />
various arrangements with property owners. The<br />
terms of our management agreements, franchise agreements<br />
and leases for each of our lodging facilities are influenced by<br />
contract terms offered by our competitors, among other<br />
things. We cannot assure you that any of our current arrangements<br />
will continue, or that we will be able to enter into<br />
future collaborations, renew agreements, or enter into new<br />
agreements in the future on terms that are as favorable to us<br />
as those that exist today.<br />
We may have disputes with the owners of the hotels that we<br />
manage or franchise. Consistent with our focus on management<br />
and franchising, we own very few of our lodging properties.<br />
The nature of our responsibilities under our management<br />
agreements to manage each hotel and enforce the standards<br />
required for our brands under both management and franchise<br />
agreements may, in some instances, be subject to interpretation<br />
and may give rise to disagreements. We seek to<br />
resolve any disagreements in order to develop and maintain<br />
positive relations with current and potential hotel owners and<br />
joint venture partners but have not always been able to do so.<br />
Failure to resolve such disagreements has in the past resulted<br />
in litigation, and could do so in the future.<br />
Our ability to grow our management and franchise systems is<br />
subject to the range of risks associated with real estate investments.<br />
Our ability to sustain continued growth through management<br />
or franchise agreements for new hotels and the<br />
conversion of existing facilities to managed or franchised<br />
Marriott brands is affected, and may potentially be limited, by<br />
a variety of factors influencing real estate development generally.<br />
These include site availability, financing, planning, zoning<br />
and other local approvals and other limitations that may<br />
be imposed by market and submarket factors, such as projected<br />
room occupancy, changes in growth in demand compared<br />
to projected supply, territorial restrictions in our<br />
management and franchise agreements, costs of construction,<br />
and anticipated room rate structure.<br />
We depend on capital to buy and maintain hotels, and we or<br />
hotel owners may be unable to access capital when necessary. In<br />
order to fund new hotel investments, as well as refurbish and<br />
improve existing hotels, both the Company and current and<br />
potential hotel owners must periodically spend money. The<br />
availability of funds for new investments and maintenance of<br />
existing hotels depends in large measure on capital markets<br />
and liquidity factors over which we can exert little control.<br />
Our ability to recover loan and guarantee advances from<br />
hotel operations or from owners through the proceeds of<br />
12 | MARRIOTT INTERNATIONAL, INC. <strong>2006</strong><br />
hotel sales, refinancing of debt or otherwise may also affect<br />
our ability to recycle and raise new capital. In addition, downgrades<br />
of our public debt ratings by Standard & Poor’s,<br />
Moody’s Investor Service or similar companies could increase<br />
our cost of capital.<br />
Our development activities expose us to project cost, completion<br />
and resale risks. We develop new hotel, timeshare interval,<br />
fractional ownership and whole ownership properties,<br />
both directly and through partnerships, joint ventures and<br />
other business structures with third parties. Our involvement<br />
in the development of properties presents a number of risks,<br />
including that: (1) construction delays, cost overruns, or acts<br />
of God such as earthquakes, hurricanes, floods or fires may<br />
increase overall project costs or result in project cancellations;<br />
(2) we may be unable to recover development costs we<br />
incur for projects that are not pursued to completion; (3) conditions<br />
within capital markets may limit our ability, or that of<br />
third parties with whom we do business, to raise capital for<br />
completion of projects that have commenced or development<br />
of future properties; and (4) properties that we develop<br />
could become less attractive due to changes in mortgage<br />
rates, market absorption or oversupply, with the result that<br />
we may not be able to sell such properties for a profit or at<br />
the prices we anticipate.<br />
Development activities that involve our co-investment with<br />
third parties may further increase completion risk or result in disputes<br />
that could increase project costs or impair project operations.<br />
Partnerships, joint ventures and other business<br />
structures involving our co-investment with third parties<br />
generally include some form of shared control over the operations<br />
of the business and create additional risks, including<br />
the possibility that other investors in such ventures could<br />
become bankrupt or otherwise lack the financial resources to<br />
meet their obligations, or could have or develop business<br />
interests, policies or objectives that are inconsistent with<br />
ours. Although we actively seek to minimize such risks before<br />
investing in partnerships, joint ventures or similar structures,<br />
actions by another investor may present additional risks of<br />
project delay, increased project costs, or operational difficulties<br />
following project completion.<br />
Risks associated with development and sale of residential<br />
properties that are associated with our lodging and timeshare<br />
properties or brands may reduce our profits. In certain hotel<br />
and timeshare projects we participate, through minority<br />
interests and/or licensing fees, in the development and sale<br />
of residential properties associated with our brands, including<br />
luxury residences and condominiums under our The Ritz-<br />
Carlton and Marriott brands. Such projects pose additional<br />
risks beyond those generally associated with our lodging and<br />
timeshare businesses, which may reduce our profits or compromise<br />
our brand equity, including the following:<br />
3 Decreases in residential real estate and vacation home<br />
prices or demand generally, which have historically<br />
been cyclical, could reduce our profits or even result in<br />
losses on residential sales, and could also result in significant<br />
carrying costs if the pace of sales is slower<br />
than we anticipate;<br />
3 Increases in interest rates, reductions in mortgage<br />
availability, or increases in the costs of residential
ownership could prevent potential customers from<br />
buying residential products or reduce the prices they<br />
are willing to pay;<br />
3 Residential construction may be subject to warranty<br />
and liability claims, and the costs of resolving such<br />
claims may be significant; and<br />
3 If the pace of sales is slower than we anticipate or sales<br />
prices are lower than projected, it may become more<br />
difficult to convince future hotel development partners<br />
of the value added by our brands.<br />
Damage to or other potential losses involving properties that<br />
we own, manage or franchise may not be covered by insurance.<br />
We have comprehensive property and liability insurance policies<br />
with coverage features and insured limits that we believe<br />
are customary. Market forces beyond our control may<br />
nonetheless limit the scope of insurance coverage that we<br />
can obtain and our ability to obtain coverage at reasonable<br />
rates. Certain types of losses, generally of a catastrophic<br />
nature, such as earthquakes, hurricanes and floods or terrorist<br />
acts, may be uninsurable or too expensive to justify insuring<br />
against. As a result, we may not be successful in obtaining<br />
insurance without increases in cost or decreases in coverage<br />
levels. In addition, in the event of a substantial loss, the insurance<br />
coverage we carry may not be sufficient to pay the full<br />
market value or replacement cost of our lost investment or<br />
that of hotel owners, or in some cases could result in certain<br />
losses being totally uninsured. As a result, we could lose some<br />
or all of the capital we have invested in a property, as well as<br />
the anticipated future revenue from the property, and we<br />
could remain obligated for guarantees, debt or other financial<br />
obligations related to the property.<br />
Risks relating to acts of God, contagious disease, terrorist<br />
activity and war could reduce the demand for lodging, which may<br />
adversely affect our revenues. Acts of God, such as hurricanes,<br />
earthquakes and other natural disasters and the spread of<br />
contagious diseases, such as Avian Flu and SARS, in locations<br />
where we own, manage or franchise significant properties<br />
and areas of the world from which we draw a large number of<br />
customers can cause a decline in the level of business and<br />
leisure travel and reduce the demand for lodging. Actual or<br />
threatened war, terrorist activity, political unrest, civil strife and<br />
other geopolitical uncertainty can have a similar effect. Any<br />
one or more of these events may reduce the overall demand<br />
for hotel rooms, timeshare units and corporate apartments or<br />
limit the prices that we are able to obtain for them, both of<br />
which could adversely affect our profits.<br />
A failure to keep pace with developments in technology could<br />
impair our operations or competitive position. The lodging and<br />
timeshare industries continue to demand the use of sophisticated<br />
technology and systems, including those used for our<br />
reservation, revenue management and property management<br />
systems, our Marriott Rewards program, and technologies we<br />
make available to our guests.These technologies and systems<br />
must be refined, updated and/or replaced with more advanced<br />
systems on a regular basis. If we are unable to do so as quickly<br />
as our competitors, or within budgeted costs and time frames,<br />
our business could suffer. We also may not achieve the benefits<br />
that we anticipate from any new technology or system, and a<br />
failure to do so could result in higher than anticipated costs or<br />
could impair our operating results.<br />
An increase in the use of third-party Internet reservation<br />
services could adversely impact our revenues. Some of our hotel<br />
rooms are booked through Internet travel intermediaries,<br />
such as Travelocity.com®, Expedia.com®, and Priceline.com®,<br />
serving both the leisure and, increasingly, the corporate travel<br />
and group meeting sectors. While Marriott’s Look No<br />
Further® Best Rate Guarantee has greatly reduced the ability<br />
of these Internet travel intermediaries to undercut the published<br />
rates at our hotels, these intermediaries continue their<br />
attempts to commoditize hotel rooms by aggressively marketing<br />
to price-sensitive travelers and corporate accounts<br />
and increasing the importance of general indicators of quality<br />
(such as “three-star downtown hotel”) at the expense of<br />
brand identification. These agencies hope that consumers<br />
will eventually develop brand loyalties to their travel services<br />
rather than to our lodging brands. Although we expect to<br />
continue to maintain and even increase the strength of our<br />
brands in the online marketplace, if the amount of sales<br />
made through Internet intermediaries increases significantly,<br />
our business and profitability may be harmed.<br />
Changes in privacy law could adversely affect our ability to<br />
market our products effectively. Our Timeshare segment, and<br />
to a lesser extent our other lodging segments, rely on a variety<br />
of direct marketing techniques, including telemarketing,<br />
email marketing and postal mailings. Any further restrictions<br />
in laws such as the Telemarketing Sales Rule, CANSPAM Act,<br />
and various U.S. state laws regarding marketing and solicitation<br />
or international data protection laws that govern these<br />
activities could result in concern about the continuing effectiveness<br />
of telemarketing, email and postal mailing techniques<br />
and could force further changes in our marketing<br />
strategy. If this occurs, we may not be able to develop adequate<br />
alternative marketing strategies, which could impact<br />
the amount and timing of our sales of timeshare units and<br />
other products. We also obtain access to potential customers<br />
from travel service providers or other companies with whom<br />
we have substantial relationships and market to some individuals<br />
on these lists directly or by including our marketing<br />
message in the other company’s marketing materials. If the<br />
acquisition of these lists were outlawed or otherwise<br />
restricted, our ability to develop new customers and introduce<br />
them to our products could be impaired.<br />
Operating risks at our synthetic fuel operations could reduce<br />
the tax benefits generated by those facilities. The Company<br />
owns four synthetic fuel production facilities. The Internal<br />
Revenue Code provides tax credits for the production and<br />
sale of synthetic fuels produced from coal through 2007.<br />
Although our synthetic fuel facilities incur significant losses,<br />
those losses are more than offset by the tax credits generated,<br />
which reduce our income tax expense. Problems related<br />
to supply, production and demand at any of the synthetic<br />
fuel facilities, the power plants and other end users that buy<br />
synthetic fuel from the facilities, the suppliers of the treatment<br />
agent or the coal mines from which the facilities buy<br />
coal could diminish the productivity of our synthetic fuel<br />
operations and adversely impact the ability of those operations<br />
to generate tax credits.<br />
MARRIOTT INTERNATIONAL, INC. <strong>2006</strong> | 13
High oil prices in 2007 could reduce or eliminate the tax credits<br />
generated by our synthetic fuel facilities. The tax credits<br />
available under the Internal Revenue Code for the production<br />
and sale of synthetic fuel in any given year are phased out if<br />
the Reference Price of a barrel of oil for that year falls within a<br />
specified price range. The “Reference Price” of a barrel of oil is<br />
an estimate of the annual average wellhead price per barrel<br />
of domestic crude oil and is determined for each calendar<br />
year by the Secretary of the Treasury by April 1 of the following<br />
year. In 2004 and 2005, the Reference Price was approximately<br />
equal to 89 percent of the average price in those<br />
years of the benchmark NYMEX futures contract for a barrel<br />
of light, sweet crude oil. The price range within which the tax<br />
credit is phased out was set in 1980 and is adjusted annually<br />
for inflation. In 2005, the phase-out range was $53.20 to<br />
$66.79. Because the Reference Price for a barrel of oil for 2005<br />
was below that range, at $50.26, there was no reduction of<br />
the tax credits available for synthetic fuel produced and sold<br />
in 2005.<br />
Assuming a 2 percent inflation adjustment factor for <strong>2006</strong><br />
and assuming that the ratio of the Reference Price to the<br />
average price of the benchmark NYMEX futures contract<br />
remains approximately the same in <strong>2006</strong> as it was in 2005 we<br />
currently estimate that there was a 39 percent reduction of<br />
the tax credits available for synthetic fuel produced and sold<br />
in <strong>2006</strong>. Assuming a 2 percent inflation adjustment factor for<br />
each of <strong>2006</strong> and 2007 and assuming the ratio of the<br />
Reference Price to the average price of the benchmark<br />
14 | MARRIOTT INTERNATIONAL, INC. <strong>2006</strong><br />
NYMEX futures contract remains the same in 2007 as it was in<br />
2005, we currently estimate that the tax credits available for<br />
the production and sale of synthetic fuel in 2007 would<br />
begin to be phased out if the average price of the benchmark<br />
NYMEX futures contract in 2007 exceeds approximately<br />
$62.19 and would be fully phased out if the average price of<br />
the benchmark NYMEX futures contract in 2007 exceeds<br />
approximately $78.08. The average price of the benchmark<br />
NYMEX futures contract for 2007, through February 9, 2007,<br />
was approximately $55.49.<br />
We cannot predict with any accuracy the future price of a<br />
barrel of oil. If the Reference Price of a barrel of oil in 2007<br />
exceeds the applicable phase-out threshold, the tax credits<br />
generated by our synthetic fuel facilities could be reduced or<br />
eliminated, which would have a negative impact on our<br />
results of operations. Late in <strong>2006</strong> and early in 2007, we<br />
entered into hedging agreements to minimize operating<br />
losses that could occur if more than a majority of the tax<br />
credits are phased out in 2007.<br />
Our effective tax rate is likely to increase significantly after<br />
the synthetic fuel tax credit program expires at the end of 2007.<br />
Tax credits contributed by our synthetic fuel operations have<br />
significantly reduced our effective tax rate during the last<br />
several years. Because that program ends with 2007 synthetic<br />
fuel production, our facilities will not be able to generate<br />
credits in future years. As a result, our future effective tax rate<br />
is likely to increase significantly, thereby reducing our aftertax<br />
profits.
Management’s Discussion and Analysis of<br />
Financial Condition and Results of Operations<br />
BUSINESS AND OVERVIEW<br />
We are a worldwide operator and franchisor of 2,832 hotels and<br />
related facilities. Our operations are grouped into six business<br />
segments: North American Full-Service Lodging, North American<br />
Limited-Service Lodging, International Lodging, Luxury Lodging,<br />
Timeshare and Synthetic Fuel. In our Lodging business, we operate,<br />
develop and franchise under 13 separate brand names in<br />
68 countries and territories. We also operate and develop Marriott<br />
timeshare properties under four separate brand names.<br />
We earn base, incentive and franchise fees based upon the<br />
terms of our management and franchise agreements. Revenues<br />
are also generated from the following sources associated with<br />
our Timeshare segment: (1) selling timeshare interval, fractional<br />
and whole ownership properties; (2) operating the resorts; and<br />
(3) financing customer purchases of timesharing intervals. In<br />
addition, we earn revenues from the limited number of hotels<br />
we own and lease and we earn revenues and generate tax credits<br />
from our synthetic fuel operations.<br />
Generally, lodging demand remained robust through <strong>2006</strong>,<br />
driven by continued strength associated with business and<br />
leisure travelers, while lodging supply growth continued to<br />
remain low. At the property level, these factors enabled us to<br />
increase rates and improve revenue mix, which resulted in strong<br />
year-over-year RevPAR increases. Revenue mix improvement is a<br />
function of the strong demand environment and results as some<br />
less profitable business is limited in favor of more profitable business,<br />
such as fewer discounted leisure packages in favor of more<br />
corporate business. This deliberate strategy of shifting business<br />
to higher rated tiers, yielded strong year-over-year average daily<br />
rate growth and only modest occupancy declines. Rates have<br />
also increased as stronger demand enabled us to reduce available<br />
discounts and special rates. In addition, group rates continue<br />
to increase as business negotiated in earlier years at lower rates is<br />
replaced with business negotiated at higher rates.<br />
Demand for our brands is strong in most markets around the<br />
world, and the weak U.S. dollar continues to drive international<br />
travelers into the United States. For our North American properties,<br />
RevPAR increases in <strong>2006</strong> as compared to the year ago<br />
period were particularly strong in New York, Boston, Atlanta,<br />
Chicago, Dallas, Houston, Los Angeles and Seattle. Across the<br />
U.S., demand also strengthened in many smaller city and suburban<br />
markets during <strong>2006</strong>. Internationally, RevPAR increases in<br />
<strong>2006</strong> versus the prior year were particularly strong in China,<br />
Mexico, Australia, the United Kingdom, the Middle East, the<br />
Netherlands, France and Germany.<br />
Our brands are strong as a result of superior customer service<br />
with an emphasis on guest satisfaction, the worldwide presence<br />
and quality of our brands, our Marriott Rewards loyalty program,<br />
an information-rich and easy-to-use web site, a multi-channel<br />
central reservations system and desired property amenities<br />
including meeting and banquet facilities, fitness centers, spas,<br />
award-winning restaurants and high-speed and wireless Internet<br />
access. We, along with owners and franchisees, continue to invest<br />
in our brands by means of both new and renovated properties,<br />
new room and public space designs, enhanced amenities and<br />
technology offerings.<br />
See the “Risk Factors,” section of this report for important<br />
information regarding forward-looking statements made in this<br />
report and risks and uncertainties that the Company faces.<br />
CONSOLIDATED RESULTS<br />
The following discussion presents an analysis of results of our<br />
operations for <strong>2006</strong>, 2005 and 2004.<br />
Continuing Operations<br />
Revenues<br />
<strong>2006</strong> COMPARED TO 2005<br />
Revenues increased 5 percent to $12,160 million in <strong>2006</strong> from<br />
$11,550 million in 2005, as a result of stronger demand for hotel<br />
rooms worldwide, partially offset by a decline in revenue associated<br />
with our synthetic fuel operation. Base management and<br />
franchise fees increased $117 million as a result of stronger<br />
RevPAR and unit growth. In <strong>2006</strong>, we recognized $5 million of<br />
base management fees that were calculated based on prior<br />
period results, but not earned and due until <strong>2006</strong>. Incentive<br />
management fees improved $80 million due to stronger RevPAR<br />
and property-level margin improvements associated with room<br />
rate increases and productivity improvements. Incentive fees<br />
include $10 million and $14 million for <strong>2006</strong> and 2005, respectively,<br />
that were calculated based on prior period earnings but<br />
not earned and due until the periods in which they were recognized.<br />
Stronger catering, food and beverage, spa, and other profits<br />
also drove property-level margins higher. Year-over-year<br />
RevPAR increases were driven primarily by rate increases. Owned<br />
and leased revenue increased significantly, primarily as a result<br />
of our purchase, early in the second half of 2005, of 13 formerly<br />
managed properties from CTF Holdings Ltd. (“CTF”). See Footnote<br />
No. 8,“Acquisitions and Dispositions,” later in this report for<br />
a detailed description of the CTF transaction. As planned, eight<br />
of the CTF properties were sold during <strong>2006</strong>: one property was<br />
sold in the <strong>2006</strong> first quarter; five properties were sold in the<br />
<strong>2006</strong> second quarter; and two properties were sold in the <strong>2006</strong><br />
third quarter.<br />
Timeshare sales and services revenue increased $90 million<br />
(6 percent) over the prior year. The increase largely reflects<br />
$77 million of revenue in <strong>2006</strong> from note securitization gains. As<br />
detailed later in the “Cumulative Effect of Change in Accounting<br />
Principle” narrative, note securitization gains of $69 million for<br />
2005 are not reflected in revenue, but instead are a component<br />
of gains and other income. Additionally, financing and services<br />
revenue increased in <strong>2006</strong> versus the prior year, as did villa<br />
rental revenue. Partially offsetting these increases, development<br />
revenue declined due to projects in the early stages of development<br />
that did not reach revenue recognition thresholds and limited<br />
available inventory associated with projects that sold out or<br />
were nearing sell-out. As compared to 2005, synthetic fuel revenue<br />
was significantly lower in <strong>2006</strong>, primarily due to the suspensions<br />
of production in <strong>2006</strong> as a result of high oil prices.<br />
Synthetic fuel production resumed in the fourth quarter of <strong>2006</strong>.<br />
The 5 percent increase in total revenue includes $404 million<br />
of increased cost reimbursements revenue, to $8,075 million in<br />
<strong>2006</strong> from $7,671 million in the prior year.This revenue represents<br />
reimbursements of costs incurred on behalf of managed and franchised<br />
properties and relates, predominantly, to payroll costs at<br />
managed properties where we are the employer. As we record<br />
cost reimbursements based upon the costs incurred with no<br />
added mark-up, this revenue and related expense have no impact<br />
on either our operating income or net income.The increase in<br />
MARRIOTT INTERNATIONAL, INC. <strong>2006</strong> | 15
eimbursed costs is primarily attributable to the growth in the<br />
number of properties we manage and to wage increases. We<br />
added 13 managed properties (4,126 rooms), net, and 77 franchised<br />
properties (11,286 rooms), net, to our system in <strong>2006</strong>.<br />
2005 COMPARED TO 2004<br />
Revenues increased 14 percent to $11,550 million in 2005 from<br />
$10,099 million in 2004, as a result of strong demand for hotel<br />
rooms worldwide.Year-over-year RevPAR increases were driven<br />
primarily by rate increases and to a lesser extent by occupancy<br />
improvement. The increase in revenue versus the prior year also<br />
reflects recognition in 2005 of $14 million of incentive fees that<br />
were calculated based on prior period results, but not earned and<br />
due until 2005. Higher timeshare sales and services revenue<br />
reflecting higher financially reportable development revenue<br />
also improved our 2005 revenues. In addition, revenues increased<br />
due to the consolidation of our synthetic fuel operations from<br />
the start of the 2004 second quarter, which resulted in the recognition<br />
of revenue for all of 2005 versus only three quarters in<br />
2004, as we accounted for the synthetic fuel operations using the<br />
equity method of accounting in the 2004 first quarter. Further,<br />
owned and leased revenue increased significantly, primarily as a<br />
result of the purchase of 13 formerly managed CTF properties.<br />
The 14 percent increase in total revenue includes $743 million<br />
of increased cost reimbursements revenue, to $7,671 million in<br />
2005 from $6,928 million in the prior year.The increase in reimbursed<br />
costs is primarily attributable to the growth in the number<br />
of properties we manage and wage increases.We added 45 managed<br />
properties (4,519 rooms), net, to our system in 2005 (including<br />
the Whitbread properties more fully discussed later in this<br />
report under the caption “Marriott and Whitbread Joint Venture” in<br />
the “Liquidity and Capital Resources” section), and we also added<br />
49 franchised properties (6,333 rooms), net, to our system in 2005.<br />
Operating Income<br />
<strong>2006</strong> COMPARED TO 2005<br />
Operating income increased $456 million to $1,011 million in<br />
<strong>2006</strong> from $555 million in the prior year. The increase in <strong>2006</strong> is,<br />
in part, due to a combined base, franchise and incentive fee<br />
increase of $197 million, reflecting stronger RevPAR growth, unit<br />
growth and property-level margin improvements. Stronger<br />
owned, leased, corporate housing and other revenue net of<br />
direct expenses contributed $17 million of the improvement in<br />
operating income and reflected the strong demand environment<br />
in <strong>2006</strong> and the impact of the CTF properties acquired in<br />
2005. The $17 million improvement in <strong>2006</strong> versus the prior year<br />
reflects increased owned and leased results of $20 million, a<br />
$12 million increase in termination fees received and $5 million<br />
of higher other income, partially offset by $20 million of lower<br />
land lease income. Also reflected in the year-over-year change in<br />
owned and leased results are depreciation charges totaling<br />
$7 million recorded in <strong>2006</strong> associated with two properties that<br />
were reclassified in <strong>2006</strong> from “held for sale” to “held and used.”<br />
The depreciation charges totaling $7 million represented the<br />
amount that would have been recognized had the two properties<br />
been continuously classified as “held and used.”<br />
Timeshare sales and services revenue net of direct expenses<br />
increased $98 million in <strong>2006</strong> and largely reflects $77 million of<br />
revenue in <strong>2006</strong> from note securitization gains. As noted earlier in<br />
the “Revenue” discussion, note securitization gains of $69 million<br />
for 2005 are not reflected in revenue, but instead are a component<br />
of gains and other income. Also reflected in the $98 million<br />
favorable variance, development revenue net of expenses<br />
increased $14 million and financing, services and other revenue<br />
16 | MARRIOTT INTERNATIONAL, INC. <strong>2006</strong><br />
net of expenses increased $7 million. Increased development revenue<br />
net of expenses primarily reflects lower development<br />
expenses associated with projects in <strong>2006</strong> in the early stages of<br />
development that did not reach revenue recognition thresholds<br />
and the timing of expenses associated with Statement of Position<br />
04-2,“Accounting for Real Estate Time-Sharing Transactions”<br />
(“SOP 04-2”), implemented in <strong>2006</strong>. Increased financing, services<br />
and other revenue net of expenses reflects a $15 million reversal<br />
of marketing related contingency reserves in <strong>2006</strong>.<br />
As compared to the year-ago period, general, administrative<br />
and other expenses decreased by $76 million. In 2005, we<br />
incurred general, administrative and other expenses of $94 million<br />
primarily due to the non-cash write-off of deferred contract<br />
acquisition costs associated with the termination of management<br />
agreements resulting from the CTF transaction. We also<br />
incurred general, administrative and other expenses of $30 million<br />
in 2005 associated with our bedding incentive program. We<br />
implemented the bedding incentive program in the 2005 second<br />
quarter to help ensure that guests could enjoy the comfort<br />
and luxury of our new bedding by year-end 2005. Further<br />
impacting general, administrative and other expenses, 2005<br />
reflected performance cure payments of $15 million versus a<br />
$6 million similar payment in <strong>2006</strong>, and 2005 also reflected<br />
$9 million of guarantee charges associated with three properties<br />
versus the reversal of an additional $5 million of guarantee<br />
charges in <strong>2006</strong>. Additionally impacting the year-over-year general,<br />
administrative and other expenses variance were foreign<br />
exchange gains totaling $6 million in <strong>2006</strong> as compared to<br />
losses of $5 million in 2005.<br />
Also impacting the year-over-year change in general,<br />
administrative and other expenses, development expenses<br />
and deferred compensation expenses were higher in <strong>2006</strong> by<br />
$15 million and $5 million, respectively. As noted under the<br />
heading “New Accounting Standards,” later in this report, we<br />
adopted a new accounting standard in <strong>2006</strong> associated with<br />
share-based compensation. This new standard resulted in incremental<br />
general, administrative and other expenses of $39 million<br />
versus 2005, primarily impacting the unallocated portion of<br />
our general, administrative and other expenses. Of the $76 million<br />
decrease in total general, administrative and other<br />
expenses, a decrease of $124 million was attributable to our<br />
Lodging segments and a $48 million increase was unallocated.<br />
Finally, operating income for <strong>2006</strong> included a synthetic fuel<br />
operating loss of $76 million versus an operating loss of $144 million<br />
in the prior year, primarily reflecting production suspensions<br />
in <strong>2006</strong> due to high oil prices. For additional information, see our<br />
“Synthetic Fuel” segment discussion later in this report.<br />
2005 COMPARED TO 2004<br />
Operating income increased $78 million to $555 million in 2005<br />
from $477 million in the prior year, primarily as a result of the<br />
following items: a combined base, incentive and franchise fee<br />
improvement of $154 million reflecting a stronger demand environment;<br />
$51 million of stronger timeshare sales and services<br />
revenue net of direct expenses reflecting higher financially<br />
reportable development revenue; and $65 million of stronger<br />
owned, leased, corporate housing and other revenue net of direct<br />
expenses. The fee improvement versus the prior year also reflects<br />
the recognition in 2005 of $14 million of incentive fees that were<br />
calculated based on prior period results, but not earned and due<br />
until 2005. The increase in owned, leased, corporate housing and<br />
other revenue net of direct expenses is primarily attributable to<br />
properties acquired in 2005, including the CTF properties, and to<br />
a lesser extent the strong demand environment in 2005, and our
eceipt in 2005, of a $10 million termination fee associated with<br />
one property that left our system.<br />
The favorable items noted above were also partially offset by<br />
$146 million of increased general and administrative expenses<br />
and $46 million of lower synthetic fuel revenue net of synthetic<br />
fuel expenses. Increased general, administrative and other<br />
expenses were associated with our Lodging segments as unallocated<br />
general, administrative and other expenses were down<br />
slightly compared to the prior year. The increase in general,<br />
administrative and other expenses reflects a $94 million charge<br />
impacting our North American Full-Service and International<br />
Lodging segments, primarily due to the non-cash write-off of<br />
deferred contract acquisition costs associated with the termination<br />
of management agreements associated with our acquisition<br />
of the CTF properties, and $30 million of expenses associated<br />
with our bedding incentive program, impacting our North<br />
American Full-Service, North American Limited-Service and<br />
International Lodging segments. General, administrative and<br />
other expenses in 2005 also reflect pre-tax performance termination<br />
cure payments of $15 million associated with two properties,<br />
a $9 million pre-tax charge associated with three<br />
guarantees, increased other net overhead costs of $13 million<br />
including costs related to the Company’s unit growth, development<br />
and systems, and $2 million of increased foreign exchange<br />
losses partially offset by $5 million of lower litigation expenses.<br />
Additionally, in 2004, general, administrative and other expenses<br />
included a $13 million charge associated with the write-off of<br />
deferred contract acquisition costs.<br />
Operating income for 2005 included a synthetic fuel operating<br />
loss of $144 million versus a $98 million operating loss in the prior<br />
year, reflecting increased costs and the consolidation of our synthetic<br />
fuel operations from the start of the 2004 second quarter,<br />
which resulted in the recognition of revenue and expenses for all<br />
of 2005 versus only three quarters in 2004, as we accounted for<br />
the synthetic fuel operations using the equity method of accounting<br />
in the 2004 first quarter. For additional information, see our<br />
“Synthetic Fuel” segment discussion later in this report.<br />
Gains and Other Income<br />
The following table shows our gains and other income for <strong>2006</strong>,<br />
2005 and 2004.<br />
($ in millions) <strong>2006</strong> 2005 2004<br />
Timeshare segment note sale gains $ — $ 69 $ 64<br />
Synthetic fuel earn-out payments<br />
(made) received, net (15) 32 28<br />
Loss on expected land sale (37) — —<br />
Gains on sales of real estate and other 26 34 48<br />
Other note sale/repayment gains 2 25 5<br />
Gains on sale/income on redemption of<br />
joint venture investments 68 7 19<br />
Income from cost method joint ventures 15 14 —<br />
$59 $181 $164<br />
Gains on sale/income on redemption of joint venture investments<br />
of $68 million in <strong>2006</strong> represents $43 million of net gains<br />
associated with the sale of joint venture investments and $25 million<br />
of income associated with the redemption of preferred<br />
stock we held in one investee. As further explained in the earlier<br />
“Revenues” discussion for <strong>2006</strong>, Timeshare segment note sale<br />
gains of $77 million in <strong>2006</strong> are presented in the “Timeshare<br />
sales and services” revenue caption.<br />
Interest Expense<br />
<strong>2006</strong> COMPARED TO 2005<br />
Interest expense increased $18 million (17 percent) to $124 million<br />
in <strong>2006</strong> from $106 million in 2005. Included within interest<br />
expense for <strong>2006</strong> are charges totaling $46 million relating to<br />
interest on accumulated cash inflows, in advance of our cash<br />
outflows for various programs that we operate on the owners’<br />
behalf, including the Marriott Rewards, Gift Certificates and Self-<br />
Insurance programs. The increase in interest on these programs<br />
over 2005 is related to higher liability balances and higher interest<br />
rates. Interest expense also increased in <strong>2006</strong>, due to our<br />
June 2005 Series F Notes issuance, our June <strong>2006</strong> Series H Notes<br />
issuance, and higher commercial paper balances coupled with<br />
higher rates. Partially offsetting these increases were interest<br />
expense declines associated with the payoff, at maturity, of both<br />
our Series D Notes in April 2005 and Series B Notes in November<br />
2005, and the exchange of our Series C and Series E Notes for<br />
lower interest rate Series G Notes in 2005.<br />
2005 COMPARED TO 2004<br />
Interest expense increased $7 million (7 percent) to $106 million<br />
in 2005 from $99 million in the prior year, reflecting increased<br />
debt levels, which helped to facilitate significantly higher capital<br />
expenditures and share repurchases in 2005. Interest expense in<br />
2005 reflected our June 2005 Series F Notes issuance and, versus<br />
the prior year, higher commercial paper balances coupled with<br />
higher rates. Included within interest expense for 2005 are<br />
charges totaling $29 million relating to interest on accumulated<br />
cash inflows, in advance of our cash outflows for various programs<br />
that we operate on the owners’ behalf, including the<br />
Marriott Rewards, Gift Certificates and Self-Insurance programs.<br />
The increase over 2004 is related to higher liability balances and<br />
higher interest rates. Partially offsetting these increases were<br />
interest expense declines associated with the payoff, at maturity,<br />
of both our Series D Notes in April 2005 and Series B Notes in<br />
November 2005, and the capitalization of more interest associated<br />
with the development of timeshare properties.<br />
Interest Income, Provision for Loan Losses, and<br />
Income Tax<br />
<strong>2006</strong> COMPARED TO 2005<br />
Interest income, before the provision for loan losses, decreased<br />
$34 million (43 percent) to $45 million in <strong>2006</strong> from $79 million<br />
in 2005, primarily reflecting the impact of loans repaid to us in<br />
2005. Also reflected in the decrease versus the prior year are<br />
$4 million of mark-to-market expenses in <strong>2006</strong> associated with<br />
hedges for our synthetic fuel operations. Loan loss provisions<br />
decreased $31 million versus the prior year reflecting the reversal<br />
of loan loss provisions totaling $3 million in <strong>2006</strong> compared<br />
to a charge of $17 million in 2005 due to the impairment of our<br />
Delta Air Lines, Inc. aircraft leveraged lease, see the “Investment<br />
in Leveraged Lease” caption later in this report for additional<br />
information, and an $11 million loan loss provision in 2005 associated<br />
with one property.<br />
Our tax provision totaled $286 million in <strong>2006</strong> compared to<br />
a tax provision of $94 million in 2005. The difference of $192 million<br />
is primarily attributable to $96 million of higher taxes in<br />
<strong>2006</strong> associated with higher pre-tax income from our lodging<br />
operations and $96 million of lower tax credits and tax benefit<br />
in <strong>2006</strong> associated with our synthetic fuel operations that generated<br />
a net tax benefit of $94 million in <strong>2006</strong> compared to a<br />
net tax benefit of $190 million in 2005. As discussed in more<br />
detail in the “Synthetic Fuel” segment caption later in this<br />
report, <strong>2006</strong> includes a provision for an estimated 39 percent<br />
MARRIOTT INTERNATIONAL, INC. <strong>2006</strong> | 17
phase-out of tax credits associated with the synthetic fuel operations<br />
due to high oil prices.<br />
2005 COMPARED TO 2004<br />
Interest income, before the provision for loan losses, decreased<br />
$67 million (46 percent) to $79 million in 2005 from $146 million<br />
in the prior year, primarily reflecting the impact of loans repaid to<br />
us. Our provision for loan losses increased $36 million versus the<br />
prior year reflecting an $11 million charge in 2005 associated<br />
with one property and a charge of $17 million in 2005 due to the<br />
impairment of our Delta Air Lines, Inc. aircraft leveraged lease and<br />
the reversal in 2004 of loan loss provisions totaling $8 million.<br />
Our tax provision totaled $94 million in 2005 compared to a<br />
tax provision of $100 million in 2004. The difference of $6 million<br />
is primarily attributable to $19 million of higher taxes in 2005<br />
associated with higher pre-tax income from our lodging operations,<br />
more than offset by $25 million of higher tax credits and<br />
tax benefit in 2005 associated with our synthetic fuel operations<br />
that generated a net tax benefit of $190 million in 2005 compared<br />
to a net tax benefit of $165 million in 2004, and to a lesser<br />
extent, to a lower tax rate before the impact of the Synthetic<br />
Fuel segment in 2005, as a result of a higher proportion of<br />
income in countries with lower effective tax rates. For additional<br />
information see the analysis of results of operations for the<br />
Synthetic Fuel segment later in this report.<br />
Equity in Earnings (Losses)<br />
<strong>2006</strong> COMPARED TO 2005<br />
The $33 million decline from earnings of $36 million in 2005 to<br />
earnings of $3 million in <strong>2006</strong>, attributable to our equity investments,<br />
reflected the recognition in 2005 of $30 million of equity<br />
earnings from the sale of hotels by three equity joint ventures in<br />
which we had equity interests. In addition, since 2005 we have<br />
sold several equity joint ventures.<br />
2005 COMPARED TO 2004<br />
Equity in earnings (losses) of equity method investees increased<br />
$78 million from a net loss of $42 million in 2004 to net earnings<br />
of $36 million in 2005. Twenty-eight million dollars of the<br />
increase is attributable to our synthetic fuel joint ventures that<br />
we reported as an equity investment in the 2004 first quarter,<br />
versus consolidation of the joint ventures for the periods thereafter.<br />
For additional information see the analysis of results of<br />
operations for the Synthetic Fuel segment later in this report.<br />
The remaining $50 million increase from the prior year is primarily<br />
attributable to several joint ventures with significant asset<br />
sales in 2005, favorably impacting the profitability of the joint<br />
ventures, producing higher earnings from joint ventures and, to<br />
a lesser extent, the stronger 2005 lodging demand environment<br />
and the mix of investments in each year.<br />
Minority Interest<br />
<strong>2006</strong> COMPARED TO 2005<br />
Minority interest decreased $39 million in <strong>2006</strong> from a benefit of<br />
$45 million in 2005 to a benefit of $6 million. On the first day of<br />
our <strong>2006</strong> fiscal year, we redeemed our partner’s interest in<br />
Synthetic American Fuel Enterprises II, LLC (“SAFE II”), which<br />
owns three of our four synthetic fuel production facilities. Also,<br />
effective October 1, <strong>2006</strong>, we purchased our partner’s interest in<br />
Synthetic American Fuel Enterprises I, LLC (“SAFE I”). Accordingly,<br />
in <strong>2006</strong>, minority interest represents only our partner’s share of<br />
the losses in SAFE I, through September 30, <strong>2006</strong>. For 2005,<br />
minority interest reflects our partner’s share of the synthetic fuel<br />
18 | MARRIOTT INTERNATIONAL, INC. <strong>2006</strong><br />
losses for all four production facilities. In addition, synthetic fuel<br />
operating losses in <strong>2006</strong> were significantly lower versus 2005<br />
reflecting reduced production. For additional information, see<br />
Footnote No. 2,“Synthetic Fuel,” later in this report.<br />
2005 COMPARED TO 2004<br />
Minority interest increased from a benefit of $40 million in 2004<br />
to a benefit of $45 million in 2005, primarily as a result of the<br />
change in the method of accounting for our synthetic fuel operations.<br />
For 2004, minority interest reflects our partner’s share of<br />
the synthetic fuel losses from March 26, 2004 (when we began<br />
consolidating the ventures due to the adoption of FIN 46(R)),<br />
through year-end. For 2005, minority interest reflects our partner’s<br />
share of the synthetic fuel losses for the entire year.<br />
Income from Continuing Operations<br />
<strong>2006</strong> COMPARED TO 2005<br />
Compared to 2005, income from continuing operations increased<br />
$49 million (7 percent) to $717 million in <strong>2006</strong>, and diluted earnings<br />
per share from continuing operations increased $0.21 (14 percent)<br />
to $1.66. As discussed in more detail in the preceding sections<br />
beginning with “Operating Income,”the increase versus the prior<br />
year is due to higher fee income ($197 million), lower general,<br />
administrative and other expenses ($76 million), lower synthetic<br />
fuel operating losses ($68 million), higher owned, leased, corporate<br />
housing and other revenue net of direct expenses ($17 million), a<br />
lower loan loss provision ($31 million) and higher timeshare interval<br />
sales and services revenue net of direct expenses ($98 million).<br />
Partially offsetting these favorable variances, were significantly<br />
higher taxes ($192 million), lower gains and other income ($122 million),<br />
lower interest income ($34 million), higher interest expense<br />
($18 million), a lower minority interest benefit ($39 million) and<br />
lower equity investment results ($33 million).<br />
2005 COMPARED TO 2004<br />
Income from continuing operations increased $74 million<br />
(12 percent) to $668 million in 2005 versus the prior year, and<br />
diluted earnings per share from continuing operations increased<br />
$0.21 (17 percent) to $1.45. As discussed above in more detail,<br />
the increase in income from continuing operations from the<br />
prior year is primarily due to the strong demand environment<br />
for lodging, increased owned, leased and corporate housing and<br />
other revenue net of direct expenses ($65 million), principally<br />
reflecting owned and leased properties acquired in the 2005<br />
third quarter, increased timeshare sales and services revenue net<br />
of direct expenses ($51 million), stronger equity investment<br />
results ($78 million), higher gains and other income ($17 million)<br />
and lower taxes ($6 million). As discussed earlier in the report in<br />
more detail, increased general, administrative and other<br />
expenses ($146 million) reflected, among other things, the writeoff<br />
of deferred contract acquisition costs in connection with the<br />
CTF transaction and expenses associated with our bedding<br />
incentive program, higher synthetic fuel operating losses<br />
($46 million), lower interest income ($67 million), higher interest<br />
expense ($7 million) and a higher loan loss provision ($36 million)<br />
partially offset these favorable items.<br />
Cumulative Effect of Change in Accounting Principle<br />
<strong>2006</strong><br />
Statement of Position 04-2,“Accounting for Real Estate Time-<br />
Sharing Transactions”<br />
In December 2004, the Financial Accounting Standards Board<br />
(“FASB”) issued Financial Accounting Standards (“FAS”) No. 152,
“Accounting for Real Estate Time-Sharing Transactions-an<br />
amendment of FASB Statements No. 66 and 67,” and the<br />
American Institute of Certified Public Accountants issued SOP<br />
04-2. Additionally, the FASB amended FAS No. 66,“Accounting for<br />
Sales of Real Estate,” and FAS No. 67,“Accounting for Costs and<br />
Initial Rental Operations of Real Estate Projects,” to exclude<br />
accounting for real estate time-sharing transactions from these<br />
statements. We adopted SOP 04-2 at the beginning of the <strong>2006</strong><br />
first quarter.<br />
Under SOP 04-2, we charge the majority of sales and marketing<br />
costs we incur to sell timeshares to expense when incurred.<br />
We also record an estimate of expected uncollectibility on notes<br />
receivable that we receive from timeshare purchasers as a reduction<br />
in revenue at the time that we recognize profit on a timeshare<br />
sale. We also account for rental and other operations<br />
during holding periods as incidental operations, which requires<br />
us to record any excess of revenues over costs as a reduction of<br />
inventory costs.<br />
The initial adoption of SOP 04-2 in our <strong>2006</strong> first quarter,<br />
which we reported as a cumulative effect of change in accounting<br />
principle in our Consolidated Statement of Income, resulted<br />
in a non-cash after-tax charge of $105 million ($0.24 per diluted<br />
share). As a result of tax rate adjustments in the <strong>2006</strong> fourth<br />
quarter, we reduced the tax benefit associated with the initial<br />
adoption from $68 million to $64 million. Accordingly, the aftertax<br />
impact of the adoption was $109 million ($0.25 per diluted<br />
share). As a result of the change,“Net Income” of $65 million<br />
($0.15 per diluted share) as reported in the <strong>2006</strong> first quarter,<br />
now totals $61 million ($0.14 per diluted share). The pre-tax<br />
charge totaled $173 million and comprised a $130 million inventory<br />
write-down, the establishment of a $25 million notes receivable<br />
reserve and an increase in current liabilities of $18 million.<br />
We estimate that the ongoing impact of adoption in subsequent<br />
periods will be immaterial.<br />
The American Resort Development Association, a timeshare<br />
trade association of which we are a member, and the Staff of the<br />
United States Securities and Exchange Commission had communications<br />
regarding SOP 04-2 and the income statement presentation<br />
of timeshare note securitizations gains. As a result of<br />
those communications, we reclassified in our <strong>2006</strong> third quarter,<br />
in our Consolidated Statement of Income, Timeshare segment<br />
note securitization gains of $40 million recognized in the <strong>2006</strong><br />
second quarter from the “Gains and other income” caption to<br />
the “Timeshare sales and services” revenue caption. As a result of<br />
the change,“Timeshare sales and services” revenue of $331 million<br />
as reported in the <strong>2006</strong> second quarter, now totals $371 million,<br />
and “Gains and other income” of $48 million as reported in<br />
the <strong>2006</strong> second quarter, now totals $8 million. Including<br />
$37 million of Timeshare segment note securitization gains recognized<br />
in the <strong>2006</strong> fourth quarter, full-year <strong>2006</strong> note securitization<br />
gains totaling $77 million are reflected within our<br />
“Timeshare sales and services” revenue caption.<br />
We estimate that, for the 20-year period from 2007 through<br />
2026, the cost of completing improvements and currently<br />
planned amenities for our owned timeshare properties will be<br />
approximately $1.9 billion.<br />
Business Segments<br />
We are a diversified hospitality company with operations in six<br />
business segments:<br />
3 North American Full-Service Lodging, which includes the<br />
Marriott Hotels & Resorts, JW Marriott Hotels & Resorts,<br />
Marriott Conference Centers, Renaissance Hotels &<br />
Resorts, and Renaissance ClubSport brands located in the<br />
continental United States and Canada;<br />
3 North American Limited-Service Lodging, which includes<br />
the Courtyard, Fairfield Inn, SpringHill Suites, Residence<br />
Inn, TownePlace Suites and Marriott ExecuStay brands<br />
located in the continental United States and Canada;<br />
3 International Lodging, which includes the Marriott Hotels<br />
& Resorts, JW Marriott Hotels & Resorts, Renaissance<br />
Hotels & Resorts, Courtyard, Fairfield Inn, Residence Inn,<br />
Ramada International and Marriott Executive Apartments<br />
brands located outside the continental United States<br />
and Canada;<br />
3 Luxury Lodging, which includes The Ritz-Carlton and<br />
Bulgari Hotels & Resorts brands worldwide;<br />
3 Timeshare, which includes the development, marketing,<br />
operation and sale of timeshare, fractional and whole<br />
ownership properties under the Marriott Vacation Club,<br />
The Ritz-Carlton Club, Grand Residences by Marriott and<br />
Horizons by Marriott Vacation Club brands worldwide; and<br />
3 Synthetic Fuel, which includes our interest in the operation<br />
of coal-based synthetic fuel production facilities.<br />
In <strong>2006</strong>, the company analyzed its internal reporting process<br />
and implemented changes in the fourth quarter that were<br />
designed to improve efficiency. As part of this process, we evaluated<br />
the impact on segment reporting and made certain<br />
changes that were in accordance with U.S. generally accepted<br />
accounting principles. These reporting changes are in conformity<br />
with the requirements of FAS No. 131,“Disclosures about<br />
Segments of an Enterprise and Related Information,” (“FAS No.<br />
131”) and will better enable investors to view the Company the<br />
way management views it. Accordingly, we now report six operating<br />
segments as compared to five before the change and indirect<br />
administrative expenses are no longer allocated to our<br />
segments. Senior management allocates resources and assesses<br />
performance based on the six operating segments. The revised<br />
segment reporting is reflected throughout this report for all<br />
periods presented. Historical figures are presented in a manner<br />
that is consistent with the revised segment reporting.<br />
We evaluate the performance of our segments based primarily<br />
on the results of the segment without allocating corporate<br />
expenses, interest expense or indirect general, administrative<br />
and other expenses. With the exception of the Synthetic Fuel<br />
segment, we do not allocate income taxes or interest income to<br />
our segments. As note sales are an integral part of the Timeshare<br />
segment, we include note sale gains in our Timeshare segment<br />
results, and we allocate other gains and losses as well as equity<br />
earnings or losses from our joint ventures and divisional general,<br />
administrative and other expenses to each of our segments.<br />
“Other unallocated corporate” represents that portion of our revenues,<br />
general, administrative and other expenses, equity in<br />
earnings or losses, and other gains or losses that are not allocable<br />
to our segments.<br />
We have aggregated the brands presented within our North<br />
American Full-Service, North American Limited-Service, International<br />
and Luxury segments considering their similar economic<br />
characteristics, types of customers, distribution channels, the<br />
regulatory business environment of the brands and operations<br />
within each segment and our organizational structure and management<br />
reporting structure.<br />
MARRIOTT INTERNATIONAL, INC. <strong>2006</strong> | 19
At year-end <strong>2006</strong>, we operated or franchised the following<br />
properties by segment (excluding 2,046 corporate housing<br />
rental units):<br />
Total Lodging Products<br />
Segment/Brand (1) Properties Rooms<br />
North American Full-Service Lodging Segment<br />
Marriott Hotels & Resorts 320 126,494<br />
Marriott Conference Centers 13 3,476<br />
JW Marriott Hotels & Resorts 14 7,563<br />
Renaissance Hotels & Resorts 67 25,882<br />
Renaissance ClubSport 1 175<br />
North American Limited-Service Lodging Segment<br />
415 163,590<br />
Courtyard 665 93,948<br />
Fairfield Inn 517 46,486<br />
SpringHill Suites 153 17,808<br />
Residence Inn 510 61,210<br />
TownePlace Suites 123 12,368<br />
International Lodging Segment<br />
1,968 231,820<br />
Marriott Hotels & Resorts 150 41,889<br />
JW Marriott Hotels & Resorts 22 7,982<br />
Renaissance Hotels & Resorts 68 22,169<br />
Courtyard 68 11,578<br />
Fairfield Inn 1 103<br />
Residence Inn 1 76<br />
Marriott Executive Apartments 18 3,027<br />
Ramada International 2 332<br />
Luxury Lodging Segment<br />
330 87,156<br />
The Ritz-Carlton-North America 34 11,068<br />
The Ritz-Carlton-International 26 8,338<br />
Bulgari Hotels & Resorts-International 2 117<br />
Timeshare Segment<br />
62 19,523<br />
(2)<br />
Marriott Vacation Club 45 10,512<br />
The Ritz-Carlton Club 7 546<br />
Grand Residences by Marriott 3 313<br />
Horizons by Marriott Vacation Club 2 372<br />
57 11,743<br />
Total 2,832 513,832<br />
(1) North America includes brands located in the continental United States and<br />
Canada. International includes brands located outside the United States and Canada.<br />
(2) Includes resorts that are in active sales as well as those that are sold out. Products in<br />
active sales may not be ready for occupancy.<br />
Revenues<br />
($ in millions) <strong>2006</strong> 2005 2004<br />
North American Full-Service<br />
Segment<br />
North American Limited-Service<br />
$ 5,196 $ 5,116 $ 4,691<br />
Segment 2,060 1,886 1,673<br />
International Segment 1,411 1,017 604<br />
Luxury Segment 1,423 1,333 1,263<br />
Timeshare Segment 1,840 1,721 1,502<br />
Total Lodging 11,930 11,073 9,733<br />
Other unallocated corporate 65 56 45<br />
Synthetic Fuel Segment 165 421 321<br />
20 | MARRIOTT INTERNATIONAL, INC. <strong>2006</strong><br />
$12,160 $11,550 $10,099<br />
Income from Continuing Operations<br />
($ in millions) <strong>2006</strong> 2005 2004<br />
North American Full-Service Segment<br />
North American Limited-Service<br />
$ 455 $ 349 $ 337<br />
Segment 380 303 233<br />
International Segment 237 133 109<br />
Luxury Segment 63 45 35<br />
Timeshare Segment 280 271 203<br />
Total Lodging financial results 1,415 1,101 917<br />
Other unallocated corporate (251) (219) (220)<br />
Synthetic Fuel Segment (after-tax)<br />
Interest income, provision for loan losses<br />
and interest expense (excluding the<br />
5 125 107<br />
Synthetic Fuel Segment)<br />
Income taxes (excluding the Synthetic<br />
(72) (55) 55<br />
Fuel Segment) (380) (284) (265)<br />
$ 717 $ 668 $ 594<br />
Equity in Earnings (Losses) of Equity Method Investees<br />
($ in millions) <strong>2006</strong> 2005 2004<br />
North American Full-Service Segment $2 $21 $ 8<br />
North American Limited-Service Segment — (6) (17)<br />
International Segment — 20 5<br />
Luxury Segment (2) (1) (3)<br />
Timeshare Segment (2) 1 (7)<br />
Total Lodging (2) 35 (14)<br />
Other unallocated corporate 5 1 —<br />
Synthetic Fuel Segment — — (28)<br />
$3 $36 $(42)<br />
Marriott Lodging<br />
Lodging includes our North American Full-Service, North<br />
American Limited-Service, International, Luxury and Timeshare<br />
segments. We consider Lodging revenues and Lodging financial<br />
results to be meaningful indicators of our performance because<br />
they measure our growth in profitability as a lodging company<br />
and enable investors to compare the sales and results of our<br />
lodging operations to those of other lodging companies.<br />
<strong>2006</strong> COMPARED TO 2005<br />
We added 136 properties (23,466 rooms) and 45 properties<br />
(8,616 rooms) left the system in <strong>2006</strong>. Most of the properties<br />
that left the system were limited-service properties.<br />
Lodging financial results increased $314 million to $1,415 million<br />
in <strong>2006</strong> from $1,101 million in 2005, and revenues increased<br />
$857 million to $11,930 million in <strong>2006</strong>, an 8 percent increase<br />
from revenues of $11,073 million in 2005. The results as compared<br />
to the prior year reflect a $197 million (19 percent)<br />
increase in combined base, franchise and incentive fees from<br />
$1,027 million in 2005 to $1,224 million in <strong>2006</strong>, $124 million<br />
of lower general, administrative and other expenses, $8 million<br />
of higher owned, leased, corporate housing and other revenue<br />
net of direct expenses and $98 million of higher timeshare sales<br />
and services revenue net of direct expenses, partially offset by<br />
$78 million of lower gains and other income and a $37 million<br />
decline in earnings associated with equity investments. Higher<br />
RevPAR for comparable rooms, resulting from both domestic<br />
and international rate increases, higher property-level food and
everage and other revenue, and new unit growth drove the<br />
increase in base and franchise fees. In <strong>2006</strong>, we recognized $5 million<br />
of base management fees that were calculated based on<br />
prior period results, but not earned and due until <strong>2006</strong>. Incentive<br />
management fees increased $80 million (40 percent) during<br />
<strong>2006</strong>, reflecting the impact of strong room rate improvement<br />
and property-level margin improvements. Incentive fees include<br />
$10 million and $14 million for <strong>2006</strong> and 2005, respectively, that<br />
were calculated based on prior period earnings, but not earned<br />
and due until the periods in which they were recognized. In<br />
<strong>2006</strong>, 62 percent of our managed properties paid incentive fees<br />
to us versus 51 percent in 2005.<br />
Systemwide RevPAR, which includes data from our franchised<br />
properties, in addition to our owned, leased and managed properties,<br />
for comparable North American properties increased<br />
9.1 percent over 2005, and RevPAR for our comparable North<br />
American company-operated properties increased 8.9 percent.<br />
North American company-operated house profit margins<br />
improved 240 basis points versus 2005. Systemwide RevPAR for<br />
comparable international properties, increased 10.5 percent and<br />
RevPAR for comparable international company-operated properties<br />
increased 11.1 percent. Worldwide RevPAR for comparable<br />
systemwide properties increased 9.4 percent while worldwide<br />
RevPAR for comparable company-operated properties increased<br />
9.5 percent. In addition, worldwide comparable companyoperated<br />
house profit margins increased 230 basis points.<br />
2005 COMPARED TO 2004<br />
We added 134 properties (21,611 rooms) and 25 properties<br />
(4,755 rooms) left the system in 2005. Most of the properties<br />
that left the system were Fairfield Inn properties.<br />
Lodging financial results increased $184 million to $1,101 million<br />
in 2005 from $917 million in 2004, and revenues increased<br />
$1,340 million to $11,073 million in 2005, a 14 percent increase<br />
from revenues of $9,733 million in 2004. The results as compared<br />
to the prior year reflect a $154 million (18 percent) increase in<br />
base, franchise and incentive fees from $873 million in 2004 to<br />
$1,027 million in 2005, $54 million of higher owned, leased and<br />
other revenue net of expenses, an increase of $51 million in<br />
timeshare sales and services revenue net of expenses, $49 million<br />
of increased equity results, and increased gains and other<br />
income of $12 million, partially offset by $134 million of higher<br />
general, administrative and other expenses. The increase in base<br />
and franchise fees was driven by higher RevPAR for comparable<br />
rooms, primarily resulting from both domestic and international<br />
rate increases and new unit growth. Incentive management fees<br />
increased $59 million (42 percent) in 2005 versus the prior year,<br />
reflecting the impact of increased travel worldwide, driving<br />
strong property-level profits. The increase also reflects recognition<br />
in 2005 of $14 million of incentive fees that were calculated<br />
based on prior period results, but not earned and due until 2005.<br />
In 2005, 51 percent of our managed properties paid incentive<br />
fees to us versus 32 percent in 2004.<br />
Systemwide RevPAR for comparable North American properties<br />
increased 9.5 percent, and RevPAR for our comparable North<br />
American company-operated properties increased 9.8 percent.<br />
Systemwide RevPAR for comparable international properties,<br />
increased 11.9 percent and RevPAR for comparable international<br />
company-operated properties increased 11.3 percent. Worldwide<br />
RevPAR for comparable company-operated properties<br />
increased 10.1 percent while worldwide RevPAR for comparable<br />
systemwide properties increased 9.9 percent. In addition, worldwide<br />
comparable company-operated house profit margins<br />
increased 180 basis points.<br />
Lodging Development<br />
We opened 136 properties totaling 23,466 rooms, across our<br />
brands in <strong>2006</strong>, and 45 properties (8,616 rooms) left the system.<br />
Highlights of the year included:<br />
3 We converted 30 properties (6,869 rooms), or 29 percent<br />
of our gross room additions for the year, from other<br />
brands, and 27 percent of the rooms were located in international<br />
markets;<br />
3 We opened over 28 percent of the new rooms outside the<br />
United States;<br />
3 We added 91 properties (11,281 rooms) to our Limited-<br />
Service brands; and<br />
3 We opened our second Bulgari Hotels & Resorts brand<br />
property in Bali, Indonesia in September <strong>2006</strong>.<br />
We currently have approximately 100,000 rooms under construction,<br />
awaiting conversion, or approved for development in<br />
our pipeline, and we expect to add approximately 30,000 hotel<br />
rooms and timeshare units to our system in 2007. We believe that<br />
we have access to sufficient financial resources to finance our<br />
growth, as well as to support our ongoing operations and meet<br />
debt service and other cash requirements. Nonetheless, our ability<br />
to sell properties that we develop and the ability of hotel<br />
developers to build or acquire new Marriott-branded properties,<br />
both of which are important parts of our growth plan, depend in<br />
part on capital access, availability and cost for other hotel developers<br />
and third-party owners. These growth plans are subject to<br />
numerous risks and uncertainties, many of which are outside of<br />
our control. See the “Forward-Looking Statements” and “Risks and<br />
Uncertainties” captions earlier in this report and the “Liquidity<br />
and Capital Resources” caption later in this report.<br />
RevPAR<br />
The following tables show occupancy, average daily rate and<br />
RevPAR for comparable properties, for each of the brands in our<br />
North American Full-Service and North American Limited-Service<br />
segments, for our International segment by region and the principal<br />
brand in our Luxury Segment, The Ritz-Carlton. We have not presented<br />
statistics for company-operated Fairfield Inn properties in<br />
these tables because we operate only a limited number of properties,<br />
as the brand is predominantly franchised and such information<br />
would not be meaningful (identified as “nm” in the tables that follow).<br />
Systemwide statistics include data from our franchised properties,<br />
in addition to our owned, leased and managed properties.<br />
The occupancy, average daily rate and RevPAR statistics<br />
used throughout this report for <strong>2006</strong> include the period from<br />
December 31, 2005 through December 29, <strong>2006</strong>, the statistics<br />
for 2005 include the period from January 1, 2005 through<br />
December 30, 2005, and the statistics for 2004 include the<br />
period from January 3, 2004 through December 31, 2004 (except<br />
in each case, for The Ritz-Carlton brand properties and properties<br />
located outside of the United States<br />
and Canada, which for them includes<br />
the period from January 1 through<br />
December 31 for each year).<br />
The adjacent graph shows RevPAR for<br />
North American Comparable Company-<br />
Operated “Composite North American”<br />
properties (which includes our Marriott<br />
Hotels & Resorts, Renaissance Hotels &<br />
Resorts, The Ritz-Carlton, Courtyard,<br />
Residence Inn, TownePlace Suites,<br />
Fairfield Inn and SpringHill Suites<br />
2002 2003 2004 2005 <strong>2006</strong><br />
brands) for the last five fiscal years:<br />
$86.47<br />
$85.85<br />
$95.04<br />
RevPAR<br />
$103.29<br />
$110.74<br />
MARRIOTT INTERNATIONAL, INC. <strong>2006</strong> | 21
Comparable Company- Comparable<br />
Operated North Systemwide North<br />
American Properties (1) American Properties (1)<br />
<strong>2006</strong> Change vs. 2005 <strong>2006</strong> Change vs. 2005<br />
MARRIOTT HOTELS & RESORTS (2)<br />
Occupancy 72.3% –0.6% pts. 70.9% 0.2% pts.<br />
Average Daily Rate $168.11 9.1% $154.37 8.3%<br />
RevPAR $121.58 8.3% $109.48 8.6%<br />
RENAISSANCE HOTELS & RESORTS<br />
Occupancy 72.8% 0.6% pts. 72.2% 1.1% pts.<br />
Average Daily Rate $162.96 8.7% $151.91 8.4%<br />
RevPAR $118.57 9.6% $109.75 10.0%<br />
COMPOSITE NORTH AMERICAN FULL-SERVICE (3)<br />
Occupancy 72.4% –0.4% pts. 71.1% 0.3% pts.<br />
Average Daily Rate $167.27 9.0% $153.99 8.3%<br />
RevPAR $121.10 8.5% $109.52 8.9%<br />
THE RITZ-CARLTON NORTH AMERICA<br />
Occupancy 72.9% 2.1% pts. 72.9% 2.1% pts.<br />
Average Daily Rate $307.20 7.1% $307.20 7.1%<br />
RevPAR $223.88 10.3% $223.88 10.3%<br />
COMPOSITE NORTH AMERICAN FULL-SERVICE AND LUXURY (4)<br />
Occupancy 72.4% –0.1% pts. 71.2% 0.5% pts.<br />
Average Daily Rate $180.17 8.9% $163.03 8.3%<br />
RevPAR<br />
RESIDENCE INN<br />
$130.52 8.7% $116.11 9.0%<br />
Occupancy 78.3% –1.8% pts. 79.2% –0.5% pts.<br />
Average Daily Rate $117.99 9.2% $113.85 8.2%<br />
RevPAR<br />
COURTYARD<br />
$ 92.35 6.8% $ 90.15 7.6%<br />
Occupancy 70.9% –0.4% pts. 72.5% 0.1% pts.<br />
Average Daily Rate $119.30 10.9% $116.67 9.5%<br />
RevPAR<br />
FAIRFIELD INN<br />
$ 84.62 10.3% $ 84.57 9.7%<br />
Occupancy nm nm 70.7% 1.0% pts.<br />
Average Daily Rate nm nm $ 82.05 9.1%<br />
RevPAR<br />
TOWNEPLACE SUITES<br />
nm nm $ 58.01 10.6%<br />
Occupancy 75.3% –0.3% pts. 75.7% –0.2% pts.<br />
Average Daily Rate $ 78.68 10.9% $ 79.69 10.2%<br />
RevPAR<br />
SPRINGHILL SUITES<br />
$ 59.28 10.4% $ 60.35 9.9%<br />
Occupancy 72.3% –2.0% pts. 74.1% 0.2% pts.<br />
Average Daily Rate $102.86 10.7% $ 98.76 9.8%<br />
RevPAR $ 74.42 7.8% $ 73.16 10.0%<br />
COMPOSITE NORTH AMERICAN LIMITED-SERVICE (5)<br />
Occupancy 73.3% –0.8% pts. 74.2% 0.1% pts.<br />
Average Daily Rate $115.24 10.4% $105.65 9.0%<br />
RevPAR $ 84.41 9.1% $ 78.34 9.2%<br />
COMPOSITE NORTH AMERICAN (6)<br />
Occupancy 72.8% –0.4% pts. 73.0% 0.3% pts.<br />
Average Daily Rate $152.14 9.5% $128.07 8.7%<br />
RevPAR $110.74 8.9% $ 93.47 9.1%<br />
(1) Statistics are for the fifty-two weeks ended December 29, <strong>2006</strong>, and December 30, 2005,<br />
except for The Ritz-Carlton brand for which the statistics are for the twelve months<br />
ended December 31, <strong>2006</strong> and December 31, 2005. For properties located in Canada<br />
the comparison to 2005 is on a constant dollar basis.<br />
(2) Marriott Hotels & Resorts includes our JW Marriott Hotels & Resorts brand.<br />
(3) Composite North American Full-Service statistics include properties located in the continental<br />
United States and Canada for the Marriott Hotels & Resorts and Renaissance<br />
Hotels & Resorts brands.<br />
(4) Composite North American Full-Service and Luxury includes the Marriott Hotels &<br />
Resorts, Renaissance Hotels & Resorts and The Ritz-Carlton brands.<br />
(5) Composite North American Limited-Service statistics include properties located in the<br />
continental United States and Canada for the Courtyard, SpringHill Suites, Fairfield Inn,<br />
Residence Inn and TownePlace Suites brands.<br />
(6) Composite North American statistics include properties located in the continental<br />
United States and Canada for the Marriott Hotels & Resorts, Renaissance Hotels &<br />
Resorts, Residence Inn, Courtyard, Fairfield Inn, TownePlace Suites, SpringHill Suites,<br />
and The Ritz-Carlton brands.<br />
22 | MARRIOTT INTERNATIONAL, INC. <strong>2006</strong><br />
Comparable Company- Comparable<br />
Operated Properties (1) Systemwide Properties (1)<br />
<strong>2006</strong> Change vs. 2005 <strong>2006</strong> Change vs. 2005<br />
CARIBBEAN AND LATIN AMERICA (2)<br />
Occupancy 74.9% 1.5% pts. 73.0% 0.5% pts.<br />
Average Daily Rate $159.93 9.7% $150.93 9.2%<br />
RevPAR $119.81 12.0% $110.11 9.9%<br />
CONTINENTAL EUROPE (2)<br />
Occupancy 72.6% 2.0% pts. 70.7% 1.9% pts.<br />
Average Daily Rate $147.28 6.6% $150.58 7.2%<br />
RevPAR<br />
UNITED KINGDOM<br />
$106.95 9.6% $106.53 10.2%<br />
(2)<br />
Occupancy 79.6% 3.5% pts. 75.1% 3.1% pts.<br />
Average Daily Rate $225.38 9.5% $204.99 8.6%<br />
RevPAR $179.44 14.6% $153.94 13.3%<br />
MIDDLE EAST AND AFRICA (2)<br />
Occupancy 68.9% –0.3% pts. 69.0% –0.7% pts.<br />
Average Daily Rate $143.12 11.0% $134.95 11.5%<br />
RevPAR<br />
(2), (3)<br />
ASIA PACIFIC<br />
$ 98.58 10.5% $ 93.05 10.3%<br />
Occupancy 75.8% 1.0% pts. 76.2% 0.9% pts.<br />
Average Daily Rate $127.09 11.3% $129.26 9.8%<br />
RevPAR $ 96.28 12.7% $ 98.46 11.2%<br />
(4), (5)<br />
REGIONAL COMPOSITE<br />
Occupancy 74.6% 1.3% pts. 73.6% 1.1% pts.<br />
Average Daily Rate $148.13 9.5% $147.12 9.0%<br />
RevPAR $110.53 11.4% $108.32 10.7%<br />
THE RITZ-CARLTON INTERNATIONAL<br />
Occupancy 71.7% –0.1% pts. 71.7% –0.1% pts.<br />
Average Daily Rate $241.90 9.2% $241.90 9.2%<br />
RevPAR $173.35 9.1% $173.55 9.1%<br />
TOTAL INTERNATIONAL (6)<br />
Occupancy 74.4% 1.2% pts. 73.5% 1.0% pts.<br />
Average Daily Rate $153.99 9.4% $152.02 9.0%<br />
RevPAR $114.61 11.1% $111.78 10.5%<br />
(1) Financial results for all properties are reported on a period-end basis, while statistics for<br />
properties located outside the continental United States and Canada are reported on a<br />
month-end basis. The statistics are for January through December. For the properties<br />
located in countries that use currencies other than the U.S. dollar, the comparison to<br />
2005 is on a constant dollar basis.<br />
(2) Regional information includes the Marriott Hotels & Resorts, Renaissance Hotels & Resorts<br />
and Courtyard brands located outside of the continental United States and Canada.<br />
(3) Excludes Hawaii.<br />
(4) Includes Hawaii.<br />
(5) Regional Composite statistics include all properties located outside of the continental<br />
United States and Canada for the Marriott Hotels & Resorts, Renaissance Hotels &<br />
Resorts, and Courtyard brands.<br />
(6) Total International includes Regional Composite statistics and statistics for The Ritz-<br />
Carlton International and Bulgari Hotels & Resorts brands.<br />
Comparable Company- Comparable<br />
Operated Properties (1) Systemwide Properties (1)<br />
<strong>2006</strong> Change vs. 2005 <strong>2006</strong> Change vs. 2005<br />
COMPOSITE LUXURY (2)<br />
Occupancy 72.5% 1.4% pts. 72.5% 1.4% pts.<br />
Average Daily Rate $289.50 7.5% $289.50 7.5%<br />
RevPAR<br />
TOTAL WORLDWIDE<br />
$209.88 9.7% $209.88 9.7%<br />
(3)<br />
Occupancy 73.2% –% pts. 73.1% 0.4% pts.<br />
Average Daily Rate $152.63 9.5% $131.92 8.8%<br />
RevPAR $111.75 9.5% $ 96.39 9.4%<br />
(1) Financial results for all properties are reported on a period-end basis, while statistics for<br />
properties located outside the continental United States and Canada are reported on a<br />
month-end basis. For the properties located in countries that use currencies other than<br />
the U.S. dollar, the comparison to 2005 is on a constant dollar basis.<br />
(2) Composite Luxury includes worldwide properties for The Ritz-Carlton and Bulgari<br />
Hotels & Resorts brands.<br />
(3) Total Worldwide statistics include all properties worldwide for the Marriott Hotels &<br />
Resorts, Renaissance Hotels & Resorts, Residence Inn, Courtyard, Fairfield Inn,<br />
TownePlace Suites, SpringHill Suites, and The Ritz-Carlton brands. Statistics for properties<br />
located in the continental United States and Canada (except for The Ritz-Carlton<br />
brand) represent the fifty-two weeks ended December 29, <strong>2006</strong>, and December 30,<br />
2005. Statistics for all The Ritz-Carlton brand properties and properties located outside<br />
of the continental United States and Canada represent the twelve months ended<br />
December 31, <strong>2006</strong> and December 31, 2005.
Comparable Company- Comparable<br />
Operated North Systemwide North<br />
American Properties (1) American Properties (1)<br />
2005 Change vs. 2004 2005 Change vs. 2004<br />
MARRIOTT HOTELS & RESORTS (2)<br />
Occupancy 73.2% 1.1% pts. 71.0% 1.2% pts.<br />
Average Daily Rate $154.84 7.5% $144.03 6.9%<br />
RevPAR $113.31 9.0% $102.21 8.7%<br />
RENAISSANCE HOTELS & RESORTS<br />
Occupancy 72.1% 3.1% pts. 71.3% 2.6% pts.<br />
Average Daily Rate $149.90 7.8% $140.89 8.3%<br />
RevPAR $108.01 12.5% $100.45 12.4%<br />
COMPOSITE NORTH AMERICAN FULL-SERVICE (3)<br />
Occupancy 73.0% 1.4% pts. 71.0% 1.4% pts.<br />
Average Daily Rate $154.00 7.5% $143.53 7.1%<br />
RevPAR $112.41 9.6% $101.93 9.2%<br />
THE RITZ-CARLTON NORTH AMERICA<br />
Occupancy 71.0% 1.9% pts. 71.0% 1.9% pts.<br />
Average Daily Rate $287.99 9.2% $287.99 9.2%<br />
RevPAR $204.45 12.2% $204.45 12.2%<br />
COMPOSITE NORTH AMERICAN FULL-SERVICE AND LUXURY (4)<br />
Occupancy 72.8% 1.4% pts. 71.0% 1.4% pts.<br />
Average Daily Rate $166.58 7.8% $152.81 7.3%<br />
RevPAR<br />
RESIDENCE INN<br />
$121.27 10.0% $108.51 9.6%<br />
Occupancy 80.0% 1.0% pts. 79.5% 1.1% pts.<br />
Average Daily Rate $108.09 7.3% $104.99 6.7%<br />
RevPAR<br />
COURTYARD<br />
$ 86.46 8.6% $ 83.47 8.1%<br />
Occupancy 70.7% –0.2% pts. 72.2% 0.6% pts.<br />
Average Daily Rate $106.50 9.4% $105.72 7.9%<br />
RevPAR<br />
FAIRFIELD INN<br />
$ 75.32 9.1% $ 76.31 8.9%<br />
Occupancy nm nm 69.5% 2.3% pts.<br />
Average Daily Rate nm nm $ 74.47 8.1%<br />
RevPAR<br />
TOWNEPLACE SUITES<br />
nm nm $ 51.76 11.7%<br />
Occupancy 75.4% 1.1% pts. 75.8% 1.1% pts.<br />
Average Daily Rate $ 70.52 7.4% $ 72.11 9.3%<br />
RevPAR<br />
SPRINGHILL SUITES<br />
$ 53.18 9.1% $ 54.62 10.8%<br />
Occupancy 74.9% 3.4% pts. 74.0% 2.9% pts.<br />
Average Daily Rate $ 93.89 11.0% $ 90.43 9.1%<br />
RevPAR $ 70.36 16.3% $ 66.88 13.5%<br />
COMPOSITE NORTH AMERICAN LIMITED-SERVICE (5)<br />
Occupancy 73.8% 0.5% pts. 73.8% 1.3% pts.<br />
Average Daily Rate $103.70 8.7% $ 96.11 7.6%<br />
RevPAR $ 76.49 9.4% $ 70.97 9.5%<br />
COMPOSITE NORTH AMERICAN (6)<br />
Occupancy 73.2% 1.4% pts. 72.7% 1.3% pts.<br />
Average Daily Rate $141.14 8.2% $119.12 7.5%<br />
RevPAR $103.29 9.8% $ 86.56 9.5%<br />
(1) Statistics are for the fifty-two weeks ended December 30, 2005, and December 31, 2004,<br />
except for The Ritz-Carlton brand for which the statistics are for the twelve months<br />
ended December 31, 2005 and December 31, 2004. For properties located in Canada<br />
the comparison to 2004 is on a constant dollar basis.<br />
(2) Marriott Hotels & Resorts includes our JW Marriott Hotels & Resorts brand.<br />
(3) Composite North American Full-Service statistics include properties located in the continental<br />
United States and Canada for the Marriott Hotels & Resorts and Renaissance<br />
Hotels & Resorts brands.<br />
(4) Composite North American Full-Service and Luxury includes the Marriott Hotels &<br />
Resorts, Renaissance Hotels & Resorts and The Ritz-Carlton brands.<br />
(5) Composite North American Limited-Service statistics include properties located in the<br />
United States and Canada for the Courtyard, SpringHill Suites, Fairfield Inn, Residence<br />
Inn and TownePlace Suites brands.<br />
(6) Composite North American statistics include properties located in the continental<br />
United States and Canada for the Marriott Hotels & Resorts, Renaissance Hotels &<br />
Resorts, Residence Inn, Courtyard, Fairfield Inn, TownePlace Suites, SpringHill Suites, and<br />
The Ritz-Carlton brands.<br />
Comparable Company- Comparable<br />
Operated Properties (1) Systemwide Properties (1)<br />
2005 Change vs. 2004 2005 Change vs. 2004<br />
CARIBBEAN AND LATIN AMERICA (2)<br />
Occupancy 73.6% 3.9% pts. 73.0% 4.6% pts.<br />
Average Daily Rate $145.78 6.3% $138.31 5.9%<br />
RevPAR $107.24 12.1% $101.02 13.1%<br />
CONTINENTAL EUROPE (2)<br />
Occupancy 70.5% 0.5% pts. 68.6% 1.0% pts.<br />
Average Daily Rate $137.09 2.4% $138.63 4.3%<br />
RevPAR<br />
UNITED KINGDOM<br />
$ 96.69 3.1% $ 95.10 5.9%<br />
(2)<br />
Occupancy 76.9% 0.1% pts. 74.0% –1.1% pts.<br />
Average Daily Rate $182.61 4.8% $162.96 4.6%<br />
RevPAR $140.49 4.8% $120.53 3.1%<br />
MIDDLE EAST AND AFRICA (2)<br />
Occupancy 73.2% 4.0% pts. 71.7% 4.5% pts.<br />
Average Daily Rate $116.07 22.5% $114.45 21.2%<br />
RevPAR<br />
(2), (3)<br />
ASIA PACIFIC<br />
$ 84.96 29.5% $ 82.10 29.3%<br />
Occupancy 75.8% 0.8% pts. 76.5% 1.5% pts.<br />
Average Daily Rate $114.34 12.0% $118.63 12.5%<br />
RevPAR $ 86.63 13.1% $ 90.79 14.7%<br />
(4), (5)<br />
REGIONAL COMPOSITE<br />
Occupancy 74.2% 1.4% pts. 73.3% 1.7% pts.<br />
Average Daily Rate $133.14 8.1% $132.97 8.7%<br />
RevPAR $ 98.76 10.2% $ 97.51 11.3%<br />
THE RITZ-CARLTON INTERNATIONAL<br />
Occupancy 71.6% 3.4% pts. 71.6% 3.4% pts.<br />
Average Daily Rate $200.08 12.7% $200.08 12.7%<br />
RevPAR $143.30 18.3% $143.30 18.3%<br />
TOTAL INTERNATIONAL (6)<br />
Occupancy 73.6% 1.6% pts. 73.0% 1.8% pts.<br />
Average Daily Rate $159.30 8.9% $154.58 9.1%<br />
RevPAR $117.17 11.3% $112.79 11.9%<br />
(1) Financial results for all properties are reported on a period-end basis, while statistics for<br />
properties located outside the continental United States and Canada are reported on a<br />
month-end basis. The statistics are for January through December. For the properties<br />
located in countries that use currencies other than the U.S. dollar, the comparison to<br />
2004 is on a constant dollar basis.<br />
(2) Regional information includes the Marriott Hotels & Resorts, Renaissance Hotels & Resorts<br />
and Courtyard brands located outside of the continental United States and Canada.<br />
(3) Excludes Hawaii.<br />
(4) Includes Hawaii.<br />
(5) Regional Composite statistics include all properties located outside of the continental<br />
United States and Canada for the Marriott Hotels & Resorts, Renaissance Hotels &<br />
Resorts, and Courtyard brands.<br />
(6) Total International includes Regional Composite statistics for The Ritz-Carlton<br />
International brand.<br />
Comparable Company- Comparable<br />
Operated Properties (1) Systemwide Properties (1)<br />
2005 Change vs. 2004 2005 Change vs. 2004<br />
COMPOSITE LUXURY (2)<br />
Occupancy 71.2% 2.3% pts. 71.2% 2.3% pts.<br />
Average Daily Rate $262.98 9.7% $262.98 9.7%<br />
RevPAR<br />
TOTAL WORLDWIDE<br />
$187.16 13.5% $187.16 13.5%<br />
(3)<br />
Occupancy 73.4% 1.2% pts. 72.8% 1.4% pts.<br />
Average Daily Rate $140.26 8.3% $121.94 7.8%<br />
RevPAR $102.94 10.1% $ 88.72 9.9%<br />
(1) Financial results for all properties are reported on a period-end basis, while statistics for<br />
properties located outside the continental United States and Canada are reported on a<br />
month-end basis. For the properties located in countries that use currencies other than<br />
the U.S. dollar, the comparison to 2005 is on a constant dollar basis.<br />
(2) Composite Luxury includes worldwide properties for The Ritz-Carlton brand.<br />
(3) Total Worldwide statistics include all properties worldwide for the Marriott Hotels &<br />
Resorts, Renaissance Hotels & Resorts, Residence Inn, Courtyard, Fairfield Inn,<br />
TownePlace Suites, SpringHill Suites, and The Ritz-Carlton brands. Statistics for properties<br />
located in the continental United States and Canada (except for The Ritz-Carlton<br />
brand) represent the fifty-two weeks ended December 30, 2005, and December 31,<br />
2004. Statistics for all The Ritz-Carlton brand properties and properties located outside<br />
of the continental United States and Canada represent the twelve months ended<br />
December 31, 2005 and December 31, 2004.<br />
MARRIOTT INTERNATIONAL, INC. <strong>2006</strong> | 23
North American Full-Service Lodging<br />
North American Full-Service Lodging includes our Marriott Hotels<br />
& Resorts, JW Marriott Hotels & Resorts, Marriott Conference Centers,<br />
Renaissance Hotels & Resorts and Renaissance ClubSport brands.<br />
<strong>Annual</strong> Change<br />
($ in millions) <strong>2006</strong> 2005 2004 <strong>2006</strong>/2005 2005/2004<br />
Revenues $5,196 $5,116 $4,691 2% 9%<br />
Segment results $ 455 $ 349 $ 337 30% 4%<br />
<strong>2006</strong> COMPARED TO 2005<br />
In <strong>2006</strong>, across our North American Full-Service Lodging segment,<br />
we added 15 properties (4,971 rooms) and six properties<br />
(1,604 rooms) left the system.<br />
In <strong>2006</strong>, RevPAR for comparable company-operated North<br />
American full-service properties increased 8.5 percent to $121.10.<br />
Occupancy for these properties decreased 0.4 percentage points<br />
while average daily rates increased 9.0 percent to $167.27.<br />
Compared to the prior year, our <strong>2006</strong> results reflect a $59 million<br />
increase in base management, incentive management and franchise<br />
fees.The increase in fees is largely due to stronger RevPAR,<br />
driven primarily by rate increases and, to a lesser extent, to higher<br />
food and beverage, meeting room rental and other revenue and<br />
productivity improvements, all of which favorably impacted property-level<br />
house profit margins.The growth in the number of rooms,<br />
year-over-year, also contributed to the increase in fees. Incentive<br />
fees included $10 million for 2005 that were calculated based on<br />
prior period earnings but not earned and due until they were recognized.<br />
Similarly, base management fees for <strong>2006</strong> included $4 million<br />
of fees that were calculated based on prior period results, but<br />
not earned and due until <strong>2006</strong>. Owned, leased and other revenue<br />
net of direct expenses decreased $8 million primarily as a result of<br />
properties sold in <strong>2006</strong> and the receipt in 2005 of a $10 million termination<br />
fee associated with one property, partially offset by the<br />
receipt in <strong>2006</strong> of $10 million in termination fees.<br />
General, administrative and other expenses decreased $69 million<br />
as a result of, among other things, a $60 million charge in<br />
2005, associated with the CTF transaction, more fully discussed in<br />
the previous “Operating Income” discussion, as well as expenses<br />
of $14 million in 2005, related to our bedding incentive program,<br />
partially offset by increased expenses in <strong>2006</strong> reflecting costs<br />
related to unit growth and development, systems improvements<br />
and increases in ordinary costs such as wages and benefits. In<br />
2005, general, administrative and other expenses included $3 million<br />
of performance cure payments associated with one property.<br />
In <strong>2006</strong>, general, administrative and other expenses included a<br />
$5 million performance cure payment.<br />
Gains and other income was $3 million higher than the prior<br />
year and reflected the redemption of preferred stock in a cost<br />
method investee that generated income of $25 million in <strong>2006</strong><br />
and $15 million of higher net gains and other income in <strong>2006</strong><br />
reflecting gains in <strong>2006</strong> associated with the sale of joint venture<br />
investments and real estate that were partially offset by lower<br />
gains in <strong>2006</strong> associated with the sale or repayment before<br />
maturity of loans receivable associated with several properties.<br />
Gains and other income for <strong>2006</strong> reflected a $37 million noncash<br />
charge to adjust the carrying amount to net realizable<br />
value associated with land we own and lease, as further described<br />
in the “Expected Land Sale” caption later in this report. Equity<br />
results decreased by $19 million versus the prior year and<br />
24 | MARRIOTT INTERNATIONAL, INC. <strong>2006</strong><br />
reflected the recognition in 2005 of $16 million in equity earnings<br />
from two joint ventures as a result of the ventures’ sale of<br />
hotels and our sale of some joint venture investments in 2005<br />
and <strong>2006</strong>, offset to some extent by improved equity joint venture<br />
results reflecting the stronger demand environment.<br />
2005 COMPARED TO 2004<br />
In 2005, across our North American Full-Service Lodging segment,<br />
we added 20 properties (6,141 rooms) and five properties<br />
(1,995 rooms) left the system.<br />
In 2005, RevPAR for comparable company-operated North<br />
American full-service properties increased 9.6 percent to $112.41.<br />
Occupancy for these properties increased 1.4 percentage points<br />
while average daily rates increased 7.5 percent to $154.00.<br />
Compared to the prior year, our 2005 segment results reflect<br />
a $58 million increase in base management, incentive management<br />
and franchise fees and $35 million of increased owned,<br />
leased and other revenue net of direct expenses. The increase in<br />
fees is largely due to stronger RevPAR, driven primarily by rate<br />
increases that favorably impact property-level house profits, the<br />
growth in the number of rooms and the recognition in 2005 of<br />
$10 million of incentive fees that were calculated based on prior<br />
period earnings but not earned and due until 2005. The increase<br />
in owned, leased, and other revenue net of direct expenses is<br />
primarily attributable to properties acquired in 2005, many of<br />
which were sold throughout <strong>2006</strong> as expected, including the<br />
CTF properties. In addition, owned, leased and other revenue in<br />
2005 reflected our receipt of a $10 million termination fee associated<br />
with one property that left our system.<br />
Somewhat offsetting the net favorable variances were $78 million<br />
of higher general, administrative and other expenses. As<br />
noted in the preceding “Operating Income” discussion, during<br />
2005 we recorded a $60 million pre-tax charge, primarily due to<br />
the non-cash write-off of deferred contract acquisition costs<br />
associated with the termination of CTF management agreements,<br />
and we incurred expenses of $14 million related to our<br />
bedding incentive program, both of which impacted our general,<br />
administrative and other expenses. In 2005, we also recorded performance<br />
termination cure payments of $3 million associated<br />
with one property, which impacted general, administrative and<br />
other expenses. In addition, in 2005 there were increased overhead<br />
costs associated with unit growth and development.<br />
Further impacting segment results, gains and other income<br />
was $15 million lower than the prior year, while equity results<br />
increased by $13 million versus the prior year. The decrease in<br />
gains and other income is primarily attributable to the $13 million<br />
gain in 2004 associated with the sale of our interest in the<br />
Two Flags Joint Venture. The increase in equity results is primarily<br />
attributable to several joint ventures that had significant<br />
asset sales in 2005 generating gains, and to a lesser extent, the<br />
favorable variance is also a result of a stronger demand environment<br />
and the mix of investments.<br />
North American Limited-Service Lodging<br />
North American Limited-Service Lodging includes our Courtyard,<br />
Fairfield Inn, SpringHill Suites, Residence Inn, TownePlace Suites, and<br />
Marriott ExecuStay brands.<br />
<strong>Annual</strong> Change<br />
($ in millions) <strong>2006</strong> 2005 2004 <strong>2006</strong>/2005 2005/2004<br />
Revenues $2,060 $1,886 $1,673 9% 13%<br />
Segment results $ 380 $ 303 $ 233 25% 30%
<strong>2006</strong> COMPARED TO 2005<br />
Across our North American Limited-Service Lodging segment,<br />
we added 91 properties (11,329 rooms) and 28 properties<br />
(3,647 rooms) left the system in <strong>2006</strong>. The properties that left the<br />
system were primarily associated with our Fairfield Inn brand.<br />
In <strong>2006</strong>, RevPAR for comparable company-operated North<br />
American limited-service properties increased 9.1 percent to<br />
$84.41. Occupancy for these properties decreased 0.8 percentage<br />
points to 73.3 percent, while average daily rates increased<br />
10.4 percent to $115.24.<br />
The $77 million increase in segment results for <strong>2006</strong> primarily<br />
reflects a $77 million increase in base management, incentive<br />
management and franchise fees, $27 million of lower general,<br />
administrative and other expenses and $6 million of increased<br />
equity results, partially offset by $14 million of lower owned,<br />
leased and other revenue net of direct expenses and $19 million<br />
of lower gains and other income. The increase in fees is largely<br />
due to higher RevPAR, driven by rate increases, which impacted<br />
property-level house profits and, to a lesser extent, to <strong>2006</strong> productivity<br />
improvements and the growth in the number of<br />
rooms. Stronger performance at our renovated Courtyard properties,<br />
versus nonrenovated properties, is also contributing to<br />
the increase in segment results over the prior year. The decrease<br />
in owned, leased and other revenue net of direct expenses<br />
reflects lower lease revenue as a result of our sale, late in 2005, of<br />
a portfolio of land underlying 75 Courtyard hotels, partially offset<br />
by improved owned and leased results in <strong>2006</strong> reflecting<br />
stronger demand. The decrease in general, administrative and<br />
other expenses of $27 million is attributable to the recognition<br />
of expenses in 2005 totaling $11 million associated with our<br />
bedding incentive program, a $6 million litigation charge and a<br />
$3 million guarantee charge. Improved equity results in <strong>2006</strong><br />
versus 2005 reflect the impact of a stronger demand environment<br />
in <strong>2006</strong>, new joint ventures and the impact of owning a<br />
50 percent interest in the Courtyard Joint Venture through the<br />
first quarter of 2005 versus owning a 21 percent interest thereafter.<br />
Gains and other income decreased $19 million in <strong>2006</strong> as a<br />
result of the 2005 sale of a portfolio of land that generated gains<br />
and other income of $17 million, a $10 million gain in 2005 associated<br />
with the repayment, before maturity, to us of the loan we<br />
made to the Courtyard Joint Venture, partially offset by higher<br />
other real estate and other gains of $4 million in <strong>2006</strong> and<br />
increased income of $4 million in <strong>2006</strong> associated with cost<br />
method joint ventures.<br />
2005 COMPARED TO 2004<br />
Across our North American Limited-Service Lodging segment,<br />
we added 94 properties (11,170 rooms) and 18 properties<br />
(2,309 rooms) left the system in 2005. The properties that left the<br />
system were primarily associated with our Fairfield Inn brand.<br />
In 2005, RevPAR for comparable company-operated North<br />
American limited-service properties increased 9.4 percent to<br />
$76.49. Occupancy for these properties increased 0.5 percentage<br />
points to 73.8 percent, while average daily rates increased 8.7 percent<br />
to $103.70.<br />
The increase in revenues for 2005 over the prior year reflects<br />
stronger RevPAR, driven by occupancy and rate increases and<br />
the growth in the number of rooms. The $70 million increase in<br />
segment results versus the prior year reflects a $57 million<br />
increase in base management, incentive management and franchise<br />
fees, $8 million of lower owned, leased and other revenue<br />
net of direct expenses, $3 million of higher gains and other<br />
income, an $11 million increase in equity results, and $7 million<br />
of lower general, administrative and other expenses. General,<br />
administrative and other expenses in 2005 included $11 million<br />
of expenses associated with our bedding incentive program. In<br />
2004 we wrote off deferred contract acquisition costs, impacting<br />
general, administrative and other expenses, totaling $13 million.<br />
The 2005 increase in gains and other income is primarily a result<br />
of the 2005 sale of a portfolio of land underlying 75 Courtyard<br />
hotels, which generated gains and other income of $17 million, a<br />
$10 million gain in 2005 associated with the repayment, before<br />
maturity, to us of the loan we made to the Courtyard Joint<br />
Venture and increased income of $4 million in 2005 associated<br />
with cost method joint ventures, partially offset by $27 million of<br />
gains in 2004 primarily associated with land sales. The decline in<br />
owned, leased, corporate housing and other revenue net of<br />
direct expenses is primarily attributable to our ExecuStay brand’s<br />
shift to franchising. Improved equity results primarily reflect the<br />
impact of owning a 50 percent interest in the Courtyard Joint<br />
Venture through the 2005 first quarter versus owning a 21 percent<br />
interest thereafter. Stronger performance at our reinvented<br />
Courtyard properties, versus non-reinvented properties, is also<br />
contributing to the increase in revenue and segment results<br />
from the prior year. For additional information related to the<br />
Courtyard Joint Venture, see the “Courtyard Joint Venture” caption<br />
in “Liquidity and Capital Resources” later in this report.<br />
International Lodging<br />
International Lodging includes our International Marriott Hotels &<br />
Resorts, International JW Marriott Hotels & Resorts, International<br />
Renaissance Hotels & Resorts, International Courtyard, International<br />
Fairfield Inn, International Residence Inn, Ramada International,<br />
and Marriott Executive Apartments brands.<br />
<strong>Annual</strong> Change<br />
($ in millions) <strong>2006</strong> 2005 2004 <strong>2006</strong>/2005 2005/2004<br />
Revenues $1,411 $1,017 $604 39% 68%<br />
Segment results $ 237 $ 133 $109 78% 22%<br />
<strong>2006</strong> COMPARED TO 2005<br />
Across our International Lodging segment, we added 22 properties<br />
(5,242 rooms) and 10 properties (3,136 rooms) left the system<br />
in <strong>2006</strong>.<br />
In <strong>2006</strong>, RevPAR for comparable company-operated international<br />
properties increased 11.1 percent to $114.61. Occupancy<br />
for these properties increased 1.2 percentage points to 74.4 percent,<br />
while average daily rates increased 9.4 percent to $153.99.<br />
Results for our international operations were strong across most<br />
regions. China, Mexico, Australia, Germany, France, the United<br />
Kingdom and certain Middle Eastern countries all had strong<br />
RevPAR increases.<br />
The $104 million increase in segment results for <strong>2006</strong> primarily<br />
reflects a $43 million increase in base management, incentive<br />
management and franchise fees, $37 million of lower<br />
general, administrative and other expenses, $29 million of<br />
increased owned, leased, corporate housing and other revenue<br />
net of expenses, and a $15 million increase in gains and other<br />
income, partially offset by $20 million of lower equity results.<br />
Incentive fees included $10 million and $4 million for <strong>2006</strong> and<br />
2005, respectively, that were calculated based on prior period<br />
MARRIOTT INTERNATIONAL, INC. <strong>2006</strong> | 25
earnings, but not earned and due until the periods they were<br />
recognized. The increase in fees is largely due to higher RevPAR,<br />
driven by rate increases, which impacted property-level house<br />
profits and, to a lesser extent, to productivity improvements and<br />
the growth in the number of rooms. Equity results decreased<br />
$20 million in <strong>2006</strong> versus 2005 and reflected the recognition in<br />
2005 of $14 million in equity earnings from a joint venture as a<br />
result of the venture’s sale of a hotel and $4 million of increased<br />
equity losses in <strong>2006</strong> associated with one joint venture’s hotel<br />
that was closed for renovation. The increase of $29 million in<br />
owned, leased and other revenue net of direct expenses reflects<br />
$19 million of improved results for owned and leased properties<br />
primarily due to the stronger demand environment and an<br />
increase of $12 million for termination fees for several properties.<br />
The $19 million improvement in owned and leased results<br />
also reflects the impact of a $5 million charge in <strong>2006</strong> for depreciation<br />
expense associated with one property that was reclassified<br />
from “held for sale” to “held and used” as it was not sold<br />
within one year of its classification as “held for sale,” as expected.<br />
The $15 million increase in gains and other income is primarily<br />
attributable to gains on the sale of various joint ventures<br />
throughout <strong>2006</strong>, partially offset by lower other income associated<br />
with one of the sold cost method joint venture investments.<br />
The decrease in general, administrative and other<br />
expenses of $37 million is attributable to the recognition of<br />
expenses in 2005 totaling $5 million associated with our bedding<br />
incentive program as well as a $34 million charge in 2005<br />
associated with the CTF transaction discussed more fully in the<br />
previous operating income disclosure. Also impacting general,<br />
administrative and other expenses, in 2005 we recorded<br />
expenses totaling $6 million associated with two guarantees,<br />
and <strong>2006</strong> reflected $7 million of increased expenses related to<br />
unit growth and development, systems improvements and<br />
increased ordinary costs such as wages and benefits.<br />
2005 COMPARED TO 2004<br />
Across our International Lodging segment, we added 18 properties<br />
(3,217 rooms) and three properties (696 rooms) left the system<br />
in 2005.<br />
In 2005, RevPAR for comparable company-operated international<br />
hotels increased 11.3 percent to $117.17. Occupancy for<br />
these hotels increased 1.6 percentage points to 73.6 percent,<br />
while average daily rates increased 8.9 percent to $159.30.<br />
Financial results for our international operations were strong<br />
across most regions. In 2005 we experienced strong demand<br />
particularly in China, Mexico, the Caribbean and Egypt. The<br />
European markets generally remained less robust.<br />
The increase in revenues for 2005 over the prior year reflects<br />
stronger RevPAR, driven by occupancy and rate increases and<br />
the growth in the number of rooms across our international<br />
brands. The $24 million increase in segment results versus the<br />
prior year reflects a $26 million increase in base management,<br />
incentive management and franchise fees, a $25 million increase<br />
in owned, leased and other revenue net of expenses, and a $15 million<br />
increase in equity results, partially offset by a $46 million<br />
increase in general, administrative and other expenses. Incentive<br />
fees for 2005 include the recognition of $4 million of incentive<br />
fees that were calculated based on prior period earnings but not<br />
earned and due until 2005. Owned, leased and other revenue<br />
net of expenses increased $25 million reflecting properties<br />
acquired in 2005 as well as the impact of the stronger demand<br />
environment in 2005. Gains and other income increased $5 million<br />
in 2005 versus the prior year primarily reflecting increased<br />
cost method joint venture income associated with one new<br />
26 | MARRIOTT INTERNATIONAL, INC. <strong>2006</strong><br />
investment. Equity results increased $15 million and primarily<br />
reflect a joint venture with significant asset sale activity in 2005<br />
that increased the profitability of the joint venture. In addition,<br />
equity results were impacted by the more favorable demand<br />
environment in 2005 versus the prior year as well as the mix of<br />
investments. General, administrative and other expenses<br />
increased $46 million in 2005 and included a $34 million pre-tax<br />
charge primarily due to the non-cash write-off of deferred contract<br />
acquisition costs associated with the termination of CTF<br />
Management Agreements and $5 million of higher expenses<br />
associated with our bedding incentive program. Furthermore, in<br />
2005 we also recorded charges totaling $6 million associated<br />
with two guarantees, which impacted general, administrative<br />
and other expenses.<br />
Luxury Lodging<br />
Luxury Lodging includes our The Ritz-Carlton and Bulgari Hotels &<br />
Resorts brands.<br />
<strong>Annual</strong> Change<br />
($ in millions) <strong>2006</strong> 2005 2004 <strong>2006</strong>/2005 2005/2004<br />
Revenues $1,423 $1,333 $1,263 7% 6%<br />
Segment results $ 63 $ 45 $ 35 40% 29%<br />
<strong>2006</strong> COMPARED TO 2005<br />
Across our Luxury Lodging segment, we added three properties<br />
(424 rooms) and one property (229 rooms) left the system in <strong>2006</strong>.<br />
In <strong>2006</strong>, RevPAR for comparable company-operated luxury<br />
properties increased 9.7 percent to $209.88. Occupancy for<br />
these properties increased 1.4 percentage points to 72.5 percent,<br />
while average daily rates increased 7.5 percent to $289.50.<br />
The $18 million increase in segment results for <strong>2006</strong> primarily<br />
reflects a $16 million increase in base management and incentive<br />
management fees, $7 million of lower general, administrative<br />
and other expenses and $1 million of higher owned, leased<br />
and other revenue net of direct expenses, partially offset by<br />
$5 million of lower gains and other income. The increase in fees<br />
is largely due to higher RevPAR, driven by rate increases, which<br />
impacted property-level house profits and, to a lesser extent, to<br />
productivity improvements and the growth in the number of<br />
rooms. The decrease in general, administrative and other<br />
expenses of $7 million is attributable to a 2005 performance termination<br />
cure payment of $12 million associated with one property,<br />
partially offset by a $5 million increase in expenses in <strong>2006</strong><br />
reflecting costs related to unit growth and development and<br />
an increase in ordinary costs such as wages and benefits. Gains<br />
and other income decreased $5 million in <strong>2006</strong> as a result of a<br />
$9 million gain in 2005 associated with the repayment before<br />
maturity of a note receivable associated with one property, partially<br />
offset by gains totaling $3 million associated with the <strong>2006</strong><br />
sale of a preferred interest in one property.<br />
2005 COMPARED TO 2004<br />
Across our Luxury Lodging segment, we added two properties<br />
(699 rooms) in 2005.<br />
In 2005, RevPAR for comparable company-operated luxury<br />
properties increased 18.3 percent to $143.30. Occupancy for<br />
these properties increased 3.4 percentage points to 71.6 percent,<br />
while average daily rates increased 12.7 percent to $200.08.<br />
The increase in revenues for 2005 over the prior year reflects<br />
stronger RevPAR, driven by occupancy and rate increases and<br />
the growth in the number of rooms. The $10 million increase<br />
in segment results versus the prior year reflects a $9 million
increase in base management and incentive management fees,<br />
a $2 million increase in owned, leased and other revenue net<br />
of direct expenses and $13 million of higher gains and other<br />
income, partially offset by $16 million of higher general, administrative<br />
and other expenses. General, administrative and other<br />
expenses in 2005 included a performance termination cure<br />
payment of $12 million associated with one property. The 2005<br />
increase in gains and other income versus 2004 is a result of a<br />
$9 million gain in 2005 associated with the repayment before<br />
maturity of a note receivable associated with one property and<br />
other real estate sale gains.<br />
Timeshare<br />
Timeshare includes our Marriott Vacation Club, The Ritz-Carlton<br />
Club, Grand Residences by Marriott and Horizons by Marriott<br />
Vacation Club brands.<br />
<strong>Annual</strong> Change<br />
($ in millions) <strong>2006</strong> 2005 2004 <strong>2006</strong>/2005 2005/2004<br />
Revenues $1,840 $1,721 $1,502 7% 15%<br />
Segment results $ 280 $ 271 $ 203 3% 33%<br />
<strong>2006</strong> COMPARED TO 2005<br />
Timeshare contract sales, including sales made by our timeshare<br />
joint venture projects, which represents sales of timeshare interval,<br />
fractional and whole ownership products before adjustment<br />
for percentage of completion accounting, increased 17 percent<br />
over 2005.<br />
Timeshare segment revenues of $1,840 million and $1,721 million,<br />
in <strong>2006</strong> and 2005, respectively, include interval, fractional,<br />
and whole ownership sales, base management fees, resort rental<br />
fees and cost reimbursements. Timeshare segment revenues<br />
also include $41 million and $38 million for <strong>2006</strong> and 2005,<br />
respectively, of interest income, recorded in our Consolidated<br />
Statement of Income on the “Timeshare sales and services” revenue<br />
line, associated with Timeshare segment notes receivable.<br />
The $119 million increase in Timeshare segment revenues<br />
reflects a $90 million increase in Timeshare sales and services<br />
revenue, a $27 million increase in cost reimbursements revenue<br />
and $2 million of increased base management fees. The $90 million<br />
increase in Timeshare sales and services revenue primarily<br />
reflects $77 million of revenue in <strong>2006</strong> from note securitization<br />
gains. As detailed earlier in the “Cumulative Effect of Change in<br />
Accounting Principle” narrative, note securitization gains of<br />
$69 million for 2005 are not reflected in revenue, but instead<br />
are a component of gains and other income.<br />
Segment results of $280 million in <strong>2006</strong> increased $9 million<br />
over 2005.The $9 million increase includes an increase of $98 million<br />
for Timeshare sales and services revenue net of direct<br />
expenses and a $2 million increase in base management fees, partially<br />
offset by a decline of $72 million in gains and other income,<br />
a $16 million increase in general and administrative expenses and<br />
$3 million of lower joint venture equity earnings.The increase in<br />
Timeshare sales and services revenue net of direct expenses of<br />
$98 million largely reflects $77 million of revenue in <strong>2006</strong> from<br />
note securitization gains. As noted earlier in the “Revenue” discussion,<br />
note securitization gains of $69 million for 2005 are not<br />
reflected in revenue, but instead are a component of gains and<br />
other income. Also reflected in the $98 million variance, development<br />
revenue net of expenses increased $14 million primarily<br />
reflecting lower development expenses in <strong>2006</strong> associated with<br />
projects in the early stages of development that did not reach revenue<br />
recognition thresholds and the timing of expenses associated<br />
with SOP 04-2, implemented in <strong>2006</strong>. Additionally the $98 million<br />
variance reflected a $15 million reversal of marketing related contingency<br />
reserves and $12 million of higher financing revenue net<br />
of expense, partially offset by $21 million of lower services revenue<br />
net of expenses.The $3 million decline in equity income primarily<br />
reflects start-up losses associated with several new joint<br />
ventures, partially offset by improved performance at other joint<br />
ventures.The $72 million decline in gains and other income primarily<br />
reflected $69 million of note securitization gains in 2005<br />
versus the recording of note securitization gains in revenue for<br />
<strong>2006</strong>, while the $16 million increase in general, administrative and<br />
other expenses reflected higher program and joint venture development<br />
expenses and customary increases in ordinary costs such<br />
as wages and benefits.<br />
2005 COMPARED TO 2004<br />
Timeshare segment revenues were $1,721 million and $1,502 million,<br />
in 2005 and 2004, respectively. Timeshare segment revenues<br />
include $38 million and $23 million for 2005 and 2004,<br />
respectively, of interest income, recorded in our Consolidated<br />
Statement of Income on the “Timeshare sales and services” revenue<br />
line, associated with Timeshare segment notes receivable.<br />
Timeshare contract sales were flat as compared to the prior year,<br />
reflecting limited available inventory at several projects in 2005<br />
that were approaching sell-out status versus higher contract<br />
sales at those projects in the prior year. The favorable segment<br />
results compared with 2004 reflect a $51 million increase in<br />
timeshare sales and services revenue net of direct expenses, primarily<br />
reflecting higher financially reportable development revenue<br />
under the percentage of completion accounting, a higher<br />
development margin, primarily resulting from the mix of units<br />
sold, and higher financing income reflecting a higher average<br />
notes receivable portfolio balance in 2005. In addition, compared<br />
with 2004, base fees increased $4 million, gains and other<br />
income increased $6 million, equity earnings increased $8 million,<br />
and general, administrative and other expenses increased<br />
$1 million. Improved equity results primarily reflect start-up<br />
losses in 2004 versus earnings in 2005 associated with one joint<br />
venture, and the increase in gains and other income is attributable<br />
to note sales that generated gains of $69 million in 2005<br />
compared to $64 million in 2004. In 2005 we also decided to<br />
cease development of one land parcel, and we recorded a $7 million<br />
charge in conjunction with the write-off of the previously<br />
capitalized costs that impacted our timeshare direct expenses.<br />
HISTORICAL INFORMATION<br />
The following graphs show the number of Timeshare segment<br />
owners and the Timeshare segment results for each of the last<br />
five fiscal years.<br />
223,000<br />
2002<br />
256,000<br />
2003<br />
282,600<br />
2004<br />
323,000<br />
2005<br />
349,000<br />
<strong>2006</strong><br />
TIMESHARE SEGMENT OWNERS<br />
$183<br />
2002<br />
$149<br />
2003<br />
$203<br />
2004<br />
$271<br />
2005<br />
$280<br />
<strong>2006</strong><br />
TIMESHARE SEGMENT RESULTS<br />
($ in millions)<br />
MARRIOTT INTERNATIONAL, INC. <strong>2006</strong> | 27
Synthetic Fuel<br />
See Footnote No. 2,“Synthetic Fuel,” and Footnote No. 18,<br />
“Contingencies,” in this report for additional information regarding<br />
the Synthetic Fuel segment.<br />
The tables that follow detail the impact of our Synthetic Fuel<br />
segment on our income from continuing operations for <strong>2006</strong>,<br />
2005 and 2004. Our management evaluates the figures presented<br />
in the “Before Syn. Fuel Impact” columns because management<br />
expects the Synthetic Fuel segment will no longer<br />
have a material impact on our business after the Internal<br />
Revenue Code synthetic fuel tax credit program expires at the<br />
end of 2007 and because the presentation reflects the results of<br />
our core Lodging operations. Management also believes that<br />
these presentations facilitate the comparison of our results with<br />
the results of other lodging companies. However, the figures presented<br />
in the “Before Syn. Fuel Impact” columns are non-GAAP<br />
financial measures, may be calculated and/or presented differently<br />
than presentations of other companies, and are not alternatives<br />
to operating income, total tax (provision) benefit, income<br />
from continuing operations, or any other operating measure<br />
prescribed by U.S. generally accepted accounting principles.<br />
28 | MARRIOTT INTERNATIONAL, INC. <strong>2006</strong><br />
<strong>2006</strong> COMPARED TO 2005<br />
For <strong>2006</strong>, the synthetic fuel operation generated revenue of<br />
$165 million versus revenue of $421 million for the prior year, primarily<br />
reflecting significantly lower production in <strong>2006</strong> as a result<br />
of production suspensions instituted in response to high oil<br />
prices. The $76 million operating loss for <strong>2006</strong> includes a $5 million<br />
charge reflecting the write-down of assets at the Alabama<br />
production facility as the adjacent mine was closed at year-end,<br />
and we did not anticipate operating the facility again at this location.<br />
Gains and other income (expense) reflects either net earnout<br />
payments received or net earn-out payments made. In <strong>2006</strong>,<br />
net earn-out payments made totaled $15 million, while in 2005<br />
net earn-out payments received totaled $32 million. Lower<br />
minority interest income primarily reflects the redemption, early<br />
in <strong>2006</strong>, of our partner’s interest in SAFE II. Additionally, lower<br />
minority interest income in <strong>2006</strong> also reflects our buy-out in the<br />
<strong>2006</strong> fourth quarter of our partner’s interest in SAFE I. Interest<br />
costs in <strong>2006</strong> of $4 million reflect the cost of hedges entered into<br />
during <strong>2006</strong> in response to high oil prices and the uncertainty<br />
surrounding the potential phase-out of tax credits. Income from<br />
continuing operations for the Synthetic Fuel segment declined<br />
from $125 million in 2005 to $5 million in <strong>2006</strong>, primarily as a<br />
result of both lower production in <strong>2006</strong> and the estimated 39<br />
percent phase-out of tax credits due to high oil prices in <strong>2006</strong>.<br />
The table below details the impact of our Synthetic Fuel segment on our continuing operations for <strong>2006</strong> and 2005.<br />
<strong>2006</strong> 2005<br />
Before Before<br />
As Syn. Fuel Syn. Fuel As Syn. Fuel Syn. Fuel<br />
($ in millions) <strong>Report</strong>ed Impact Impact <strong>Report</strong>ed Impact Impact<br />
Operating income (loss) $1,011 $(76) $1,087 $ 555 $(144) $ 699<br />
Gains and other income (expense) 59 (15) 74 181 32 149<br />
Interest income, provision for loan losses and interest expense (76) (4) (72) (55) — (55)<br />
Equity in earnings (losses) 3 — 3 36 — 36<br />
Income (loss) before income taxes and minority interest 997 (95) 1,092 717 (112) 829<br />
Tax (provision) benefit (348) 32 (380) (261) 23 (284)<br />
Tax credits 62 62 — 167 167 —<br />
Total tax (provision) benefit (286) 94 (380) (94) 190 (284)<br />
Income from continuing operations before minority interest 711 (1) 712 623 78 545<br />
Minority interest 6 6 — 45 47 (2)<br />
Income from continuing operations $ 717 $ 5 $ 712 $ 668 $ 125 $ 543<br />
2005 COMPARED TO 2004<br />
For 2005, the synthetic fuel operation generated revenue of<br />
$421 million versus revenue of $321 million for the prior year,<br />
primarily due to the consolidation of our synthetic fuel operations<br />
from the start of the 2004 second quarter, which resulted<br />
in the recognition of revenue for the entire 2005 year compared<br />
with only three quarters in 2004, as we accounted for the synthetic<br />
fuel operations using the equity method of accounting in<br />
the 2004 first quarter.<br />
The $18 million increase in synthetic fuel income from continuing<br />
operations to $125 million from $107 million in 2004<br />
is primarily due to our increased proportion of tax credits<br />
through May 31, 2005, associated with the SAFE II facilities<br />
that were then under IRS review and higher gains and other<br />
income, partially offset by our decreased proportion of tax<br />
credits through March 31, 2005, associated with the SAFE I<br />
facility that was not under IRS review. In addition, in 2005 production<br />
was slightly lower and raw materials prices were<br />
higher than in 2004. Gains and other income represents net<br />
earn-out payments received. Minority interest increased from a<br />
benefit of $40 million in 2004 to a benefit of $47 million in<br />
2005, primarily as a result of the change in the method of<br />
accounting for our synthetic fuel operations. For 2004, minority<br />
interest reflects our partner’s share of the synthetic fuel losses<br />
from March 26, 2004 (when we began consolidating the ventures<br />
due to the adoption of FIN 46(R)) through year-end. For<br />
2005, minority interest represents our partner’s share of the<br />
synthetic fuel losses for the entire year.
The table below details the impact of our Synthetic Fuel segment on our continuing operations for 2005 and 2004.<br />
2005 2004<br />
Before Before<br />
As Syn. Fuel Syn. Fuel As Syn. Fuel Syn. Fuel<br />
($ in millions) <strong>Report</strong>ed Impact Impact <strong>Report</strong>ed Impact Impact<br />
Operating income (loss) $ 555 $(144) $ 699 $ 477 $ (98) $ 575<br />
Gains and other income (expense) 181 32 149 164 28 136<br />
Interest income, provision for loan losses and interest expense (55) — (55) 55 — 55<br />
Equity in earnings (losses) 36 — 36 (42) (28) (14)<br />
Income (loss) before income taxes and minority interest 717 (112) 829 654 (98) 752<br />
Tax (provision) benefit (261) 23 (284) (244) 21 (265)<br />
Tax credits 167 167 — 144 144 —<br />
Total tax (provision) benefit (94) 190 (284) (100) 165 (265)<br />
Income from continuing operations before minority interest 623 78 545 554 67 487<br />
Minority interest 45 47 (2) 40 40 —<br />
Income from continuing operations $ 668 $ 125 $ 543 $ 594 $107 $ 487<br />
New Accounting Standards<br />
FAS No. 123 (revised 2004), “Share-Based Payment”<br />
Under our 2002 Comprehensive Stock and Cash Incentive Plan<br />
(“the Comprehensive Plan”), we currently award to participating<br />
employees (1) stock options to purchase our Class A Common<br />
Stock (“Stock Option Program”), (2) stock appreciation rights for<br />
our Class A Common Stock, and (3) restricted stock units of our<br />
Class A Common Stock.<br />
As noted in Footnote No. 1,“Basis of Presentation,” under the<br />
heading “New Accounting Pronouncements,” we adopted FAS<br />
No. 123(R),“Accounting for Stock-Based Compensation,” (“FAS<br />
No. 123(R)”) using the modified prospective transition method<br />
at the beginning of our <strong>2006</strong> first quarter. In accordance with<br />
the modified prospective transition method, we did not restate<br />
our Consolidated Financial Statements for prior periods to<br />
reflect the impact of FAS No. 123(R). For all share-based awards<br />
granted after the date we adopted FAS No. 123(R) and for the<br />
unvested portion of previously granted share-based awards<br />
that were outstanding on that date, FAS No. 123(R) requires that<br />
we measure compensation costs related to our share-based<br />
payment transactions at fair value on the grant date and that<br />
we recognize those costs in the financial statements over the<br />
vesting period during which the employee provides service in<br />
exchange for the award. Previously, under FAS No. 123 and APB<br />
Opinion No. 25, we accounted for our share-based employee<br />
compensation plans using the intrinsic value method under the<br />
recognition and measurement principles of “Accounting for<br />
Stock Issued to Employees,” (“APB Opinion No. 25”) and recognized<br />
share-based compensation expense for all awards except<br />
for our Stock Option Program awards. Share-based compensation<br />
expense totaled $62 million and $47 million for 2004 and<br />
2005, respectively.<br />
Under FAS No. 123(R), we recorded share-based compensation<br />
expense of $108 million in <strong>2006</strong>. Deferred compensation<br />
costs related to unvested awards totaled $168 million at yearend<br />
<strong>2006</strong>, and the weighted average period over which the<br />
costs are expected to be recognized is two years. Deferred compensation<br />
costs related to unvested awards totaled $137 million<br />
at year-end 2005.<br />
FAS No. 123(R) requires that share-based compensation<br />
expense be recognized over the period from the grant date to<br />
the date on which the award is no longer contingent on the<br />
employee providing additional service (the “substantive vesting<br />
period”). In periods prior to the adoption of FAS No. 123(R), we<br />
showed share-based compensation expense in our pro forma<br />
disclosure only for option awards to retirement-eligible employees<br />
over the awards’ stated vesting period. In periods prior to the<br />
adoption of FAS No. 123(R), we recorded share-based compensation<br />
expense for our other awards to retirement-eligible employees<br />
over the awards’ stated vesting period. With the adoption of<br />
FAS No. 123(R), we continue to follow the stated vesting period<br />
for the unvested portion of awards granted prior to adoption of<br />
FAS No. 123(R) and follow the substantive vesting period for<br />
awards granted after the adoption of FAS No. 123(R).<br />
In connection with the adoption of FAS No. 123(R), we<br />
reviewed, among other things, our forfeiture and volatility<br />
assumptions. Estimated volatilities for <strong>2006</strong> were based on the<br />
historical share-price volatility for a period equal to the stock<br />
option’s or share appreciation right’s expected lives, ending on<br />
the day of grant, and calculated based on weekly data. The<br />
weighted average expected stock option or share appreciation<br />
right terms for <strong>2006</strong> were a product of the lattice-based binomial<br />
valuation model that uses suboptimal exercise factors to<br />
calculate the expected terms. In August 2005, the Board of<br />
Directors amended the Comprehensive Plan to provide participants<br />
the ability, during a limited time frame in 2005, to elect to<br />
accelerate the schedule for distribution of certain vested<br />
deferred shares. The amendment did not alter the previously<br />
established vesting schedule. In 2005, we also changed from<br />
using the Black-Scholes option pricing method to estimate the<br />
fair value of each stock option or share appreciation right on the<br />
grant date, to using the binomial valuation method to improve<br />
the estimate of fair value.<br />
In 2005, we changed the method in which we issue sharebased<br />
awards to our key employees. In prior years, share-based<br />
compensation for key employees consisted primarily of stock<br />
options. Upon consideration of several factors, we began in 2005<br />
to award key employees a combination of stock options and<br />
restricted stock units. Therefore, this change resulted in an<br />
increase in restricted stock expense.<br />
The adoption of FAS No. 123(R) in <strong>2006</strong> resulted in the recognition<br />
of incremental share-based compensation costs in <strong>2006</strong> of<br />
$39 million, a reduction in net income of $25 million (net of tax<br />
benefits of $14 million) and a reduction of both basic and diluted<br />
MARRIOTT INTERNATIONAL, INC. <strong>2006</strong> | 29
earnings per share of $0.06. In accordance with FAS No. 123(R),<br />
we present the tax benefits resulting from the exercise of sharebased<br />
awards as financing cash flows. Prior to the adoption of FAS<br />
No. 123(R), we reported the tax benefits resulting from the exercise<br />
of share-based awards as operating cash flows.The adoption<br />
of FAS No. 123(R) resulted in a decrease in <strong>2006</strong> of $193 million in<br />
cash flows from operating activities and an increase of $193 million<br />
in cash flows from financing activities related to excess tax<br />
benefits from share-based awards.The aggregate amount of cash<br />
we received from the exercise of stock options granted under<br />
share-based payment arrangements was $184 million, $125 million,<br />
and $206 million for <strong>2006</strong>, 2005 and 2004, respectively.<br />
Under the provisions of FAS No. 123(R), the “Deferred compensation”<br />
line on our Consolidated Balance Sheet, a contraequity<br />
line representing the amount of unrecognized<br />
share-based compensation costs, is no longer presented.<br />
Accordingly, the amount that had been on the “Deferred compensation”<br />
line at year-end 2005 was reversed in the <strong>2006</strong> first<br />
quarter through the “Additional paid-in-capital” line on our<br />
Consolidated Balance Sheet.<br />
Statement of Position 04-2, “Accounting for Real Estate Time-<br />
Sharing Transactions”<br />
See the “Cumulative Effect of Change in Accounting Principle”<br />
section earlier in this report for information regarding the adoption<br />
in <strong>2006</strong> of SOP 04-2.<br />
Future Adoption of Accounting Standards<br />
FASB Interpretation No. 48, “Accounting for Uncertainty in<br />
Income Taxes”<br />
In July <strong>2006</strong>, the FASB issued FASB Interpretation No. 48,<br />
“Accounting for Uncertainty in Income Taxes” (“FIN 48”). FIN 48<br />
is an interpretation of FASB Statement No. 109,“Accounting for<br />
Income Taxes,” and it seeks to reduce the diversity in practice<br />
associated with certain aspects of measurement and recognition<br />
in accounting for income taxes. FIN 48 prescribes a recognition<br />
threshold and measurement attribute for the financial statement<br />
recognition and measurement of a tax position taken or expected<br />
to be taken in a tax return. Additionally, FIN 48 provides guidance<br />
on de-recognition, classification, interest and penalties,<br />
accounting in interim periods, disclosure and transition. FIN 48<br />
is effective for fiscal years beginning after December 15, <strong>2006</strong>,<br />
which is our 2007 fiscal year, and its provisions are to be applied<br />
to all tax positions upon initial adoption. Upon adoption of<br />
FIN 48, only tax positions that meet a “more likely than not”<br />
threshold at the effective date may be recognized or continue<br />
to be recognized. The cumulative effect of applying FIN 48, if<br />
any, is to be reported as an adjustment to the opening balance<br />
of retained earnings in the year of adoption. We are evaluating<br />
the impact that FIN 48 will have on our financial statements.<br />
FAS No. 156, “Accounting for Servicing of Financial Assets”<br />
In March <strong>2006</strong>, the FASB issued FAS No. 156,“Accounting for<br />
Servicing of Financial Assets” (“FAS No. 156”). FAS No. 156<br />
requires that all separately recognized servicing assets and<br />
liabilities are to be initially measured at fair value. It also allows<br />
entities to subsequently elect fair value measurement for its<br />
servicing assets and liabilities. This standard is effective for the<br />
first fiscal year beginning after September 15, <strong>2006</strong>, which is our<br />
2007 fiscal year. We have determined that FAS No. 156 will not<br />
have a material impact on our financial statements.<br />
FAS No. 157, “Fair Value Measurements”<br />
In September <strong>2006</strong>, the FASB issued FAS No. 157,“Fair Value<br />
Measurements” (“FAS No. 157”). This standard defines fair value,<br />
30 | MARRIOTT INTERNATIONAL, INC. <strong>2006</strong><br />
establishes a methodology for measuring fair value and expands<br />
the required disclosure for fair value measurements. FAS No. 157<br />
is effective for fiscal years beginning after November 15, 2007,<br />
which is our 2008 fiscal year. Provisions of FAS No. 157 are<br />
required to be applied prospectively as of the beginning of the<br />
first fiscal year in which FAS No. 157 is applied. We are evaluating<br />
the impact that FAS No. 157 will have on our financial statements.<br />
EITF Issue No. 06-8, “Applicability of the Assessment of a<br />
Buyer’s Continuing Investment under FASB Statement No. 66<br />
for Sales of Condominiums”<br />
In November <strong>2006</strong>, the Emerging Issues Task Force of the FASB<br />
(“EITF”) reached a consensus on EITF Issue No. 06-8,“Applicability<br />
of the Assessment of a Buyer’s Continuing Investment<br />
under FASB Statement No. 66, Accounting for Sales of Real<br />
Estate, for Sales of Condominiums” (“EITF 06-8”). EITF 06-8 will<br />
require condominium sales to meet the continuing investment<br />
criterion in FAS No. 66 in order for profit to be recognized under<br />
the percentage-of-completion method. EITF 06-8 will be effective<br />
for annual reporting periods beginning after March 15,<br />
2007, which is our 2008 fiscal year. The cumulative effect of<br />
applying EITF 06-8, if any, is to be reported as an adjustment to<br />
the opening balance of retained earnings in the year of adoption.<br />
We are evaluating the impact that EITF 06-8 will have on<br />
our financial statements.<br />
Investment in Leveraged Lease<br />
At year-end <strong>2006</strong>, we had a $23 million investment in an aircraft<br />
leveraged lease with Delta Air Lines, Inc. (“Delta”), which we<br />
acquired in 1994.The gross investment is comprised of rentals<br />
receivable and the residual value of the aircraft offset by unearned<br />
income. On September 14, 2005, Delta filed for bankruptcy protection<br />
under Chapter 11 of the U.S. Bankruptcy Code and informed<br />
us that it wished to restructure the lease. As a result, we believe<br />
our investment was impaired, and have recorded pre-tax charges<br />
of approximately $18 million through <strong>2006</strong>.<br />
Expected Land Sale<br />
In 1988, the Company, as landlord, entered into a 59-year ground<br />
lease with a lessee for land that was improved with a hotel that<br />
is owned by the lessee. The hotel was previously branded a<br />
Marriott property; however, currently it is not. The lease contains<br />
contractual rental increases over the term of the lease, and<br />
annual ground rent on the land currently totals approximately<br />
$5 million. The lease also contains a provision that permits the<br />
lessee, under certain circumstances, to purchase the land for a<br />
fixed price. The Company and the lessee have had various discussions<br />
concerning the land as well as the hotel. During the<br />
<strong>2006</strong> second quarter, it became probable that none of the proposed<br />
transactions were acceptable to both parties, and the lessee<br />
indicated its intent to exercise its option to purchase the<br />
land. Accordingly, in the <strong>2006</strong> second quarter, we reclassified the<br />
land from the “Property and equipment” caption in our<br />
Consolidated Balance Sheet to the “Assets held for sale” caption<br />
and recorded a $37 million non-cash charge to adjust the carrying<br />
amount to net realizable value. Additional amounts may be<br />
due us depending on the lessee’s use of the land subsequent to<br />
purchase; however, such amounts will only be recorded if and<br />
when paid.<br />
Effective Tax Rate<br />
Tax credits contributed by our synthetic fuel operations have<br />
significantly reduced our effective tax rate during the last several<br />
years. Because that program ends with 2007 synthetic fuel
production, our synthetic fuel production facilities will not be<br />
able to generate credits in future years. As a result, our future<br />
effective tax rate is likely to increase significantly, thereby<br />
reducing our after-tax profits.<br />
DISCONTINUED OPERATIONS<br />
Distribution Services<br />
In 2005 and 2004, we had income, net of tax of $1 million and<br />
$2 million, respectively, associated with the distribution services<br />
business that we exited in 2002.<br />
LIQUIDITY AND CAPITAL RESOURCES<br />
Cash Requirements and Our Credit Facilities<br />
We are party to a $2.0 billion multicurrency revolving credit agreement<br />
that supports our commercial paper program and letters of<br />
credit. Effective June 6, <strong>2006</strong>, we executed an amendment extending<br />
the maturity date for $1.955 billion of commitments under<br />
this agreement by one year to June 6, 2011.The remaining $45 million<br />
commitment still matures on June 6, 2010. Borrowings under<br />
this facility bear interest at the London Interbank Offered Rate<br />
plus a spread based on our public debt rating. Additionally, we<br />
pay annual fees on the facility at a rate also based on our public<br />
debt rating. We do not anticipate that fluctuations in the availability<br />
of the commercial paper market will affect our liquidity<br />
because of the flexibility provided by our credit facility. We classify<br />
commercial paper as long-term debt based on our ability and<br />
intent to refinance it on a long-term basis.<br />
At year-end <strong>2006</strong> our available borrowing capacity amounted<br />
to $1.770 billion and reflected borrowing capacity at $2.0 billion<br />
under the credit facility plus our cash balance of $193 million<br />
less the letters of credit outstanding under the facility of $108 million<br />
and $315 million of outstanding commercial paper supported<br />
by the facility. We consider these resources, together with<br />
cash we expect to generate from operations, adequate to meet<br />
our short-term and long-term liquidity requirements, finance our<br />
long-term growth plans, meet debt service and fulfill other cash<br />
requirements. We periodically evaluate opportunities to sell<br />
additional debt or equity securities, obtain credit facilities from<br />
lenders or repurchase, refinance, or otherwise restructure our<br />
long-term debt for strategic reasons or to further strengthen our<br />
financial position.<br />
We issue short-term commercial paper in Europe and in the<br />
United States. Our commercial paper issuances are subject to<br />
the availability of the commercial paper in each of these markets,<br />
as we have no commitments from buyers to purchase our<br />
commercial paper. We reserve unused capacity under our credit<br />
facility to repay outstanding commercial paper borrowings in<br />
the event that the commercial paper market is not available to<br />
us for any reason when outstanding borrowings mature.<br />
We monitor the status of the capital markets and regularly<br />
evaluate the effect that changes in capital market conditions<br />
may have on our ability to execute our announced growth plans.<br />
We expect that part of our financing and liquidity needs will<br />
continue to be met through commercial paper borrowings and<br />
access to long-term committed credit facilities. If conditions in<br />
the lodging industry deteriorate, or if disruptions in the commercial<br />
paper market take place as they did in the immediate<br />
aftermath of September 11, 2001, we may be unable to place<br />
some or all of our commercial paper on a temporary or<br />
extended basis, and may have to rely more on borrowings under<br />
the credit facility, which may carry a higher cost than commercial<br />
paper.<br />
Cash from Operations<br />
Cash from operations, depreciation expense and amortization<br />
expense for the last three fiscal years are as follows:<br />
($ in millions) <strong>2006</strong> 2005 2004<br />
Cash from operations $970 $837 $891<br />
Depreciation expense 155 156 133<br />
Amortization expense 33 28 33<br />
We have reclassified certain prior year amounts to conform to<br />
our <strong>2006</strong> presentation. The reclassifications were primarily associated<br />
with Timeshare segment inventory that is now a component<br />
of “Current assets” in our Consolidated Balance Sheet and<br />
was previously a component of “Property and equipment.”<br />
Our ratio of current assets to current liabilities was roughly<br />
0.8 to one at year-end <strong>2006</strong> and 0.6 to one at year-end 2005.We<br />
minimize working capital through cash management, strict creditgranting<br />
policies, aggressive collection efforts and high inventory<br />
turnover.We also have significant borrowing capacity under our<br />
revolving credit facility should we need additional working capital.<br />
Our ratios of earnings to fixed charges for the last five fiscal<br />
years, the calculations of which are detailed in Exhibit 12 to our<br />
<strong>Annual</strong> <strong>Report</strong> on Form 10-K, are as follows:<br />
<strong>2006</strong> 2005<br />
Fiscal Years<br />
2004 2003 2002<br />
4.9x 4.3x 4.7x 3.6x 3.2x<br />
While our Timeshare segment generates strong operating cash<br />
flow, year-to-year cash flow varies based on the timing of both<br />
cash outlays for the acquisition and development of new resorts<br />
and cash received from purchaser financing. We include timeshare<br />
reportable sales we finance in cash from operations when we collect<br />
cash payments or the notes are sold for cash.The following<br />
table shows the net operating activity from our Timeshare segment<br />
(which does not include the portion of income from continuing<br />
operations from our Timeshare segment):<br />
($ in millions) <strong>2006</strong> 2005 2004<br />
Timeshare segment development,<br />
less the cost of sales<br />
New Timeshare segment mortgages,<br />
$ (83) $ 40 $ 93<br />
net of collections (537) (441) (459)<br />
Loan repurchases (55) (23) (18)<br />
Note sale gains (77) (69) (64)<br />
Note sale proceeds<br />
Financially reportable sales less than<br />
508 399 312<br />
(in excess of ) closed sales<br />
Collection on retained interests<br />
61 (57) 129<br />
in notes sold and servicing fees 96 90 94<br />
Other cash (outflows) inflows<br />
Net cash (outflows) inflows from<br />
(17) 26 2<br />
Timeshare segment activity $(104) $ (35) $ 89<br />
Our ability to sell Timeshare segment notes depends on the<br />
continued ability of the capital markets to provide financing to<br />
the special purpose entities that buy the notes. We might have<br />
increased difficulty or be unable to consummate such sales if<br />
the underlying quality of the notes receivable we originate were<br />
to deteriorate, although we do not expect such deterioration.<br />
Loans to Timeshare segment owners, including a current portion<br />
MARRIOTT INTERNATIONAL, INC. <strong>2006</strong> | 31
of $70 million, totaled $386 million at year-end <strong>2006</strong>. Loans to<br />
Timeshare segment owners, including a current portion of<br />
$33 million, totaled $344 million at year-end 2005.<br />
Investing Activities Cash Flows<br />
Capital Expenditures and Other Investments. Capital expenditures<br />
of $529 million in <strong>2006</strong>, $780 million in 2005 and $181 million in<br />
2004 included expenditures related to the development and construction<br />
of new hotels and acquisitions of hotel properties, as well<br />
as improvements to existing properties and systems initiatives.<br />
Timeshare segment development expenditures, which are<br />
included in “Cash from Operations,” as noted in that section’s narrative,<br />
are not reflected in these numbers. Over time, we have sold<br />
lodging properties under development, subject to long-term management<br />
agreements.The ability of third-party purchasers to raise<br />
the necessary debt and equity capital depends in part on the perceived<br />
risks inherent in the lodging industry and other constraints<br />
inherent in the capital markets as a whole. Although we expect to<br />
continue to consummate such real estate sales, if we were unable<br />
to do so, our liquidity could decrease and we could have increased<br />
exposure to the operating risks of owning real estate.We monitor<br />
the status of the capital markets and regularly evaluate the potential<br />
impact on our business operations of changes in capital market<br />
conditions.We also expect to continue to make other investments<br />
in connection with adding units to our lodging business.These<br />
investments include loans and minority equity investments.<br />
Fluctuations in the values of hotel real estate generally have<br />
little impact on the overall results of our Lodging segments<br />
because: (1) we own less than 1 percent of the total number of<br />
hotels that we operate or franchise; (2) management and franchise<br />
fees are generally based upon hotel revenues and profits<br />
rather than current hotel property values; and (3) our management<br />
agreements generally do not terminate upon hotel sale.<br />
Dispositions. Property and asset sales generated cash proceeds<br />
of $798 million in <strong>2006</strong>, $298 million in 2005 and $402 million<br />
in 2004. In <strong>2006</strong> we closed on the sales of 11 hotels and<br />
seven joint venture investments. Cash proceeds of $26 million<br />
for one of the hotels sold in <strong>2006</strong> are not reflected in the $798 million<br />
as the proceeds were initially recorded as a deposit because<br />
of a contingency and impacted the other investing activities<br />
section of our Consolidated Statement of Cash Flows rather than<br />
dispositions. The contingency was subsequently resolved and<br />
sale accounting was achieved in <strong>2006</strong>.<br />
The sold properties included eight properties purchased in<br />
2005 from CTF Holdings Ltd. (and certain of its affiliates (collectively<br />
“CTF”)). For additional information regarding the CTF transaction,<br />
see Footnote No. 8,“Acquisitions and Dispositions,” later<br />
in this report.<br />
Loan Activity. We have made loans to owners of hotels that<br />
we operate or franchise, typically to facilitate the development<br />
of a new hotel. Based on historical experience, over time we<br />
expect these owners to repay the loans in accordance with the<br />
loan agreements, or earlier as the hotels mature and capital markets<br />
permit. Loan collections and sales, net of advances during<br />
<strong>2006</strong>, amounted to $62 million. Lodging senior loans outstanding<br />
totaled $9 million (which included a current portion of $1 million)<br />
at year-end <strong>2006</strong> and $59 million (which included a current<br />
portion of $2 million) at year-end 2005. Lodging mezzanine and<br />
other loans totaled $268 million (which included a current portion<br />
of $32 million) at year-end <strong>2006</strong> and $274 million (which<br />
included a current portion of $13 million) at year-end 2005. In<br />
<strong>2006</strong> our notes receivable balance associated with Lodging senior<br />
loans and Lodging mezzanine and other loans, declined by<br />
$56 million and primarily reflects the repayment of several loans.<br />
32 | MARRIOTT INTERNATIONAL, INC. <strong>2006</strong><br />
Equity and Cost Method Investments. Cash outflows of $95 million<br />
in <strong>2006</strong> associated with equity and cost method investments<br />
primarily reflects our investments in three joint ventures.<br />
Cash outflows of $216 million in 2005 associated with equity<br />
and cost method investments primarily reflects our establishment<br />
in 2005 of a 50/50 joint venture with Whitbread.<br />
Cash from Financing Activities<br />
Debt. Debt increased $96 million in <strong>2006</strong>, from $1,737 million to<br />
$1,833 million at year-end <strong>2006</strong>, due to the issuance of $349 million<br />
(book value) of Series H Senior Notes (described more fully<br />
below), partially offset by a net reduction in commercial paper<br />
outstanding of $184 million, and other debt decreases of $69 million.<br />
Debt increased $412 million in 2005, from $1,325 million to<br />
$1,737 million at year-end 2005, due to the issuance of $348 million<br />
(book value) of Series F Notes, net commercial paper<br />
issuances of $499 million, and other debt increases of $69 million,<br />
partially offset by repayment upon maturity of $200 million for<br />
the Series B Notes, repayment upon maturity of $275 million<br />
for the Series D Notes and the $29 million (book value) debt<br />
decrease associated with the Series C and Series E Senior Note<br />
exchanges for Series G Senior Notes as described in Footnote<br />
No. 12,“Long-term Debt,” in our 2005 <strong>Annual</strong> <strong>Report</strong> on Form 10-K.<br />
In the <strong>2006</strong> second quarter, we sold $350 million aggregate<br />
principal amount of 6.200 percent Series H Notes due in 2016 (the<br />
“Notes”). We received net proceeds of approximately $347 million<br />
from this offering, after deducting a discount, underwriting fees,<br />
and other expenses, and we used these proceeds to repay commercial<br />
paper borrowings and for general corporate purposes.<br />
Interest on the Notes is paid on June 15 and December 15<br />
of each year, with the first interest payment occurring on<br />
December 15, <strong>2006</strong>. The Notes will mature on June 15, 2016, and<br />
are redeemable, in whole or in part, at any time and from time to<br />
time under the terms provided in the Form of Note. The Notes<br />
were issued under an indenture with JPMorgan Chase Bank, N.A.<br />
(formerly known as the Chase Manhattan Bank), as trustee, dated<br />
November 16, 1998.<br />
Our financial objectives include diversifying our financing<br />
sources, optimizing the mix and maturity of our long-term<br />
debt and reducing our working capital. At year-end <strong>2006</strong>, our<br />
long-term debt had an average interest rate of 5.9 percent and<br />
an average maturity of approximately 6.9 years. The ratio of<br />
fixed-rate long-term debt to total long-term debt was 0.7 to<br />
one at year-end 2005. At the end of <strong>2006</strong>, we had long-term<br />
public debt ratings of BBB+ from Standard and Poor’s and Baa2<br />
from Moody’s.<br />
Share Repurchases. We purchased 41.5 million shares of our<br />
Class A Common Stock in <strong>2006</strong> at an average price of $38.13 per<br />
share, 51.4 million shares of our Class A Common Stock in 2005<br />
at an average price of $32.12 per<br />
share, and 28.0 million shares of<br />
our Class A Common Stock in 2004<br />
at an average price of $23.33 per<br />
share. We purchase shares in the<br />
open market and in privately<br />
negotiated transactions. As of<br />
year-end <strong>2006</strong>, 34.2 million shares<br />
remained available for repurchase<br />
under authorizations from our<br />
Board of Directors.<br />
The adjacent graph shows our<br />
diluted weighted average shares<br />
count for each of the last five fiscal<br />
years.<br />
509.3<br />
2002<br />
490.8<br />
2003<br />
480.9<br />
2004<br />
462.3<br />
2005<br />
DILUTED SHARES<br />
(in millions)<br />
430.2<br />
<strong>2006</strong>
Dividends. In April <strong>2006</strong>, our Board of Directors increased the<br />
quarterly cash dividend by 19 percent to $0.0625 per share.<br />
Contractual Obligations and Off Balance Sheet<br />
Arrangements<br />
The following table summarizes our contractual obligations as of<br />
year-end <strong>2006</strong>:<br />
Payments Due by Period<br />
Less<br />
Than 1–3 3–5 After<br />
Contractual Obligations Total 1 Year Years Years 5 Years<br />
($ in millions)<br />
Debt (1) $2,524 $108 $371 $187 $1,858<br />
Capital lease obligations (1) 99 9 80 2 8<br />
Operating leases where we<br />
are the primary obligor:<br />
Recourse 1,021 122 233 205 461<br />
Non-recourse 460 21 35 32 372<br />
Operating leases where we<br />
are secondarily liable 388 35 71 68 214<br />
Other long-term liabilities 65 — 23 1 41<br />
Total contractual obligations $4,557 $295 $813 $495 $2,954<br />
(1) Includes principal as well as interest payments.<br />
The following table summarizes our commitments as of yearend<br />
<strong>2006</strong>:<br />
Amount of Commitment<br />
Expiration Per Period<br />
Other Total Less<br />
Commercial Amounts Than 1–3 3–5 After<br />
Commitments Committed 1 Year Years Years 5 Years<br />
($ in millions)<br />
Total guarantees where we<br />
are the primary obligor<br />
Total guarantees where we<br />
$268 $19 $ 66 $ 16 $167<br />
are secondarily liable<br />
Total other commercial<br />
501 61 108 137 195<br />
commitments $769 $80 $174 $153 $362<br />
Our guarantees where we are the primary obligor listed<br />
above include $43 million for guarantees that will not be in effect<br />
until the underlying hotels are open and we begin to manage<br />
the properties. Our guarantee fundings to lenders and hotel<br />
owners are generally recoverable as loans repayable to us out of<br />
future hotel cash flows and/or proceeds from the sale of hotels.<br />
The guarantees where we are secondarily liable above include<br />
$283 million related to Senior Living Services lease obligations<br />
and lifecare bonds for which we are secondarily liable. Sunrise<br />
Senior Living, Inc. (“Sunrise”) is the primary obligor of the leases<br />
and a portion of the lifecare bonds, and CNL Retirement<br />
Properties, Inc. (“CNL”) is the primary obligor of the remainder of<br />
the lifecare bonds. Prior to the sale of the Senior Living Services<br />
business at the end of the first quarter of 2003, these preexisting<br />
guarantees were guarantees by the Company of obligations of<br />
consolidated Senior Living Services subsidiaries. Sunrise and CNL<br />
have indemnified us for any guarantee fundings we may be<br />
called on to make in connection with these lease obligations and<br />
lifecare bonds. We do not expect to fund under these guarantees.<br />
The guarantees where we are secondarily liable above also<br />
include lease obligations for which we became secondarily liable<br />
when we acquired the Renaissance Hotel Group N.V. in 1997,<br />
consisting of annual rent payments of approximately $22 million<br />
and total remaining rent payments through the initial term of<br />
approximately $218 million. We are also secondarily obligated for<br />
real estate taxes and other charges associated with the leases.<br />
Third parties have severally indemnified us for all payments we<br />
may be required to make in connection with these obligations.<br />
Since we assumed these guarantees, we have not funded any<br />
amounts, and we do not expect to fund any amounts under<br />
these guarantees in the future. CTF has made available €35 million<br />
in cash collateral in the event that we are required to fund<br />
under such guarantees. As CTF obtains releases from the landlords<br />
and these hotels exit the system, our contingent liability<br />
exposure of approximately $218 million will decline.<br />
In addition to the guarantees described above, in conjunction<br />
with financing obtained for specific projects or properties owned by<br />
joint ventures in which we are a party, from time to time we provide<br />
industry standard indemnifications to the lender for loss, liability or<br />
damage occurring as a result of the actions of the joint venture<br />
owner or our own actions.We have also provided a project completion<br />
guarantee to a lender for a project with an estimated aggregate<br />
total cost of $524 million. Payments for cost overruns for this project<br />
will be satisfied by the joint venture via contributions from the partners,<br />
and we are liable on a several basis with our partners in an<br />
amount equal to our pro rata ownership in the joint venture, which<br />
is 34 percent. We do not expect to fund under this guarantee.<br />
In addition to the guarantees noted previously, as of year-end<br />
<strong>2006</strong>, we had extended approximately $11 million of loan commitments<br />
to owners of lodging properties, under which we expect to<br />
fund $5 million by year-end 2007.We do not expect to fund the<br />
remaining $6 million of commitments, which expire as follows: $1 million<br />
within one year; $1 million in three to four years; and $4 million<br />
after five years. At year-end <strong>2006</strong>, we also have commitments to<br />
invest $31 million of equity for minority interests in partnerships<br />
that plan to purchase both North American full-service and limited-service<br />
hotels, which expire as follows: $5 million within one<br />
year; $21 million in one to two years; and $5 million after five years.<br />
At year-end <strong>2006</strong> we also had $108 million of letters of credit<br />
outstanding on our behalf, the majority of which related to our<br />
self-insurance programs. Surety bonds issued on our behalf as of<br />
year-end <strong>2006</strong> totaled $640 million, the majority of which were<br />
requested by federal, state or local governments in relation to our<br />
timeshare and lodging operations and self-insurance programs.<br />
As part of the normal course of the hotel management business,<br />
we enter into purchase commitments to manage the daily<br />
operating needs of hotels we manage for owners. Since we are<br />
reimbursed from the cash flows of the hotels, these obligations<br />
have minimal impact on our net income and cash flow.<br />
Audit of Employee Stock Ownership Plan Transaction<br />
The Internal Revenue Service (“IRS”) is currently auditing the<br />
Company’s federal tax returns for the 2000, 2001 and 2002 fiscal<br />
years. As part of that audit, the IRS is reviewing a leveraged<br />
employee stock ownership plan (“ESOP”) feature of the Company’s<br />
Employees’ Profit Sharing, Retirement and Savings Plan and Trust<br />
(the “Plan”) that was implemented in a transaction (the “ESOP<br />
Transaction”) on June 13, 2000. Principal and interest on the debt<br />
related to the transaction was forgiven over a 26-month period<br />
as a mechanism for funding Company contributions of elective<br />
deferrals and matching contributions to the Plan. The Company<br />
claimed federal income tax deductions for the forgiven principal<br />
on the debt in the amount of $1 billion over that period, along<br />
with forgiven interest on the debt. The benefit related to the tax<br />
deductions was reflected in equity and did not flow through the<br />
provision for income taxes.<br />
MARRIOTT INTERNATIONAL, INC. <strong>2006</strong> | 33
Based on discussions with the IRS during the course of the<br />
audit, the IRS may seek to disallow some or all of the deductions<br />
related to the ESOP Transaction, and may seek to impose other<br />
taxes, penalties, and interest, including excise taxes for prohibited<br />
transactions under Section 4975 of the Internal Revenue<br />
Code of 1986, as amended. In a January 19, 2007 letter to the<br />
Company, the U.S. Department of Labor confirmed that it is<br />
reviewing the ESOP Transaction. The Company has retained<br />
counsel to assist with the audit process and to respond to any<br />
claims or assessments the IRS or Department of Labor issues.<br />
Although we are early in the process of closing this audit, we do<br />
not expect the result of the audit to have a material impact on<br />
either equity for any lost deductions or earnings for interest or<br />
penalties, if any, related to the ESOP Transaction.<br />
RELATED PARTY TRANSACTIONS<br />
Equity Method Investments<br />
We have equity method investments in entities that own properties<br />
for which we provide management and/or franchise services<br />
and receive fees. In addition, in some cases we provide<br />
loans, preferred equity or guarantees to these entities.<br />
The following tables present financial data resulting from<br />
transactions with these related parties:<br />
Income Statement Data<br />
($ in millions) <strong>2006</strong> 2005 2004<br />
Base management fees $ 62 $ 83 $ 72<br />
Incentive management fees 22 14 8<br />
Cost reimbursements 649 936 802<br />
Owned, leased, corporate housing and<br />
other revenue 3 22 29<br />
Total revenue $ 736 $1,055 $ 911<br />
General, administrative and other $ (1) $ (19) $ (33)<br />
Reimbursed costs (649) (936) (802)<br />
Gains and other income 28 54 19<br />
Interest income 4 31 74<br />
Reversal of provision for loan losses 1 — 3<br />
Equity in losses-Synthetic fuel — — (28)<br />
Equity in earnings (losses)-Other 3 36 (14)<br />
Balance Sheet Data<br />
($ in millions) <strong>2006</strong> 2005<br />
Current assets-accounts and<br />
notes receivable $ 76 $ 47<br />
Contract acquisition costs 34 26<br />
Cost method investments 45 166<br />
Equity method investments 332 349<br />
Loans to equity method investees 27 36<br />
Long-term deferred tax asset, net 4 19<br />
Current liabilities:<br />
Accounts payable — (2)<br />
Other payables and accruals (2) (43)<br />
Other long-term liabilities (13) (19)<br />
JWM Family Enterprises, L.P.<br />
JWM Family Enterprises, L.P. (“Family Enterprises”) is a Delaware<br />
limited partnership which is beneficially owned and controlled<br />
by members of the family of J.W. Marriott, Jr., the Company’s<br />
34 | MARRIOTT INTERNATIONAL, INC. <strong>2006</strong><br />
Chairman and Chief Executive Officer, including John W. Marriott<br />
III, the Company’s Vice-Chairman, who is Chief Executive Officer<br />
of Family Enterprises, and J.W. Marriott, Jr. himself. In July <strong>2006</strong>,<br />
the Company sold the Dallas, Texas, Renaissance Hotels &<br />
Resorts brand hotel to Family Enterprises for a sale price of<br />
approximately $38 million and recognized a gain of $1 million<br />
on the sale. The Company originally acquired the hotel from a<br />
third party in June 2005. The sale to Family Enterprises resulted<br />
from a competitive auction process involving other unrelated<br />
bidders in which Family Enterprises submitted the most competitive<br />
bid.<br />
CRITICAL ACCOUNTING ESTIMATES<br />
The preparation of financial statements in accordance with<br />
U.S. generally accepted accounting principles (GAAP) requires<br />
management to make estimates and assumptions that affect<br />
reported amounts and related disclosures. Management considers<br />
an accounting estimate to be critical if:<br />
3 it requires assumptions to be made that were uncertain at<br />
the time the estimate was made; and<br />
3 changes in the estimate, or different estimates that could<br />
have been selected, could have a material effect on our<br />
consolidated results of operations or financial condition.<br />
Management has discussed the development and selection<br />
of its critical accounting estimates with the Audit Committee of<br />
the Board of Directors, and the Audit Committee has reviewed<br />
the disclosure presented below relating to them.<br />
Marriott Rewards<br />
Marriott Rewards is our frequent guest loyalty program. Marriott<br />
Rewards members earn points based on their monetary spending<br />
at our lodging operations, purchases of timeshare interval,<br />
fractional and whole ownership products and, to a lesser degree,<br />
through participation in affiliated partners’ programs, such as<br />
those offered by car rental and credit card companies. Points,<br />
which we track on members’ behalf, can be redeemed for stays<br />
at most of our lodging operations, airline tickets, airline frequent<br />
flyer program miles, rental cars and a variety of other awards;<br />
however, points cannot be redeemed for cash. We provide<br />
Marriott Rewards as a marketing program to participating properties.<br />
We charge the cost of operating the program, including<br />
the estimated cost of award redemption, to properties based on<br />
members’ qualifying expenditures.<br />
We defer revenue received from managed, franchised and<br />
Marriott-owned/leased hotels and program partners equal to<br />
the fair value of our future redemption obligation. We determine<br />
the fair value of the future redemption obligation based on statistical<br />
formulas that project timing of future point redemption<br />
based on historical levels, including an estimate of the “breakage”<br />
for points that will never be redeemed, and an estimate of<br />
the points that will eventually be redeemed. These judgmental<br />
factors determine the required liability for outstanding points.<br />
Our management and franchise agreements require that we<br />
be reimbursed currently for the costs of operating the program,<br />
including marketing, promotion, communication with, and<br />
performing member services for the Marriott Rewards members.<br />
Due to the requirement that properties reimburse us for program<br />
operating costs as incurred, we receive and recognize the<br />
balance of the revenue from properties in connection with the<br />
Marriott Rewards program at the time such costs are incurred<br />
and expensed. We recognize the component of revenue from<br />
program partners that corresponds to program maintenance<br />
services over the expected life of the points awarded. Upon the<br />
redemption of points, we recognize as revenue the amounts
previously deferred and recognize the corresponding expense<br />
relating to the costs of the awards redeemed.<br />
Valuation of Goodwill<br />
We evaluate the fair value of goodwill to assess potential impairments<br />
on an annual basis, or during the year if an event or other<br />
circumstance indicates that we may not be able to recover the<br />
carrying amount of the asset. We evaluate the fair value of goodwill<br />
at the reporting unit level and make that determination<br />
based upon future cash flow projections that assume certain<br />
growth projections which may or may not occur. We record an<br />
impairment loss for goodwill when the carrying value of the<br />
intangible asset is less than its estimated fair value.<br />
Loan Loss Reserves<br />
Lodging Senior Loans and Lodging Mezzanine and Other Loans<br />
We measure loan impairment based on the present value of<br />
expected future cash flows discounted at the loan’s original effective<br />
interest rate or the estimated fair value of the collateral. For<br />
impaired loans, we establish a specific impairment reserve for the<br />
difference between the recorded investment in the loan and the<br />
present value of the expected future cash flows, that assumes certain<br />
growth projections which may or may not occur, or the estimated<br />
fair value of the collateral. We apply our loan impairment<br />
policy individually to all loans in the portfolio and do not aggregate<br />
loans for the purpose of applying such policy. Where we<br />
determine that a loan is impaired, we recognize interest income<br />
on a cash basis. At year-end <strong>2006</strong>, our recorded investment in<br />
impaired loans was $92 million. We had a $70 million allowance<br />
for credit losses, leaving $22 million of our investment in impaired<br />
loans for which there was no related allowance for credit losses.<br />
At year-end 2005, our recorded investment in impaired loans was<br />
$184 million. We had a $103 million allowance for credit losses,<br />
leaving $81 million of our investment in impaired loans for which<br />
there was no related allowance for credit losses. During <strong>2006</strong> and<br />
2005, our average investment in impaired loans totaled $138 million<br />
and $182 million, respectively.<br />
Loans to Timeshare Owners<br />
In conjunction with the adoption of SOP 04-2, we now record an<br />
estimate of expected uncollectibility on notes receivable that we<br />
receive from timeshare purchasers as a reduction of revenue at<br />
the time we recognize profit on a timeshare sale. We assess<br />
uncollectibility based on pools of receivables, because we hold<br />
large numbers of homogenous timeshare notes receivable. We<br />
estimate uncollectibles based on historical uncollectibles for<br />
similar timeshare notes receivable over the past six years. We<br />
use a technique referred to as static pool analysis, which tracks<br />
uncollectibles for each year’s sales over the life of those notes.<br />
At year-end <strong>2006</strong>, our allowance for credit losses associated with<br />
“Loans to timeshare owners” totaled $29 million.<br />
Legal Contingencies<br />
We are subject to various legal proceedings and claims, the outcomes<br />
of which are subject to significant uncertainty. We record<br />
an accrual for loss contingencies when a loss is probable and<br />
the amount of the loss can be reasonably estimated. We review<br />
these accruals each reporting period and make revisions based<br />
on changes in facts and circumstances.<br />
Income Taxes<br />
We record the current year amounts payable or refundable, as well<br />
as the consequences of events that give rise to deferred tax assets<br />
and liabilities based on differences in how those events are treated<br />
for tax purposes.We base our estimate of deferred tax assets and<br />
liabilities on current tax laws and rates and, in certain cases,<br />
business plans and other expectations about future outcomes.<br />
Changes in existing laws and rates, and their related interpretations,<br />
and future business results may affect the amount of<br />
deferred tax liabilities or the valuation of deferred tax assets<br />
over time. Our accounting for deferred tax consequences represents<br />
management’s best estimate of future events that can be<br />
appropriately reflected in the accounting estimates.<br />
OTHER MATTERS<br />
Inflation<br />
Inflation has been moderate in recent years and has not had a<br />
significant impact on our businesses.<br />
QUANTITATIVE AND QUALITATIVE DISCLOSURES<br />
ABOUT MARKET RISK.<br />
We are exposed to market risk from changes in interest rates,<br />
foreign exchange rates, and debt and equity prices, and for our<br />
synthetic fuel business, oil prices. We manage our exposure to<br />
these risks by monitoring available financing alternatives,<br />
through development and application of credit granting policies<br />
and by entering into derivative arrangements. We do not foresee<br />
any significant changes in either our exposure to fluctuations in<br />
interest rates or foreign exchange rates or how such exposure is<br />
managed in the future.<br />
We are exposed to interest rate risk on our floating-rate notes<br />
receivable, our residual interests retained in connection with the<br />
sale of Timeshare segment notes receivable and the fair value of<br />
our fixed-rate notes receivable.<br />
Changes in interest rates also impact our floating-rate longterm<br />
debt and the fair value of our fixed-rate long-term debt.<br />
We are also subject to risk from changes in debt and equity<br />
prices from our investments in debt securities and common<br />
stock, which have a carrying value of $107 million at year-end<br />
<strong>2006</strong> and are accounted for as available-for-sale securities under<br />
FAS No. 115,“Accounting for Certain Investments in Debt and<br />
Equity Securities.”<br />
We use derivative instruments as part of our overall strategy<br />
to manage our exposure to market risks associated with fluctuations<br />
in interest rates and foreign currency exchange rates. As a<br />
matter of policy, we do not use derivatives for trading or speculative<br />
purposes.<br />
At year-end <strong>2006</strong> we were party to the following derivative<br />
instruments:<br />
3 An interest rate swap agreement under which we receive<br />
a floating rate of interest and pay a fixed rate of interest.<br />
The swap modifies our interest rate exposure by effectively<br />
converting a note receivable with a fixed rate to a<br />
floating rate. The aggregate notional amount of the swap<br />
was $92 million and it matures in 2010.<br />
3 Four outstanding interest rate swap agreements to manage<br />
interest rate risk associated with the residual interests<br />
we retain in conjunction with our timeshare note sales.<br />
Historically, we were required by purchasers and/or rating<br />
agencies to utilize interest rate swaps to protect the<br />
excess spread within our sold note pools. The aggregate<br />
notional amount of the swaps was $209 million, and they<br />
expire through 2022.<br />
3 Option contracts to hedge the potential volatility of<br />
earnings and cash flows associated with variations in<br />
foreign exchange rates during 2007. The aggregate dollar<br />
equivalent of the notional amounts of the contracts was<br />
approximately $47 million, and they expire throughout 2007.<br />
MARRIOTT INTERNATIONAL, INC. <strong>2006</strong> | 35
3 Forward foreign exchange contracts to manage the foreign<br />
currency exposure related to certain monetary<br />
assets. The aggregate dollar equivalent of the notional<br />
amounts of the forward contracts was $217 million and<br />
they expire throughout 2007.<br />
3 Oil price hedges to manage the volatility associated with<br />
oil prices and the uncertainty surrounding the potential<br />
The following table sets forth the scheduled maturities and the total fair value of our derivatives and other financial instruments as<br />
of year-end <strong>2006</strong>:<br />
Maturities by Period<br />
Total Total<br />
Carrying Fair<br />
($ in millions) 2007 2008 2009 2010 2011 Thereafter Amount Value<br />
Assets—Maturities represent expected principal receipts,<br />
fair values represent assets.<br />
Timeshare segment notes receivable $ 70 $ 40 $ 35 $ 30 $ 30 $ 181 $ 386 $ 386<br />
Average interest rate 12.35%<br />
Fixed-rate notes receivable $ 13 $ 6 $ 2 $ 83 $ 3 $ 26 $ 133 $ 136<br />
Average interest rate 10.94%<br />
Floating-rate notes receivable $ 20 $ 19 $ 3 $ 7 $ 36 $ 59 $ 144 $ 145<br />
Average interest rate 7.99%<br />
Residual interests $ 84 $ 50 $ 33 $ 21 $ 13 $ 20 $ 221 $ 221<br />
Average interest rate 9.22%<br />
Liabilities—Maturities represent expected principal<br />
payments, fair values represent liabilities.<br />
Fixed-rate debt $ (11) $(103) $(89) $(13) $(14) $(1,243) $(1,473) $(1,504)<br />
Average interest rate 6.07%<br />
Floating-rate debt $ (1) $ — $ — $ — $ — $ (315) $ (316) $ (316)<br />
Average interest rate<br />
NOTE: We classify commercial paper as long-term debt<br />
based on our ability and intent to refinance it on a<br />
long-term basis.<br />
4.80%<br />
Derivatives—Maturities represent notional amounts,<br />
fair values represent assets (liabilities).<br />
Interest Rate Swaps:<br />
Fixed to variable $ — $ — $ — $ 93 $ — $ 161 $ 8 $ 8<br />
Average pay rate 3.90%<br />
Average receive rate 5.29%<br />
Variable to fixed $ — $ — $ — $ — $ — $ 47 $ (2) $ (2)<br />
Average pay rate 5.88%<br />
Average receive rate<br />
Forward Foreign Exchange Contracts:<br />
4.01%<br />
Fixed (EUR) to Fixed (USD) $162 $ — $ — $ — $ — $ — $ — $ —<br />
Average exchange rate 1.32<br />
Fixed (GBP) to Fixed (USD) $ 75 $ — $ — $ — $ — $ — $ — $ —<br />
Average exchange rate 1.96<br />
Fixed (HKD) to Fixed (USD) $ 49 $ — $ — $ — $ — $ — $ — $ —<br />
Average Exchange Rate 0.13<br />
Fixed (MXN) to Fixed (USD) $ 7 $ — $ — $ — $ — $ — $ — $ —<br />
Average Exchange Rate 0.09<br />
Fixed (AUD) to Fixed (USD) $ 3 $ — $ — $ — $ — $ — $ — $ —<br />
Average Exchange Rate 0.79<br />
Fixed (CAD) to Fixed (USD) $ 11 $ — $ — $ — $ — $ — $ — $ —<br />
Average Exchange Rate 0.86<br />
Oil Price Hedges:<br />
Contract Amount<br />
(Weighted Average Price per Gallon is $1.37)<br />
(Contract volume is 5 million barrels)<br />
$ 7 $ — $ — $ — $ — $ — $ 5 $ 5<br />
36 | MARRIOTT INTERNATIONAL, INC. <strong>2006</strong><br />
phase-out of tax credits in 2007. The hedges cover 5 million<br />
barrels of oil and expire on December 31, 2007.<br />
3 Forward foreign exchange contracts to manage currency<br />
exchange rate volatility associated with certain investments<br />
in foreign operations. The contracts had a dollar<br />
notional equivalent of $43 million and they expire<br />
throughout 2007.
Consolidated Statement of Income<br />
Fiscal Years <strong>2006</strong>, 2005 and 2004 <strong>2006</strong> 2005 2004<br />
($ in millions, except per share amounts)<br />
REVENUES<br />
Base management fees (1) $ 553 $ 497 $ 435<br />
Franchise fees 390 329 296<br />
Incentive management fees (1) 281 201 142<br />
Owned, leased, corporate housing and other revenue (1) 1,119 944 730<br />
Timeshare sales and services 1,577 1,487 1,247<br />
Cost reimbursements (1) 8,075 7,671 6,928<br />
Synthetic fuel 165 421 321<br />
12,160 11,550 10,099<br />
OPERATING COSTS AND EXPENSES<br />
Owned, leased and corporate housing-direct 936 778 629<br />
Timeshare-direct 1,220 1,228 1,039<br />
Reimbursed costs (1) 8,075 7,671 6,928<br />
General, administrative and other (1) 677 753 607<br />
Synthetic fuel 241 565 419<br />
11,149 10,995 9,622<br />
OPERATING INCOME 1,011 555 477<br />
Gains and other income (1) 59 181 164<br />
Interest expense (124) (106) (99)<br />
Interest income (1) 45 79 146<br />
Reversal of provision for (provision for) loan losses (1) 3 (28) 8<br />
Equity in (losses) earnings<br />
—Synthetic fuel (1) — — (28)<br />
—Other (1) 3 36 (14)<br />
INCOME FROM CONTINUING OPERATIONS BEFORE INCOME TAXES AND MINORITY INTEREST 997 717 654<br />
Provision for income taxes (286) (94) (100)<br />
Minority interest 6 45 40<br />
INCOME FROM CONTINUING OPERATIONS 717 668 594<br />
Cumulative effect of change in accounting principle, net of tax (109) — —<br />
Discontinued operations, net of tax — 1 2<br />
NET INCOME $ 608 $ 669 $ 596<br />
EARNINGS PER SHARE-Basic<br />
Earnings from continuing operations $ 1.77 $ 1.55 $ 1.31<br />
Losses from cumulative effect of accounting change (0.27) — —<br />
Earnings from discontinued operations — — —<br />
Earnings per share $ 1.50 $ 1.55 $ 1.31<br />
EARNINGS PER SHARE-Diluted<br />
Earnings from continuing operations $ 1.66 $ 1.45 $ 1.24<br />
Losses from cumulative effect of accounting change (0.25) — —<br />
Earnings from discontinued operations — — —<br />
Earnings per share $ 1.41 $ 1.45 $ 1.24<br />
DIVIDENDS DECLARED PER SHARE $0.2400 $0.2000 $0.1650<br />
(1) See Footnote No. 22,“Related Party Transactions,” of the Notes to Consolidated Financial Statements for disclosure of related party amounts.<br />
See Notes to Consolidated Financial Statements<br />
MARRIOTT INTERNATIONAL, INC. <strong>2006</strong> | 37
Consolidated Balance Sheet<br />
Fiscal Year-End <strong>2006</strong> and 2005 <strong>2006</strong> 2005<br />
($ in millions)<br />
ASSETS<br />
Current assets<br />
Cash and equivalents $ 193 $ 203<br />
Accounts and notes receivable (1) 1,117 1,001<br />
Inventory 1,208 1,164<br />
Current deferred taxes, net 200 220<br />
Assets held for sale 411 555<br />
Other 185 247<br />
3,314 3,390<br />
Property and equipment<br />
Intangible assets<br />
1,238 1,134<br />
Goodwill 921 924<br />
Contract acquisition costs (1) 575 466<br />
1,496 1,390<br />
Cost method investments (1) 70 233<br />
Equity method investments (1) Notes receivable<br />
332 349<br />
Loans to equity method investees (1) 27 36<br />
Loans to timeshare owners 316 311<br />
Other notes receivable 217 282<br />
560 629<br />
Other long-term receivables 178 175<br />
Deferred taxes, net (1) 665 545<br />
Other (1) 735 685<br />
$ 8,588 $ 8,530<br />
LIABILITIES AND SHAREHOLDERS’ EQUITY<br />
Current liabilities<br />
Current portion of long-term debt $ 15 $ 56<br />
Accounts payable (1) 658 520<br />
Accrued payroll and benefits 615 559<br />
Liability for guest loyalty program 384 317<br />
Liabilities of assets held for sale 102 30<br />
Timeshare segment deferred revenue 178 141<br />
Other payables and accruals (1) 570 510<br />
2,522 2,133<br />
Long-term debt 1,818 1,681<br />
Liability for guest loyalty program 847 768<br />
Self-insurance reserves 184 180<br />
Other long-term liabilities (1) Shareholders’ equity<br />
599 516<br />
Class A Common Stock 5 5<br />
Additional paid-in-capital 3,617 3,562<br />
Retained earnings 2,860 2,500<br />
Treasury stock, at cost (3,908) (2,667)<br />
Deferred compensation — (137)<br />
Accumulated other comprehensive income (loss) 44 (11)<br />
(1) See Footnote No. 22,“Related Party Transactions,” of the Notes to Consolidated Financial Statements for disclosure of related party amounts.<br />
See Notes to Consolidated Financial Statements<br />
38 | MARRIOTT INTERNATIONAL, INC. <strong>2006</strong><br />
2,618 3,252<br />
$ 8,588 $ 8,530
Consolidated Statement of Cash Flows<br />
Fiscal Years <strong>2006</strong>, 2005 and 2004 <strong>2006</strong> 2005 2004<br />
($ in millions)<br />
OPERATING ACTIVITIES<br />
Net income<br />
Adjustments to reconcile to cash provided by operating activities:<br />
$ 608 $ 669 $ 596<br />
Depreciation and amortization 188 184 166<br />
Minority interest (7) (44) (40)<br />
Income taxes (76) (86) (63)<br />
Timeshare activity, net (104) (35) 89<br />
Liability for guest loyalty program 113 125 136<br />
Cumulative effect of change in accounting principle 109 — —<br />
Other<br />
Working capital changes:<br />
106 151 (83)<br />
Accounts receivable (10) (128) (6)<br />
Other current assets (9) (22) (16)<br />
Accounts payable and accruals 52 23 112<br />
Net cash provided by operating activities 970 837 891<br />
INVESTING ACTIVITIES<br />
Capital expenditures (529) (780) (181)<br />
Dispositions 798 298 402<br />
Loan advances (59) (56) (129)<br />
Loan collections and sales 121 706 276<br />
Equity and cost method investments (95) (216) (45)<br />
Purchase of available-for-sale securities (27) (15) (30)<br />
Other (90) (67) (6)<br />
Net cash provided by (used in) investing activities 119 (130) 287<br />
FINANCING ACTIVITIES<br />
Commercial paper, net (188) 499 —<br />
Issuance of long-term debt 352 356 20<br />
Repayment of long-term debt (17) (523) (99)<br />
Redemption of convertible debt — — (62)<br />
Debt exchange consideration, net — (29) —<br />
Issuance of Class A Common Stock 378 125 206<br />
Dividends paid (93) (84) (73)<br />
Purchase of treasury stock (1,546) (1,644) (664)<br />
Earn-outs received, net 15 26 35<br />
Net cash used in financing activities (1,099) (1,274) (637)<br />
(DECREASE) INCREASE IN CASH AND EQUIVALENTS (10) (567) 541<br />
CASH AND EQUIVALENTS, beginning of year 203 770 229<br />
CASH AND EQUIVALENTS, end of year $ 193 $ 203 $ 770<br />
See Notes to Consolidated Financial Statements<br />
MARRIOTT INTERNATIONAL, INC. <strong>2006</strong> | 39
Consolidated Statement of Comprehensive Income<br />
Fiscal Years <strong>2006</strong>, 2005 and 2004 <strong>2006</strong> 2005 2004<br />
($ in millions)<br />
Net income $608 $669 $596<br />
Other comprehensive income (loss), net of tax:<br />
Net foreign currency translation adjustments 28 (25) 43<br />
Net (loss) gain on derivative instruments designated as cash flow hedges — (2) 7<br />
Net unrealized gain associated with available-for-sale securities 27 7 —<br />
Total other comprehensive income (loss) 55 (20) 50<br />
Comprehensive income $663 $649 $646<br />
See Notes to Consolidated Financial Statements<br />
Consolidated Statement of Shareholders’ Equity<br />
Fiscal Years 2005, 2004, and 2003<br />
(in millions, except per share amounts) Accumulated<br />
Common Class A Additional Treasury Other<br />
Shares Common Paid-in Deferred Retained Stock, at Comprehensive<br />
Outstanding Stock Capital Compensation Earnings Cost (Loss) Income<br />
462.4 Balance at fiscal year-end 2003 $5 $3,315 $ (81) $1,505 $ (865) $(41)<br />
— Net income — — — 596 — —<br />
— Dividends ($0.1650 per share) — — — (75) — —<br />
17.2 Employee stock plan issuance and other — 106 (27) (75) 322 50<br />
(28.0) Purchase of treasury stock — — — — (654) —<br />
451.6 Balance at fiscal year-end 2004 5 3,421 (108) 1,951 (1,197) 9<br />
— Net income — — — 669 — —<br />
— Dividends ($0.2000 per share) — — — (87) — —<br />
11.6 Employee stock plan issuance and other — 141 (29) (33) 180 (20)<br />
(51.4) Purchase of treasury stock — — — — (1,650) —<br />
411.8 Balance at fiscal year-end 2005 5 3,562 (137) 2,500 (2,667) (11)<br />
— Net income — — — 608 — —<br />
— Dividends ($0.2400 per share) — — — (96) — —<br />
— Impact of adoption of SFAS No. 123(R) — (137) 137 — — —<br />
19.2 Employee stock plan issuance and other — 192 — (152) 343 55<br />
(41.5) Purchase of treasury stock — — — — (1,584) —<br />
389.5 Balance at fiscal year-end <strong>2006</strong> $5 $3,617 $ — $2,860 $(3,908) $ 44<br />
See Notes to Consolidated Financial Statements<br />
40 | MARRIOTT INTERNATIONAL, INC. <strong>2006</strong>
Notes to Consolidated Financial Statements<br />
1 | SUMMARY OF SIGNIFICANT ACCOUNTING POLICIES<br />
Basis of Presentation<br />
The consolidated financial statements present the results of operations,<br />
financial position and cash flows of Marriott International,<br />
Inc. (together with its subsidiaries,“we,”“us” or the “Company”).<br />
The preparation of financial statements in conformity with<br />
U.S. generally accepted accounting principles requires management<br />
to make estimates and assumptions that affect the<br />
reported amounts of assets and liabilities as of the date of the<br />
financial statements, the reported amounts of revenues and<br />
expenses during the reporting periods and the disclosures of<br />
contingent liabilities. Accordingly, ultimate results could differ<br />
from those estimates.<br />
We have reclassified certain prior year amounts to conform to<br />
our <strong>2006</strong> presentation.The reclassifications were primarily associated<br />
with Timeshare segment inventory which is now a component<br />
of “Current assets” in our Consolidated Balance Sheet and was<br />
previously a component of “Property and equipment.” As noted in<br />
the “New Accounting Standards” caption later in this footnote, at<br />
the beginning of our <strong>2006</strong> fiscal year, we adopted Statement of<br />
Position 04-2,“Accounting for Real Estate Time-Sharing<br />
Transactions,” (“SOP 04-2”) as issued by the American Institute of<br />
Certified Public Accountants.The American Resort Development<br />
Association, a timeshare trade association of which we are a member<br />
and the Staff of the Securities and Exchange Commission<br />
(“SEC”) had communications regarding SOP 04-2 and the income<br />
statement presentation of timeshare note securitization gains. As a<br />
result of those communications, we reclassified in our <strong>2006</strong> third<br />
quarter, in our Consolidated Statement of Income,Timeshare segment<br />
note securitization gains of $40 million recognized in the<br />
<strong>2006</strong> second quarter from the “Gains and other income” caption to<br />
the “Timeshare sales and services” revenue caption. As a result of<br />
the change,“Timeshare sales and services” revenue of $331 million<br />
as reported in the <strong>2006</strong> second quarter, now totals $371 million,<br />
and “Gains and other income” of $48 million as reported in the<br />
<strong>2006</strong> second quarter, now totals $8 million. Including $37 million of<br />
Timeshare segment note securitization gains recognized in the<br />
<strong>2006</strong> fourth quarter, full year for <strong>2006</strong> note securitization gains<br />
totaling $77 million are reflected within our “Timeshare sales and<br />
services” revenue caption. Gains from the sale of timeshare notes<br />
receivable totaling $69 million and $64 million for 2005 and 2004,<br />
respectively, are classified within the “Gains and other income” caption<br />
in our Consolidated Statement of Income.<br />
On June 9, <strong>2006</strong>, we completed a two-for-one stock split that<br />
was effected in the form of a stock dividend. As a result of the<br />
stock split, each shareholder of record at the close of business<br />
on May 18, <strong>2006</strong>, received one additional share of Class A<br />
Common Stock on June 9, <strong>2006</strong>, for each share held on May 18,<br />
<strong>2006</strong>. For periods prior to the stock split, all share and per share<br />
data in the <strong>Annual</strong> <strong>Report</strong> on Form 10-K have been retroactively<br />
adjusted to reflect the stock split.<br />
In our opinion, the accompanying consolidated financial<br />
statements reflect all normal and recurring adjustments necessary<br />
to present fairly our financial position at fiscal year-end<br />
<strong>2006</strong> and fiscal year-end 2005 and the results of our operations<br />
and cash flows for fiscal years <strong>2006</strong>, 2005 and 2004. We have<br />
eliminated all material intercompany transactions and balances<br />
between entities consolidated in these financial statements.<br />
Fiscal Year<br />
Our fiscal year ends on the Friday nearest to December 31.<br />
Unless otherwise specified, each reference to “<strong>2006</strong>” means our<br />
fiscal year ended December 29, <strong>2006</strong>, each reference to “2005”<br />
means our fiscal year ended December 30, 2005, each reference<br />
to “2004” means our fiscal year ended December 31, 2004, and<br />
each reference to “2003” means our fiscal year ended January 2,<br />
2004, and not, in each case, the corresponding calendar year. All<br />
fiscal years presented include 52 weeks.<br />
Revenue Recognition<br />
Our revenues include: (1) base and incentive management fees;<br />
(2) franchise fees; (3) revenues from lodging properties and<br />
other businesses owned or leased by us; (4) timeshare interval,<br />
fractional and whole ownership sales and services, which also<br />
includes resort rental revenue, interest income associated with<br />
our “Loans to timeshare owners,” and for <strong>2006</strong>, Timeshare segment<br />
note securitization gains, as noted in the “Basis of Presentation”<br />
caption earlier; (5) cost reimbursements; and (6) sales<br />
made by the synthetic fuel operation. Management fees comprise<br />
a base fee, which is a percentage of the revenues of hotels,<br />
and an incentive fee, which is generally based on hotel profitability.<br />
Franchise fees comprise initial application fees and continuing<br />
royalties generated from our franchise programs, which<br />
permit the hotel owners and operators to use certain of our<br />
brand names. Cost reimbursements include direct and indirect<br />
costs that are reimbursed to us by lodging properties that we<br />
manage or franchise.<br />
Base and Incentive Management Fees: We recognize base fees<br />
as revenue when earned in accordance with the contract. In<br />
interim periods and at year-end, we recognize incentive fees that<br />
would be due as if the contract were to terminate at that date,<br />
exclusive of any termination fees payable or receivable by us.<br />
Franchise Fee Revenue: We recognize franchise fees as revenue<br />
in each accounting period as fees are earned from the franchisee.<br />
Owned and Leased Units: We recognize room sales and revenues<br />
from other guest services for our owned and leased units<br />
when rooms are occupied and services have been rendered.<br />
Timeshare and Fractional Intervals and Condominiums: We<br />
recognize sales when: (1) we have received a minimum of 10 percent<br />
of the purchase price for the timeshare interval; (2) the purchaser’s<br />
period to cancel for a refund has expired; (3) we deem<br />
the receivables to be collectible; and (4) we have attained certain<br />
minimum sales and construction levels. We defer all revenue<br />
using the deposit method for sales that do not meet all four of<br />
these criteria. For sales that do not qualify for full revenue recognition<br />
as the project has progressed beyond the preliminary<br />
stages but has not yet reached completion, all revenue and<br />
profit are deferred and recognized in earnings using the percentage<br />
of completion method.<br />
Timeshare Whole Ownership (Stand-Alone Structures): We recognize<br />
sales under the full accrual method of accounting when<br />
we receive our proceeds and transfer title at settlement.<br />
Cost Reimbursements: We recognize cost reimbursements<br />
from managed, franchised and timeshare properties when we<br />
incur the related reimbursable costs.<br />
Synthetic Fuel: We recognize revenue from the synthetic fuel<br />
operation when the synthetic fuel is produced and sold. In 2004,<br />
MARRIOTT INTERNATIONAL, INC. <strong>2006</strong> | 41
prior to March 26, we accounted for the synthetic fuel operation<br />
using the equity method of accounting. After March 25, 2004, we<br />
accounted for the synthetic fuel operation by consolidating the<br />
joint ventures. In <strong>2006</strong>, we acquired the ownership interests of<br />
the synthetic fuel operations of our partners, and accordingly we<br />
own 100 percent of the operations. See Footnote No. 2,<br />
“Synthetic Fuel,” for additional information.<br />
Other Revenue includes land rental income and other revenue.<br />
Ground Leases<br />
We are both the lessor and lessee of land under long-term operating<br />
leases, which include scheduled increases in minimum<br />
rents. We recognize these scheduled rent increases on a straightline<br />
basis over the initial lease term.<br />
Real Estate Sales<br />
We account for the sales of real estate in accordance with<br />
Financial Accounting Standards (“FAS”) No. 66,“Accounting for<br />
Sales of Real Estate” (“FAS No. 66”). We reduce gains on sales of<br />
real estate by the maximum exposure to loss if we have continuing<br />
involvement with the property and do not transfer substantially<br />
all of the risks and rewards of ownership. We reduced gains<br />
on sales of real estate due to maximum exposure to loss of $45 million<br />
in 2005 and $1 million in 2004. In sales transactions where<br />
we retain a management contract, the terms and conditions of<br />
the management contract are generally comparable to the terms<br />
and conditions of the management contracts obtained directly<br />
with third-party owners in competitive bid processes.<br />
Profit Sharing Plan<br />
We contribute to a profit sharing plan for the benefit of employees<br />
meeting certain eligibility requirements and electing participation<br />
in the plan. Contributions are determined based on a<br />
specified percentage of salary deferrals by participating employees.<br />
We recognized compensation cost from profit sharing of<br />
$86 million in <strong>2006</strong>, $69 million in 2005 and $70 million in 2004.<br />
Self-Insurance Programs<br />
We are self-insured for certain levels of property, liability, workers’<br />
compensation and employee medical coverage. We accrue<br />
estimated costs of these self-insurance programs at the present<br />
value of projected settlements for known and incurred but not<br />
reported claims. We use a discount rate of 4.8 percent to determine<br />
the present value of the projected settlements, which we<br />
consider to be reasonable given our history of settled claims,<br />
including payment patterns and the fixed nature of the individual<br />
settlements.<br />
Marriott Rewards<br />
Marriott Rewards is our frequent guest loyalty program. Marriott<br />
Rewards members earn points based on their monetary spending<br />
at our lodging operations, purchases of timeshare interval,<br />
fractional and whole ownership products and, to a lesser degree,<br />
through participation in affiliated partners’ programs, such as<br />
those offered by airlines and credit card companies. Points,<br />
which we track on members’ behalf, can be redeemed for stays<br />
at most of our lodging operations, airline tickets, airline frequent<br />
flyer program miles, rental cars and a variety of other awards;<br />
however, points cannot be redeemed for cash. We provide<br />
Marriott Rewards as a marketing program to participating properties.<br />
We charge the cost of operating the program, including<br />
the estimated cost of award redemption, to properties based on<br />
members’ qualifying expenditures.<br />
42 | MARRIOTT INTERNATIONAL, INC. <strong>2006</strong><br />
We defer revenue received from managed, franchised and<br />
Marriott-owned/leased hotels and program partners equal to<br />
the fair value of our future redemption obligation. We determine<br />
the fair value of the future redemption obligation based on statistical<br />
formulas that project timing of future point redemption<br />
based on historical levels, including an estimate of the “breakage”<br />
for points that will never be redeemed, and an estimate of<br />
the points that will eventually be redeemed. These judgmental<br />
factors determine the required liability for outstanding points.<br />
Our management and franchise agreements require that we<br />
be reimbursed currently for the costs of operating the program,<br />
including marketing, promotion, communication with, and performing<br />
member services for the Marriott Rewards members.<br />
Due to the requirement that hotels reimburse us for program<br />
operating costs as incurred, we receive and recognize the balance<br />
of the revenue from properties in connection with the<br />
Marriott Rewards program at the time such costs are incurred<br />
and expensed. We recognize the component of revenue from<br />
program partners that corresponds to program maintenance<br />
services over the expected life of the points awarded. Upon the<br />
redemption of points, we recognize as revenue the amounts<br />
previously deferred and recognize the corresponding expense<br />
relating to the costs of the awards redeemed. Our liability for the<br />
Marriott Rewards program was $1,231 million at year-end <strong>2006</strong>,<br />
and $1,085 million at year-end 2005.<br />
Guarantees<br />
We record a liability for the fair value of a guarantee on the date a<br />
guarantee is issued or modified. The offsetting entry depends on<br />
the circumstances in which the guarantee was issued. Funding<br />
under the guarantee reduces the recorded liability. When no<br />
funding is forecasted, the liability is amortized into income on a<br />
straight-line basis over the remaining term of the guarantee.<br />
Rebates and Allowances<br />
We participate in various vendor rebate and allowance arrangements<br />
as a manager of hotel properties. There are three types of<br />
programs that are common in the hotel industry that are sometimes<br />
referred to as “rebates” or “allowances,” including unrestricted<br />
rebates, marketing (restricted) rebates and sponsorships.<br />
The primary business purpose of these arrangements is to<br />
secure favorable pricing for our hotel owners for various products<br />
and services or enhance resources for promotional campaigns<br />
co-sponsored by certain vendors. More specifically,<br />
unrestricted rebates are funds returned to the buyer, generally<br />
based upon volumes or quantities of goods purchased.<br />
Marketing (restricted) allowances are funds allocated by vendor<br />
agreements for certain marketing or other joint promotional initiatives.<br />
Sponsorships are funds paid by vendors, generally used<br />
by the vendor to gain exposure at meetings and events, which<br />
are accounted for as a reduction of the cost of the event.<br />
We account for rebates and allowances as adjustments of the<br />
prices of the vendors’ products and services. We show vendor<br />
costs and the reimbursement of those costs as reimbursed costs<br />
and cost reimbursements revenue, respectively; therefore,<br />
rebates are reflected as a reduction of these line items.<br />
Cash and Equivalents<br />
We consider all highly liquid investments with an initial maturity<br />
of three months or less at date of purchase to be cash equivalents.<br />
Restricted Cash<br />
Restricted cash, totaling $117 million and $126 million at yearend<br />
<strong>2006</strong> and year-end 2005, respectively, is recorded in the
“Other long-term assets” line in the accompanying Consolidated<br />
Balance Sheet. Restricted cash primarily consists of deposits<br />
received on timeshare interval, fractional and whole ownership<br />
sales that are held in escrow until the contract is closed.<br />
Assets Held for Sale<br />
We consider properties to be assets held for sale when all of the<br />
following criteria are met:<br />
3 management commits to a plan to sell a property;<br />
3 it is unlikely that the disposal plan will be significantly<br />
modified or discontinued;<br />
3 the property is available for immediate sale in its present<br />
condition;<br />
3 actions required to complete the sale of the property<br />
have been initiated;<br />
3 sale of the property is probable and we expect the completed<br />
sale will occur within one year; and<br />
3 the property is actively being marketed for sale at a price<br />
that is reasonable given its current market value.<br />
Upon designation as an asset held for sale, we record the carrying<br />
value of each property at the lower of its carrying value or<br />
its estimated fair value, less estimated costs to sell, and we stop<br />
recording depreciation expense.<br />
Assets held for sale totaled $411 million at year-end <strong>2006</strong> and<br />
consisted of property and equipment of $391 million, accounts<br />
receivable of $10 million, cash of $6 million and other assets of<br />
$4 million. Assets held for sale at year-end <strong>2006</strong> of $411 million<br />
reflected the following segment composition: International<br />
Lodging-$295 million; Luxury Lodging-$73 million; and North<br />
American Full-Service Lodging-$43 million. Assets held for sale<br />
totaled $555 million at year-end 2005 and consisted of property<br />
and equipment of $523 million, accounts receivable of $14 million,<br />
cash of $13 million and other assets of $5 million. Liabilities of<br />
assets held for sale totaled $102 million at year-end <strong>2006</strong> and consisted<br />
of debt totaling $81 million, accounts payable of $11 million,<br />
accrued payroll and benefits of $8 million and other payables and<br />
accruals totaling $2 million. Liabilities of assets held for sale totaled<br />
$30 million at year-end 2005 and consisted of accounts payable of<br />
$12 million, debt of $9 million, accrued payroll and benefits of<br />
$5 million and other payables and accruals totaling $4 million.<br />
Loan Loss Reserves<br />
Lodging Senior Loans and Lodging Mezzanine and Other Loans<br />
We measure loan impairment based on the present value of<br />
expected future cash flows discounted at the loan’s original<br />
effective interest rate or the estimated fair value of the collateral.<br />
For impaired loans, we establish a specific impairment reserve<br />
for the difference between the recorded investment in the loan<br />
and the present value of the expected future cash flows, that<br />
assumes certain growth projections which may or may not<br />
occur, or the estimated fair value of the collateral. We apply our<br />
loan impairment policy individually to all loans in the portfolio<br />
and do not aggregate loans for the purpose of applying such<br />
policy. For loans that we have determined to be impaired, we<br />
recognize interest income on a cash basis.<br />
Loans to Timeshare Owners<br />
In conjunction with the adoption of SOP 04-2, we now record an<br />
estimate of expected uncollectibility on notes receivable that we<br />
receive from timeshare purchasers as a reduction of revenue at<br />
the time we recognize profit on a timeshare sale. We assess<br />
uncollectibility based on pools of receivables, because we hold<br />
large numbers of homogenous timeshare notes receivable. We<br />
estimate uncollectibles based on historical uncollectibles for<br />
similar timeshare notes receivable over the past six years. We use<br />
a technique referred to as static pool analysis, which tracks<br />
uncollectibles for each year’s sales over the life of those notes.<br />
Valuation of Goodwill<br />
We evaluate the fair value of goodwill to assess potential impairments<br />
on an annual basis, or during the year if an event or other<br />
circumstance indicates that we may not be able to recover the<br />
carrying amount of the asset. We evaluate the fair value of goodwill<br />
at the reporting unit level and make that determination<br />
based upon future cash flow projections that assume certain<br />
growth projections which may or may not occur. We record an<br />
impairment loss for goodwill when the carrying value of the<br />
intangible asset is less than its estimated fair value.<br />
Investments<br />
Except as otherwise required by FIN 46(R),“Consolidation of<br />
Variable Interest Entities,” we consolidate entities that we control.<br />
We account for investments in joint ventures using the<br />
equity method of accounting when we exercise significant influence<br />
over the venture. If we do not exercise significant influence,<br />
we account for the investment using the cost method of<br />
accounting. We account for investments in limited partnerships<br />
and limited liability companies using the equity method of<br />
accounting when we own more than a minimal investment. Our<br />
ownership interest in these equity method investments varies<br />
generally from 10 percent to 50 percent.<br />
The fair value of our available-for-sale securities totaled<br />
$107 million and $53 million at year-end <strong>2006</strong> and year-end<br />
2005, respectively. Gains in accumulated other comprehensive<br />
income (loss) associated with our available-for-sale securities<br />
totaled $35 million at year-end <strong>2006</strong> and $8 million at year-end<br />
2005. At year-end <strong>2006</strong> and year-end 2005, there were no losses<br />
in accumulated other comprehensive income (loss) associated<br />
with our available-for-sale securities.<br />
Costs Incurred to Sell Real Estate Projects<br />
Prior to the adoption of SOP 04-2 at the beginning of the <strong>2006</strong><br />
first quarter, we capitalized direct costs incurred to sell real<br />
estate projects attributable to and recoverable from the sales of<br />
timeshare interests until the sales were recognized. Costs eligible<br />
for capitalization followed the guidelines of FAS No. 67,<br />
“Accounting for Costs and Initial Rental Operations of Real Estate<br />
Projects.” Selling and marketing costs capitalized under this<br />
approach were approximately $92 million at year-end 2005 and<br />
are included in the accompanying Consolidated Balance Sheet<br />
in the “Other” caption within the “Current assets” section. Under<br />
SOP 04-2, we charge the majority of sales and marketing costs<br />
we incur to sell timeshares to expense when incurred.<br />
Accordingly, selling and marketing costs capitalized under this<br />
approach were approximately $16 million at year-end <strong>2006</strong> and<br />
are included in the accompanying Consolidated Balance Sheet<br />
in the “Other” caption within the “Current assets” section. See the<br />
Statement of Position 04-2,“Accounting for Real Estate Time-<br />
Sharing Transactions” caption under the “New Accounting<br />
Standards” heading which follows for additional information<br />
regarding the adoption of SOP 04-2. If a contract is canceled, we<br />
charge unrecoverable direct selling and marketing costs to<br />
expense and record deposits forfeited as income.<br />
Residual Interests<br />
We periodically sell notes receivable originated by our Timeshare<br />
segment in connection with the sale of timeshare interval, fractional<br />
MARRIOTT INTERNATIONAL, INC. <strong>2006</strong> | 43
and whole ownership products. We retain servicing assets and<br />
other interests in the assets transferred to entities that are<br />
accounted for as residual interests. We treat the residual interests,<br />
excluding servicing assets, as “trading” securities under the<br />
provisions of FAS No. 115,“Accounting for Certain Investments in<br />
Debt and Equity Securities,” (“FAS No. 115”). At the end of each<br />
reporting period, we estimate the fair value of the residual interests,<br />
excluding servicing assets, using a discounted cash flow<br />
model. We report changes in the fair values of these residual<br />
interests, excluding servicing assets, through the accompanying<br />
Consolidated Statement of Income. Servicing assets are classified<br />
as held to maturity under the provisions of FAS No. 115 and<br />
are recorded at amortized cost.<br />
Derivative Instruments<br />
We use derivative instruments as part of our overall strategy to<br />
manage our exposure to market risks associated with fluctuations<br />
in interest rates, foreign currency exchange rate and, for<br />
our synthetic fuel business, oil prices. As a matter of policy, we<br />
do not use derivatives for trading or speculative purposes.<br />
We record all derivatives at fair value either as assets or liabilities.<br />
We recognize, currently in earnings, changes in fair value of<br />
derivatives not designated as hedging instruments and of derivatives<br />
designated as fair value hedging instruments. Changes in<br />
the fair value of the hedged item in a fair value hedge are<br />
recorded as an adjustment to the carrying amount of the hedged<br />
item and recognized in earnings in the same income statement<br />
line item as the change in the fair value of the derivative.<br />
We record the effective portion of changes in fair value of<br />
derivatives designated as cash flow hedging instruments as a<br />
component of other comprehensive income and report the ineffective<br />
portion currently in earnings. We reclassify amounts<br />
included in other comprehensive income into earnings in the<br />
same period during which the hedged item affects earnings.<br />
Foreign Operations<br />
The U.S. dollar is the functional currency of our consolidated and<br />
unconsolidated entities operating in the United States. The functional<br />
currency for our consolidated and unconsolidated entities<br />
operating outside of the United States is generally the currency<br />
of the primary economic environment in which the entity primarily<br />
generates and expends cash. For consolidated entities whose<br />
functional currency is not the U.S. dollar, we translate their financial<br />
statements into U.S. dollars, and we do the same, as needed,<br />
for unconsolidated entities whose functional currency is not the<br />
U.S. dollar. We translate assets and liabilities at the exchange rate<br />
in effect as of the financial statement date, and income statement<br />
accounts are translated using the weighted average<br />
exchange rate for the period. We include translation adjustments<br />
from foreign exchange and the effect of exchange rate changes<br />
on intercompany transactions of a long-term investment nature<br />
as a separate component of shareholders’ equity. We report<br />
gains and losses from foreign exchange rate changes related to<br />
intercompany receivables and payables that are not of a longterm<br />
investment nature, as well as gains and losses from foreign<br />
currency transactions, currently in operating costs and expenses,<br />
and those amounted to a $6 million gain in <strong>2006</strong> and losses of<br />
$5 million and $3 million in 2005 and 2004, respectively.<br />
New Accounting Standards<br />
Statement of Position 04-2, “Accounting for Real Estate<br />
Time-Sharing Transactions”<br />
In December 2004, the Financial Accounting Standards Board<br />
(“FASB”) issued FAS No. 152 “Accounting for Real Estate<br />
44 | MARRIOTT INTERNATIONAL, INC. <strong>2006</strong><br />
Time-Sharing Transactions-an amendment to FASB Statements<br />
No. 66 and 67” and the American Institute of Certified Public<br />
Accountants issued SOP 04-2. Additionally, the FASB amended<br />
FAS No. 66,“Accounting for Sales of Real Estate” and FAS No. 67,<br />
“Accounting for Costs and Initial Rental Operations of Real Estate<br />
Projects” (“FAS No. 67”), to exclude accounting for real estate<br />
time-sharing transactions from these statements. We adopted<br />
SOP 04-2 at the beginning of the <strong>2006</strong> first quarter.<br />
Under SOP 04-2, we charge the majority of sales and marketing<br />
costs we incur to sell timeshares to expense when incurred.<br />
We also record an estimate of expected uncollectibility on notes<br />
receivable that we receive from timeshare purchasers as a reduction<br />
of revenue at the time that we recognize profit on a timeshare<br />
sale. We also account for rental and other operations<br />
during holding periods as incidental operations, which requires<br />
us to record any excess of revenues over costs as a reduction of<br />
inventory costs.<br />
The initial adoption of SOP 04-2 in our <strong>2006</strong> first quarter,<br />
which we reported as a cumulative effect of change in accounting<br />
principle in our Consolidated Statement of Income, resulted<br />
in a non-cash after-tax charge of $105 million ($0.24 per diluted<br />
share). As a result of tax rate adjustments in the <strong>2006</strong> fourth<br />
quarter, we reduced the tax benefit associated with the initial<br />
adoption from $68 million to $64 million. Accordingly, the aftertax<br />
impact of the adoption was $109 million ($0.25 per diluted<br />
share). As a result of the change,“Net Income” of $65 million<br />
($0.15 per diluted share) as reported in the <strong>2006</strong> first quarter,<br />
now totals $61 million ($0.14 per diluted share). The pre-tax<br />
charge totaled $173 million and comprised a $130 million inventory<br />
write-down, the establishment of a $25 million notes receivable<br />
reserve and an increase in current liabilities of $18 million.<br />
We estimate that the ongoing impact of adoption in subsequent<br />
periods will be immaterial.<br />
We estimate that, for the 20-year period from 2007 through<br />
2026, the cost of completing improvements and currently<br />
planned amenities for our owned timeshare properties will be<br />
approximately $1.9 billion.<br />
FAS No. 123 (revised 2004), “Share-Based Payment”<br />
In December 2004, the FASB issued FAS No. 123 (revised 2004),<br />
“Share-Based Payment” (“FAS No. 123(R)”), which is a revision of<br />
FAS No. 123,“Accounting for Stock-Based Compensation.” FAS No.<br />
123(R) supersedes Accounting Principles Boards (“APB”) Opinion<br />
25,“Accounting for Stock Issued to Employees,” (“APB Opinion No.<br />
25”) and amends FAS No. 95,“Statement of Cash Flows.”We<br />
adopted FAS No. 123(R) using the modified prospective transition<br />
method at the beginning of our <strong>2006</strong> first quarter. See Footnote<br />
No. 4,“Share-Based Compensation,” for additional information.<br />
Future Adoption of Accounting Standards<br />
In July <strong>2006</strong>, the FASB issued FASB Interpretation No. 48,<br />
“Accounting for Uncertainty in Income Taxes” (“FIN 48”). FIN 48 is<br />
an interpretation of FASB Statement No. 109,“Accounting for<br />
Income Taxes,” and it seeks to reduce the diversity in practice<br />
associated with certain aspects of measurement and recognition<br />
in accounting for income taxes. FIN 48 prescribes a recognition<br />
threshold and measurement attribute for the financial statement<br />
recognition and measurement of a tax position taken or<br />
expected to be taken in a tax return. Additionally, FIN 48 provides<br />
guidance on de-recognition, classification, interest and penalties,<br />
accounting in interim periods, disclosure and transition. FIN 48 is<br />
effective for fiscal years beginning after December 15, <strong>2006</strong>,<br />
which is our 2007 fiscal year, and its provisions are to be applied<br />
to all tax positions upon initial adoption. Upon adoption of
FIN 48, only tax positions that meet a “more likely than not”<br />
threshold at the effective date may be recognized or continue to<br />
be recognized. The cumulative effect of applying FIN 48, if any, is<br />
to be reported as an adjustment to the opening balance of<br />
retained earnings in the year of adoption. We are evaluating the<br />
impact that FIN 48 will have on our financial statements.<br />
In March <strong>2006</strong>, the FASB issued FAS No. 156,“Accounting for<br />
Servicing of Financial Assets” (“FAS No. 156”). FAS No. 156<br />
requires that all separately recognized servicing assets and liabilities<br />
are to be initially measured at fair value. It also allows entities<br />
to subsequently elect fair value measurement for its<br />
servicing assets and liabilities. This standard is effective for the<br />
first fiscal year beginning after September 15, <strong>2006</strong>, which is our<br />
2007 fiscal year. We have determined that FAS No. 156 will not<br />
have a material impact on our financial statements.<br />
In September <strong>2006</strong>, the FASB issued FAS No. 157,“Fair Value<br />
Measurements” (“FAS No. 157”). This standard defines fair value,<br />
establishes a methodology for measuring fair value and expands<br />
the required disclosure for fair value measurements. FAS No. 157<br />
is effective for fiscal years beginning after November 15, 2007,<br />
which is our 2008 fiscal year. Provisions of FAS No. 157 are<br />
required to be applied prospectively as of the beginning of the<br />
first fiscal year in which FAS No. 157 is applied. We are evaluating<br />
the impact that FAS No. 157 will have on our financial statements.<br />
In November <strong>2006</strong>, the Emerging Issues Task Force of FASB<br />
(“EITF”) reached a consensus on EITF Issue No. 06-8,“Applicability<br />
of the Assessment of a Buyer’s Continuing Investment under<br />
FASB Statement No. 66, Accounting for Sales of Real Estate, for<br />
Sales of Condominiums” (“EITF 06-8”). EITF 06-8 will require condominium<br />
sales to meet the continuing investment criterion in<br />
FAS No. 66 in order for profit to be recognized under the percentage<br />
of completion method. EITF 06-8 will be effective for annual<br />
reporting periods beginning after March 15, 2007, which is our<br />
2008 fiscal year. The cumulative effect of applying EITF 06-8, if<br />
any, is to be reported as an adjustment to the opening balance of<br />
retained earnings in the year of adoption. We are evaluating the<br />
impact that EITF 06-8 will have on our financial statements.<br />
2 | SYNTHETIC FUEL<br />
Operations<br />
Our synthetic fuel operation currently consists of four coalbased<br />
synthetic fuel production facilities (the “Facilities”), two of<br />
which are located at a coal mine in Saline County, Illinois, one of<br />
which is located at a coal mine in Jefferson County, Alabama,<br />
and one of which is located at a coal mine near Evansville,<br />
Indiana. Three of the four plants are held in one entity, Synthetic<br />
American Fuel Enterprises II, LLC (“SAFE II”), and one of the<br />
plants is held in a separate entity, Synthetic American Fuel<br />
Enterprises I, LLC (“SAFE I”). Section 45K of the Internal Revenue<br />
Code (“Section 45K of the IRC”) (Section 29 for fiscal years prior<br />
to <strong>2006</strong>) provides tax credits for the production and sale of synthetic<br />
fuels produced from coal through 2007 (credits are not<br />
available for fuel produced after 2007). Although the Facilities<br />
incur significant losses, these losses are more than offset by the<br />
tax credits generated under Section 45K of the IRC, which<br />
reduce our income tax expense. During <strong>2006</strong>, the Indiana facility<br />
was relocated from Alabama. The relocation of the plant was<br />
completed in the <strong>2006</strong> third quarter. In late February <strong>2006</strong>, an<br />
explosion occurred at our Alabama feedstock supplier’s underground<br />
coal mine. Several months following the explosion, the<br />
mine was reopened with a limited amount of production.<br />
However, at year-end <strong>2006</strong> the mine was again closed by our<br />
feedstock supplier. As a result of the mine closure, production at<br />
the one plant remaining in Alabama was suspended at yearend<br />
<strong>2006</strong>.<br />
At each of our locations, the synthetic fuel operation has site<br />
leases at sites that are adjacent to large mines, and in the case of<br />
our Alabama operation, a barge load-out facility on a navigable<br />
river. In addition, at each of the locations, the synthetic fuel operation<br />
has coal purchase agreements with the owners of the<br />
adjacent coal mines and synthetic fuel sales contracts with a<br />
number of major utilities, including the Tennessee Valley<br />
Authority and Tampa Electric Company. With respect to the<br />
Illinois location, the synthetic fuel operation has agreements to<br />
purchase coal and sell synthetic fuel through 2007 covering at<br />
least 50 percent of the annual productive capacity of the<br />
Facilities at that location. From time to time, the Illinois synthetic<br />
fuel operation supplements these base contracts, as opportunities<br />
arise, by entering into spot contracts to buy coal and sell<br />
synthetic fuel to different end users. With respect to the Indiana<br />
location, the synthetic fuel operation has entered into agreements<br />
to purchase coal and sell synthetic fuel to a number of<br />
major utilities through the end of 2007. The agreements to purchase<br />
coal and sell synthetic fuel can generally be canceled by<br />
us in the event that we choose not to operate the Facilities, or if<br />
the synthetic fuel produced at the Facilities does not qualify for<br />
tax credits under Section 45K of the IRC or in the event of a<br />
phase-out of tax credits under Section 45K of the IRC.<br />
Although we anticipate that the coal mines adjacent to the<br />
synthetic fuel operation’s production sites in Illinois and Indiana<br />
will be able to fulfill those Facilities’ requirements for feedstock<br />
coal, if our feedstock suppliers become unable to supply the<br />
Illinois and Indiana Facilities with enough coal to satisfy our<br />
requirements for any reason, we would have to curtail production,<br />
which would have a negative impact on our results of operations,<br />
or negotiate new coal supply agreements with third<br />
parties, which might not be available on similar terms. In addition,<br />
the synthetic fuel operation has synthetic fuel sale contracts<br />
with a number of customers who have contracted to<br />
purchase in excess of 10 percent of the productive capacity at<br />
our Alabama, Illinois and Indiana locations. Although we expect<br />
that those customers could be replaced by other purchasers, we<br />
cannot assure that we would be able to enter into replacement<br />
contracts on equivalent terms. As a result, the failure by one or<br />
more of those customers to perform their purchase obligations<br />
under those sale contracts could have a material adverse effect<br />
on the synthetic fuel operation.<br />
The synthetic fuel operation has an operations and maintenance<br />
agreement with an experienced manager of synthetic<br />
fuel facilities. This manager is responsible for staffing the<br />
Facilities, operating and maintaining the machinery and conducting<br />
routine maintenance on behalf of the synthetic fuel<br />
operation. Finally, the synthetic fuel operation has a license and<br />
binder purchase agreement with Headwaters Incorporated,<br />
which permits the operation to utilize a carboxylated polystyrene<br />
copolymer emulsion patented by Headwaters and manufactured<br />
by Dow Chemical that is mixed with coal to produce a<br />
qualified synthetic fuel.<br />
As discussed in greater detail below in Footnote No. 18,<br />
“Contingencies,” under the heading “Synthetic Fuel,” the tax<br />
credits available under Section 45K of the IRC for the production<br />
and sale of synthetic fuel in any given year are phased out if oil<br />
prices in that year are above certain thresholds. As a result of<br />
high oil prices in the first several weeks of <strong>2006</strong>, we elected to<br />
suspend production of synthetic fuel in mid-January <strong>2006</strong>. On<br />
February 17, <strong>2006</strong>, we restarted production and entered into<br />
MARRIOTT INTERNATIONAL, INC. <strong>2006</strong> | 45
hedge agreements to minimize losses that could occur from that<br />
date through March 31, <strong>2006</strong>, if more than a majority of the tax<br />
credits were phased out in <strong>2006</strong> as a result of high oil prices.<br />
Early in the <strong>2006</strong> second quarter, with oil prices again averaging<br />
well above the starting point of the projected <strong>2006</strong> phase-out<br />
range for the first few months of the year, we suspended all production<br />
at our synthetic fuel facilities in order to minimize operating<br />
losses that could occur if more than a majority of the tax<br />
credits were phased out in <strong>2006</strong>. We restarted production early in<br />
the <strong>2006</strong> fourth quarter at all four of the synthetic fuel production<br />
facilities and entered into hedge agreements to minimize operating<br />
losses that could occur if more than a majority of the tax credits<br />
were phased out in <strong>2006</strong>. However, as noted earlier in this<br />
section, at year-end <strong>2006</strong> the mine adjacent to our Alabama production<br />
facility was again closed by our feedstock supplier. As a<br />
result of new information received in 2007, we may attempt to<br />
restart the Alabama facility in the future or move the processing<br />
equipment to another location. Late in <strong>2006</strong> and early in 2007, we<br />
entered into hedge agreements to minimize operating losses that<br />
could occur if more than a majority of the tax credits are phased<br />
out in 2007. We will continue to monitor the situation, and if circumstances<br />
warrant, we may again elect to suspend production<br />
at all of our synthetic fuel facilities in the future.<br />
Because the tax credits under Section 45K of the IRC are only<br />
available for the production and sale of synthetic fuel produced<br />
from coal through 2007, we expect to permanently shut down<br />
the Facilities and cease production of synthetic fuel at the end of<br />
2007. The book value of the synthetic fuel facilities was $5 million<br />
at year-end <strong>2006</strong>. Under the site leases for the Facilities, we<br />
are required to restore the leased premises to substantially the<br />
condition the premises were in when the leases were executed.<br />
This restoration may include the dismantling and sale or disposal<br />
of improvements we have constructed on the premises, as<br />
well as site restoration and other related tasks. We expect that<br />
the costs associated with shutting down the synthetic fuel facilities<br />
and completing the restoration of the project sites will not<br />
be material.<br />
Our Investment<br />
We acquired our initial interest in SAFE I and SAFE II from<br />
PacifiCorp Financial Services (“PacifiCorp”) in October 2001 for<br />
$46 million in cash, and we began operating the Facilities in<br />
the first quarter of 2002. We also make annual payments to<br />
PacifiCorp based on the amount of tax credits produced, up to<br />
a certain threshold. On June 21, 2003, we sold an approximately<br />
50 percent ownership interest in both SAFE I and SAFE II. We<br />
received cash and promissory notes totaling $25 million at closing,<br />
and were entitled to receive additional proceeds based on<br />
the actual amount of tax credits allocated to the purchaser. As a<br />
result of a put option associated with the June 21, 2003, sale of a<br />
50 percent ownership interest, we consolidated the two synthetic<br />
fuel joint ventures from that date through November 6,<br />
2003. Effective November 7, 2003, because the put option was<br />
voided, we began accounting for the synthetic fuel joint ventures<br />
using the equity method of accounting. Beginning March<br />
26, 2004, as a result of adopting FIN 46(R),“Consolidation of<br />
Variable Interest Entities,” we again consolidated the synthetic<br />
fuel joint ventures, and we reflected our partner’s share of the<br />
operating losses as minority interest.<br />
On October 6, 2004, we entered into amendment agreements<br />
with our synthetic fuel partner that resulted in a shift in the allocation<br />
of tax credits between us. Our partner increased its allocation<br />
of tax credits generated by the SAFE I synthetic fuel facility<br />
46 | MARRIOTT INTERNATIONAL, INC. <strong>2006</strong><br />
from approximately 50 percent to 90 percent through March 31,<br />
2005, and paid a higher price per tax credit to us for that additional<br />
share of tax credits. Effective April 1, 2005, our partner’s<br />
share of the tax credits from SAFE I returned to approximately<br />
50 percent. Also on October 6, 2004, our partner reduced its allocation<br />
of tax credits generated by the three SAFE II synthetic fuel<br />
facilities from approximately 50 percent to roughly 8 percent<br />
through December 31, 2004, and to 1 percent from January 1,<br />
2005, through May 31, 2005. Effective June 1, 2005, our partner’s<br />
share of the tax credits from the SAFE II facilities returned to<br />
approximately 50 percent.<br />
Our partner in SAFE II, which owns three of our four synthetic<br />
fuel plants, exercised its option to have its interest in SAFE II<br />
redeemed effective December 31, 2005, the first day of our <strong>2006</strong><br />
first quarter. As a result, we now own all of the interests in the<br />
three SAFE II production facilities. In consideration for the<br />
redeemed interest, we forgave the remaining outstanding promissory<br />
note balance of approximately $8 million related to our<br />
partner’s initial purchase of the interest in SAFE II, and our partner<br />
was relieved of the obligation to make further earn-out payments<br />
with respect to SAFE II, for periods after December 31,<br />
2005. On that date, we eliminated our partner’s minority interest<br />
in SAFE II, which was $7 million. As a result of the redemption of<br />
our partner’s interest in SAFE II, with respect to the period beginning<br />
January 1, <strong>2006</strong>, we were allocated 100 percent of the operating<br />
losses associated with the Facilities owned by SAFE II,<br />
received 100 percent of the tax credits generated by those<br />
Facilities and made production decisions with respect to those<br />
Facilities based on our 100 percent ownership.<br />
Effective October 1, <strong>2006</strong>, we purchased our partner’s interest<br />
in SAFE I, and as a result, we now own all of the interests in the<br />
one SAFE I production facility. In consideration for the purchased<br />
interest, we paid our partner $150,000 in cash and, for periods<br />
after September 30, <strong>2006</strong>, released our partner from its obligation<br />
to make remaining base note and earn-out payments<br />
related to the partner’s purchase of the interest in SAFE I. On<br />
September 30, <strong>2006</strong>, we eliminated our partner’s minority interest<br />
in SAFE I which was $2 million. As a result of the purchase of<br />
our partner’s interest in SAFE I, for the period beginning October<br />
1, <strong>2006</strong>, we were allocated 100 percent of the operating losses<br />
associated with the Facility owned by SAFE I, received 100 percent<br />
of the tax credits generated by that Facility, and made production<br />
decisions with respect to that Facility based on our<br />
100 percent ownership. In connection with the acquisition of<br />
our partner’s interest in SAFE I, we also assumed the obligation<br />
of our partner to make earn-out payments to our prior partner<br />
from whom it acquired the SAFE I interest in 2005.<br />
Internal Revenue Service Determinations<br />
On November 7, 2003, the United States Internal Revenue<br />
Service (“IRS”) issued private letter rulings to the synthetic fuel<br />
joint ventures confirming that the synthetic fuel produced by<br />
the Facilities is a “qualified fuel” under the Internal Revenue Code<br />
and that the resulting tax credit may be allocated among the<br />
members of the synthetic fuel joint ventures. In July 2004, IRS<br />
field auditors issued a notice of proposed adjustment and later a<br />
Summary <strong>Report</strong> to PacifiCorp that included a challenge to the<br />
placed-in-service dates of the three SAFE II synthetic fuel facilities.<br />
One of the conditions to qualify for tax credits is that the<br />
production facility must have been placed in service before<br />
July 1, 1998. On June 7, 2005, the IRS National Office issued a<br />
Technical Advice Memorandum confirming that the three SAFE<br />
II synthetic fuel facilities that were under IRS review met the<br />
placed-in-service requirement of the Internal Revenue Code.
3 | INCOME TAXES<br />
See the “Future Adoption of Accounting Standards” caption in<br />
Footnote No. 1,“Summary of Significant Accounting Policies,” for<br />
information regarding the future adoption of FIN 48.<br />
Total deferred tax assets and liabilities as of year-end <strong>2006</strong>,<br />
and year-end 2005, were as follows:<br />
($ in millions) <strong>2006</strong> 2005<br />
Deferred tax assets $1,042 $ 932<br />
Deferred tax liabilities (177) (167)<br />
Net deferred taxes $ 865 $ 765<br />
The tax effect of each type of temporary difference and carryforward<br />
that gives rise to a significant portion of deferred tax<br />
assets and liabilities as of year-end <strong>2006</strong>, and year-end 2005,<br />
were as follows:<br />
($ in millions) <strong>2006</strong> 2005<br />
Self-insurance $ 36 $ 33<br />
Employee benefits 250 232<br />
Deferred income 34 42<br />
Other reserves 52 64<br />
Frequent guest program<br />
Tax credits (primarily associated<br />
75 94<br />
with synthetic fuel) 383 345<br />
Net operating loss carry-forwards 126 99<br />
Timeshare financing (37) (25)<br />
Property, equipment and intangible assets (32) (50)<br />
Other, net 12 (25)<br />
Deferred taxes 899 809<br />
Less: valuation allowance (34) (44)<br />
Net deferred taxes $865 $765<br />
At year-end <strong>2006</strong>, we had approximately $98 million of tax<br />
credits that expire through 2026, $285 million of tax credits that<br />
do not expire and $576 million of net operating losses, of which<br />
$320 million expire through 2025. The valuation allowance<br />
decreased due to foreign net operating losses that we believe<br />
will be realized and the expiration of state net operating losses.<br />
We have made no provision for U.S. income taxes or additional<br />
foreign taxes on the cumulative unremitted earnings of<br />
non-U.S. subsidiaries ($572 million as of year-end <strong>2006</strong>) because<br />
we consider these earnings to be permanently invested. These<br />
earnings could become subject to additional taxes if remitted as<br />
dividends, loaned to us or a U.S. affiliate or if we sold our interests<br />
in the affiliates. We cannot practically estimate the amount<br />
of additional taxes that might be payable on the unremitted<br />
earnings. We conduct business in countries that grant a “holiday”<br />
from income taxes for 10- and 30-year periods. The holidays<br />
expire through 2034. The aggregate amount of taxes not<br />
incurred due to tax “holidays” and the related earnings per share<br />
impacts are $24 million ($0.06 per diluted share), $18 million<br />
($0.04 per diluted share), and $14 million ($0.03 per diluted<br />
share) for <strong>2006</strong>, 2005 and 2004, respectively.<br />
The (provision for) benefit from income taxes consists of:<br />
($ in millions) <strong>2006</strong> 2005 2004<br />
Current – Federal $(229) $(207) $(153)<br />
– State (57) (52) (34)<br />
– Foreign (56) (35) (29)<br />
(342) (294) (216)<br />
Deferred – Federal 37 173 90<br />
– State 1 19 5<br />
– Foreign 18 8 21<br />
56 200 116<br />
$(286) $ (94) $(100)<br />
The current tax provision does not reflect the benefits attributable<br />
to us relating to the exercise of employee stock options of<br />
$193 million in <strong>2006</strong>, $87 million in 2005 and $79 million in 2004.<br />
Included in the above amounts are tax credits of $66 million in<br />
<strong>2006</strong>, $172 million in 2005 and $148 million in 2004. The taxes<br />
applicable to other comprehensive income are not material.<br />
A reconciliation of the U.S. statutory tax rate to our effective<br />
income tax rate for continuing operations follows:<br />
<strong>2006</strong> 2005 2004<br />
U.S. statutory tax rate 35.0)% 35.0)% 35.0)%<br />
State income taxes, net of U.S.<br />
tax benefit 2.9 3.0 2.9<br />
Minority interest 0.2 2.3 2.4<br />
Change in deferred taxes 1.1 — 2.2<br />
Change in valuation allowance (2.1) 1.6 (3.3)<br />
Foreign income (2.0) (4.6) (1.4)<br />
Tax credits (primarily associated<br />
with synthetic fuel) (6.7) (24.1) (22.6)<br />
Other, net 0.3 0.1 0.1<br />
Effective rate 28.7)% 13.3)% 15.3)%<br />
Cash paid for income taxes, net of refunds, was $169 million<br />
in <strong>2006</strong>, $182 million in 2005 and $164 million in 2004. Tax credits<br />
contributed by our synthetic fuel operations have significantly<br />
reduced our effective tax rate during the last several<br />
years. Because that program ends with 2007 synthetic fuel production,<br />
our synthetic fuel production facilities will not be able<br />
to generate credits in future years. As a result, our future effective<br />
tax rate is likely to increase significantly, thereby reducing<br />
our after-tax profits.<br />
4 | SHARE-BASED COMPENSATION<br />
Under our 2002 Comprehensive Stock and Cash Incentive Plan<br />
(“the Comprehensive Plan”), we currently award to participating<br />
employees (1) stock options to purchase our Class A Common<br />
Stock (“Stock Option Program”), (2) share appreciation rights for<br />
our Class A Common Stock, and (3) restricted stock units of our<br />
Class A Common Stock.<br />
As noted in Footnote No. 1,“Basis of Presentation” under the<br />
“New Accounting Pronouncements” heading, we adopted FAS<br />
No. 123(R) using the modified prospective transition method at<br />
the beginning of our <strong>2006</strong> first quarter. In accordance with the<br />
modified prospective transition method, we did not restate our<br />
Consolidated Financial Statements for prior periods to reflect<br />
the impact of FAS No. 123(R). For all share-based awards granted<br />
MARRIOTT INTERNATIONAL, INC. <strong>2006</strong> | 47
after the date we adopted FAS No. 123(R) and for the unvested<br />
portion of previously granted share-based awards that were outstanding<br />
on that date, FAS No. 123(R) requires that we measure<br />
compensation costs related to our share-based payment transactions<br />
at fair value on the grant date and that we recognize<br />
those costs in the financial statements over the vesting period<br />
during which the employee provides service in exchange for the<br />
award. Previously, under FAS No. 123 and APB Opinion No. 25, we<br />
accounted for our share-based employee compensation plans<br />
using the intrinsic value method under the recognition and<br />
measurement principles of APB Opinion No. 25 and recognized<br />
share-based compensation expense for all awards except for our<br />
Stock Option Program awards. Share-based compensation<br />
expense related to award grants totaled $62 million and $47 million<br />
for 2005 and 2004, respectively.<br />
Under FAS No. 123(R), we recorded share-based compensation<br />
expense of $108 million in <strong>2006</strong>. Deferred compensation<br />
costs related to unvested awards totaled $168 million at<br />
December 29, <strong>2006</strong>, and the weighted average period over<br />
which the costs are expected to be recognized is two years.<br />
Deferred compensation costs related to unvested awards<br />
totaled $137 million at December 30, 2005.<br />
The following table illustrates the effect on net income and<br />
earnings per share as if we had applied the fair value recognition<br />
provisions of FAS No. 123 to share-based employee compensation<br />
in 2005 and 2004. We have included the impact of measured<br />
but unrecognized compensation costs and excess tax benefits<br />
credited to additional paid-in-capital in the calculation of diluted<br />
pro forma shares. In addition, we have included the estimated<br />
impact of reimbursements from third parties. The reported and<br />
pro forma net income and earnings per share figures for <strong>2006</strong> in<br />
the table are the same because share-based compensation<br />
expense is calculated under the provisions of FAS No. 123(R). The<br />
<strong>2006</strong> amounts are included in the table below to provide detail<br />
for comparative purposes to the 2005 and 2004 amounts.<br />
($ in millions, except per share amounts) <strong>2006</strong> 2005 2004<br />
Net income, as reported $ 608 $ 669 $ 596<br />
Add: Share-based employee<br />
compensation expense included<br />
in reported net income, net of<br />
related tax effects of related tax effects 70 40 31<br />
Deduct: Total share-based employee<br />
compensation expense determined<br />
under fair value-based method for<br />
all awards, net of related tax effects<br />
and estimated reimbursed costs (70) (61) (58)<br />
Pro forma net income $ 608 $ 648 $ 569<br />
Earnings per share:<br />
Basic-as reported $1.50 $1.55 $1.31<br />
Basic-pro forma $1.50 $1.50 $1.26<br />
Diluted-as reported $1.41 $1.45 $1.24<br />
Diluted-pro forma $1.41 $1.40 $1.18<br />
FAS No. 123(R) requires that share-based compensation<br />
expense be recognized over the period from the grant date to<br />
the date on which the award is no longer contingent on the<br />
employee providing additional service (the “substantive vesting<br />
period”). In periods prior to the adoption of FAS No. 123(R), we<br />
showed share-based compensation expense in our pro forma<br />
disclosure only for option awards to retirement-eligible employees<br />
48 | MARRIOTT INTERNATIONAL, INC. <strong>2006</strong><br />
over the awards’ stated vesting period. In periods prior to the<br />
adoption of FAS No. 123(R), we recorded share-based compensation<br />
expense for our other awards to retirement-eligible employees<br />
over the awards’ stated vesting period. With the adoption of<br />
FAS No. 123(R), we continue to follow the stated vesting period<br />
for the unvested portion of awards granted prior to adoption of<br />
FAS No. 123(R) and follow the substantive vesting period for<br />
awards granted after the adoption of FAS No. 123(R).<br />
In connection with the adoption of FAS No. 123(R), we<br />
reviewed, among other things, our forfeiture and volatility<br />
assumptions. Estimated volatilities for <strong>2006</strong> were based on the<br />
historical share-price volatility for a period equal to the stock<br />
option’s or share appreciation right’s expected lives, ending on<br />
the day of grant, and calculated based on weekly data. The<br />
weighted average expected stock option or share appreciation<br />
right terms for <strong>2006</strong> were a product of the lattice-based binomial<br />
valuation model that uses suboptimal exercise factors to<br />
calculate the expected terms. In August 2005, the Board of<br />
Directors amended the Comprehensive Plan to provide participants<br />
the ability, during a limited time frame in 2005, to elect to<br />
accelerate the schedule for distribution of certain vested<br />
deferred shares. The amendment did not alter the previously<br />
established vesting schedule. In 2005 we also changed from<br />
using the Black-Scholes option pricing method to estimate the<br />
fair value of each stock option or share appreciation right on the<br />
grant date, to using the binomial valuation method to improve<br />
the estimate of fair value.<br />
In 2005, we changed the method in which we issue sharebased<br />
awards to our key employees. In prior years, share-based<br />
compensation for key employees consisted primarily of stock<br />
options. Upon consideration of several factors, we began in 2005<br />
to award key employees a combination of stock options and<br />
restricted stock units. Therefore, this change resulted in an<br />
increase in restricted stock expense.<br />
The adoption of FAS No. 123(R) in <strong>2006</strong> resulted in the recognition<br />
of incremental share-based compensation costs in <strong>2006</strong><br />
of $39 million, a reduction in net income of $25 million (net of<br />
tax benefits of $14 million) and a reduction of both basic and<br />
diluted earnings per share of $0.06. In accordance with FAS No.<br />
123(R), we present the tax benefits resulting from the exercise of<br />
share-based awards as financing cash flows. Prior to the adoption<br />
of FAS No. 123(R), we reported the tax benefits resulting<br />
from the exercise of share-based awards as operating cash flows.<br />
The adoption of FAS No. 123(R) resulted in a decrease in <strong>2006</strong> of<br />
$193 million in cash flows from operating activities and an<br />
increase of $193 million in cash flows from financing activities<br />
related to excess tax benefits from share-based awards. The<br />
aggregate amount of cash we received from the exercise of<br />
stock options granted under share-based payment arrangements<br />
was $184 million, $125 million, and $206 million for <strong>2006</strong>,<br />
2005 and 2004, respectively.<br />
We issue restricted stock units under the Comprehensive<br />
Plan to certain officers and key employees and those units vest<br />
generally over four years in annual installments commencing<br />
one year after the date of grant. We recognize compensation<br />
expense for the restricted stock units over the service period<br />
equal to the fair market value of the stock units on the date of<br />
issuance. Upon vesting, restricted stock units convert to shares<br />
and are distributed from treasury shares. At year-end <strong>2006</strong> and<br />
year-end 2005, there was approximately $138 million and<br />
$123 million, respectively, in deferred compensation costs related<br />
to restricted stock units. Share-based compensation expense<br />
associated with restricted stock units was $77 million, $52 million,<br />
and $35 million for <strong>2006</strong>, 2005 and 2004, respectively. The
weighted average remaining term was two years for restricted<br />
stock unit grants outstanding at year-end <strong>2006</strong>. The aggregate<br />
intrinsic value of restricted stock units converted and distributed<br />
during <strong>2006</strong>, 2005 and 2004, was $78 million, $52 million, and<br />
$21 million, respectively. The weighted average grant-date fair<br />
values of restricted stock units granted in <strong>2006</strong>, 2005 and 2004<br />
were $35, $32 and $23, respectively.<br />
Changes in our restricted stock unit grants in <strong>2006</strong> were<br />
as follows:<br />
Number of Weighted<br />
Restricted Average<br />
Stock Units Grant-Date<br />
(in millions) Fair Value<br />
Outstanding at year-end 2005 6.9 $25<br />
Granted during <strong>2006</strong> 3.2 35<br />
Distributed during <strong>2006</strong> (2.2) 23<br />
Forfeited during <strong>2006</strong> (0.3) 27<br />
Outstanding at year-end <strong>2006</strong> 7.6 30<br />
Employee stock options may be granted to officers and key<br />
employees at exercise prices or strike prices equal to the market<br />
price of our Class A Common Stock on the date of grant. Nonqualified<br />
options generally expire 10 years after the date of<br />
grant, except those issued from 1990 through 2000, which<br />
expire 15 years after the date of the grant. Most stock options<br />
under the Stock Option Program are exercisable in cumulative<br />
installments of one quarter at the end of each of the first four<br />
years following the date of grant.<br />
We recognized compensation expense of $22 million in <strong>2006</strong><br />
associated with employee stock options. We did not recognize<br />
any compensation expense associated with employee stock<br />
options in 2005 or 2004. At year-end <strong>2006</strong>, there was approximately<br />
$18 million in deferred compensation costs related to<br />
employee stock options. Upon the exercise of stock options,<br />
shares are issued from treasury shares.<br />
Changes in our Stock Option Program awards in <strong>2006</strong> were<br />
as follows:<br />
Number of Weighted<br />
Options Average<br />
(in millions) Exercise Price<br />
Outstanding at year-end 2005 56.8 $16<br />
Granted during <strong>2006</strong> — 34<br />
Exercised during <strong>2006</strong> (12.8) 14<br />
Forfeited during <strong>2006</strong> (0.1) 19<br />
Outstanding at year-end <strong>2006</strong> 43.9 17<br />
Stock options issued under the Stock Option Program awards outstanding at year-end <strong>2006</strong>, were as follows:<br />
Outstanding Exercisable<br />
Number of Weighted Average Weighted Number of Weighted Weighted Average<br />
Range of Stock Options Remaining Life Average Stock Options Average Remaining Life<br />
Exercise Prices (in millions) (in years) Exercise Price (in millions) Exercise Price (in years)<br />
$ 3 to $ 5 0.9 1 $ 4 0.9 $ 4 1<br />
$ 6 to $ 8 3.1 3 7 3.1 7 3<br />
$ 9 to $12 2.1 5 11 2.1 11 5<br />
$13 to $18 25.2 7 15 23.0 15 7<br />
$19 to $25 11.2 8 22 9.4 22 8<br />
$26 to $35 1.4 9 32 0.3 32 9<br />
$ 3 to $35 43.9 7 17 38.8 16 6<br />
The weighted average grant-date fair value of the 24,000<br />
options granted in <strong>2006</strong> was $13, and the options had a weighted<br />
average exercise price of $34. The weighted average grant-date<br />
fair value of the 1.4 million options granted in 2005 was $13. The<br />
weighted average grant-date fair value of the 7.0 million options<br />
granted in 2004 was $8. The total intrinsic value of options outstanding<br />
at year-end <strong>2006</strong> was $1,368 million, and the total<br />
intrinsic value for stock options exercisable as of year-end <strong>2006</strong>,<br />
was $1,233 million. The total intrinsic value of stock options exercised<br />
during <strong>2006</strong>, 2005 and 2004 was approximately $309 million,<br />
$173 million and $182 million, respectively.<br />
Employee share appreciation rights (“Employee SARs”) may be<br />
granted to officers and key employees at exercise prices or strike<br />
prices equal to the market price of our Class A Common Stock on<br />
the date of grant. Employee SARs expire 10 years after the date of<br />
grant and generally both vest and are exercisable in cumulative<br />
installments of one quarter at the end of each of the first four<br />
years following the date of grant. Non-employee share appreciation<br />
rights (“Non-employee SARs”) may be granted to directors at<br />
exercise prices or strike prices equal to the market price of our<br />
Class A Common Stock on the date of grant. Non-employee SARs<br />
expire 10 years after the date of grant and vest upon grant; however<br />
they are generally not exercisable until one year after grant.<br />
We first began issuing share appreciation rights in <strong>2006</strong>.<br />
Employees or Non-employee directors shall receive a number of<br />
shares of Common Stock of the Company equal to the number of<br />
share appreciation rights that are being exercised multiplied by<br />
the quotient of (a) the final value minus the base value, divided by<br />
(b) the final value.<br />
We recognized compensation expense of $3 million for <strong>2006</strong><br />
associated with Employee SARs and Non-employee SARs. At the<br />
end of <strong>2006</strong>, there was approximately $4 million in deferred compensation<br />
costs related to share appreciation rights. Upon the<br />
exercise of share appreciation rights, shares are issued from treasury<br />
shares. During <strong>2006</strong>, we granted 0.5 million Employee SARs<br />
with a weighted average base value of $34 and a weighted average<br />
grant-date fair value of $13, and we also granted 8,000 Nonemployee<br />
SARs with a weighted average base value of $37 and a<br />
weighted average grant-date fair value of $18. No share appreciation<br />
rights have expired or been forfeited.The total intrinsic value<br />
of SARs outstanding at year-end <strong>2006</strong> was $7 million, and the total<br />
intrinsic value of SARs exercisable as of year-end <strong>2006</strong> was zero.<br />
MARRIOTT INTERNATIONAL, INC. <strong>2006</strong> | 49
In 2004, we estimated the fair value of each stock option<br />
granted on the date of grant using the Black-Scholes optionpricing<br />
method. Beginning in 2005 we began using a binomial<br />
method to estimate the fair value of each stock option or SAR<br />
granted. The assumptions for stock options for all years and<br />
employee SARs for <strong>2006</strong> are noted in the following table:<br />
<strong>2006</strong> 2005 2004<br />
<strong>Annual</strong> dividends $0.22 $0.18 $0.16<br />
Expected volatility 30% 30% 31%<br />
Risk-free interest rate 4.5% 4.1% 3.7%<br />
Expected life (in years) 7 8 7<br />
For Non-employee SARs issued in <strong>2006</strong>, the only differences<br />
in the assumptions versus employee SARs are that a risk-free<br />
interest rate of 5.0 percent was used and an expected life of<br />
10 years was used.<br />
We also issue deferred stock units to Non-employee directors.<br />
These Non-employee director deferred stock units vest<br />
within one year and are distributed upon election. At year-end<br />
<strong>2006</strong> and year-end 2005, there was approximately $152,000 and<br />
$149,000, respectively, in deferred costs related to Nonemployee<br />
director deferred stock units. We recognized sharebased<br />
expense associated with Non-employee director deferred<br />
stock units of $325,000, $593,000, and $503,000 for <strong>2006</strong>, 2005<br />
and 2004, respectively. During <strong>2006</strong> we granted 18,000 Nonemployee<br />
director deferred stock units with a weighted average<br />
grant-date fair value of $37. For each of 2005 and 2004, we<br />
granted 21,000 Non-employee director deferred stock units with<br />
weighted average grant-date fair values of $32 and $23, respectively.<br />
The aggregate intrinsic value of Non-employee director<br />
deferred stock units distributed during <strong>2006</strong>, 2005 and 2004, was<br />
$1.7 million, $0.2 million and $10,000, respectively. At year-end<br />
<strong>2006</strong> and year-end 2005, there were 203,000 and 231,000,<br />
respectively, Non-employee deferred stock units outstanding,<br />
and the weighted average grant-date fair value of those outstanding<br />
deferred stock units was $21 and $19, respectively.<br />
Although the Comprehensive Plan also provides for issuance<br />
of deferred stock bonus awards, deferred stock awards, and<br />
restricted stock awards, our Compensation Policy Committee<br />
indefinitely suspended the issuance of deferred bonus stock<br />
commencing with our 2001 fiscal year and the issuance of both<br />
deferred stock awards and restricted stock awards commencing<br />
with the 2003 fiscal year. At year-end <strong>2006</strong> and year-end 2005,<br />
there was approximately $8 million and $14 million, respectively,<br />
in deferred compensation costs related to these suspended<br />
award programs, and the weighted average remaining term was<br />
two years for such award grants outstanding at year-end <strong>2006</strong>.<br />
Share-based compensation expense associated with these suspended<br />
award programs was $6 million, $10 million and $12 million<br />
for <strong>2006</strong>, 2005 and 2004, respectively.<br />
At year-end <strong>2006</strong>, 71 million shares were reserved under the<br />
Comprehensive Plan including 44 million shares under the Stock<br />
Option Program and Share Appreciation Right Program. Under<br />
the provisions of FAS No. 123(R), the “Deferred compensation” line<br />
on our Consolidated Balance Sheet, a contra-equity line representing<br />
the amount of unrecognized share-based compensation<br />
50 | MARRIOTT INTERNATIONAL, INC. <strong>2006</strong><br />
costs, is no longer presented. Accordingly, in <strong>2006</strong> we reversed<br />
the amount that had been on the “Deferred compensation” line<br />
at year-end 2005 through the “Additional paid-in-capital” line on<br />
our Consolidated Balance Sheet.<br />
5 | EARNINGS PER SHARE<br />
The following table illustrates the reconciliation of the earnings<br />
and number of shares used in the basic and diluted earnings per<br />
share calculations.<br />
(in millions, except per share amounts) <strong>2006</strong> 2005 2004<br />
Computation of Basic Earnings Per Share<br />
Income from continuing operations<br />
for basic earnings per share $ 717 $ 668 $ 594<br />
Weighted average shares outstanding<br />
Basic earnings per share from<br />
404.1 432.7 453.1<br />
continuing operations $1.77 $1.55 $1.31<br />
Computation of Diluted Earnings Per Share<br />
Income from continuing operations<br />
for diluted earnings per share $ 717 $ 668 $ 594<br />
Weighted average shares outstanding<br />
Effect of dilutive securities<br />
Employee stock option and share<br />
404.1 432.7 453.1<br />
appreciation rights plan 20.2 19.0 16.8<br />
Deferred stock incentive plan 3.4 7.5 8.5<br />
Restricted stock units 2.5 3.1 1.8<br />
Convertible debt — — 0.7<br />
Shares for diluted earnings per share<br />
Diluted earnings per share from<br />
430.2 462.3 480.9<br />
continuing operations $1.66 $1.45 $1.24<br />
We compute the effect of dilutive securities using the treasury<br />
stock method and average market prices during the period.We<br />
determine dilution based on earnings from continuing operations.<br />
6 | INVENTORY<br />
Inventory, totaling $1,208 million and $1,164 million as of<br />
December 29, <strong>2006</strong> and December 30, 2005, respectively, consists<br />
primarily of Timeshare segment interval, fractional and<br />
whole ownership products totaling $1,166 million and<br />
$1,116 million as of December 29, <strong>2006</strong>, and December 30, 2005,<br />
respectively. Inventory totaling $42 million and $48 million as of<br />
December 29, <strong>2006</strong>, and December 30, 2005, respectively, relates<br />
to hotel operating supplies for the limited number of hotels we<br />
own or lease and synthetic fuel. We value Timeshare segment<br />
interval, fractional and whole ownership products and Synthetic<br />
Fuel segment inventory at the lower of cost or net realizable<br />
value and generally value operating supplies at the lower of cost<br />
(using the first-in, first-out method) or market. Timeshare segment<br />
interval, fractional and whole ownership products inventory,<br />
which has an operating cycle that exceeds twelve months,<br />
is classified as a current asset consistent with recognized industry<br />
practice.
7 | PROPERTY AND EQUIPMENT<br />
($ in millions) <strong>2006</strong> 2005<br />
Land $ 316 $ 301<br />
Buildings and leasehold improvements 724 659<br />
Furniture and equipment 888 827<br />
Construction in progress 215 132<br />
2,143 1,919<br />
Accumulated depreciation (905) (785)<br />
$1,238 $1,134<br />
We record property and equipment at cost, including interest,<br />
rent and real estate taxes incurred during development and<br />
construction. Interest capitalized as a cost of property and<br />
equipment totaled $32 million in <strong>2006</strong>, $30 million in 2005, and<br />
$16 million in 2004. We capitalize the cost of improvements that<br />
extend the useful life of property and equipment when incurred.<br />
These capitalized costs may include structural costs, equipment,<br />
fixtures, floor and wall coverings. All repair and maintenance<br />
costs are expensed as incurred. We compute depreciation using<br />
the straight-line method over the estimated useful lives of the<br />
assets (three to 40 years), and we amortize leasehold improvements<br />
over the shorter of the asset life or lease term.<br />
Depreciation expense totaled $155 million in <strong>2006</strong>, $156 million<br />
in 2005, and $133 million in 2004.<br />
8 | ACQUISITIONS AND DISPOSITIONS<br />
<strong>2006</strong> Acquisitions<br />
During <strong>2006</strong>, we acquired one full-service property for $130 million<br />
including aggregate cash consideration of $46 million plus<br />
the assumption of debt. In addition we acquired three other fullservice<br />
properties for aggregate cash consideration of $134 million.<br />
We plan to sell all four properties to third-party owners, and<br />
we classified the balances related to these properties as “Assets<br />
held for sale” and “Liabilities of assets held for sale” on our<br />
Consolidated Balance Sheet.<br />
<strong>2006</strong> Dispositions<br />
In <strong>2006</strong> we sold our interest in the 50/50 joint venture with<br />
Whitbread PLC (“Whitbread”), which held 46 hotels consisting of<br />
more than 8,000 rooms, and we received approximately $164 million<br />
in cash, net of transaction costs, which was approximately<br />
equal to the investment’s book value. We continue to manage<br />
the hotels under the Marriott Hotels & Resorts and Renaissance<br />
Hotels & Resorts brands. For additional information regarding<br />
this joint venture, see Footnote No. 10,“Marriott and Whitbread<br />
Joint Venture.”We also sold our minority interest in five other<br />
joint ventures during <strong>2006</strong> for cash proceeds of $64 million and<br />
recognized gains of $43 million. Additionally, one cost method<br />
investee redeemed the preferred stock we held for $81 million in<br />
cash consideration, and we recognized income of $25 million on<br />
the redemption.<br />
During <strong>2006</strong> we also sold 10 full-service properties for cash<br />
proceeds of $487 million and recognized gains totaling $14 million.<br />
We accounted for each of the sales under the full accrual<br />
method in accordance with FAS No. 66,“Accounting for Sales of<br />
Real Estate,” and will continue to operate eight of the properties<br />
under long-term management agreements. The sold properties<br />
included eight properties purchased in 2005 from CTF Holdings<br />
Ltd. and certain of its affiliates (collectively “CTF”). For additional<br />
information regarding the CTF transaction, see the “2005<br />
Acquisitions” caption later in this footnote. Prior to the sale of<br />
one property, balances associated with that property were<br />
reclassified in conformity with other “held and used” properties,<br />
in the first half of <strong>2006</strong> as the property was not expected to be<br />
sold, within one year of its classification as “held for sale.” In conjunction<br />
with that reclassification, we recorded depreciation<br />
expense of $2 million in the first half of <strong>2006</strong> that would have<br />
been recognized had the asset been continuously classified as<br />
“held and used.” Cash proceeds of $26 million for one hotel sold<br />
in <strong>2006</strong> are not reflected in the disposition proceeds of $487 million<br />
as the proceeds were initially recorded as a deposit because<br />
of a contingency and impacted the “Other investing activities”<br />
section of our Consolidated Statement of Cash Flows rather than<br />
dispositions. The contingency was subsequently resolved and<br />
sale of accounting was achieved in <strong>2006</strong>. Other asset sales generated<br />
cash proceeds of $2 million.<br />
Late in <strong>2006</strong>, we sold a 75 percent interest in a joint venture<br />
to a third party for its book value of $14 million. At the time of<br />
the sale, the joint venture’s only asset was a parcel of land. In<br />
conjunction with the sale, we made a $25 million bridge loan to<br />
the joint venture, which matures on February 28, 2007. Following<br />
the guidance found in EITF 98-8,“Accounting for Transfers of<br />
Investments That Are in Substance Real Estate,” and FAS No. 66,<br />
“Accounting for Sales of Real Estate,” due to our continuing<br />
involvement with the joint venture, we are consolidating the<br />
joint venture for the period of time that the bridge loan remains<br />
outstanding. Subsequent to the bridge loan’s repayment, we will<br />
account for our remaining interest in the joint venture under the<br />
equity method as required by APB 18,“The Equity Method of<br />
Accounting for Investments in Common Stock.”<br />
In 1988, the Company as landlord, entered into a 59-year<br />
ground lease with a lessee for land that was improved with a<br />
hotel that is owned by the lessee.The hotel was previously<br />
branded a Marriott property; however, currently it is not.The lease<br />
contains contractual rental increases over the term of the lease,<br />
and annual ground rent on the land currently totals approximately<br />
$5 million.The lease also contains a provision that permits<br />
the lessee, under certain circumstances, to purchase the land for a<br />
fixed price.The Company and the lessee have had various discussions<br />
concerning the land as well as the hotel. During the <strong>2006</strong><br />
second quarter, it became probable that none of the proposed<br />
transactions were acceptable to both parties, and the lessee indicated<br />
its intent to exercise its option to purchase the land.<br />
Accordingly, in the <strong>2006</strong> second quarter, we reclassified the land<br />
from the “Property and equipment” caption in our Consolidated<br />
Balance Sheet to the “Assets held for sale” caption and recorded a<br />
$37 million non-cash charge to adjust the carrying amount to net<br />
realizable value. Additional amounts may be due us depending on<br />
the lessee’s use of the land subsequent to purchase; however, such<br />
amounts will only be recorded if and when paid.<br />
2005 Acquisitions<br />
During the third quarter of 2005, we purchased from CTF Holdings<br />
Ltd. and certain of its affiliates (collectively “CTF”) 13 properties (in<br />
each case through a purchase of real estate, a purchase of the<br />
entity that owned the hotel, or an assignment of CTF’s leasehold<br />
MARRIOTT INTERNATIONAL, INC. <strong>2006</strong> | 51
ights) and certain joint venture interests from CTF for an aggregate<br />
price of $381 million. Prior to the sale, all of the properties<br />
were operated by us or our subsidiaries.<br />
At the purchase date, we planned to sell eight of the properties<br />
to third-party owners, and the balances related to these fullservice<br />
properties were classified within the “Assets held for sale”<br />
and “Liabilities of assets held for sale” captions in our<br />
Consolidated Balance Sheet at year-end 2005. All eight properties<br />
were sold in <strong>2006</strong>. One operating lease terminated in 2005. We<br />
operate the four remaining properties under leases, three of<br />
which expire by 2012. Under the purchase and sale agreement<br />
we signed with CTF in the second quarter of 2005, we were obligated<br />
to purchase two additional properties for $17 million, the<br />
acquisition of which was postponed pending receipt of certain<br />
third-party consents. We did not purchase these additional two<br />
properties and the obligation has expired.<br />
On the closing date we and CTF also modified management<br />
agreements on 29 other CTF-leased hotels, 28 located in Europe<br />
and one located in the United States. We became secondarily<br />
liable for annual rent payments for certain of these hotels when<br />
we acquired the Renaissance Hotel Group N.V. in 1997. We continue<br />
to manage 16 of these hotels under new long-term management<br />
agreements; however, due to certain provisions in the<br />
management agreements, we account for these contracts as<br />
operating leases. CTF placed approximately $89 million in trust<br />
accounts to cover possible shortfalls in cash flow necessary to<br />
meet rent payments under these leases. In turn, we released CTF<br />
from its guarantees in connection with these leases.<br />
Approximately $69 million remained in these trust accounts at<br />
the end of <strong>2006</strong>. Our financial statements reflect us as lessee on<br />
these hotels. Minimum lease payments relating to these leases<br />
are as follows: $35 million in 2007; $35 million in 2008; $36 million<br />
in 2009; $36 million in 2010; $32 million in 2011; and<br />
$214 million thereafter, for a total of $388 million.<br />
For the remaining 13 European leased hotels, CTF may terminate<br />
management agreements with us if and when CTF obtains<br />
releases from landlords of our back-up guarantees. Pending completion<br />
of the CTF-landlord agreements, we continue to manage<br />
these hotels under modified management agreements and<br />
remain secondarily liable under certain of these leases. We are<br />
also secondarily obligated for real estate taxes and other charges<br />
associated with the leases. Third parties have severally indemnified<br />
us for all payments we may be required to make in connection<br />
with these obligations. Since we assumed these guarantees,<br />
we have not funded any amounts, and we do not expect to fund<br />
any amounts under these guarantees in the future. CTF has made<br />
available €35 million in cash collateral in the event that we are<br />
required to fund under such guarantees. As CTF obtains releases<br />
from the landlords and these hotels exit the system, our contingent<br />
liability exposure of approximately $218 million will decline.<br />
We also continue to manage three hotels in the United<br />
Kingdom under amended management agreements with CTF<br />
and continue to manage 14 properties in Asia on behalf of New<br />
World Development Company Limited and its affiliates. CTF’s<br />
principals are officers, directors and stockholders of New World<br />
Development Company Limited. At the closing date, the owners<br />
of the United Kingdom and Asian hotels agreed to invest<br />
$17 million to renovate those properties.<br />
We and CTF also exchanged legal releases effective as of the<br />
closing date, and litigation and arbitration that was outstanding<br />
between the two companies and their affiliates was dismissed.<br />
52 | MARRIOTT INTERNATIONAL, INC. <strong>2006</strong><br />
Simultaneously with the closing on the foregoing transactions,<br />
CTF also sold five properties and one minority joint venture<br />
interest to Sunstone Hotel Investors, Inc. (“Sunstone”) for<br />
$419 million, eight properties to Walton Street Capital, L.L.C.<br />
(“Walton Street”) for $578 million, and two properties to<br />
Tarsadia Hotels (“Tarsadia”) for $29 million, in each case as substitute<br />
purchasers under our purchase and sale agreement with<br />
CTF. Prior to consummation of the sales, we also operated all of<br />
these properties. At closing, Walton Street and Sunstone<br />
entered into new long-term management agreements with us<br />
and agreed to invest a combined $68 million to further upgrade<br />
the 13 properties they acquired. The two properties purchased<br />
by Tarsadia are being operated under short-term management<br />
and franchise agreements.<br />
When we signed the purchase and sale agreement for the<br />
foregoing transactions in the 2005 second quarter, we recorded<br />
a $94 million pre-tax charge primarily due to the non-cash writeoff<br />
of deferred contract acquisition costs associated with the termination<br />
of the existing management agreements for properties<br />
involved in these transactions. As described above, we entered<br />
into new long-term management agreements with CTF, Walton<br />
Street and Sunstone at the closing of the transactions, and we<br />
expect to sell most of the properties we acquired subject to<br />
long-term management agreements.<br />
In 2005 we also purchased two full-service properties, one in<br />
Paris, France, and the other in Munich, Germany, for aggregate<br />
cash consideration of $146 million. We planned to sell these two<br />
full-service properties to third-party owners, and the balances<br />
related to these properties were classified within the “Assets<br />
held for sale” and “Liabilities of assets held for sale” line items on<br />
our Consolidated Balance Sheet at year-end 2005. The property<br />
in Paris, France, was sold in <strong>2006</strong>. The balances associated with<br />
the Munich, Germany, property were reclassified, in conformity<br />
with other “held and used” properties in the <strong>2006</strong> fourth quarter<br />
as the property was not sold, as expected, within one year of its<br />
classification as “held for sale.” In conjunction with that reclassification,<br />
we recorded depreciation expense of $5 million in the<br />
<strong>2006</strong> fourth quarter that would have been recognized had the<br />
asset been continuously classified as “held and used.”<br />
2005 Dispositions<br />
Late in 2005, we contributed land underlying an additional<br />
nine Courtyard hotels, worth approximately $40 million, to CBM<br />
Land Joint Venture limited partnership (“CBM Land JV”), a joint<br />
venture the majority of which was owned, at the time of the<br />
transaction, by Sarofim Realty Advisors (“Sarofim”) on behalf of<br />
an institutional investor, thereby obtaining a 23 percent equity<br />
stake in CBM Land JV. At the same time we completed the sale<br />
of a portfolio of land underlying 75 Courtyard by Marriott hotels<br />
for approximately $246 million in cash to CBM Land JV. In conjunction<br />
with this transaction, we recognized a gain of $17 million<br />
in 2005, we deferred recognition of a $5 million of gain due<br />
to our minority interest in the joint venture, and we also<br />
deferred recognition of a $40 million of gain due to contingencies<br />
in the transaction documents. As those contingencies expire<br />
in subsequent years, we will recognize additional gains.<br />
We also sold a number of other land parcels in 2005 for<br />
$38 million in cash, net of transaction costs, and recognized<br />
gains totaling $6 million, and we sold two minority interests<br />
in joint ventures for $14 million in cash and recognized gains<br />
totaling $7 million.
2004 Dispositions<br />
We sold two lodging properties for $79 million in cash, net of<br />
transaction costs, recognized gains totaling $6 million and<br />
deferred recognition of gains totaling $1 million due to our continuing<br />
involvement with the two properties. None of the deferred<br />
gains were recognized in 2005. We accounted for both sales<br />
under the full accrual method in accordance with FAS No. 66,<br />
“Accounting for Sales of Real Estate,” and will continue to operate<br />
the properties under long-term management agreements.<br />
We also sold 30 land parcels for $55 million in cash, net of transaction<br />
costs, and we recorded gains of $12 million.<br />
Additionally, we sold our Ramada International Hotels &<br />
Resorts franchised brand, which consisted primarily of investments<br />
in franchise contracts and trademarks and licenses outside<br />
of the United States, to Cendant Corporation’s Hotel Group<br />
for $33 million in cash, net of transaction costs, and recorded a<br />
gain of $4 million.<br />
Cendant exercised its option to redeem our interest in the<br />
Two Flags joint venture, and as a result Cendant acquired the<br />
trademarks and licenses for the Ramada and Days Inn lodging<br />
brands in the United States. We recorded a gain of approximately<br />
$13 million in connection with this transaction. We also<br />
sold our interests in two joint ventures for $13 million in cash<br />
and recognized gains totaling $6 million.<br />
9 | GOODWILL AND INTANGIBLE ASSETS<br />
($ in millions) <strong>2006</strong> 2005<br />
Contract acquisition costs and other $ 809 $ 679<br />
Accumulated amortization (234) (213)<br />
$ 575 $ 466<br />
Goodwill $1,049 $1,052<br />
Accumulated amortization (128) (128)<br />
$ 921 $ 924<br />
We capitalize costs incurred to acquire management, franchise,<br />
and license agreements that are both direct and incremental.<br />
We amortize these costs on a straight-line basis over the<br />
initial term of the agreements, typically 15 to 30 years. We evaluate<br />
the carrying values of intangible assets for impairment under<br />
the provisions of FAS No. 142,“Goodwill and Other Intangible<br />
Assets.” Amortization expense totaled $33 million in <strong>2006</strong>,<br />
$28 million in 2005, and $33 million in 2004.<br />
10 | MARRIOTT AND WHITBREAD JOINT VENTURE<br />
During the 2005 second quarter we established a 50/50 joint<br />
venture with Whitbread to acquire Whitbread’s portfolio of<br />
46 franchised Marriott and Renaissance properties consisting of<br />
more than 8,000 rooms, and for us to take over management of<br />
the entire portfolio of hotels upon the transfer of the hotels to<br />
the new joint venture. Whitbread sold its interest in the 46 hotels<br />
to the joint venture for approximately £995 million. Whitbread<br />
received approximately £710 million in cash (including £620 million<br />
from senior debt proceeds) and 50 percent of the preferred<br />
and ordinary shares of the joint venture and non-voting<br />
deferred consideration shares valued at £285 million. We contributed<br />
approximately £90 million ($171 million) in the second<br />
quarter of 2005 for the remaining 50 percent of the preferred<br />
and ordinary shares of the joint venture.<br />
In the <strong>2006</strong> second quarter we sold our interest in the<br />
Whitbread joint venture and we received approximately<br />
$164 million in cash, net of transaction costs, which was equal to<br />
the investment’s book value at the time the transaction closed.<br />
The change between the initial investment and the book value at<br />
the time of sale primarily related to foreign currency fluctuations.<br />
As we hedged our foreign currency exposure on this investment,<br />
the income statement impact resulting from the change in value<br />
was immaterial. We continue to manage the hotels under the<br />
Marriott Hotels & Resorts and Renaissance Hotels & Resorts<br />
brands pursuant to new long-term management agreements<br />
that were entered into concurrent with the sale.<br />
11 | NOTES RECEIVABLE<br />
($ in millions) <strong>2006</strong> 2005<br />
Loans to timeshare owners $ 386 $344<br />
Lodging senior loans 9 59<br />
Lodging mezzanine and other loans 268 274<br />
663 677<br />
Less current portion (103) (48)<br />
$ 560 $629<br />
We classify notes receivable due within one year as current<br />
assets in the caption “Accounts and notes receivable” in the<br />
accompanying Consolidated Balance Sheet, including $70 million<br />
and $33 million, as of year-end <strong>2006</strong> and year-end 2005,<br />
respectively, related to “Loans to timeshare owners.”<br />
Our notes receivable are due as follows: 2007–$103 million;<br />
2008–$65 million; 2009–$40 million; 2010-$120 million;<br />
2011–$69 million; and $266 million thereafter. The <strong>2006</strong> notes<br />
receivable balance is net of unamortized discounts totaling<br />
$28 million and the 2005 notes receivable balance is net of<br />
unamortized discounts totaling $28 million. Gains from the sale<br />
of notes receivable totaled approximately $79 million, $94 million,<br />
and $69 million during <strong>2006</strong>, 2005, and 2004, respectively.<br />
Lodging Senior Loans and Lodging Mezzanine and<br />
Other Loans<br />
Interest income associated with “Lodging senior loans” and<br />
“Lodging mezzanine and other loans” was reflected in the<br />
accompanying Consolidated Statement of Income in the<br />
“Interest income” caption. We do not accrue interest on “Lodging<br />
senior loans” and “Lodging mezzanine and other loans” that are<br />
impaired. At year-end <strong>2006</strong>, our recorded investment in impaired<br />
“Lodging senior loans” and “Lodging mezzanine and other loans”<br />
was $92 million, and we had a $70 million allowance for credit<br />
losses, leaving $22 million of our investment in impaired loans<br />
for which there was no related allowance for credit losses. At<br />
year-end 2005, our recorded investment in impaired “Lodging<br />
senior loans” and “Lodging mezzanine and other loans” was<br />
$184 million, and we had a $103 million allowance for credit<br />
losses, leaving $81 million of our investment in impaired loans<br />
for which there was no related allowance for credit losses.<br />
During <strong>2006</strong> and 2005, our average investment in impaired<br />
loans totaled $138 million and $182 million, respectively.<br />
MARRIOTT INTERNATIONAL, INC. <strong>2006</strong> | 53
The following table summarizes the activity related to our<br />
“Lodging senior loans” and “Lodging mezzanine and other loans”<br />
notes receivable reserve for 2004, 2005 and <strong>2006</strong>:<br />
($ in millions) Notes Receivable Reserve<br />
Year-end 2003 balance $130<br />
Additions 3<br />
Reversals (11)<br />
Write-offs (44)<br />
Transfers and other 14<br />
Year-end 2004 balance 92<br />
Additions 11<br />
Reversals —<br />
Write-offs (9)<br />
Transfers and other 9<br />
Year-end 2005 balance 103<br />
Additions —<br />
Reversals (5)<br />
Write-offs (38)<br />
Transfers and other 10<br />
Year-end <strong>2006</strong> balance $ 70<br />
Loans to Timeshare Owners<br />
The weighted average interest rate for our “Loans to timeshare<br />
owners” is 12.4 percent, and the interest rates associated with<br />
these loans ranges to 19.5 percent. Interest income associated<br />
with “Loans to timeshare owners” of $41 million, $38 million and<br />
$23 million for <strong>2006</strong>, 2005 and 2004, respectively, was reflected<br />
in the accompanying Consolidated Statement of Income in the<br />
“Timeshare sales and services” revenue caption. The recorded<br />
investment in “Loans to timeshare owners” on nonaccrual status<br />
at year-end <strong>2006</strong> and year-end 2005 totaled $67 million and<br />
$49 million, respectively. As noted in the “New Accounting<br />
Standards” caption of Footnote No. 1 “Summary of Significant<br />
Accounting Policies,” we established the reserve for “Loans to<br />
timeshare owners” notes receivable in <strong>2006</strong> in conjunction with<br />
the adoption of SOP 04-2.<br />
The following table summarizes the activity related to our<br />
“Loans to timeshare owners” notes receivable reserve for <strong>2006</strong>.<br />
($ in millions) Notes Receivable Reserve<br />
Year-end 2005 balance $ —<br />
Establishment of reserve 25<br />
Additions for current year sales 20<br />
Write-offs (16)<br />
Year-end <strong>2006</strong> balance $ 29<br />
12 | ASSET SECURITIZATIONS<br />
We periodically sell, without recourse, through special purpose<br />
entities, notes receivable originated by our Timeshare segment in<br />
connection with the sale of timeshare interval, fractional and<br />
whole ownership products. We continue to service the notes and<br />
transfer all proceeds collected to special purpose entities. We<br />
retain servicing assets and other interests in the notes which are<br />
accounted for as residual interests. The interests are limited to the<br />
present value of cash available after paying financing expenses<br />
and program fees, and absorbing credit losses. We have included<br />
gains from the sales of timeshare notes receivable totaling<br />
54 | MARRIOTT INTERNATIONAL, INC. <strong>2006</strong><br />
$77 million in <strong>2006</strong> within the “Timeshare sales and services” revenue<br />
caption in our Consolidated Statement of Income. Gains<br />
from the sale of timeshare notes receivable of $69 million in 2005<br />
and $64 million in 2004 are in the “Gains and other income” caption<br />
in the accompanying Consolidated Statement of Income.<br />
For additional information regarding the classification of gains<br />
from the sale of timeshare notes receivable, see the “Basis of<br />
Presentation” caption in Footnote No. 1,“Summary of Significant<br />
Accounting Policies.”We had residual interests of $221 million and<br />
$196 million, respectively, at year-end <strong>2006</strong> and year-end 2005<br />
which are recorded in the accompanying Consolidated Balance<br />
Sheet as other long-term receivables of $137 million and $125 million,<br />
respectively, and other current assets of $84 million and<br />
$71 million, respectively. In addition, in September <strong>2006</strong>, we repurchased<br />
notes receivable with a principal balance of $31 million<br />
and in November <strong>2006</strong>, sold those notes, along with $249 million<br />
of additional notes in a $280 million note securitization.The gain<br />
on the sale of these timeshare notes receivable is included in the<br />
amount disclosed above.<br />
At the date of sale and at the end of each reporting period, we<br />
estimate the fair value of residual interests, excluding servicing<br />
assets, using a discounted cash flow model. These transactions<br />
may utilize interest rate swaps to protect the net interest margin<br />
associated with the beneficial interest. We report in income<br />
changes in the fair value of residual interests, excluding servicing<br />
assets, as they are considered trading securities under the provisions<br />
of FAS No. 115,“Accounting for Certain Investments in Debt<br />
and Equity Securities.” During <strong>2006</strong>, 2005 and 2004, we recorded<br />
trading gains of $19 million, $2 million and $3 million, respectively.<br />
We used the following key assumptions to measure the fair<br />
value of the residual interests, excluding servicing assets, at the<br />
date of sale during <strong>2006</strong>, 2005, and 2004: average discount rate of<br />
9.22 percent, 8.56 percent and 7.80 percent, respectively; average<br />
expected annual prepayments, including defaults, of 25.22 percent,<br />
23.56 percent and 18.61 percent, respectively; expected weighted<br />
average life of prepayable notes receivable, excluding prepayments<br />
and defaults, of 70 months, 79 months and 83 months, respectively;<br />
and expected weighted average life of prepayable notes<br />
receivable, including prepayments and defaults, of 32 months,<br />
38 months and 42 months, respectively. Our key assumptions<br />
are based on experience.<br />
We used the following key assumptions in measuring the fair<br />
value of the residual interests, excluding servicing assets, in our<br />
nine outstanding note sales at year-end <strong>2006</strong>: an average discount<br />
rate of 9.21 percent; an average expected annual prepayment<br />
rate, including defaults, of 19.78 percent; an expected<br />
weighted average life of prepayable notes receivable, excluding<br />
prepayments and defaults, of 63 months; and an expected<br />
weighted average life of prepayable notes receivable, including<br />
prepayments and defaults of 35 months.<br />
At the date of sale, we measure servicing assets at their allocated<br />
previous carrying amount based on relative fair value.<br />
Servicing assets are classified as held to maturity under the provisions<br />
of FAS No. 115 and are recorded at amortized cost.<br />
Cash flows between us and third-party purchasers during <strong>2006</strong>,<br />
2005, and 2004, were as follows: net proceeds to us from new timeshare<br />
note sales of $508 million, $399 million and $312 million,<br />
respectively; repurchases by us of defaulted loans (over 150 days<br />
overdue) of $24 million, $23 million and $18 million, respectively;<br />
repurchases by us of other loans in <strong>2006</strong> of $31 million; servicing<br />
fees received by us of $5 million in <strong>2006</strong>, $4 million and $4 million,<br />
respectively; and cash flows received from our retained interests of<br />
$91 million, $86 million and $90 million, respectively.
At year-end <strong>2006</strong>, $1,123 million of principal remains outstanding<br />
in all sales in which we have a retained residual interest.<br />
Delinquencies of more than 90 days at year-end <strong>2006</strong><br />
amounted to $5 million. Existing reserves were adequate for<br />
defaulted loans that were resolved during <strong>2006</strong>. We have been<br />
able to resell timeshare units underlying defaulted loans without<br />
incurring material losses.<br />
We have completed a stress test on the fair value of the residual<br />
interests with the objective of measuring the change in<br />
value associated with independent changes in individual key<br />
variables. The methodology used applied unfavorable changes<br />
that would be considered statistically significant for the key variables<br />
of prepayment rate, discount rate and weighted average<br />
remaining term. The fair value of the residual interests was<br />
$221 million at year-end <strong>2006</strong>, before any stress test changes<br />
were applied. An increase of 100 basis points in the prepayment<br />
rate would decrease the year-end valuation by $4 million, or<br />
1.7 percent, and an increase of 200 basis points in the prepayment<br />
rate would decrease the year-end valuation by $7 million,<br />
or 3.3 percent. An increase of 100 basis points in the discount<br />
rate would decrease the year-end valuation by $5 million, or<br />
2.1 percent, and an increase of 200 basis points in the discount<br />
rate would decrease the year-end valuation by $9 million, or<br />
4.1 percent. A decline of two months in the weighted-average<br />
remaining term would decrease the year-end valuation by $2 million,<br />
or 1.0 percent, and a decline of four months in the weightedaverage<br />
remaining term would decrease the year-end valuation<br />
by $4 million, or 2.0 percent.<br />
13 | LONG-TERM DEBT<br />
Our long-term debt at year-end 2005 and year-end 2004 consisted<br />
of the following:<br />
($ in millions) <strong>2006</strong> 2005<br />
Senior Notes:<br />
Series C, interest rate of 7.875%,<br />
maturing September 15, 2009<br />
Series E, interest rate of 7.000%,<br />
$ 76 $ 76<br />
maturing January 15, 2008<br />
Series F, interest rate of 4.625%,<br />
91 91<br />
maturing June 15, 2012<br />
Series G, interest rate of 5.810%,<br />
349 348<br />
maturing November 10, 2015<br />
Series H, interest rate of 6.200%,<br />
399 396<br />
maturing June 15, 2016<br />
Commercial paper, average interest<br />
349 —<br />
rate of 5.4% at year-end <strong>2006</strong><br />
Mortgage debt, average interest<br />
rate of 7.9% at year-end <strong>2006</strong>,<br />
315 499<br />
maturing May 1, 2025 167 171<br />
Other 87 156<br />
1,833 1,737<br />
Less current portion (15) (56)<br />
$1,818 $1,681<br />
As of year-end <strong>2006</strong>, all debt, other than mortgage debt and<br />
$1 million of other debt, is unsecured.<br />
We are party to a multicurrency revolving credit agreement<br />
that provides for borrowings of up to $2.0 billion which supports<br />
our commercial paper program and letters of credit.<br />
Borrowings under the facility bear interest at the London<br />
Interbank Offered Rate (LIBOR) plus a spread, based on our public<br />
debt rating. Additionally, we pay annual fees on the facility at<br />
a rate also based on our public debt rating. In the <strong>2006</strong> second<br />
quarter, we executed an amendment that extended the maturity<br />
date for $1.955 billion of commitments under this agreement by<br />
one year to June 6, 2011. The remaining $45 million commitment<br />
still matures on June 6, 2010.<br />
In 2005 we began issuing short-term commercial paper in<br />
Europe in addition to our long-standing commercial paper program<br />
in the United States. Our U.S. and European commercial<br />
paper issuances are subject to the availability of the commercial<br />
paper market, as we have no commitment from buyers to purchase<br />
our commercial paper. We reserve unused capacity under<br />
our credit facility to repay outstanding commercial paper borrowings<br />
in the event that the commercial paper market is not<br />
available to us for any reason when outstanding borrowings<br />
mature. We classify commercial paper as long-term debt based<br />
on our ability and intent to refinance it on a long-term basis.<br />
During the <strong>2006</strong> second quarter, we sold $350 million<br />
aggregate principal amount of 6.200 percent Series H Notes<br />
due 2016 (the “Notes”). We received net proceeds of approximately<br />
$347 million from this offering, after deducting a discount,<br />
underwriting fees, and other expenses, and we used<br />
these proceeds to repay commercial paper borrowings and<br />
for general corporate purposes.<br />
Interest on the Notes is paid on June 15 and December 15<br />
of each year, with the first interest payment occurring on<br />
December 15, <strong>2006</strong>. The Notes will mature on June 15, 2016, and<br />
are redeemable, in whole or in part, at any time and from time to<br />
time under the terms provided in the Form of Note. The Notes<br />
were issued under an indenture with JPMorgan Chase Bank, N.A.<br />
(formerly known as The Chase Manhattan Bank), as trustee,<br />
dated November 16, 1998.<br />
On December 8, 2005, we filed a “universal shelf” registration<br />
statement with the SEC covering an indeterminate amount of<br />
future offerings of debt securities, common stock or preferred<br />
stock, either separately or represented by warrants, depositary<br />
shares, rights or purchase contracts.<br />
We are in compliance with covenants in our loan agreements,<br />
which require the maintenance of certain financial ratios<br />
and minimum shareholders’ equity, and also include, among<br />
other things, limitations on additional indebtedness and the<br />
pledging of assets.<br />
Aggregate debt maturities are: 2007–$15 million;<br />
2008–$108 million; 2009–$94 million; 2010–$18 million;<br />
2011–$19 million and $1,579 million thereafter.<br />
Cash paid for interest, net of amounts capitalized, was<br />
$73 million in <strong>2006</strong>, $87 million in 2005 and $88 million in 2004.<br />
MARRIOTT INTERNATIONAL, INC. <strong>2006</strong> | 55
14 | SELF-INSURANCE RESERVE FOR LOSSES AND<br />
14 | LOSS ADJUSTMENT EXPENSES<br />
The activity in the reserve for losses and loss adjustment<br />
expenses is summarized as follows:<br />
($ in millions) <strong>2006</strong> 2005<br />
Balance at beginning of year $264 $234<br />
Less: reinsurance recoverable (24) (23)<br />
Net balance at beginning of year<br />
Incurred related to:<br />
240 211<br />
Current Year 122 139<br />
Prior year (20) (26)<br />
Total incurred<br />
Paid related to:<br />
102 113<br />
Current Year (37) (24)<br />
Prior year (50) (60)<br />
Total paid (87) (84)<br />
Net balance at end of year 255 240<br />
Add: reinsurance recoverable 16 24<br />
Balance at end of year $271 $264<br />
The provision for unpaid loss and loss adjustment expenses<br />
decreased by $20 million and $26 million in <strong>2006</strong> and 2005,<br />
respectively, as a result of changes in estimates from insured<br />
events of the prior years due to changes in underwriting experience<br />
and frequency and severity trends. The year-end <strong>2006</strong> selfinsurance<br />
reserve of $271 million is comprised of a current<br />
portion of $87 million and a long-term portion of 184 million.<br />
The year-end 2005 self-insurance reserve of $264 million is comprised<br />
of a current portion of $84 million and a long-term portion<br />
of $180 million.<br />
15 | SHAREHOLDERS’ EQUITY<br />
Eight hundred million shares of our Class A Common Stock, with<br />
a par value of $.01 per share, are authorized, and 10 million<br />
shares of preferred stock, without par value, are authorized. As of<br />
the <strong>2006</strong> fiscal year-end, there were 389.5 million shares of our<br />
Class A Common Stock outstanding and no shares of our preferred<br />
stock were outstanding.<br />
On March 27, 1998, our Board of Directors adopted a shareholder<br />
rights plan under which one preferred stock purchase<br />
right was distributed for each share of our Class A Common<br />
Stock. Each right entitles the holder to buy 1/1000th of a share<br />
of a newly issued series of junior participating preferred stock of<br />
the Company at an exercise price of $175. The rights may not<br />
presently be exercised, but will be exercisable 10 days after a<br />
person or group acquires beneficial ownership of 20 percent or<br />
more of our Class A Common Stock or begins a tender or<br />
exchange for 30 percent or more of our Class A Common Stock.<br />
Shares owned by a person or group on March 27, 1998, and held<br />
continuously thereafter, are exempt for purposes of determining<br />
beneficial ownership under the rights plan. The rights are nonvoting<br />
and will expire on March 27, 2008, the tenth anniversary<br />
of the adoption of the shareholder rights plan unless previously<br />
exercised or redeemed by us for $.01 each. If we are involved in<br />
a merger or certain other business combinations not approved<br />
by the Board of Directors, each right entitles its holder, other<br />
than the acquiring person or group, to purchase common stock<br />
56 | MARRIOTT INTERNATIONAL, INC. <strong>2006</strong><br />
of either the Company or the acquirer having a value of twice<br />
the exercise price of the right.<br />
Accumulated other comprehensive income of $44 million at<br />
year-end <strong>2006</strong> primarily consisted of gains totaling $35 million<br />
associated with available-for-sale securities and gains totaling<br />
$12 million associated with foreign currency translation adjustments.<br />
Accumulated other comprehensive loss of $11 million at<br />
year-end 2005 consisted primarily of losses totaling $16 million<br />
associated with foreign currency translation adjustments which<br />
were partially offset by gains totaling $8 million associated with<br />
available-for-sale securities.<br />
16 | FAIR VALUE OF FINANCIAL INSTRUMENTS<br />
We believe that the fair values of current assets and current<br />
liabilities approximate their reported carrying amounts. The fair<br />
values of non-current financial assets, liabilities and derivatives<br />
are shown in the following table.<br />
<strong>2006</strong> 2005<br />
Carrying Fair Carrying Fair<br />
($ in millions)<br />
Notes and other<br />
Amount Value Amount Value<br />
long-term assets<br />
Long-term debt and other<br />
$ 993 $ 996 $1,374 $1,412<br />
long-term liabilities $1,816 $1,847 $1,636 $1,685<br />
Derivative instruments $ 6 $ 6 $ 6 $ 6<br />
We value notes and other receivables based on the expected<br />
future cash flows discounted at risk-adjusted rates. We determine<br />
valuations for long-term debt and other long-term liabilities<br />
based on quoted market prices or expected future<br />
payments discounted at risk-adjusted rates.<br />
17 | DERIVATIVE INSTRUMENTS<br />
During 2003, we entered into an interest rate swap agreement<br />
under which we receive a floating rate of interest and pay a fixed<br />
rate of interest. The swap modifies our interest rate exposure by<br />
effectively converting a note receivable with a fixed rate to a<br />
floating rate. The aggregate notional amount of the swap is<br />
$92 million and it matures in 2010. The swap is classified as a<br />
fair value hedge under FAS No. 133,“Accounting for Derivative<br />
Instruments and Hedging Activities” (“FAS No. 133”), and the<br />
change in the fair value of the swap, as well as the change in the<br />
fair value of the underlying note receivable, is recognized in<br />
interest income. The fair value of the swap was a $1 million asset<br />
at year-end <strong>2006</strong> and 2005, and a $3 million liability at year-end<br />
2004. The hedge is highly effective and, therefore, no net gain or<br />
loss was reported during <strong>2006</strong>, 2005, and 2004.<br />
During <strong>2006</strong>, we entered into an interest rate swap agreement<br />
to manage the volatility of the U.S. Treasury component of<br />
the interest rate risk associated with the forecasted issuance of<br />
our Series H Notes. During 2005, we entered into two similar<br />
instruments in conjunction with the forecasted issuance of our<br />
Series F Notes and the exchange of our Series C and E Notes for<br />
new Series G Notes. All three swaps were designated as cash<br />
flow hedges under FAS No. 133 and were terminated upon pricing<br />
of the notes. All three swaps were highly effective in offsetting<br />
fluctuations in the U.S. Treasury component. Thus, there was<br />
no net gain or loss reported in earnings during <strong>2006</strong> or 2005.<br />
The net losses for these swaps of $2 million in <strong>2006</strong> associated<br />
with the Series H Notes and $2 million in 2005 associated with
the Series F Notes and Series G Notes were recorded in other<br />
comprehensive income and are being amortized to interest<br />
expense using the interest method over the life of the notes.<br />
At year-end <strong>2006</strong>, we had four outstanding interest rate swap<br />
agreements to manage interest rate risk associated with the<br />
residual interests we retain in conjunction with our timeshare<br />
note sales. Historically, we were required by purchasers and/or<br />
rating agencies to utilize interest rate swaps to protect the<br />
excess spread within our sold note pools. The aggregate<br />
notional amount of the swaps is $209 million, and they expire<br />
through 2022. These swaps are not accounted for as hedges<br />
under FAS No. 133. The fair value of the swaps was a net asset of<br />
$5 million at year-end <strong>2006</strong> and $6 million at year-end 2005. For<br />
the outstanding interest rate swaps, we recorded a $1 million<br />
net loss during <strong>2006</strong> and a $2 million net gain during each of<br />
2005 and 2004.<br />
During <strong>2006</strong>, 2005 and 2004, we entered into interest rate<br />
swaps to manage interest rate risk associated with forecasted<br />
timeshare note sales. During <strong>2006</strong>, two swaps (the “<strong>2006</strong> swaps”)<br />
were designated as cash flow hedges under FAS No. 133 and<br />
were highly effective in offsetting interest rate fluctuations. The<br />
amount of the ineffectiveness was immaterial. During <strong>2006</strong>, we<br />
terminated the <strong>2006</strong> swaps and recognized a net gain of $1 million<br />
in the gains from the sales of Timeshare segment notes<br />
receivable. In 2005 and 2004 some swaps (the “2005 and 2004<br />
swaps”) did not qualify for hedge accounting. The non-qualifying<br />
2005 and 2004 swaps resulted in a loss of $3 million during 2005<br />
and a gain of $2 million during 2004. These amounts were<br />
included in the gains from the sales of Timeshare segment notes<br />
receivable. During 2005 one of the terminated swaps was designated<br />
as a cash flow hedge under FAS No. 133. The amount of<br />
the ineffectiveness was immaterial and upon termination we<br />
recognized a net gain of $2 million in gains from the sales of<br />
Timeshare segment notes receivable.<br />
During <strong>2006</strong>, 2005 and 2004, we entered into forward foreign<br />
exchange contracts to manage the foreign currency exposure<br />
related to certain monetary assets. The aggregate dollar equivalent<br />
of the notional amount of the contracts was $217 million at<br />
year-end <strong>2006</strong>. The forward exchange contracts do not qualify as<br />
hedges in accordance with FAS No. 133. The fair value of the forward<br />
contracts was zero at year-end <strong>2006</strong> and a liability of $2 million<br />
at year-end 2005. We recorded a $34 million loss during<br />
<strong>2006</strong>, a $26 million gain in 2005, and $3 million net loss during<br />
2004, relating to these forward foreign exchange contracts. The<br />
net gains and losses for all years were recorded as general,<br />
administrative and other and were offset by income and losses<br />
recorded from translating the related monetary assets denominated<br />
in foreign currencies into U.S. dollars.<br />
During <strong>2006</strong>, 2005 and 2004, we entered into foreign<br />
exchange option and forward contracts to hedge the potential<br />
volatility of earnings and cash flows associated with variations in<br />
foreign exchange rates. The aggregate dollar equivalent of the<br />
notional amounts of the contracts was $47 million at year-end<br />
<strong>2006</strong>. These contracts have terms of less than one year and are<br />
classified as cash flow hedges. Changes in their fair values are<br />
recorded as a component of other comprehensive income. The<br />
fair value of the option contracts was approximately zero at<br />
year-end <strong>2006</strong> and zero at year-end 2005. The remaining hedges<br />
were highly effective and there was no net gain or loss reported<br />
in earnings for <strong>2006</strong>, 2005 and 2004. As of year-end <strong>2006</strong>, the<br />
deferred gains or losses on existing contracts accumulated in<br />
other comprehensive income that we expect to reclassify into<br />
earnings over the next year were approximately zero.<br />
During <strong>2006</strong> and 2005, we entered into forward foreign<br />
exchange contracts to manage currency exchange rate volatility<br />
associated with certain investments in foreign operations. The<br />
contracts offset the gains and losses associated with translation<br />
adjustments for various investments in foreign operations. One<br />
contract was designated as a hedge in the net investment of a<br />
foreign operation under FAS No. 133. The hedge was highly<br />
effective and resulted in no net gain or loss for <strong>2006</strong> and a $1 million<br />
net loss for 2005 in the foreign currency translation adjustment<br />
section of other comprehensive income. Certain contracts<br />
did not qualify as hedges under FAS No. 133 and resulted in a<br />
loss of $17 million for <strong>2006</strong> and a gain of $3 million for 2005,<br />
both impacting our general, administrative and other expenses.<br />
One contract remained at year-end <strong>2006</strong>, which had an aggregate<br />
dollar equivalent of the notional amount of $43 million and<br />
a fair value of zero. Contracts remaining at year-end 2005 had an<br />
aggregate dollar equivalent of the notional amount of $229 million<br />
and a fair value of approximately zero.<br />
During <strong>2006</strong>, in response to high oil prices and uncertainty<br />
surrounding the potential phase out of tax credits, we entered<br />
into oil price hedges in conjunction with our synthetic fuel operation.<br />
These hedges do not qualify as cash flow hedges under<br />
FAS No. 133. Therefore, changes in the fair values of these instruments<br />
are marked-to-market through interest income at each<br />
reporting period. Correspondingly, we recorded a net loss of<br />
$4 million during <strong>2006</strong>. At year-end <strong>2006</strong>, two hedges with a<br />
total fair value of $5 million remained outstanding.<br />
18 | CONTINGENCIES<br />
Guarantees<br />
We issue guarantees to certain lenders and hotel owners primarily<br />
to obtain long-term management contracts. The guarantees<br />
generally have a stated maximum amount of funding and a<br />
term of five years or less. The terms of guarantees to lenders<br />
generally require us to fund if cash flows from hotel operations<br />
are inadequate to cover annual debt service or to repay the loan<br />
at the end of the term. The terms of the guarantees to hotel<br />
owners generally require us to fund if the hotels do not attain<br />
specified levels of operating profit. Guarantee fundings to<br />
lenders and hotel owners are generally recoverable as loans<br />
repayable to us out of future hotel cash flows and/or proceeds<br />
from the sale of hotels. We also enter into project completion<br />
guarantees with certain lenders in conjunction with hotels and<br />
Timeshare segment properties that we or our joint venture partners<br />
are building.<br />
The maximum potential amount of future fundings for guarantees<br />
where we are the primary obligor and the carrying<br />
amount of the liability for expected future fundings at year-end<br />
<strong>2006</strong> are as follows:<br />
Maximum Liability for Future<br />
Potential Amount Fundings at<br />
Guarantee Type of Future Fundings Year-end <strong>2006</strong><br />
($ in millions)<br />
Debt service $ 50 $ 1<br />
Operating profit 181 20<br />
Project completion 8 —<br />
Other<br />
Total guarantees where we<br />
29 3<br />
are the primary obligor $268 $24<br />
MARRIOTT INTERNATIONAL, INC. <strong>2006</strong> | 57
Our guarantees of $268 million listed in the preceding table<br />
include $43 million for guarantees that will not be in effect until<br />
the underlying properties open and we begin to operate the properties.<br />
Guarantees not in effect are comprised of $5 million of debt<br />
service guarantees and $38 million of operating profit guarantees.<br />
The guarantees of $268 million in the preceding table do not<br />
include $283 million of guarantees related to Senior Living<br />
Services lease obligations and lifecare bonds for which we are<br />
secondarily liable. Sunrise Senior Living, Inc. (“Sunrise”) is the primary<br />
obligor of the leases and a portion of the lifecare bonds,<br />
and CNL Retirement Properties, Inc. (“CNL”) is the primary obligor<br />
of the remainder of the lifecare bonds. Prior to the sale of the<br />
Senior Living Services business in 2003, these preexisting guarantees<br />
were guarantees by the Company of obligations of consolidated<br />
Senior Living Services subsidiaries. Sunrise and CNL have<br />
indemnified us for any guarantee fundings we may be called on<br />
to make in connection with these lease obligations and lifecare<br />
bonds. We do not expect to fund under the guarantees.<br />
The table also does not include lease obligations for which<br />
we became secondarily liable when we acquired the<br />
Renaissance Hotel Group N.V. in 1997, consisting of annual rent<br />
payments of approximately $22 million and total remaining rent<br />
payments through the initial term of approximately $218 million.<br />
CTF has made available €35 million in cash collateral in the<br />
event that we are required to fund under such guarantees. As<br />
CTF obtains releases from the landlords and these hotels exit<br />
the system, our contingent liability exposure of approximately<br />
$218 million will decline. Since we assumed these guarantees,<br />
we have not funded any amounts, and we do not expect to fund<br />
any amounts under these guarantees in the future.<br />
In addition to the guarantees described above, in conjunction<br />
with financing obtained for specific projects or properties owned<br />
by joint ventures in which we are a party, we may provide industry<br />
standard indemnifications to the lender for loss, liability or<br />
damage occurring as a result of the actions of the other joint<br />
venture owner or our own actions. Furthermore, in addition to<br />
the project completion guarantees noted in the preceding table,<br />
we have provided a project completion guarantee to a lender for<br />
a project with an estimated aggregate total cost of $524 million.<br />
Payments for cost overruns for this project will be satisfied by the<br />
joint venture via contributions from the partners, and we are<br />
liable on a several basis with our partners in an amount equal to<br />
our pro rata ownership in the joint venture which is 34 percent.<br />
We do not expect to fund under this guarantee.<br />
Commitments and Letters of Credit<br />
In addition to the guarantees noted previously, as of year-end<br />
<strong>2006</strong>, we had extended approximately $11 million of loan commitments<br />
to owners of lodging properties, under which we<br />
expect to fund approximately $5 million by year-end 2007. We<br />
do not expect to fund the remaining $6 million of commitments,<br />
which expire as follows: $1 million within one year; $1 million in<br />
three to four years; and $4 million after five years. At year-end<br />
<strong>2006</strong>, we also have commitments to invest up to $31 million of<br />
equity for minority interests in partnerships that plan to purchase<br />
both North American full-service and limited-service<br />
hotels, which expire as follows: $5 million within one year;<br />
$21 million in one to two years; and $5 million after five years.<br />
At year-end <strong>2006</strong>, we also had $108 million of letters of credit<br />
outstanding on our behalf, the majority of which related to our<br />
self-insurance programs. Surety bonds issued on our behalf at<br />
58 | MARRIOTT INTERNATIONAL, INC. <strong>2006</strong><br />
year-end <strong>2006</strong>, totaled $640 million, the majority of which were<br />
requested by federal, state or local governments related to our<br />
lodging operations, including our Timeshare segment and selfinsurance<br />
programs.<br />
Synthetic Fuel<br />
The tax credits available under the Internal Revenue Code for<br />
the production and sale of synthetic fuels were established by<br />
Congress to encourage the development of alternative domestic<br />
energy sources. Congress deemed that the incentives provided<br />
by the tax credits would not be necessary if the price of oil<br />
increased beyond certain thresholds as prices would then provide<br />
a more natural market for these alternative fuels. As a result,<br />
the tax credits available under the Internal Revenue Code for the<br />
production and sale of synthetic fuel in any given calendar year<br />
are phased out if the Reference Price of a barrel of oil for that<br />
year falls within a specified range. The Reference Price of a barrel<br />
of oil is an estimate of the annual average wellhead price per<br />
barrel of domestic crude oil and is determined for each calendar<br />
year by the Secretary of the Treasury by April 1 of the following<br />
year. In 2004 and 2005, the Reference Price was roughly equal to<br />
89 percent of the average price in those years of the benchmark<br />
NYMEX futures contract for a barrel of light, sweet crude oil. The<br />
price range within which the credit is phased out was set in<br />
1980 and is adjusted annually for inflation. In 2005, the<br />
Reference Price phase-out range was $53.20 to $66.79. Because<br />
the Reference Price of a barrel of oil for 2005 was below that<br />
range, at $50.26, there was no reduction of the tax credits available<br />
for synthetic fuel produced and sold in 2005. Assuming a<br />
2 percent inflation adjustment factor for <strong>2006</strong> and assuming<br />
that the ratio of the Reference Price to the average price of the<br />
benchmark NYMEX futures contract remains approximately the<br />
same in <strong>2006</strong> as it was in 2005, we currently estimate that there<br />
was a 39 percent reduction of the tax credits available for synthetic<br />
fuel produced and sold in <strong>2006</strong>.<br />
We cannot predict with any accuracy the future price of a<br />
barrel of oil. As noted in Footnote No. 2,“Synthetic Fuel,” earlier<br />
in this report, we suspended synthetic fuel production twice in<br />
<strong>2006</strong> for varying lengths of time in response to high oil prices. If<br />
the Reference Price of a barrel of oil in 2007 exceeds the applicable<br />
phase-out threshold, the tax credits generated by our synthetic<br />
fuel facilities in 2007 could be reduced or eliminated,<br />
which would have a negative impact on our results of operations.<br />
Late in <strong>2006</strong> and early in 2007, we entered into hedge<br />
agreements to minimize operating losses that could occur if<br />
more than a majority of the tax credits are phased out in 2007.<br />
See Footnote No. 2,“Synthetic Fuel,” earlier in this report, for<br />
additional information related to the synthetic fuel operations,<br />
including information related to the cessation of synthetic fuel<br />
production permanently at the end of 2007.<br />
Investment in Leveraged Lease<br />
At year-end <strong>2006</strong>, we had a $23 million investment in an aircraft<br />
leveraged lease with Delta Air Lines, Inc. (“Delta”) which we<br />
acquired in 1994.The gross investment is comprised of rentals<br />
receivable and the residual value of the aircraft offset by<br />
unearned income. On September 14, 2005, Delta filed for bankruptcy<br />
protection under Chapter 11 of the U.S. Bankruptcy Code<br />
and informed us that it wished to restructure the lease. As a result,<br />
we believe our investment was impaired, and have recorded pretax<br />
charges of approximately $18 million through <strong>2006</strong>.
Audit of Employee Stock Ownership Plan Transaction<br />
The IRS is currently auditing the Company’s federal tax returns<br />
for the 2000, 2001 and 2002 fiscal years. As part of that audit, the<br />
IRS is reviewing a leveraged employee stock ownership plan<br />
(“ESOP”) feature of the Company’s Employees’ Profit Sharing,<br />
Retirement and Savings Plan and Trust (the “Plan”) that was<br />
implemented in a transaction (the “ESOP Transaction”) on June<br />
13, 2000. Principal and interest on the debt related to the transaction<br />
was forgiven over a 26-month period as a mechanism for<br />
funding Company contributions of elective deferrals and matching<br />
contributions to the Plan. The Company claimed federal<br />
income tax deductions for the forgiven principal on the debt in<br />
the amount of $1 billion over that period, along with forgiven<br />
interest on the debt. The benefit related to the tax deductions<br />
was reflected in equity and did not flow through the provision<br />
for income taxes.<br />
Based on discussions with the IRS during the course of the<br />
audit, the IRS may seek to disallow some or all of the deductions<br />
related to the ESOP Transaction, and may seek to impose other<br />
taxes, penalties, and interest, including excise taxes for prohibited<br />
transactions under Section 4975 of the Internal Revenue<br />
Code of 1986, as amended. In a January 19, 2007, letter to the<br />
Company, the U.S. Department of Labor confirmed that it is<br />
reviewing the ESOP Transaction. The Company has retained<br />
counsel to assist with the audit process and to respond to any<br />
claims or assessments the IRS or Department of Labor issues.<br />
Although we are early in the process of closing this audit, we do<br />
not expect the result of the audit to have a material impact on<br />
either equity for any lost deductions or earnings for interest or<br />
penalties, if any, related to the ESOP Transaction.<br />
19 | LEASES<br />
We have summarized our future obligations under operating<br />
leases at year-end <strong>2006</strong>, below:<br />
Fiscal Year ($ in millions)<br />
2007 $ 143<br />
2008 139<br />
2009 129<br />
2010 122<br />
2011 115<br />
Thereafter<br />
Total minimum lease payments<br />
833<br />
where we are the primary obligor $1,481<br />
Most leases have initial terms of up to 20 years and contain<br />
one or more renewal options, generally for five- or 10-year periods.<br />
These leases provide for minimum rentals and additional<br />
rentals based on our operations of the leased property. The total<br />
minimum lease payments above include $460 million, representing<br />
obligations of consolidated subsidiaries that are nonrecourse<br />
to Marriott International, Inc.<br />
As discussed in Footnote No. 8,“Acquisitions and<br />
Dispositions,” we became secondarily liable for annual rent payments<br />
for certain of these hotels when we acquired the<br />
Renaissance Hotel Group N.V. in 1997. We continue to manage<br />
16 of these hotels under new long-term management agreements;<br />
however, due to certain provisions in the management<br />
agreements, we account for these contracts as operating leases.<br />
CTF has placed approximately $89 million in trust accounts to<br />
cover possible shortfalls in cash flow necessary to meet rent<br />
payments under these leases. In turn, we released CTF affiliates<br />
from their guarantees in connection with these leases.<br />
Approximately $69 million remained in these trust accounts at<br />
year-end <strong>2006</strong>. Minimum lease payments relating to these<br />
leases, which are not reflected in the $1,481 million above, are as<br />
follows: $35 million in 2007; $35 million in 2008; $36 million in<br />
2009; $36 million in 2010; $32 million in 2011; and $214 million<br />
thereafter, for a total of $388 million.<br />
Rent expense associated with operating leases consisted of:<br />
($ in millions) <strong>2006</strong> 2005 2004<br />
Minimum rentals $253 $211 $216<br />
Additional rentals 109 86 93<br />
$362 $297 $309<br />
We have summarized our future obligations under capital<br />
leases at year-end <strong>2006</strong>, below:<br />
Fiscal Year ($ in millions)<br />
2007 $ 9<br />
2008 79<br />
2009 1<br />
2010 1<br />
2011 1<br />
Thereafter 8<br />
Total minimum lease payments 99<br />
Less: Amount representing interest (11)<br />
Present value of net minimum lease payments $ 88<br />
The accompanying Consolidated Balance Sheet for year-end<br />
<strong>2006</strong>, included $81 million in the “Liabilities of assets held for<br />
sale” caption that represented the present value of net minimum<br />
lease payments associated with one property that was “held for<br />
sale,” and it also included $7 million in the “Long-term debt” caption<br />
that represented the present value of net minimum lease<br />
payments associated with other capital leases. The accompanying<br />
Consolidated Balance Sheet for year-end 2005 included<br />
$9 million in the “Long-term debt” caption and $1 million in the<br />
“Current portion of long-term debt” caption that represented<br />
the present value of net minimum lease payments associated<br />
with capital leases.<br />
20 | BUSINESS SEGMENTS<br />
We are a diversified hospitality company with operations in six<br />
business segments:<br />
3 North American Full-Service Lodging, which includes the<br />
Marriott Hotels & Resorts, JW Marriott Hotels & Resorts,<br />
Marriott Conference Centers, Renaissance Hotels &<br />
Resorts, and Renaissance ClubSport brands located in the<br />
continental United States and Canada;<br />
3 North American Limited-Service Lodging, which includes<br />
the Courtyard, Fairfield Inn, SpringHill Suites, Residence<br />
Inn, TownePlace Suites and Marriott ExecuStay brands<br />
located in the continental United States and Canada;<br />
3 International Lodging, which includes Marriott Hotels &<br />
Resorts, JW Marriott Hotels & Resorts, Renaissance Hotels<br />
& Resorts, Courtyard, Fairfield Inn, Residence Inn, Ramada<br />
International and Marriott Executive Apartments brands<br />
located outside the continental United States and Canada;<br />
MARRIOTT INTERNATIONAL, INC. <strong>2006</strong> | 59
3 Luxury Lodging, which includes The Ritz-Carlton and<br />
Bulgari Hotels & Resorts brands worldwide;<br />
3 Timeshare, which includes the development, marketing,<br />
operation and sale of timeshare, fractional and whole<br />
ownership properties under the Marriott Vacation Club,<br />
The Ritz-Carlton Club, Grand Residences by Marriott and<br />
Horizons by Marriott Vacation Club brands worldwide; and<br />
3 Synthetic Fuel, which includes our interest in the operation<br />
of coal-based synthetic fuel production facilities.<br />
In addition to the segments above, in 2002 we announced<br />
our intent to sell, and subsequently did sell, our Senior Living<br />
Services business segment and exited our Distribution Services<br />
business segment.<br />
In <strong>2006</strong>, the company analyzed its internal reporting process<br />
and implemented changes in the fourth quarter that were<br />
designed to improve efficiency. As part of this process, we evaluated<br />
the impact on segment reporting and made certain<br />
changes that were in accordance with U.S. generally accepted<br />
accounting principles. These reporting changes are in conformity<br />
with the requirements of FAS No. 131,“Disclosures about<br />
Segments of an Enterprise and Related Information,” and will<br />
better enable investors to view the Company the way management<br />
views it. Accordingly, we now report six operating segments<br />
as compared to five before the change and indirect<br />
administrative expenses are no longer allocated to our segments.<br />
Senior management now allocates resources and<br />
assesses performance based on the six operating segments. The<br />
revised segment reporting is reflected throughout this report for<br />
all periods presented. Historical figures are presented in a manner<br />
that is consistent with the revised segment reporting.<br />
We evaluate the performance of our segments based primarily<br />
on the results of the segment without allocating corporate<br />
expenses, interest expense or indirect general, administrative<br />
and other expenses. With the exception of the Synthetic Fuel<br />
segment, we do not allocate income taxes or interest income to<br />
our segments. As note sales are an integral part of the Timeshare<br />
segment, we include note sale gains in our Timeshare segment<br />
results, and we allocate other gains and losses as well as equity<br />
earnings or losses from our joint ventures and divisional general,<br />
administrative and other expenses to each of our segments.<br />
“Other unallocated corporate” represents that portion of our revenues,<br />
general, administrative and other expenses, equity in<br />
earnings or losses, and other gains or losses that are not allocable<br />
to our segments.<br />
We have aggregated the brands presented within our<br />
North American Full-Service, North American Limited-Service,<br />
International and Luxury segments considering their similar economic<br />
characteristics, types of customers, distribution channels,<br />
the regulatory business environment of the brands and operations<br />
within each segment and our organizational structure and<br />
management reporting structure.<br />
60 | MARRIOTT INTERNATIONAL, INC. <strong>2006</strong><br />
Revenues<br />
($ in millions) <strong>2006</strong> 2005 2004<br />
North American Full-Service<br />
Segment<br />
North American Limited-Service<br />
$ 5,196 $ 5,116 $ 4,691<br />
Segment 2,060 1,886 1,673<br />
International Segment 1,411 1,017 604<br />
Luxury Segment 1,423 1,333 1,263<br />
Timeshare Segment 1,840 1,721 1,502<br />
Total Lodging 11,930 11,073 9,733<br />
Other unallocated corporate 65 56 45<br />
Synthetic Fuel Segment 165 421 321<br />
Income from Continuing Operations<br />
$12,160 $11,550 $10,099<br />
($ in millions) <strong>2006</strong> 2005 2004<br />
North American Full-Service<br />
Segment<br />
North American Limited-Service<br />
$ 455 $ 349 $ 337<br />
Segment 380 303 233<br />
International Segment 237 133 109<br />
Luxury Segment 63 45 35<br />
Timeshare Segment 280 271 203<br />
Total Lodging financial results 1,415 1,101 917<br />
Other unallocated corporate (251) (219) (220)<br />
Synthetic Fuel Segment (after-tax)<br />
Interest income, provision for loan<br />
losses and interest expense<br />
(excluding the Synthetic<br />
5 125 107<br />
Fuel Segment)<br />
Income taxes (excluding the<br />
(72) (55) 55<br />
Synthetic Fuel Segment) (380) (284) (265)<br />
Equity in Earnings (Losses) of Equity Method Investees<br />
$ 717 $ 668 $ 594<br />
($ in millions) <strong>2006</strong> 2005 2004<br />
North American Full-Service<br />
Segment<br />
North American Limited-Service<br />
$2 $21 $ 8<br />
Segment — (6) (17)<br />
International Segment — 20 5<br />
Luxury Segment (2) (1) (3)<br />
Timeshare Segment (2) 1 (7)<br />
Total Lodging (2) 35 (14)<br />
Other unallocated corporate 5 1 —<br />
Synthetic Fuel Segment — — (28)<br />
$3 $36 $(42)
Depreciation and Amortization<br />
($ in millions) <strong>2006</strong> 2005 2004<br />
North American Full-Service<br />
Segment<br />
North American Limited-Service<br />
$ 24 $ 19 $ 26<br />
Segment 24 24 21<br />
International Segment 23 18 13<br />
Luxury Segment 7 10 10<br />
Timeshare Segment 39 46 49<br />
Total Lodging 117 117 119<br />
Other unallocated corporate 61 57 39<br />
Synthetic Fuel Segment 10 10 8<br />
Assets<br />
$188 $184 $166<br />
($ in millions) <strong>2006</strong> 2005 2004<br />
North American Full-Service<br />
Segment<br />
North American Limited-Service<br />
$1,104 $1,309 $1,270<br />
Segment 565 613 1,058<br />
International Segment 1,225 1,333 897<br />
Luxury Segment 755 656 687<br />
Timeshare Segment 2,560 2,454 2,321<br />
Total Lodging 6,209 6,365 6,233<br />
Other unallocated corporate 2,288 2,062 2,319<br />
Synthetic Fuel Segment 91 103 116<br />
Equity Method Investments<br />
$8,588 $8,530 $8,668<br />
($ in millions) <strong>2006</strong> 2005 2004<br />
North American Full-Service<br />
Segment<br />
North American Limited-Service<br />
$ 18 $ 21 $ 32<br />
Segment 35 50 77<br />
International Segment 73 119 84<br />
Luxury Segment 17 18 4<br />
Timeshare Segment 168 115 31<br />
Total Lodging 311 323 228<br />
Other unallocated corporate 21 26 21<br />
$332 $349 $249<br />
Goodwill<br />
($ in millions) <strong>2006</strong> 2005 2004<br />
North American Full-Service<br />
Segment $406 $407 $407<br />
North American Limited-Service<br />
Segment 72 72 72<br />
International Segment 273 273 272<br />
Luxury Segment 170 172 172<br />
Total Lodging $921 $924 $923<br />
Capital Expenditures<br />
($ in millions) <strong>2006</strong> 2005 2004<br />
North American Full-Service<br />
Segment<br />
North American Limited-Service<br />
$ 75 $197 $ 56<br />
Segment 38 10 18<br />
International Segment 215 376 3<br />
Luxury Segment 104 84 5<br />
Timeshare Segment 28 27 38<br />
Total Lodging 460 694 120<br />
Other unallocated corporate 69 86 61<br />
$529 $780 $181<br />
Our tax provision of $286 million for <strong>2006</strong> includes: a tax benefit<br />
and tax credits of $94 million associated with our Synthetic<br />
Fuel segment; our tax provision of $94 million for 2005 includes<br />
a tax benefit and tax credits of $190 million associated with our<br />
Synthetic Fuel segment; and our tax provision of $100 million for<br />
2004 includes a tax benefit and tax credits of $165 million associated<br />
with our Synthetic Fuel segment.<br />
Segment expenses include selling expenses directly related<br />
to the operations of the businesses, aggregating $600 million in<br />
<strong>2006</strong>, $609 million in 2005 and $454 million in 2004. Approximately<br />
90 percent, 90 percent and 94 percent for <strong>2006</strong>, 2005,<br />
and 2004, respectively, of the selling expenses are related to our<br />
Timeshare segment.<br />
The consolidated financial statements include the following<br />
related to operations located outside the United States (which<br />
are predominately related to our International lodging segment):<br />
Revenues of $1,869 million in <strong>2006</strong>, $1,388 million in 2005, and<br />
$972 million in 2004; Lodging financial results of $298 million in<br />
<strong>2006</strong> (28 percent from Asia, 30 percent from the Americas excluding<br />
the United States, 13 percent from the United Kingdom, 19 percent<br />
from Europe, 8 percent from the Middle East and Africa, and<br />
2 percent from Australia), $178 million in 2005 and $163 million<br />
in 2004; and fixed assets of $684 million in <strong>2006</strong> and $574 million<br />
in 2005. Additionally, the “Assets held for sale” caption in our<br />
accompanying Consolidated Balance Sheet included fixed assets<br />
totaling $348 million and $376 million for year-end <strong>2006</strong> and<br />
year-end 2005, respectively, that were associated with properties<br />
located outside the United States. No individual country, other<br />
than the United States, constitutes a material portion of our revenues,<br />
financial results or fixed assets.<br />
MARRIOTT INTERNATIONAL, INC. <strong>2006</strong> | 61
21 | VARIABLE INTEREST ENTITIES<br />
FIN 46,“Consolidation of Variable Interest Entities” (“the<br />
Interpretation”), was effective for all enterprises with variable<br />
interests in variable interest entities created after January 31,<br />
2003. FIN 46(R), which was revised in December 2003, was effective<br />
for all entities to which the provisions of FIN 46 were not<br />
applied as of December 24, 2003. We applied the provisions<br />
of FIN 46(R) to all entities subject to the Interpretation as of<br />
March 26, 2004. Under FIN 46(R), if an entity is determined to be<br />
a variable interest entity, it must be consolidated by the enterprise<br />
that absorbs the majority of the entity’s expected losses,<br />
receives a majority of the entity’s expected residual returns, or<br />
both, the “primary beneficiary.”<br />
We currently consolidate four entities that are variable interest<br />
entities under FIN 46(R). These entities were established with<br />
the same partner to lease four Marriott-branded hotels. The<br />
combined capital in the four variable interest entities is less than<br />
$1 million, which is used primarily to fund hotel working capital.<br />
Our equity at risk is $2 million and we hold 55 percent of the<br />
common equity shares.<br />
We have one other significant interest in an entity that is a<br />
variable interest entity under FIN 46(R). In February 2001, we<br />
entered into a shareholders’ agreement with an unrelated third<br />
party to form a joint venture to own and lease luxury hotels to<br />
be managed by us. In February 2002, the joint venture signed<br />
its first lease with a third-party landlord. We hold 35 percent of<br />
the equity and 65 percent of the debt. In addition, each equity<br />
partner entered into various guarantees with the landlord to<br />
guarantee lease payments. Our maximum exposure to loss is<br />
$17 million. We do not consolidate the joint venture since we<br />
do not bear the majority of the expected losses or expected<br />
residual returns.<br />
In conjunction with the transaction with CTF described more<br />
fully in Footnote No. 8,“Acquisitions and Dispositions,” under the<br />
caption “2005 Acquisitions” we manage 15 hotels on behalf of<br />
four tenant entities 100 percent owned by CTF, which lease the<br />
15 hotels from third-party owners. The entities have minimal<br />
equity and minimal assets comprised of hotel working capital.<br />
CTF has placed money in a trust account to cover cash flow<br />
shortfalls and to meet rent payments. At year-end <strong>2006</strong>, the trust<br />
account held approximately $46 million. The entities are variable<br />
interest entities under FIN 46(R). We do not consolidate the entities,<br />
as we do not bear the majority of the expected losses. We<br />
are secondarily liable for rent payments for nine of the 15 hotels<br />
in the event that there are cash flow shortfalls and there is no<br />
money left in the trust. Future minimum lease payments<br />
through the end of the lease term for these nine hotels total<br />
approximately $141 million. In addition, we are also secondarily<br />
liable for rent payments of up to $39 million for the six other<br />
hotels in the event that there are cash flow shortfalls.<br />
We also manage one hotel on behalf of a tenant entity<br />
100 percent owned by CTF, which leases the hotel from a thirdparty<br />
owner. The entity has minimal equity and minimal assets<br />
comprised of hotel working capital. CTF has placed money in a<br />
trust account to cover cash flow shortfalls and to meet rent payments.<br />
At year-end <strong>2006</strong>, there was approximately $23 million in<br />
the trust. The entity is a variable interest entity under FIN 46(R).<br />
We consolidate the entity as we bear the majority of the<br />
expected losses. We are secondarily liable for rent payments for<br />
this hotel in the event that there is a cash flow shortfall and<br />
there is not money left in the trust. Future minimum lease payments<br />
through the end of the lease term total $208 million.<br />
62 | MARRIOTT INTERNATIONAL, INC. <strong>2006</strong><br />
22 | RELATED PARTY TRANSACTIONS<br />
Equity Method Investments<br />
We have equity method investments in entities that own properties<br />
where we provide management and/or franchise services<br />
and receive a fee. In addition, in some cases we provide loans,<br />
preferred equity or guarantees to these entities. Our ownership<br />
interest in these equity method investments generally varies<br />
from 10 to 50 percent.<br />
The following tables present financial data resulting from<br />
transactions with these related parties:<br />
Income Statement Data<br />
($ in millions) <strong>2006</strong> 2005 2004<br />
Base management fees $ 62 $ 83 $ 72<br />
Incentive management fees 22 14 8<br />
Cost reimbursements 649 936 802<br />
Owned, leased, corporate housing<br />
and other revenue 3 22 29<br />
Total revenue $ 736 $1,055 $ 911<br />
General, administrative and other $ (1) $ (19) $ (33)<br />
Reimbursed costs (649) (936) (802)<br />
Gains and other income 28 54 19<br />
Interest income 4 31 74<br />
Reversal of provision for loan losses 1 — 3<br />
Equity in losses—Synthetic fuel — — (28)<br />
Equity in earnings (losses)—Other 3 36 (14)<br />
Balance Sheet Data<br />
($ in millions) <strong>2006</strong> 2005<br />
Current assets-accounts and<br />
notes receivable $ 76 $ 47<br />
Contract acquisition costs 34 26<br />
Cost method investments 45 166<br />
Equity method investments 332 349<br />
Loans to equity method investees 27 36<br />
Long-term deferred tax assets, net 4 19<br />
Current liabilities:<br />
Accounts payable — (2)<br />
Other payables and accruals (2) (43)<br />
Other long-term liabilities (13) (19)<br />
Summarized information relating to the entities in which we<br />
have equity method investments is as follows:<br />
Income Statement Summary<br />
($ in millions) <strong>2006</strong> 2005 2004<br />
Sales $1,479 $1,975 $1,617<br />
Net income (loss) $ 169 $ 259 $ (69)<br />
Balance Sheet Summary<br />
($ in millions) <strong>2006</strong> 2005<br />
Assets (primarily comprised of hotel<br />
real estate managed by us) $4,348 $5,589<br />
Liabilities $2,837 $3,654
JWM Family Enterprises, L.P.<br />
JWM Family Enterprises, L.P. (“Family Enterprises”) is a Delaware<br />
limited partnership which is beneficially owned and controlled<br />
by members of the family of J.W. Marriott, Jr., the Company’s<br />
Chairman and Chief Executive Officer, including John W. Marriott<br />
III, the Company’s Vice Chairman, who is Chief Executive Officer<br />
of Family Enterprises, and J.W. Marriott, Jr. himself. In July <strong>2006</strong>,<br />
the Company sold the Dallas, Texas, Renaissance Hotels &<br />
Resorts brand hotel to Family Enterprises for a sale price of<br />
approximately $38 million and recognized a gain of $1 million<br />
on the sale. The Company originally acquired the hotel from a<br />
third party in June 2005. The sale to Family Enterprises resulted<br />
from a competitive auction process involving other unrelated<br />
bidders in which Family Enterprises submitted the most competitive<br />
bid.<br />
23 | RELATIONSHIP WITH MAJOR CUSTOMER<br />
As of year-end <strong>2006</strong>, Host Hotels & Resorts, Inc. (“Host”), known<br />
as Host Marriott Corporation prior to April 18, <strong>2006</strong>, owned or<br />
leased 153 lodging properties operated by us under long-term<br />
agreements. The revenues recognized from lodging properties<br />
owned or leased by Host (which are included in our North<br />
American Full-Service, North American Limited-Service, and<br />
International segments) for the last three fiscal years are shown<br />
in the following table:<br />
($ in millions) <strong>2006</strong> 2005 2004<br />
Revenues $2,475 $2,427 $2,423<br />
Shareholder Return Performance Graph — Unaudited<br />
Additionally, Host is a partner in several unconsolidated partnerships<br />
that own lodging properties operated by us under<br />
long-term agreements. As of year-end <strong>2006</strong>, Host was affiliated<br />
with 121 such properties operated by us. The revenues associated<br />
with those properties (which are included in our North<br />
American Full-Service, North American Limited-Service and<br />
International segments) that were recognized by the Company<br />
for the last three fiscal years are shown in the following table:<br />
($ in millions) <strong>2006</strong> 2005 2004<br />
Revenues $353 $352 $329<br />
In December 2000, we acquired 120 Courtyard by Marriott<br />
hotels through the Courtyard Joint Venture, an unconsolidated<br />
Joint Venture with an affiliate of Host, and we and Host owned<br />
equal shares in the Joint Venture. Prior to the formation of the<br />
Courtyard Joint Venture, Host was a general partner in the<br />
unconsolidated partnerships that owned the 120 Courtyard by<br />
Marriott hotels. During the 2005 second quarter, Sarofim Realty<br />
Advisors, on behalf of an institutional investor, completed the<br />
acquisition of a 75 percent interest in the Courtyard Joint Venture,<br />
and we signed new long-term management agreements with<br />
the joint venture. With the addition of the new equity, our interest<br />
in the joint venture has declined to approximately 21 percent<br />
and Host’s interest declined to less than 4 percent. As part<br />
of the completed transaction, our mezzanine loan to the joint<br />
venture (including accrued interest) totaling approximately<br />
$269 million was repaid. The transaction accelerated the pace<br />
of reinventions and upgrades at the joint venture’s 120 hotels,<br />
which were substantially complete at year-end <strong>2006</strong>.<br />
The following graph compares the performance of the Company’s Class A Common Stock from December 28, 2001 to the end of fiscal<br />
<strong>2006</strong> with the performance of the Standard & Poor’s Corporation Composite 500 Index and the Standard & Poor’s Hotels, Resorts and<br />
Cruise Lines Index. The graph assumes an initial investment of $100 on December 28, 2001, and reinvestment of dividends.<br />
Dollars<br />
$300<br />
250<br />
200<br />
150<br />
100<br />
50<br />
0<br />
Comparison of Shareholder Returns among Marriott International, Inc.,<br />
the S&P 500 Index and the S&P 500 Hotels, Resorts and Cruise Lines Index<br />
12/28/01<br />
1/3/03<br />
1/2/04<br />
12/31/04<br />
Fiscal Year Ended<br />
12/30/05<br />
12/29/06<br />
Marriott International, Inc.<br />
S&P 500 Hotels Index<br />
S&P 500 Index<br />
12/28/01 1/3/03 1/2/04 12/31/04 12/30/05 12/29/06<br />
Marriott International, Inc. 100.0 84.0 113.9 156.4 167.4 240.0<br />
S&P 500 Hotels Index 100.0 92.8 135.1 196.8 199.9 229.1<br />
S&P 500 Index 100.0 79.6 98.8 109.9 115.3 133.5<br />
NOTE: The S&P 500 Hotels, Resorts and Cruise Lines Index includes Carnival plc, Hilton Hotels Corporation, the Company, and Starwood Hotels & Resorts. In August of <strong>2006</strong>, Wyndham<br />
Hotels and Resorts was added to the index.<br />
MARRIOTT INTERNATIONAL, INC. <strong>2006</strong> | 63
Quarterly Financial Data — Unaudited<br />
(1), (2)<br />
Fiscal Year <strong>2006</strong><br />
First Second Third Fourth Fiscal<br />
($ in millions, except per share data) Quarter (3) Quarter (3) Quarter Quarter Year<br />
Revenues (4) $2,705 $2,891 $2,703 $3,861 $12,160<br />
Operating income (4) $ 203 $ 274 $ 229 $ 305 $ 1,011<br />
Income from continuing operations minority interest $ 170 $ 186 $ 141 $ 220 $ 717<br />
Discontinued operations, net of tax — — — — —<br />
Cumulative effect of change in accounting principle, net of tax (3) (109) — — — (109)<br />
Net income $ 61 $ 186 $ 141 $ 220 $ 608<br />
Diluted earnings per share from continuing operations $ 0.39 $ 0.43 $ 0.33 $ 0.52 $ 1.66<br />
Diluted losses per share from cumulative effect of accounting change (0.25) — — — (0.25)<br />
Diluted earnings per share from discontinued operations — — — — —<br />
Diluted earnings per share $ 0.14 $ 0.43 $ 0.33 $ 0.52 $ 1.41<br />
(1), (2)<br />
Fiscal Year 2005<br />
First Second Third Fourth Fiscal<br />
($ in millions, except per share data) Quarter Quarter Quarter Quarter Year<br />
Revenues (4) $2,534 $2,661 $2,714 $3,641 $11,550<br />
Operating income (4) $ 158 $ 41 $ 135 $ 221 $ 555<br />
Income from continuing operations $ 145 $ 138 $ 148 $ 237 $ 668<br />
Discontinued operations, after-tax — — 1 — 1<br />
Net income $ 145 $ 138 $ 149 $ 237 $ 669<br />
Diluted earnings per share from continuing operations $ 0.30 $ 0.29 $ 0.32 $ 0.54 $ 1.45<br />
Diluted earnings per share from discontinued operations — — — — —<br />
Diluted earnings per share<br />
(1) The quarters consisted of 12 weeks, except for the fourth quarter, which consisted of 16 weeks.<br />
$ 0.30 $ 0.29 $ 0.32 $ 0.54 $ 1.45<br />
(2) All share and per share amounts have been adjusted to reflect the June <strong>2006</strong> stock split. The sum of the earnings per share for the four quarters differs from annual earnings per<br />
share due to the required method of computing the weighted average shares in interim periods.<br />
(3) See the Statement of Position 04-2,“Accounting for Real Estate Time-Sharing Transactions,” (“SOP 04-2”) discussions in the “Basis of Presentation” and “New Accounting Standards”<br />
captions in Footnote No. 1,“Summary of Significant Accounting Policies,” located in Part I, Item 8,“Financial Statements and Supplementary Data” of this <strong>Annual</strong> <strong>Report</strong> for additional<br />
information as both the <strong>2006</strong> “First Quarter” column and the <strong>2006</strong> “Second Quarter” column reflect revisions to previously reported amounts.<br />
(4) Balances reflect the Distribution Services business as discontinued operations.<br />
64 | MARRIOTT INTERNATIONAL, INC. <strong>2006</strong>
Selected Historical Financial Data — Unaudited<br />
The following table presents a summary of selected historical financial data for the Company derived from our financial statements as<br />
of and for our last eight fiscal years.<br />
Since the information in this table is only a summary and does not provide all of the information contained in our financial statements,<br />
including the related notes, you should read “Management’s Discussion and Analysis of Financial Condition and Results of<br />
Operations” and our Consolidated Financial Statements.<br />
Fiscal Year1 ($ in millions, except per share data) <strong>2006</strong> 2005 2004 2003 2002 2001 2000 1999<br />
Income Statement Data:<br />
Revenues (2) $12,160 $11,550 $10,099 $ 9,014 $ 8,415 $ 7,768 $ 7,911 $ 7,026<br />
Operating income (2) $ 1,011 $ 555 $ 477 $ 377 $ 321 $ 420 $ 762 $ 621<br />
Income from continuing operations $ 717 $ 668 $ 594 $ 476 $ 439 $ 269 $ 490 $ 399<br />
Cumulative effect of change in accounting principle (3) (109) — — — — — — —<br />
Discontinued operations — 1 2 26 (162) (33) (11) 1<br />
Net income $ 608 $ 669 $ 596 $ 502 $ 277 $ 236 $ 479 $ 400<br />
Per Share Data (4) :<br />
Diluted earnings per share from continuing operations $ 1.66 $ 1.45 $ 1.24 $ 0.97 $ 0.87 $ 0.52 $ 0.96 $ 0.75<br />
Diluted loss per share from cumulative effect<br />
of change in accounting principle (0.25) — — — — — — —<br />
Diluted earnings (loss) per share from<br />
discontinued operations — — — 0.05 (0.32) (0.06) (0.02) —<br />
Diluted earnings per share $ 1.41 $ 1.45 $ 1.24 $ 1.02 $ 0.55 $ 0.46 $ 0.94 $ 0.75<br />
Cash dividends declared per share $0.2400 $0.2000 $0.1650 $0.1475 $0.1375 $0.1275 $0.1175 $0.1075<br />
Balance Sheet Data (at end of year):<br />
Total assets $ 8,588 $ 8,530 $ 8,668 $ 8,177 $ 8,296 $ 9,107 $ 8,237 $ 7,324<br />
Long-term debt (2) 1,818 1,681 836 1,391 1,553 2,708 1,908 1,570<br />
Shareholders’ equity 2,618 3,252 4,081 3,838 3,573 3,478 3,267 2,908<br />
Other Data:<br />
Base management fees (2) $ 553 $ 497 $ 435 $ 388 $ 379 $ 372 $ 383 $ 352<br />
Franchise fees (2) 390 329 296 245 232 220 208 180<br />
Incentive management fees (2) 281 201 142 109 162 202 316 268<br />
Total Fees $ 1,224 $ 1,027 $ 873 $ 742 $ 773 $ 794 $ 907 $ 800<br />
Fee Revenue-Source:<br />
North America (5) $ 955 $ 809 $ 682 $ 592 $ 626 $ 664 $ 779 $ 690<br />
Outside North America 269 218 191 150 147 130 128 110<br />
$ 1,224 $ 1,027 $ 873 $ 742 $ 773 $ 794 $ 907 $ 800<br />
(1) All fiscal years included 52 weeks, except for 2002, which included 53 weeks.<br />
(2) Balances reflect our Senior Living Services and Distribution Services businesses as discontinued operations.<br />
(3) We adopted Statement of Position 04-2 “Accounting for Real Estate Time-Sharing Transactions,” in our <strong>2006</strong> first quarter which we reported in our Consolidated Statement of<br />
Income as a cumulative effect of change in accounting principle.<br />
(4) All per share amounts in the table above have been adjusted to reflect the June 9, <strong>2006</strong>, stock split effected in the form of a stock dividend.<br />
(5) Includes the Continental United States and Canada.<br />
Franchise Fees<br />
Incentive Management Fees<br />
Base Management Fees<br />
$907<br />
$383 $316 $208<br />
2000<br />
$794<br />
$220<br />
$202<br />
$372<br />
2001<br />
$773<br />
$232<br />
$162<br />
$379<br />
2002<br />
$742<br />
$245<br />
$109<br />
$388<br />
2003<br />
$873<br />
2004<br />
TOTAL FEES<br />
($ in millions)<br />
$296<br />
$142<br />
$435<br />
$1,027<br />
$329<br />
$201<br />
$497<br />
2005<br />
$1,224<br />
$553 $281 $390<br />
<strong>2006</strong><br />
$1,908<br />
2000<br />
$2,708<br />
2001<br />
$1,553<br />
2002<br />
$1,391<br />
2003<br />
$836<br />
2004<br />
LONG-TERM DEBT<br />
($ in millions)<br />
$1,681<br />
2005<br />
$1,818<br />
<strong>2006</strong><br />
$0.96<br />
$0.52<br />
$0.87<br />
$0.97<br />
$1.24<br />
$1.45<br />
2000 2001 2002 2003 2004 2005<br />
DILUTED EARNINGS PER SHARE<br />
FROM CONTINUING OPERATIONS<br />
$1.66<br />
<strong>2006</strong><br />
MARRIOTT INTERNATIONAL, INC. <strong>2006</strong> | 65
Non-GAAP Financial Measure Reconciliation — Unaudited<br />
RETURN ON INVESTED CAPITAL<br />
Return on Invested Capital (“ROIC”) excluding our synthetic fuel operation is calculated as earnings before income taxes and interest<br />
expense, excluding the synthetic fuel operation, divided by average capital investment. ROIC excluding our synthetic fuel operation is<br />
a financial measure that is not presented in accordance with U.S. generally accepted accounting principles. We consider ROIC excluding<br />
our synthetic fuel operation to be a meaningful indicator of our operating performance, and we evaluate this metric because it<br />
measures how effectively we use the money invested in our lodging operations. However, ROIC excluding our synthetic fuel operation<br />
should not be considered an alternative to net income, income from continuing operations or any other operating measure prescribed<br />
by U.S. generally accepted accounting principles. Additionally, our method of calculating ROIC excluding our synthetic fuel<br />
operation may be different from the methods used by other companies and as a result comparability may be limited.<br />
The reconciliation of income from continuing operations to earnings before income taxes and interest expense is as follows:<br />
Fiscal Year <strong>2006</strong> Fiscal Year 2005 Fiscal Year 2004 Fiscal Year 2003<br />
Synthetic Excluding Synthetic Excluding Synthetic Excluding Synthetic Excluding<br />
As Fuel Synthetic As Fuel Synthetic As Fuel Synthetic As Fuel Synthetic<br />
($ in millions) <strong>Report</strong>ed Impact1 Fuel ** <strong>Report</strong>ed Impact1 Fuel ** <strong>Report</strong>ed Impact1 Fuel ** <strong>Report</strong>ed Impact1 Fuel **<br />
Income from continuing operations $ 717<br />
Add:<br />
$ 5 $ 712 $ 668 $ 125 $ 543 $ 594 $ 107 $ 487 $ 476 $ 96 $ 380<br />
Provision (benefit) for income taxes<br />
Tax benefit included in<br />
286 (94) 380 94 (190) 284 100 (165) 265 (43) (245) 202<br />
minority interest — — — — — — — — — 94 94 —<br />
Interest expense 124 — 124 106 — 106 99 — 99 110 — 110<br />
Goodwill amortization 2 — — — — — — — — — — — —<br />
Timeshare interest 3 Earnings (losses) before income<br />
21 — 21 24 — 24 21 — 21 21 — 21<br />
taxes and interest expense $ 1,148 $(89) $ 1,237 $ 892 $ (65) $ 957 $ 814 $ (58) $ 872 $ 658 $ (55) $ 713<br />
The reconciliation of assets to invested capital is as follows:<br />
Year-End <strong>2006</strong> Year-End 2005 Year-End 2004 Year-End 2003<br />
Synthetic Excluding Synthetic Excluding Synthetic Excluding Synthetic Excluding<br />
Fuel Synthetic Fuel Synthetic Fuel Synthetic As Fuel Synthetic<br />
($ in millions) Total Impact1 Fuel ** Total Impact1 Fuel ** Total Impact1 Fuel ** <strong>Report</strong>ed Impact1 Fuel **<br />
Assets<br />
Add:<br />
$ 8,588 $ 91 $ 8,497 $ 8,530 $ 103 $ 8,427 $ 8,668 $ 116 $ 8,552 $ 8,177 $ 83 $ 8,094<br />
Cumulative goodwill amortization<br />
Current liabilities — discontinued<br />
128 — 128 128 — 128 128 — 128 128 — 128<br />
operations<br />
Less:<br />
Current liabilities, net of current<br />
— — — — — — — — — — — —<br />
portion of long-term debt (2,507) (55) (2,452) (2,077) (54) (2,023) (2,005) (76) (1,929) (1,779) (16) (1,763)<br />
Assets — discontinued operations — — — — — — — — — — — —<br />
Deferred tax assets, net (865) — (865) (765) — (765) (559) — (559) (466) — (466)<br />
Timeshare capitalized interest (19) — (19) (20) — (20) (21) — (21) (22) — (22)<br />
Invested capital $ 5,325 $ 36 $ 5,289 $ 5,796 $ 49 $ 5,747 $ 6,211 $ 40 $ 6,171 $ 6,038 $ 67 $ 5,971<br />
Average capital investment 4 $ 5,561 $ 43 $ 5,518 $ 6,004 $ 45 $ 5,959 $ 6,125 $ 54 $ 6,071 $ 5,755 $ 56 $ 5,699<br />
Return on invested capital ** 22% 16% 14% 13%<br />
** Denotes a non-GAAP financial measure.<br />
1. We acquired the synthetic fuel operations in the 2001 fourth quarter and began operating the facilities in the 2002 first quarter.<br />
2. Beginning with 2002, we stopped amortizing goodwill in conjunction with the adoption of FAS No. 142,“Goodwill and Other Intangible Assets.” For comparability, we add the<br />
amortized portion back for 2001, 2000 and 1999.<br />
3. Timeshare interest represents previously capitalized interest that is a component of product cost.<br />
4. Calculated as “Invested capital” for the current year and prior year, divided by two.<br />
66 | MARRIOTT INTERNATIONAL, INC. <strong>2006</strong>
Non-GAAP Financial Measure Reconciliation — Unaudited (continued)<br />
The reconciliation of income from continuing operations to earnings before income taxes and interest expense is as follows:<br />
Fiscal Year 2002 Fiscal Year 2001 Fiscal Year 2000<br />
Synthetic Excluding Synthetic Excluding<br />
As Fuel Synthetic As Fuel Synthetic As<br />
($ in millions) <strong>Report</strong>ed Impact1 Fuel ** <strong>Report</strong>ed Impact1 Fuel ** <strong>Report</strong>ed<br />
Income from continuing operations $ 439<br />
Add:<br />
$ 74 $ 365 $ 269 $— $ 269 $ 490<br />
Provision (benefit) for income taxes<br />
Tax benefit included in<br />
32 (208) 240 152 — 152 281<br />
minority interest — — — — — — —<br />
Interest expense 86 — 86 109 — 109 100<br />
Goodwill amortization 2 — — — 28 — 28 29<br />
Timeshare interest 3 Earnings (losses) before income<br />
17 — 17 12 — 12 8<br />
taxes and interest expense $ 574 $(134) $ 708 $ 570 $— $ 570 $ 908<br />
The reconciliation of assets to invested capital is as follows:<br />
Year-End 2002 Year-End 2001 Year-End 2000 Year-End 1999<br />
Synthetic Excluding Synthetic Excluding<br />
As Fuel Synthetic As Fuel Synthetic<br />
($ in millions) <strong>Report</strong>ed Impact1 Fuel ** <strong>Report</strong>ed Impact1 Fuel ** Total Total<br />
Assets<br />
Add:<br />
$ 8,296 $ 59 $ 8,237 $ 9,107 $49 $ 9,058 $ 8,237 $ 7,324<br />
Cumulative goodwill amortization<br />
Current liabilities — discontinued<br />
128 — 128 128 — 128 100 71<br />
operations<br />
Less:<br />
Current liabilities, net of current<br />
119 — 119 129 — 129 125 118<br />
portion of long-term debt (2,043) (14) (2,029) (1,883) — (1,883) (1,926) (1,770)<br />
Assets — discontinued operations (633) — (633) (889) — (889) (978) (1,167)<br />
Deferred tax assets, net (369) — (369) (128) — (128) (72) (84)<br />
Timeshare capitalized interest (26) — (26) (17) — (17) (7) (4)<br />
Invested capital $ 5,472 $ 45 $ 5,427 $ 6,447 $49 $ 6,398 $ 5,479 $ 4,488<br />
Average capital investment 4 $ 5,960 $ 47 $ 5,913 $ 5,963 $25 $ 5,938 $ 4,984<br />
Return on invested capital ** 12% 10% 18%<br />
** Denotes a non-GAAP financial measure.<br />
1. We acquired the synthetic fuel operations in the 2001 fourth quarter and began operating the facilities in the 2002 first quarter.<br />
2. Beginning with 2002, we stopped amortizing goodwill in conjunction with the adoption of FAS No. 142,“Goodwill and Other Intangible Assets.” For comparability, we add the<br />
amortized portion back for 2001, 2000 and 1999.<br />
3. Timeshare interest represents previously capitalized interest that is a component of product cost.<br />
4. Calculated as “Invested capital” for the current year and prior year, divided by two.<br />
MARRIOTT INTERNATIONAL, INC. <strong>2006</strong> | 67
Management’s Responsibility for Financial Statements<br />
Management of Marriott International is responsible for the integrity<br />
and objectivity of the consolidated financial statements and other<br />
financial information presented in this annual report. In meeting this<br />
responsibility, we maintain a highly developed system of internal controls,<br />
policies and procedures, including an internal auditing function.<br />
The consolidated financial statements have been audited by<br />
Ernst & Young LLP, independent registered public accounting firm.<br />
Their report expresses an informed judgment as to whether management’s<br />
financial statements, considered in their entirety, fairly<br />
present our financial position, operating results and cash flows in<br />
conformity with U.S. generally accepted accounting principles.<br />
Management of Marriott International, Inc. (the “Company”) is<br />
responsible for establishing and maintaining adequate internal control<br />
over financial reporting and for the assessment of the effectiveness<br />
of internal control over financial reporting. As defined by the<br />
Securities and Exchange Commission, internal control over financial<br />
reporting is a process designed by, or under the supervision of, the<br />
Company’s principal executive and principal financial officers and<br />
effected by the Company’s Board of Directors, management and<br />
other personnel, to provide reasonable assurance regarding the reliability<br />
of financial reporting and the preparation of the consolidated<br />
financial statements in accordance with U.S. generally accepted<br />
accounting principles.<br />
The Company’s internal control over financial reporting is supported<br />
by written policies and procedures that: (1) pertain to the<br />
maintenance of records that, in reasonable detail, accurately and<br />
fairly reflect the Company’s transactions and dispositions of the<br />
Company’s assets; (2) provide reasonable assurance that transactions<br />
are recorded as necessary to permit preparation of the consolidated<br />
financial statements in accordance with U.S. generally<br />
accepted accounting principles, and that receipts and expenditures<br />
of the Company are being made only in accordance with authorizations<br />
of the Company’s management and directors; and (3) provide<br />
reasonable assurance regarding prevention or timely detection of<br />
unauthorized acquisition, use or disposition of the Company’s<br />
assets that could have a material effect on the consolidated financial<br />
statements.<br />
68 | MARRIOTT INTERNATIONAL, INC. <strong>2006</strong><br />
The Board of Directors pursues its responsibility for the financial<br />
statements through its Audit Committee, composed of four directors<br />
not otherwise employed by the company. The committee<br />
meets a minimum of four times during the year with the independent<br />
registered public accounting firm, representatives of management<br />
and the internal auditors to review the scope and results of<br />
the internal and external audits, the accounting principles applied<br />
in financial reporting, and financial and operational controls. The<br />
independent registered public accounting firm and internal auditors<br />
have unrestricted access to the Audit Committee, with or without<br />
the presence of management.<br />
Management’s <strong>Report</strong> on Internal Control Over Financial <strong>Report</strong>ing<br />
Because of its inherent limitations, internal control over financial<br />
reporting may not prevent or detect misstatements. Also, projections<br />
of any evaluation of effectiveness to future periods are subject<br />
to the risk that controls may become inadequate because of<br />
changes in conditions, or that the degree of compliance with the<br />
policies or procedures may deteriorate.<br />
In connection with the preparation of the Company’s annual consolidated<br />
financial statements, management has undertaken an assessment<br />
of the effectiveness of the Company’s internal control over<br />
financial reporting as of December 29, <strong>2006</strong>, based on criteria established<br />
in Internal Control-Integrated Framework issued by the<br />
Committee of Sponsoring Organizations of the Treadway Commission<br />
(the “COSO Framework”). Management’s assessment included an evaluation<br />
of the design of the Company’s internal control over financial<br />
reporting and testing of the operational effectiveness of those controls.<br />
Based on this assessment, management has concluded that as of<br />
December 29, <strong>2006</strong>, the Company’s internal control over financial<br />
reporting was effective to provide reasonable assurance regarding<br />
the reliability of financial reporting and the preparation of financial<br />
statements for external purposes in accordance with U.S. generally<br />
accepted accounting principles.<br />
Ernst & Young LLP, the independent registered public accounting<br />
firm that audited the Company’s consolidated financial statements<br />
included in this report, has issued an attestation report on management’s<br />
assessment of internal control over financial reporting, a<br />
copy of which appears on the next page of this annual report.
<strong>Report</strong> of Independent Registered Public Accounting Firm<br />
on Internal Control Over Financial <strong>Report</strong>ing<br />
To the Board of Directors and Shareholders of Marriott International, Inc.:<br />
We have audited management’s assessment, included in the accompanying<br />
Management’s <strong>Report</strong> on Internal Control Over Financial<br />
<strong>Report</strong>ing, that Marriott International, Inc. maintained effective internal<br />
control over financial reporting as of December 29, <strong>2006</strong>, based<br />
on criteria established in Internal Control-Integrated Framework<br />
issued by the Committee of Sponsoring Organizations of the<br />
Treadway Commission (“the COSO criteria”). Marriott International,<br />
Inc.’s management is responsible for maintaining effective internal<br />
control over financial reporting and for its assessment of the effectiveness<br />
of internal control over financial reporting. Our responsibility<br />
is to express an opinion on management’s assessment and an<br />
opinion on the effectiveness of the company’s internal control over<br />
financial reporting based on our audit.<br />
We conducted our audit in accordance with the standards of the<br />
Public Company Accounting Oversight Board (United States). Those<br />
standards require that we plan and perform the audit to obtain reasonable<br />
assurance about whether effective internal control over<br />
financial reporting was maintained in all material respects. Our audit<br />
included obtaining an understanding of internal control over financial<br />
reporting, evaluating management’s assessment, testing and<br />
evaluating the design and operating effectiveness of internal control,<br />
and performing such other procedures as we considered necessary<br />
in the circumstances. We believe that our audit provides a<br />
reasonable basis for our opinion.<br />
A company’s internal control over financial reporting is a process<br />
designed to provide reasonable assurance regarding the reliability of<br />
financial reporting and the preparation of financial statements for external<br />
purposes in accordance with generally accepted accounting principles.<br />
A company’s internal control over financial reporting includes<br />
those policies and procedures that (1) pertain to the maintenance of<br />
records that, in reasonable detail, accurately and fairly reflect the transactions<br />
and dispositions of the assets of the company; (2) provide reasonable<br />
assurance that transactions are recorded as necessary to permit<br />
preparation of financial statements in accordance with generally<br />
accepted accounting principles, and that receipts and expenditures of<br />
the company are being made only in accordance with authorizations of<br />
management and directors of the company; and (3) provide reasonable<br />
assurance regarding prevention or timely detection of unauthorized<br />
acquisition, use, or disposition of the company’s assets that could have a<br />
material effect on the financial statements.<br />
Because of its inherent limitations, internal control over financial<br />
reporting may not prevent or detect misstatements. Also, projections<br />
of any evaluation of effectiveness to future periods are subject<br />
to the risk that controls may become inadequate because of<br />
changes in conditions, or that the degree of compliance with the<br />
policies or procedures may deteriorate.<br />
In our opinion, management’s assessment that Marriott<br />
International, Inc. maintained effective internal control over financial<br />
reporting as of December 29, <strong>2006</strong>, is fairly stated, in all material<br />
respects, based on the COSO criteria. Also, in our opinion, Marriott<br />
International, Inc. maintained, in all material respects, effective internal<br />
control over financial reporting as of December 29, <strong>2006</strong>, based<br />
on the COSO criteria.<br />
We also have audited, in accordance with the standards of the<br />
Public Company Accounting Oversight Board (United States), the consolidated<br />
balance sheet of Marriott International, Inc. as of December<br />
29, <strong>2006</strong> and December 30, 2005, and the related consolidated statements<br />
of income, cash flows, comprehensive income and shareholders’<br />
equity for each of the three fiscal years in the period ended<br />
December 29, <strong>2006</strong>, of Marriott International, Inc. and our report dated<br />
February 20, 2007 expressed an unqualified opinion thereon.<br />
McLean, Virginia<br />
February 20, 2007<br />
<strong>Report</strong> of Independent Registered Public Accounting Firm<br />
To the Board of Directors and Shareholders of Marriott International, Inc.:<br />
We have audited the accompanying consolidated balance sheets of<br />
Marriott International, Inc. as of December 29, <strong>2006</strong> and December<br />
30, 2005, and the related consolidated statements of income, cash<br />
flows, comprehensive income and shareholders’ equity for each of<br />
the three fiscal years in the period ended December 29, <strong>2006</strong>. These<br />
financial statements are the responsibility of the Company’s management.<br />
Our responsibility is to express an opinion on these financial<br />
statements based on our audits.<br />
We conducted our audits in accordance with the standards of the<br />
Public Company Accounting Oversight Board (United States). Those<br />
standards require that we plan and perform an audit to obtain reasonable<br />
assurance about whether the financial statements are free of<br />
material misstatement. An audit includes examining, on a test basis,<br />
evidence supporting the amounts and disclosures in the financial<br />
statements. An audit also includes assessing the accounting principles<br />
used and significant estimates made by management, as well as<br />
evaluating the overall financial statement presentation. We believe<br />
that our audits provide a reasonable basis for our opinion.<br />
In our opinion, the financial statements referred to above present<br />
fairly, in all material respects, the consolidated financial position of<br />
Marriott International, Inc. as of December 29, <strong>2006</strong> and December 30,<br />
2005, and the consolidated results of its operations and its cash flows<br />
for each of the three fiscal years in the period ended December 29,<br />
<strong>2006</strong>, in conformity with U.S. generally accepted accounting principles.<br />
As discussed in Note 1 to the financial statements, in <strong>2006</strong><br />
the Company changed its accounting for real estate time-sharing<br />
transactions in connection with the adoption of Statement of<br />
Position 04-2,“Accounting for Real Estate Time-sharing Transactions,”<br />
and changed its accounting for stock-based compensation<br />
in connection with the adoption of FASB Statement<br />
No. 123(R),“Share-Based Payment.”<br />
We also have audited, in accordance with the standards of the<br />
Public Company Accounting Oversight Board (United States), the<br />
effectiveness of Marriott International, Inc.’s internal control over<br />
financial reporting as of December 29, <strong>2006</strong>, based on criteria<br />
established in Internal Control-Integrated Framework issued by<br />
the Committee of Sponsoring Organizations of the Treadway<br />
Commission and our report dated February 20, 2007, expressed<br />
an unqualified opinion thereon.<br />
McLean, Virginia<br />
February 20, 2007<br />
MARRIOTT INTERNATIONAL, INC. <strong>2006</strong> | 69
Directors and Officers*<br />
DIRECTORS<br />
J.W. MARRIOTT, JR. 1<br />
Chairman of the Board and<br />
Chief Executive Officer<br />
Marriott International, Inc.<br />
JOHN W. MARRIOTT III<br />
Vice Chairman of the Board,<br />
Marriott International, Inc., and<br />
Chief Executive Officer,<br />
JWM Family Enterprises, L.P.<br />
RICHARD S. BRADDOCK 3<br />
Chairman, MidOcean Partners, and<br />
Chairman, Fresh Direct<br />
LAWRENCE W. KELLNER 1,2,4<br />
Chairman of the Board and<br />
Chief Executive Officer<br />
Continental Airlines, Inc.<br />
DEBRA L. LEE 4,5<br />
Chairman and Chief Executive Officer<br />
BET Networks<br />
FLORETTA DUKES McKENZIE 3,4<br />
Senior Advisor, American Institute for Research, and<br />
Former Founder and Chairwoman,<br />
The McKenzie Group<br />
GEORGE MUÑOZ 2,4,5<br />
Principal<br />
Muñoz Investment Banking Group, L.L.C.<br />
HARRY J. PEARCE 3,5<br />
Chairman<br />
Nortel Networks<br />
WILLIAM J. SHAW 5<br />
President and Chief Operating Officer<br />
Marriott International, Inc.<br />
LAWRENCE M. SMALL 2,3<br />
Secretary<br />
The Smithsonian Institution<br />
DIRECTOR EMERITUS<br />
STERLING D. COLTON<br />
CHAIRMAN EMERITUS<br />
THE RITZ-CARLTON HOTEL<br />
COMPANY, L.L.C.<br />
WILLIAM R. TIEFEL<br />
SENIOR EXECUTIVE OFFICERS<br />
J.W. MARRIOTT, JR. †<br />
Chairman of the Board and<br />
Chief Executive Officer<br />
WILLIAM J. SHAW †<br />
President and Chief Operating Officer<br />
EDWARD A. RYAN †<br />
Executive Vice President and<br />
General Counsel<br />
ARNE M. SORENSON †<br />
Executive Vice President,<br />
Chief Financial Officer and<br />
President – Continental European Lodging<br />
JAMES M. SULLIVAN †<br />
Executive Vice President<br />
Lodging Development<br />
70 | MARRIOTT INTERNATIONAL, INC. <strong>2006</strong><br />
CORPORATE OFFICERS<br />
LINDA A. BARTLETT<br />
Executive Vice President<br />
Finance, International Lodging<br />
CARL T. BERQUIST †<br />
Executive Vice President<br />
Financial Information and Enterprise<br />
Risk Management<br />
A. BRADFORD BRYAN, JR.<br />
Executive Vice President<br />
Architecture and Construction<br />
SIMON F. COOPER †<br />
President and Chief Operating Officer<br />
The Ritz-Carlton Hotel Company, L.L.C.<br />
MICHAEL E. DEARING<br />
Executive Vice President<br />
Project Finance<br />
VICTORIA L. DOLAN<br />
Executive Vice President – Finance and<br />
Chief Financial Officer – Marriott Vacation<br />
Club International<br />
JOEL M. EISEMANN<br />
Executive Vice President<br />
Owner and Franchise Services<br />
JAMES C. FISHER<br />
Senior Vice President<br />
Owner and Franchise Services<br />
PAUL FOSKEY<br />
Executive Vice President<br />
Lodging Development – Asia Pacific<br />
EDWIN D. FULLER †<br />
President and Managing Director<br />
Marriott Lodging – International<br />
STEVEN M. GOLDMAN<br />
Senior Vice President and<br />
Associate General Counsel<br />
DAVID J. GRISSEN<br />
Executive Vice President – Lodging Operations<br />
CAROLYN B. HANDLON 5<br />
Executive Vice President – Finance<br />
and Global Treasurer<br />
DEBORAH MARRIOTT HARRISON<br />
Vice President<br />
Government Affairs<br />
RICHARD S. HOFFMAN<br />
Executive Vice President<br />
Mergers, Acquisitions and Development Planning<br />
MICHAEL E. JANNINI<br />
Executive Vice President and General Manager<br />
Global Brand Strategy and Innovation<br />
NORMAN K. JENKINS 5<br />
Senior Vice President<br />
Lodging Development – North America<br />
STEPHEN P. JOYCE<br />
Executive Vice President<br />
Owner and Franchise Services and<br />
North American Full Service Development<br />
KEVIN P. KEARNEY<br />
Executive Vice President<br />
Lodging Development – Europe<br />
KARL KILBURG<br />
Executive Vice President – International Operations<br />
KEVIN M. KIMBALL<br />
Executive Vice President – Finance<br />
THOMAS E. LADD<br />
Senior Vice President – Government Affairs<br />
NANCY C. LEE<br />
Senior Vice President and<br />
Deputy General Counsel<br />
KATHLEEN MATTHEWS 5<br />
Executive Vice President<br />
Global Communications and Public Affairs<br />
ROBERT J. MCCARTHY †<br />
President<br />
North American Lodging Operations and<br />
Global Brand Management<br />
AMY C. MCPHERSON 5<br />
Executive Vice President<br />
Global Sales and Marketing<br />
SCOTT E. MELBY<br />
Executive Vice President<br />
Development Planning and Feasibility<br />
ROBERT A. MILLER<br />
President – Marriott Leisure<br />
PAMELA G. MURRAY<br />
Executive Vice President<br />
Enterprise Accounting Services<br />
DARYL A. NICKEL<br />
Executive Vice President – Lodging Development<br />
Select-Service and Extended-Stay Brands<br />
LAURA E. PAUGH<br />
Senior Vice President – Investor Relations<br />
M. LESTER PULSE, JR.<br />
Executive Vice President – Taxes<br />
DAVID A. RODRIGUEZ 5,†<br />
Executive Vice President<br />
Global Human Resources<br />
DAVID M. SAMPSON 5<br />
Senior Vice President – Diversity Initiatives<br />
TERRI L. TURNER<br />
Vice President, Corporate Secretary and<br />
Assistant General Counsel<br />
ROBIN J. ULER<br />
Senior Vice President<br />
Operations Planning and Support<br />
STEPHEN P. WEISZ †<br />
President<br />
Marriott Vacation Club International<br />
CARL WILSON<br />
Executive Vice President and<br />
Chief Information Officer<br />
LEGEND<br />
* All information as of March 5, 2007.<br />
1 Executive Committee<br />
2 Audit Committee<br />
3 Compensation Policy Committee<br />
4 Nominating and Corporate Governance Committee<br />
5 Committee for Excellence<br />
† Executive officer as defined under the Securities<br />
Exchange Act of 1934
Board of Directors<br />
[BACK ROW, LEFT TO RIGHT] LAWRENCE M. SMALL, RICHARD S. BRADDOCK, JOHN W. MARRIOTT III, HARRY J. PEARCE, LAWRENCE W. KELLNER<br />
[FRONT ROW, LEFT TO RIGHT] DEBRA L. LEE, WILLIAM J. SHAW, J.W. MARRIOTT, JR., FLORETTA DUKES MCKENZIE, GEORGE MUÑOZ<br />
Corporate Information<br />
CORPORATE HEADQUARTERS<br />
Marriott International, Inc.<br />
Marriott Drive<br />
Washington, DC 20058<br />
301/380-3000<br />
Internet: Marriott.com<br />
COMMON STOCK LISTINGS<br />
The company’s Class A common stock (ticker<br />
symbol: MAR) is listed on the New York Stock<br />
Exchange and other exchanges.<br />
SHAREHOLDERS OF RECORD<br />
At January 26, 2007, there were 387,952,048<br />
shares of Class A Common Stock outstanding<br />
held by 49,505 shareholders of record.<br />
INVESTOR RELATIONS<br />
For information, call: 301/380-6500<br />
Internet: Marriott.com/investor<br />
INDEPENDENT REGISTERED PUBLIC<br />
ACCOUNTING FIRM<br />
Ernst & Young LLP<br />
McLean, Virginia<br />
ANNUAL MEETING OF SHAREHOLDERS<br />
April 27, 2007 — 10:30 a.m.<br />
JW Marriott Hotel<br />
1331 Pennsylvania Avenue, NW<br />
Washington, DC 20004<br />
REGISTRAR AND TRANSFER AGENT<br />
Shareholder inquiries regarding stock transfers,<br />
dividend payments, address changes, enrollment<br />
in the company’s direct investment plan, lost<br />
stock certificates, or other stock account matters<br />
should be directed to:<br />
Mellon Investor Services<br />
480 Washington Blvd., 29th Floor<br />
Jersey City, NJ 07310<br />
800/311-4816 (U.S. and Canada)<br />
+1 201/680-6693 (International)<br />
Internet: www.melloninvestor.com<br />
Internet Users: We invite you to learn more about Marriott’s business and<br />
growth opportunities at Marriott.com/investor. Our investor site includes<br />
investor presentations, earnings conference calls, press releases, SEC filings, company<br />
history, and information about the company’s governance and board of<br />
directors. You may also enroll in our dividend reinvestment plan.<br />
COMMON STOCK PRICES AND DIVIDENDS<br />
Dividends<br />
Stock Price Declared<br />
High Low Per Share<br />
2005– First quarter ........ $34.00 $30.36 $0.0425<br />
– Second quarter.. 35.01 30.20 0.0525<br />
– Third quarter....... 35.39 30.21 0.0525<br />
– Fourth quarter ... 34.16 29.01 0.0525<br />
<strong>2006</strong>– First quarter ........ $35.35 $32.32 $0.0525<br />
– Second quarter.. 38.38 34.20 0.0625<br />
– Third quarter....... 38.44 34.30 0.0625<br />
– Fourth quarter ... 48.31 37.19 0.0625<br />
TELEPHONE NUMBERS<br />
For reservations or information, call:<br />
Marriott Hotels & Resorts ................. 800/228-9290<br />
Marriott Conference Centers........... 800/453-0309<br />
Renaissance Hotels & Resorts ......... 800/468-3571<br />
The Ritz-Carlton Hotel<br />
Company, L.L.C.................................. 800/241-3333<br />
Bulgari Hotels & Resorts.................... 301/547-4900<br />
JW Marriott Hotels & Resorts .......... 800/228-9290<br />
Courtyard................................................ 800/321-2211<br />
SpringHill Suites................................... 888/287-9400<br />
Fairfield Inn ............................................ 800/228-2800<br />
Residence Inn........................................ 800/331-3131<br />
TownePlace Suites............................... 800/257-3000<br />
Marriott Executive Apartments ...... 800/800-5744<br />
Marriott ExecuStay.............................. 800/800-5744<br />
Marriott Vacation Club....................... 866/300-3032<br />
Horizons by Marriott<br />
Vacation Club .................................... 866/300-3032<br />
Grand Residences by Marriott ........ 866/894-7263<br />
The Ritz-Carlton Club ......................... 800/941-4386<br />
LODGING DEVELOPMENT INQUIRIES<br />
North America Full-Service ................ 301/380-3200<br />
North America Select-Service and<br />
Extended-Stay ..................................... 301/380-5237<br />
Caribbean and Latin America............ 301/380-2340<br />
Europe, the Middle East<br />
and Africa .......................................... 41-44-723-5100<br />
Asia/Pacific ............................................. 852-2521-1848<br />
Internet: www.MarriottDevelopment.com<br />
CEO AND CFO CERTIFICATIONS<br />
As required by the New York Stock Exchange listing<br />
rules, our Chief Executive Officer certified to<br />
the New York Stock Exchange on May 24, <strong>2006</strong>, that<br />
he was not aware of any violation by the company<br />
of the New York Stock Exchange listing standards<br />
as of that date. In addition, our Chief Executive<br />
Officer and our Chief Financial Officer have provided<br />
certifications with respect to the company’s<br />
public disclosures as required under Rule 13a-14(a)<br />
and Rule 13a-14(b) of the Securities Exchange Act,<br />
which certifications were either furnished or filed<br />
as Exhibits 31.1, 31.2 and 32 to the company’s<br />
<strong>Annual</strong> <strong>Report</strong> on Form 10-K for fiscal year <strong>2006</strong><br />
filed with the Securities and Exchange Commission.<br />
OTHER INFORMATION<br />
Any shareholder who would like a copy of the<br />
company’s <strong>Annual</strong> <strong>Report</strong> on Form 10-K for fiscal<br />
year <strong>2006</strong> may obtain one, without charge, by<br />
addressing a request to the Secretary, Marriott<br />
International, Inc., Department 52/862, Marriott<br />
Drive, Washington, DC 20058. The company’s<br />
copying costs will be charged if copies of exhibits<br />
to the <strong>Annual</strong> <strong>Report</strong> on Form 10-K are<br />
requested. You may also obtain a copy of the<br />
<strong>Annual</strong> <strong>Report</strong> on Form 10-K for fiscal year <strong>2006</strong>,<br />
including exhibits, from the company’s web site<br />
at Marriott.com/investor, clicking on “Corporate<br />
Information and SEC Filings.”<br />
Shareholders may also elect to receive notices of shareholder meetings, proxy<br />
materials and annual reports electronically through the Internet. If your shares are<br />
registered in your own name, and not in “street name” through a broker or other<br />
nominee, simply log in to Investor ServiceDirect, the Internet site maintained by<br />
our transfer agent, Mellon Investor Services LLC, at www.melloninvestor.com/isd<br />
and the step-by-step instructions will prompt you through enrollment.<br />
©MARRIOTT INTERNATIONAL, INC. 2007 ALL RIGHTS RESERVED. PRINTED ON RECYCLED PAPER. MARRIOTT INTERNATIONAL, INC. <strong>2006</strong> | 71
S P I R I T<br />
T O S<br />
As we celebrate our 80th year, Marriott renews its<br />
commitment to the thousands of communities around<br />
the world where we do business. Social responsibility<br />
and community engagement are integral to our future<br />
and a vibrant part of our history — it’s a tradition we<br />
call “Spirit To Serve Our Communities. ® ”<br />
Marriott is committed to food and shelter programs.<br />
Through our 15-year support of America’s Second<br />
Harvest, we recognize hunger as a critical issue. In<br />
collaboration with Habitat for Humanity International,<br />
our associates helped build homes in New Orleans;<br />
Phuket, Thailand; Mexico City; and Washington, DC.<br />
We support education and workforce development<br />
through youth-focused programs including the<br />
National Academy Foundation, Distributive Education<br />
Clubs of America, the National Urban League and<br />
the Hispanic College Fund in the United States.<br />
Globally, Marriott is the hotel industry champion<br />
of the International Business Leaders Forum’s<br />
Youth Career Initiative.<br />
Marriott promotes the health, well-being and<br />
protection of children through thousands of volunteer<br />
hours, raising funds and donating goods and<br />
services. This year, we helped Safe Kids Worldwide<br />
launch a child-safety education program that reached<br />
220,000 students in China. In North America, we and<br />
our associates donated nearly $7 million in <strong>2006</strong> to<br />
Children’s Miracle Network hospitals, which provide<br />
essential medical care for children in more than<br />
170 communities.<br />
A Pledge to Social Responsibility<br />
YEARS<br />
E R V E<br />
You can learn more about Marriott’s community,<br />
environmental and human rights initiatives at<br />
www.Marriott.com.<br />
We are committed to environmental stewardship.<br />
Our North American hotels are now smoke-free for<br />
better health and indoor air quality. We initiated our<br />
ECHO — Environmentally Conscious Hospitality<br />
Operations — program 12 years ago, focusing on<br />
water and energy conservation, and community<br />
cleanups during our observance of Environmental<br />
Awareness Month in April. Marriott will also work<br />
together with Clean Up the World, a global environmental<br />
group, to help drive eco-conscious efforts on<br />
the road, at work, at home and in our communities.<br />
As the first hospitality management company in the<br />
Environmental Protection Agency’s Climate Leaders<br />
program, we are on track to meet our greenhouse<br />
gas reduction commitment of 6 percent per available<br />
room by 2010, having reduced our emissions 2 percent<br />
this year. Marriott has the most ENERGY STAR<br />
hotels in the industry and, in partnership with owners,<br />
we are developing more sustainable hotels that will<br />
be eligible for certifications such as LEED—Leadership<br />
in Energy and Environmental Design — which is<br />
awarded by the U.S. Green Building Council.<br />
We are proud that we gave voice in <strong>2006</strong> to<br />
significant issues for the travel industry. We<br />
addressed such topics as the protection of children<br />
from sexual exploitation, human rights, business ethics,<br />
and visa and immigration reform at important forums,<br />
including the World Travel and Tourism Conference,<br />
the United Nations World Tourism Organization and<br />
the Foreign Policy Association, which presented us<br />
with its <strong>2006</strong> Corporate Social Responsibility Award.<br />
MARRIOTT DRIVE • WASHINGTON, D.C. • 20058 • MARRIOTT.COM