2006 Annual Report
2006 Annual Report
2006 Annual Report

You also want an ePaper? Increase the reach of your titles
YUMPU automatically turns print PDFs into web optimized ePapers that Google loves.
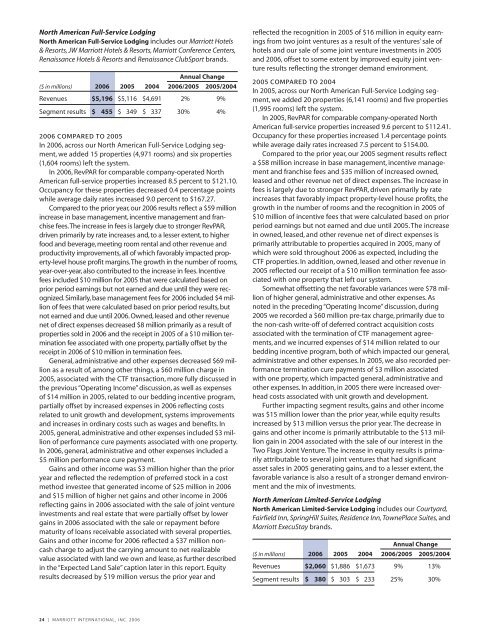
North American Full-Service Lodging<br />
North American Full-Service Lodging includes our Marriott Hotels<br />
& Resorts, JW Marriott Hotels & Resorts, Marriott Conference Centers,<br />
Renaissance Hotels & Resorts and Renaissance ClubSport brands.<br />
<strong>Annual</strong> Change<br />
($ in millions) <strong>2006</strong> 2005 2004 <strong>2006</strong>/2005 2005/2004<br />
Revenues $5,196 $5,116 $4,691 2% 9%<br />
Segment results $ 455 $ 349 $ 337 30% 4%<br />
<strong>2006</strong> COMPARED TO 2005<br />
In <strong>2006</strong>, across our North American Full-Service Lodging segment,<br />
we added 15 properties (4,971 rooms) and six properties<br />
(1,604 rooms) left the system.<br />
In <strong>2006</strong>, RevPAR for comparable company-operated North<br />
American full-service properties increased 8.5 percent to $121.10.<br />
Occupancy for these properties decreased 0.4 percentage points<br />
while average daily rates increased 9.0 percent to $167.27.<br />
Compared to the prior year, our <strong>2006</strong> results reflect a $59 million<br />
increase in base management, incentive management and franchise<br />
fees.The increase in fees is largely due to stronger RevPAR,<br />
driven primarily by rate increases and, to a lesser extent, to higher<br />
food and beverage, meeting room rental and other revenue and<br />
productivity improvements, all of which favorably impacted property-level<br />
house profit margins.The growth in the number of rooms,<br />
year-over-year, also contributed to the increase in fees. Incentive<br />
fees included $10 million for 2005 that were calculated based on<br />
prior period earnings but not earned and due until they were recognized.<br />
Similarly, base management fees for <strong>2006</strong> included $4 million<br />
of fees that were calculated based on prior period results, but<br />
not earned and due until <strong>2006</strong>. Owned, leased and other revenue<br />
net of direct expenses decreased $8 million primarily as a result of<br />
properties sold in <strong>2006</strong> and the receipt in 2005 of a $10 million termination<br />
fee associated with one property, partially offset by the<br />
receipt in <strong>2006</strong> of $10 million in termination fees.<br />
General, administrative and other expenses decreased $69 million<br />
as a result of, among other things, a $60 million charge in<br />
2005, associated with the CTF transaction, more fully discussed in<br />
the previous “Operating Income” discussion, as well as expenses<br />
of $14 million in 2005, related to our bedding incentive program,<br />
partially offset by increased expenses in <strong>2006</strong> reflecting costs<br />
related to unit growth and development, systems improvements<br />
and increases in ordinary costs such as wages and benefits. In<br />
2005, general, administrative and other expenses included $3 million<br />
of performance cure payments associated with one property.<br />
In <strong>2006</strong>, general, administrative and other expenses included a<br />
$5 million performance cure payment.<br />
Gains and other income was $3 million higher than the prior<br />
year and reflected the redemption of preferred stock in a cost<br />
method investee that generated income of $25 million in <strong>2006</strong><br />
and $15 million of higher net gains and other income in <strong>2006</strong><br />
reflecting gains in <strong>2006</strong> associated with the sale of joint venture<br />
investments and real estate that were partially offset by lower<br />
gains in <strong>2006</strong> associated with the sale or repayment before<br />
maturity of loans receivable associated with several properties.<br />
Gains and other income for <strong>2006</strong> reflected a $37 million noncash<br />
charge to adjust the carrying amount to net realizable<br />
value associated with land we own and lease, as further described<br />
in the “Expected Land Sale” caption later in this report. Equity<br />
results decreased by $19 million versus the prior year and<br />
24 | MARRIOTT INTERNATIONAL, INC. <strong>2006</strong><br />
reflected the recognition in 2005 of $16 million in equity earnings<br />
from two joint ventures as a result of the ventures’ sale of<br />
hotels and our sale of some joint venture investments in 2005<br />
and <strong>2006</strong>, offset to some extent by improved equity joint venture<br />
results reflecting the stronger demand environment.<br />
2005 COMPARED TO 2004<br />
In 2005, across our North American Full-Service Lodging segment,<br />
we added 20 properties (6,141 rooms) and five properties<br />
(1,995 rooms) left the system.<br />
In 2005, RevPAR for comparable company-operated North<br />
American full-service properties increased 9.6 percent to $112.41.<br />
Occupancy for these properties increased 1.4 percentage points<br />
while average daily rates increased 7.5 percent to $154.00.<br />
Compared to the prior year, our 2005 segment results reflect<br />
a $58 million increase in base management, incentive management<br />
and franchise fees and $35 million of increased owned,<br />
leased and other revenue net of direct expenses. The increase in<br />
fees is largely due to stronger RevPAR, driven primarily by rate<br />
increases that favorably impact property-level house profits, the<br />
growth in the number of rooms and the recognition in 2005 of<br />
$10 million of incentive fees that were calculated based on prior<br />
period earnings but not earned and due until 2005. The increase<br />
in owned, leased, and other revenue net of direct expenses is<br />
primarily attributable to properties acquired in 2005, many of<br />
which were sold throughout <strong>2006</strong> as expected, including the<br />
CTF properties. In addition, owned, leased and other revenue in<br />
2005 reflected our receipt of a $10 million termination fee associated<br />
with one property that left our system.<br />
Somewhat offsetting the net favorable variances were $78 million<br />
of higher general, administrative and other expenses. As<br />
noted in the preceding “Operating Income” discussion, during<br />
2005 we recorded a $60 million pre-tax charge, primarily due to<br />
the non-cash write-off of deferred contract acquisition costs<br />
associated with the termination of CTF management agreements,<br />
and we incurred expenses of $14 million related to our<br />
bedding incentive program, both of which impacted our general,<br />
administrative and other expenses. In 2005, we also recorded performance<br />
termination cure payments of $3 million associated<br />
with one property, which impacted general, administrative and<br />
other expenses. In addition, in 2005 there were increased overhead<br />
costs associated with unit growth and development.<br />
Further impacting segment results, gains and other income<br />
was $15 million lower than the prior year, while equity results<br />
increased by $13 million versus the prior year. The decrease in<br />
gains and other income is primarily attributable to the $13 million<br />
gain in 2004 associated with the sale of our interest in the<br />
Two Flags Joint Venture. The increase in equity results is primarily<br />
attributable to several joint ventures that had significant<br />
asset sales in 2005 generating gains, and to a lesser extent, the<br />
favorable variance is also a result of a stronger demand environment<br />
and the mix of investments.<br />
North American Limited-Service Lodging<br />
North American Limited-Service Lodging includes our Courtyard,<br />
Fairfield Inn, SpringHill Suites, Residence Inn, TownePlace Suites, and<br />
Marriott ExecuStay brands.<br />
<strong>Annual</strong> Change<br />
($ in millions) <strong>2006</strong> 2005 2004 <strong>2006</strong>/2005 2005/2004<br />
Revenues $2,060 $1,886 $1,673 9% 13%<br />
Segment results $ 380 $ 303 $ 233 25% 30%