2006 Annual Report
2006 Annual Report
2006 Annual Report

Create successful ePaper yourself
Turn your PDF publications into a flip-book with our unique Google optimized e-Paper software.
Selected Historical Financial Data — Unaudited<br />
The following table presents a summary of selected historical financial data for the Company derived from our financial statements as<br />
of and for our last eight fiscal years.<br />
Since the information in this table is only a summary and does not provide all of the information contained in our financial statements,<br />
including the related notes, you should read “Management’s Discussion and Analysis of Financial Condition and Results of<br />
Operations” and our Consolidated Financial Statements.<br />
Fiscal Year1 ($ in millions, except per share data) <strong>2006</strong> 2005 2004 2003 2002 2001 2000 1999<br />
Income Statement Data:<br />
Revenues (2) $12,160 $11,550 $10,099 $ 9,014 $ 8,415 $ 7,768 $ 7,911 $ 7,026<br />
Operating income (2) $ 1,011 $ 555 $ 477 $ 377 $ 321 $ 420 $ 762 $ 621<br />
Income from continuing operations $ 717 $ 668 $ 594 $ 476 $ 439 $ 269 $ 490 $ 399<br />
Cumulative effect of change in accounting principle (3) (109) — — — — — — —<br />
Discontinued operations — 1 2 26 (162) (33) (11) 1<br />
Net income $ 608 $ 669 $ 596 $ 502 $ 277 $ 236 $ 479 $ 400<br />
Per Share Data (4) :<br />
Diluted earnings per share from continuing operations $ 1.66 $ 1.45 $ 1.24 $ 0.97 $ 0.87 $ 0.52 $ 0.96 $ 0.75<br />
Diluted loss per share from cumulative effect<br />
of change in accounting principle (0.25) — — — — — — —<br />
Diluted earnings (loss) per share from<br />
discontinued operations — — — 0.05 (0.32) (0.06) (0.02) —<br />
Diluted earnings per share $ 1.41 $ 1.45 $ 1.24 $ 1.02 $ 0.55 $ 0.46 $ 0.94 $ 0.75<br />
Cash dividends declared per share $0.2400 $0.2000 $0.1650 $0.1475 $0.1375 $0.1275 $0.1175 $0.1075<br />
Balance Sheet Data (at end of year):<br />
Total assets $ 8,588 $ 8,530 $ 8,668 $ 8,177 $ 8,296 $ 9,107 $ 8,237 $ 7,324<br />
Long-term debt (2) 1,818 1,681 836 1,391 1,553 2,708 1,908 1,570<br />
Shareholders’ equity 2,618 3,252 4,081 3,838 3,573 3,478 3,267 2,908<br />
Other Data:<br />
Base management fees (2) $ 553 $ 497 $ 435 $ 388 $ 379 $ 372 $ 383 $ 352<br />
Franchise fees (2) 390 329 296 245 232 220 208 180<br />
Incentive management fees (2) 281 201 142 109 162 202 316 268<br />
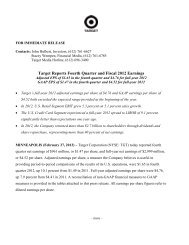
Total Fees $ 1,224 $ 1,027 $ 873 $ 742 $ 773 $ 794 $ 907 $ 800<br />
Fee Revenue-Source:<br />
North America (5) $ 955 $ 809 $ 682 $ 592 $ 626 $ 664 $ 779 $ 690<br />
Outside North America 269 218 191 150 147 130 128 110<br />
$ 1,224 $ 1,027 $ 873 $ 742 $ 773 $ 794 $ 907 $ 800<br />
(1) All fiscal years included 52 weeks, except for 2002, which included 53 weeks.<br />
(2) Balances reflect our Senior Living Services and Distribution Services businesses as discontinued operations.<br />
(3) We adopted Statement of Position 04-2 “Accounting for Real Estate Time-Sharing Transactions,” in our <strong>2006</strong> first quarter which we reported in our Consolidated Statement of<br />
Income as a cumulative effect of change in accounting principle.<br />
(4) All per share amounts in the table above have been adjusted to reflect the June 9, <strong>2006</strong>, stock split effected in the form of a stock dividend.<br />
(5) Includes the Continental United States and Canada.<br />
Franchise Fees<br />
Incentive Management Fees<br />
Base Management Fees<br />
$907<br />
$383 $316 $208<br />
2000<br />
$794<br />
$220<br />
$202<br />
$372<br />
2001<br />
$773<br />
$232<br />
$162<br />
$379<br />
2002<br />
$742<br />
$245<br />
$109<br />
$388<br />
2003<br />
$873<br />
2004<br />
TOTAL FEES<br />
($ in millions)<br />
$296<br />
$142<br />
$435<br />
$1,027<br />
$329<br />
$201<br />
$497<br />
2005<br />
$1,224<br />
$553 $281 $390<br />
<strong>2006</strong><br />
$1,908<br />
2000<br />
$2,708<br />
2001<br />
$1,553<br />
2002<br />
$1,391<br />
2003<br />
$836<br />
2004<br />
LONG-TERM DEBT<br />
($ in millions)<br />
$1,681<br />
2005<br />
$1,818<br />
<strong>2006</strong><br />
$0.96<br />
$0.52<br />
$0.87<br />
$0.97<br />
$1.24<br />
$1.45<br />
2000 2001 2002 2003 2004 2005<br />
DILUTED EARNINGS PER SHARE<br />
FROM CONTINUING OPERATIONS<br />
$1.66<br />
<strong>2006</strong><br />
MARRIOTT INTERNATIONAL, INC. <strong>2006</strong> | 65