A method to characterize the greenness of solvents - Rowan ...
A method to characterize the greenness of solvents - Rowan ...
A method to characterize the greenness of solvents - Rowan ...

Create successful ePaper yourself
Turn your PDF publications into a flip-book with our unique Google optimized e-Paper software.
P1: QKS<br />
LESA˙08˙251640 ESA.cls July 26, 2007 13:58<br />
5<br />
10<br />
15<br />
20<br />
25<br />
30<br />
35<br />
Journal <strong>of</strong> Environmental Science and Health Part A (2007) 42, 1–11<br />
Copyright C○ Taylor & Francis Group, LLC<br />
ISSN: 1093-4529 (Print); 1532-4117 (Online)<br />
DOI: 10.1080/10934520701517747<br />
A <strong>method</strong> <strong>to</strong> <strong>characterize</strong> <strong>the</strong> <strong>greenness</strong> <strong>of</strong> <strong>solvents</strong> used in<br />
pharmaceutical manufacture<br />
C. STEWART SLATER and MARIANO SAVELSKI<br />
Department <strong>of</strong> Chemical Engineering, <strong>Rowan</strong> University, Glassboro, New Jersey, USA<br />
This paper describes <strong>the</strong> development <strong>of</strong> a <strong>method</strong> <strong>to</strong> calculate <strong>the</strong> overall “<strong>greenness</strong>” <strong>of</strong> a pharmaceutical process that uses multiple<br />
<strong>solvents</strong>. This calculation is made by taking in<strong>to</strong> account various environmental parameters and determining an overall <strong>greenness</strong><br />
index. Through this <strong>method</strong> a scientist or engineer can effectively determine alternative, “greener” <strong>solvents</strong> or processes based on<br />
<strong>the</strong> use <strong>of</strong> a solvent database and <strong>greenness</strong> score. The objective is <strong>to</strong> develop a means <strong>to</strong> improve <strong>the</strong> process <strong>of</strong> drug development<br />
through solvent replacement/reduction. A solvent selection table, using a common spreadsheet s<strong>of</strong>tware routine, was developed for<br />
<strong>the</strong> purpose <strong>of</strong> allowing a user <strong>to</strong> compare <strong>the</strong> <strong>greenness</strong> between two different process routes. This table includes over 60 <strong>solvents</strong> and<br />
associated chemicals common in <strong>the</strong> pharmaceutical and chemical industries. The comparison was made possible by <strong>the</strong> creation <strong>of</strong><br />
a user-defined, weighted-solvent, <strong>greenness</strong> index that is an overall weighted fac<strong>to</strong>r taking in<strong>to</strong> consideration solvent type, quantity<br />
used, and environmental impact. A given process or solvent receives an index ranking based on a variety <strong>of</strong> environmental and health<br />
parameters. The index values, along with <strong>the</strong> mass <strong>of</strong> <strong>solvents</strong> used in <strong>the</strong> given process, are used <strong>to</strong> compute <strong>the</strong> index, which allows<br />
for a quick and easy quantitative environmental comparison between two potential process routes.<br />
Keywords: Green engineering, green chemistry, solvent metrics, pharmaceutical processing.<br />
Introduction<br />
Background<br />
The majority <strong>of</strong> drug products made through organic syn<strong>the</strong>sis<br />
routes are made in batch processes, and <strong>the</strong>y require<br />
many sequential reaction steps and large quantities and<br />
number <strong>of</strong> organic <strong>solvents</strong> with varying degrees <strong>of</strong> <strong>to</strong>xicity.<br />
None <strong>of</strong> <strong>the</strong> preceding situations are optimal from a<br />
green engineering manufacturing standpoint. Pharmaceutical<br />
manufacturing utilizes batch processes and numerous<br />
solid-liquid separation and purification steps. Liquid waste<br />
streams containing <strong>the</strong>se <strong>solvents</strong> occur from crystallization,<br />
extraction and solids washing, and cleaning processes<br />
as well as byproducts from inefficient reactions. Solvent<br />
wastes released in <strong>the</strong> air as votatile organic compounds<br />
(VOCs) are produced from solid drying processes, tableting<br />
and coating operations, and fugitive emissions from <strong>the</strong><br />
manufacturing process. Besides releases in<strong>to</strong> <strong>the</strong> air, <strong>solvents</strong><br />
can be found in <strong>the</strong> solid and liquid wastes that occur<br />
in <strong>the</strong> filtration and centrifugation operations <strong>of</strong> <strong>the</strong><br />
Address correspondence <strong>to</strong> C. Stewart Slater, <strong>Rowan</strong> University,<br />
Department <strong>of</strong> Chemical Engineering, Glassboro, NJ 08028.<br />
E-mail: slater@rowan.edu<br />
Received January 31, 2007.<br />
API (active pharmaceutical ingredient) and intermediate<br />
production.<br />
Consequently, green engineering and sustainability issues<br />
have become a concern for <strong>the</strong> pharmaceutical and specialty<br />
chemical processing industries. Reported incidents 40<br />
concerning <strong>to</strong>xic release <strong>of</strong> chemicals in<strong>to</strong> <strong>the</strong> environment,<br />
food supply contamination, and hazardous work conditions<br />
led <strong>to</strong> measures such as <strong>the</strong> Clean Air Act, <strong>the</strong> Clean<br />
Water Act, and <strong>the</strong> Occupational Safety and Health Act. [1]<br />
In addition, federal agencies such as <strong>the</strong> U.S. Environmen- 45<br />
tal Protection Agency (EPA) have developed a number <strong>of</strong><br />
programs promoting increased environmental and health<br />
awareness. [2] One such program, <strong>the</strong> National Environmental<br />
Performance Track, recognizes and rewards industrial<br />
facilities that exceed environmental/health standards while 50<br />
working closely with <strong>the</strong> surrounding community.<br />
Design for Environment (DfE) is ano<strong>the</strong>r government<br />
program that works with specific industries <strong>to</strong> integrate<br />
health and environmental considerations in<strong>to</strong> typical business<br />
decisions. This program promotes source reduction or 55<br />
prevention when it comes <strong>to</strong> human or environmental risks,<br />
ra<strong>the</strong>r than controls at <strong>the</strong> end <strong>of</strong> <strong>the</strong> process. The Pollution<br />
Prevention and Source Reduction Assistance Programs<br />
<strong>of</strong>fer opportunities for collaborative pollution prevention<br />
and training activities. O<strong>the</strong>r EPA programs such as <strong>the</strong> 60<br />
Presidential Green Chemistry Awards recognize specific
P1: QKS<br />
LESA˙08˙251640 ESA.cls July 26, 2007 13:58<br />
65<br />
70<br />
75<br />
80<br />
85<br />
90<br />
2 Slater and Savelski<br />
achievements in green chemistry. The outcomes measured<br />
by many <strong>of</strong> <strong>the</strong>se programs are typically <strong>to</strong>tal lbs/year <strong>of</strong><br />
waste reduction with little emphasis on <strong>the</strong> relative nature<br />
<strong>of</strong> <strong>the</strong> pollutants reduced or <strong>the</strong>ir broader environmental<br />
consequences.<br />
Based on a review <strong>of</strong> <strong>the</strong> 2005 Toxic Release Inven<strong>to</strong>ry<br />
data, [3] <strong>the</strong> pharmaceutical industry sec<strong>to</strong>r (SIC codes 2833<br />
and 2834) reported over 530 million pounds <strong>of</strong> waste <strong>to</strong><br />
<strong>the</strong> EPA’s Toxic Release Inven<strong>to</strong>ry. These wastes represent<br />
organic <strong>solvents</strong> and associated chemicals (acids, bases, nitrates,<br />
etc.) from <strong>the</strong> various processes used in drug manufacture.<br />
Generally, <strong>the</strong> pharmaceutical industry has <strong>the</strong><br />
highest waste generation and <strong>the</strong> highest amount <strong>of</strong> or-<br />
ganic <strong>solvents</strong> used per mass <strong>of</strong> product produced for any<br />
commercial sec<strong>to</strong>r. The solvent use rates can range from<br />
10–800 kg/kg API depending on <strong>the</strong> type <strong>of</strong> pharmaceutical<br />
and stage <strong>of</strong> development. [4] Typical waste streams from<br />
drugs made through organic syn<strong>the</strong>sis contain over 80% or-<br />
ganic <strong>solvents</strong>. [5] These include organic <strong>solvents</strong> classified in<br />
<strong>the</strong> TRI as priority pollutants or hazardous air pollutants<br />
and those that fall outside <strong>of</strong> <strong>the</strong> TRI classification, but<br />
still pose risk <strong>to</strong> <strong>the</strong> environment if released. According <strong>to</strong><br />
Jimenez-Gonzalez et al. [6] approximately 60% <strong>of</strong> <strong>the</strong> overall<br />
energy usage in pharmaceutical production and 50% <strong>of</strong> <strong>the</strong><br />
post-treatment greenhouse gas emissions are a result <strong>of</strong> <strong>the</strong><br />
solvent usage throughout <strong>the</strong> process.<br />
The <strong>to</strong>p 20 <strong>solvents</strong> released by <strong>the</strong> pharmaceutical sec<strong>to</strong>r<br />
according <strong>to</strong> <strong>the</strong> 2005 Toxic Release Inven<strong>to</strong>ry (TRI)<br />
are shown in Table 1. Out <strong>of</strong> over 170 chemicals listed on<br />
Table 1. Top 20 chemicals released by <strong>the</strong> pharmaceutical sec<strong>to</strong>r<br />
in 2005 according <strong>to</strong> <strong>the</strong> EPA Toxic Release Inven<strong>to</strong>ry [3]<br />
Chemical Releases (Million lb/year)<br />
Methanol 166.71<br />
Dichloromethane 57.09<br />
Formaldehyde 47.76<br />
Toluene 43.57<br />
Hydrochloric acid 34.85<br />
Ammonia 25.51<br />
Ace<strong>to</strong>nitrile 20.51<br />
n-Hexane 16.27<br />
n-Methyl-2-Pyrrolidone 11.47<br />
Formic acid 11.09<br />
n-Butyl alcohol 10.11<br />
n, n-Dimethylformamide 9.21<br />
Chlor<strong>of</strong>orm 7.80<br />
Nitrate compounds 6.32<br />
Methyl tert-butyl e<strong>the</strong>r 5.44<br />
Xylene (mixed isomers) 4.18<br />
Arsenic compounds 3.62<br />
Certain Glycol E<strong>the</strong>rs 3.39<br />
1,1,2-Trichloroethane 3.30<br />
Bromine 2.89<br />
Total (for <strong>the</strong> <strong>to</strong>p 20 listed) 491.11<br />
Total (for all TRI chemicals) 532.36<br />
<strong>the</strong> TRI, <strong>the</strong> <strong>to</strong>p 20 <strong>solvents</strong> comprise over 90% <strong>of</strong> <strong>the</strong> <strong>to</strong>tal<br />
listed releases. The TRI listing does not report many<br />
commonly used <strong>solvents</strong> such as ace<strong>to</strong>ne and ethyl acetate<br />
since <strong>the</strong>y are not classified by EPA as priority pollutants<br />
or hazardous air pollutants. Despite this fact, <strong>the</strong> data is 95<br />
useful in examining <strong>the</strong> major environmental pollutants released<br />
and examining trends in solvent usage. Solvents are<br />
<strong>the</strong> most heavily used and disposed <strong>of</strong> chemicals in <strong>the</strong> pharmaceutical<br />
industry, and a great deal <strong>of</strong> improvements can<br />
be made <strong>to</strong> decrease <strong>the</strong> amount <strong>of</strong> <strong>solvents</strong> used and re- 100<br />
leased. The <strong>solvents</strong> included in <strong>the</strong> TRI pose significant<br />
environmental concerns regarding <strong>the</strong>ir release in<strong>to</strong> <strong>the</strong> environment.<br />
These <strong>solvents</strong> have varying degrees <strong>of</strong> <strong>to</strong>xicity<br />
<strong>to</strong> humans and animals, and some are known or possible<br />
carcinogens. 105<br />
Research is underway <strong>to</strong> examine <strong>the</strong> reduction and substitution<br />
in <strong>the</strong> use <strong>of</strong> <strong>the</strong>se <strong>solvents</strong> through innovative<br />
green chemistry/green engineering and environmental design<br />
strategies. The positive impacts <strong>of</strong> <strong>the</strong>se new strategies<br />
are <strong>the</strong> reduction <strong>of</strong> solvent use and environmental 110<br />
releases as well as <strong>the</strong> substitution <strong>of</strong> greener and more benign<br />
<strong>solvents</strong> that can be used in <strong>the</strong> various processing<br />
steps. Effective solvent selection and evaluation <strong>to</strong>ols are<br />
necessary so that <strong>the</strong> pharmaceutical industry can gauge its<br />
progress in developing alternate syn<strong>the</strong>ses and manufactur- 115<br />
ing processes. This paper focuses on <strong>the</strong> development <strong>of</strong> a<br />
solvent selection measurement <strong>to</strong>ol that will allow <strong>the</strong> user<br />
<strong>to</strong> compare <strong>solvents</strong> and processes with relative ease based<br />
on multiple environmental and physical properties. It can<br />
help scientists and engineers who need <strong>to</strong> quantify broader 120<br />
environmental implications <strong>of</strong> <strong>solvents</strong> used in a process.<br />
Review <strong>of</strong> current solvent selection <strong>method</strong>ologies<br />
Solvent selection techniques have been developed that can<br />
help a scientist/engineer <strong>to</strong> make better informed decisions<br />
when choosing <strong>solvents</strong>. According <strong>to</strong> Gani et al. [7] <strong>the</strong>re 125<br />
are basically four areas from which information can be<br />
drawn: benchmarking, databases, expertise and experience,<br />
and computer-aided technologies. Benchmarking uses existing<br />
processes or chemicals with similar properties <strong>to</strong> draw<br />
conclusions on unknown processes and chemicals. As sci- 130<br />
entists/engineers gain expertise in <strong>solvents</strong> and processes,<br />
<strong>the</strong>y become able <strong>to</strong> make better informed decisions based<br />
on what <strong>the</strong>y have experienced and learned. Computeraided<br />
technologies, along with databases, <strong>of</strong>fer sources and<br />
<strong>method</strong>s <strong>to</strong> determine and estimate properties <strong>of</strong> various 135<br />
<strong>solvents</strong> <strong>to</strong> provide a basis <strong>of</strong> comparison. Table 2 shows<br />
some <strong>of</strong> <strong>the</strong> computer-aided technologies that are available<br />
and are used by pharmaceutical and specialty chemical<br />
companies. [8] Some <strong>of</strong> <strong>the</strong>se are <strong>method</strong>s, such as <strong>the</strong><br />
GlaxoSmithKline (GSK) and Bris<strong>to</strong>l-Myers Squibb (BMS) 140<br />
techniques, were developed “in-house” for <strong>the</strong>ir use, while<br />
o<strong>the</strong>rs are publicly available. [9]<br />
Gani et al. [7] have also proposed a four-step <strong>method</strong> that<br />
clearly defines <strong>the</strong> problem <strong>of</strong> solvent selection and provides
P1: QKS<br />
LESA˙08˙251640 ESA.cls July 26, 2007 13:58<br />
145<br />
150<br />
155<br />
160<br />
Solvents used in pharmaceutical manufacture 3<br />
Table 2. Computer-aided solvent selection and property <strong>to</strong>ols<br />
Solvent selection <strong>to</strong>ol Main features<br />
GSK-Solvent Selection Guide A proprietary visual, web-based solvent-selection <strong>to</strong>ol for selecting “greener” <strong>solvents</strong> for<br />
various reactions common in pharmaceutical syn<strong>the</strong>sis.<br />
BMS Process Greenness Scorecard A computer <strong>to</strong>ol <strong>to</strong> rate <strong>the</strong> relative <strong>greenness</strong> <strong>of</strong> <strong>solvents</strong> based various green chemistry<br />
ProCAMD (ProPred, PDS,<br />
Solu-Calc, CAPEC-Database);<br />
SMSwin<br />
process parameters. Integrates with AspenTech and IntelliChem.<br />
Hybrid computer-aided technique for solvent selection; applies <strong>to</strong> wide range <strong>of</strong> industrial<br />
applications.<br />
NRTL-SAC AND eNRTL-SAC Method uses chemical <strong>the</strong>rmodynamic parameters such as activity coefficient. Applicable for<br />
crystallization solvent selection and electrolytes.<br />
ISSDS Method permits alternative solvent selection from multiple databases though one<br />
“Integrated Solvent Substitution Data System.”<br />
SAGE A logic tree system that evaluates an operating scenario and <strong>the</strong>n identifies possible<br />
alternative solvent chemistries. Originally developed for surface treating/cleaning<br />
applications.<br />
COSMO-RS, COSMO-SAC A physical property predictive modelling <strong>method</strong> for solvent fluid phase <strong>the</strong>rmodynamics.<br />
Adapted from Jimenez-Gonzalez et al. [8]<br />
a means <strong>to</strong> find that most appropriate solvent. The first step<br />
in addressing <strong>the</strong> solvent selection issue is <strong>to</strong> define and<br />
identify <strong>the</strong> problem clearly in terms <strong>of</strong> process applications,<br />
process formulations, and/or cleaning and washing.<br />
Once <strong>the</strong> problem or issue is defined, <strong>the</strong> search criteria can<br />
be identified with respect <strong>to</strong> physical and chemical properties,<br />
environment, health and safety (EHS) properties and<br />
concerns, operational concerns, and economic issues. To<br />
reduce <strong>the</strong> number <strong>of</strong> potential <strong>solvents</strong> and optimize <strong>the</strong><br />
selection process, computational and experimental studies<br />
should be conducted <strong>to</strong> analyze and reduce <strong>the</strong> number <strong>of</strong><br />
potential <strong>solvents</strong>. This <strong>method</strong> is just a basis <strong>to</strong> narrow <strong>the</strong><br />
solvent search. The ultimate goal in choosing <strong>the</strong> best solvent<br />
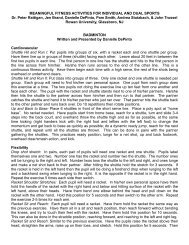
incorporates all <strong>the</strong> areas <strong>of</strong> concern (EHS, chemistry<br />
and engineering) as seen in Figure 1.<br />
Quantitative analysis programs have been generated for<br />
similar solvent selection purposes and have included not<br />
Fig. 1. Environment, health, and safety concerns <strong>of</strong> <strong>the</strong> solvent;<br />
effect on reaction yield; and processing concerns such as ease <strong>of</strong><br />
purification all have <strong>to</strong> be considered in determining <strong>the</strong> optimal<br />
solvent. Adapted from Gani et al. [7]<br />
only environmental, chemical, and engineering parameters<br />
but also economics. Heinzle et al. [10] <strong>of</strong>fer three types<br />
<strong>of</strong> indices that include mass-loss, environmental, and<br />
economical parameters. H<strong>of</strong>fmann et al. [11] propose an 165<br />
approach <strong>to</strong> be used during research and development<br />
stages <strong>to</strong> expand green process optimization on <strong>the</strong> bases <strong>of</strong><br />
both economical and environmental concerns. Allen and<br />
Shonnard [1] propose reaction s<strong>to</strong>ichiometry and <strong>to</strong>xicity<br />
be examined for green chemistry approaches <strong>to</strong> selecting 170<br />
materials in a process.<br />
Multi-step procedural environmental reviews, check lists,<br />
and hierarchical decision procedures have been o<strong>the</strong>r suggested<br />
<strong>method</strong>s. [12−14] Ano<strong>the</strong>r approach highlights environmental<br />
concerns and <strong>of</strong>fers <strong>method</strong>s <strong>of</strong> waste reduc- 175<br />
tion <strong>to</strong> incorporate in early process development through<br />
use <strong>of</strong> a material defined database. [15] These qualitative approaches<br />
are restricted in that <strong>the</strong>y provide limiting process<br />
comparisons.<br />
Chen and Shonnard [16] suggest some <strong>of</strong> <strong>the</strong>se <strong>method</strong>s 180<br />
have limited applicability and accuracy because emissionbased<br />
environmental parameters can be overestimated. This<br />
is due <strong>to</strong> <strong>the</strong> fact that <strong>the</strong>se proposed <strong>method</strong>s assume all<br />
reagents, whe<strong>the</strong>r consumed or not, will have an impact<br />
on <strong>the</strong> environment. They neglect reacting reagents that 185<br />
convert raw material <strong>to</strong> desired product, in which case not<br />
every stream output is removed as waste. O<strong>the</strong>r <strong>method</strong>s<br />
exploit <strong>to</strong>xicity-weighted mass indica<strong>to</strong>rs, though neglect<br />
effects <strong>of</strong> environmental fate.<br />
Solvent selection table 190<br />
This paper describes a means <strong>of</strong> simplifying <strong>the</strong> green solvent<br />
selection process and providing a “score” or “index”<br />
for process <strong>greenness</strong> through use <strong>of</strong> a solvent selection table<br />
database and calculation procedure. This was developed
P1: QKS<br />
LESA˙08˙251640 ESA.cls July 26, 2007 13:58<br />
195<br />
200<br />
205<br />
210<br />
215<br />
220<br />
4 Slater and Savelski<br />
through collaborative efforts with Bris<strong>to</strong>l-Myers Squibb<br />
and supported by <strong>the</strong> U.S. Environmental Protection<br />
Agency. The intent is <strong>to</strong> enable <strong>the</strong> user <strong>to</strong> combine more<br />
quickly <strong>the</strong> various chemical and environmental properties<br />
<strong>of</strong> over 60 <strong>solvents</strong> and associated chemicals that are commonly<br />
used in <strong>the</strong> specialty chemical and pharmaceutical<br />
industries and quantitatively compare <strong>the</strong> “<strong>greenness</strong>” <strong>of</strong><br />
<strong>the</strong>se <strong>solvents</strong> or an overall process using multiple <strong>solvents</strong>.<br />
This task is achieved by employing <strong>the</strong> use <strong>of</strong> a cus<strong>to</strong>mizable<br />
overall solvent index that takes in<strong>to</strong> account twelve environmental<br />
parameters for each solvent programmed in<strong>to</strong><br />
<strong>the</strong> database that have been derived from various industrial,<br />
pr<strong>of</strong>essional society, and governmental sources. [17−20] This<br />
<strong>method</strong> does not intend <strong>to</strong> incorporate all <strong>of</strong> <strong>the</strong> features <strong>of</strong><br />
<strong>the</strong> previously reviewed techniques, as it would be <strong>to</strong>o complex<br />
<strong>to</strong> develop and use. It is also different from commercially<br />
available life cycle assessment s<strong>of</strong>tware, as it addresses<br />
health, safety and environmental parameters at <strong>the</strong> solvent<br />
use step and not for <strong>the</strong> full “cradle <strong>to</strong> grave” analysis <strong>of</strong><br />
<strong>the</strong> environmental impact. [21] It does allow for expansion in<br />
terms <strong>of</strong> new <strong>solvents</strong> or chemicals and more parameters<br />
<strong>to</strong> include such areas <strong>of</strong> concern such as economics.<br />
Results and discussion<br />
Methodology<br />
This solvent selection table program generates a score,<br />
which will subsequently be called an index, that allows for<br />
a quick comparison between different <strong>solvents</strong> and process<br />
routes showing what alternative is <strong>the</strong> greener. A weighted<br />
index was established <strong>to</strong> measure which solvent or process<br />
would be “greener” yielding a lower index score. The index<br />
is based on 12 environmental parameters representing 225<br />
hazards associated with workers’ safety as well as air, water<br />
and land contamination. Table 3 shows all <strong>the</strong> parameters<br />
incorporated in<strong>to</strong> <strong>the</strong> solvent selection table.<br />
Because each environmental metric represents something<br />
different, i.e., exposure limit, <strong>to</strong>xicity, consequence, envi- 230<br />
ronmental impact, etc and has different units, a <strong>method</strong><br />
needed <strong>to</strong> be developed <strong>to</strong> bring this disparate information<br />
in<strong>to</strong> uniform scales <strong>of</strong> measurement. Our approach was <strong>to</strong><br />
take <strong>the</strong> range <strong>of</strong> values for each environmental parameter<br />
for all <strong>of</strong> <strong>the</strong> <strong>solvents</strong> in <strong>the</strong> database and develop a scale that 235<br />
would essentially convert all information <strong>to</strong> a 0 <strong>to</strong> 1 scale<br />
that is dimensionless. Each category from Table 3 (i.e., ingestion<br />
<strong>to</strong>xicity, biodegradation, aquatic <strong>to</strong>xicity, etc.) was<br />
initially weighted on a log scale with a log base equivalent<br />
<strong>to</strong> <strong>the</strong> maximum value <strong>of</strong> that particular parameter. These 240<br />
values were <strong>the</strong>n scaled in a linear fashion utilizing ei<strong>the</strong>r<br />
Equation 1 or 2.<br />
Mi = 1 − logxmax xi − logxmax xmin<br />
logxmax xmax − logxmax xmin<br />
where xi increases as <strong>greenness</strong> increases (1)<br />
Mi = logxmax xi − logxmax xmin<br />
logxmax xmax − logxmax xmin<br />
where xi decreases as <strong>greenness</strong> increases (2)<br />
Table 3. Parameters used in <strong>the</strong> environmental analysis <strong>of</strong> <strong>the</strong> solvent selection table and overall solvent index calculation<br />
Parameter Abbreviation Definition<br />
Inhalation Toxicity–TLV<br />
(Threshold Limit Value)<br />
TLV Maximum concentration <strong>of</strong> a chemical allowable for repeated exposure<br />
without producing adverse health effects<br />
Ingestion Toxicity Inges Mass <strong>of</strong> chemical ingested that results in a <strong>to</strong>xic effect, most commonly<br />
represented as mg chemical/kg rat.<br />
Biodegradation Biodeg Capacity <strong>of</strong> being decomposed by biological agents, especially bacteria<br />
Aquatic Toxicity Aqua Quantity <strong>of</strong> chemical compound proven <strong>to</strong>xic <strong>to</strong> aquatic fish in mg per liter<br />
<strong>of</strong> water<br />
Carcinogenicity Carcin Capacity <strong>to</strong> cause cancer (0-proven non-carcinogenic; 5-proven carcinogenic)<br />
Half-Life 1/2 Time required for chemical <strong>to</strong> fall <strong>to</strong> half its initial value<br />
Ozone Depletion O3 Predicted time- and height integrated change δ[O3] in stra<strong>to</strong>spheric ozone<br />
caused by <strong>the</strong> release <strong>of</strong> a specific quantity <strong>of</strong> <strong>the</strong> chemical relative <strong>to</strong> that<br />
caused by <strong>the</strong> same quantity <strong>of</strong> a benchmark compound,<br />
trichlor<strong>of</strong>luoromethane<br />
GWP (Global Warming Potential) GWP Cumulative infrared energy capture from <strong>the</strong> release <strong>of</strong> 1 kg <strong>of</strong> a greenhouse<br />
gas relative <strong>to</strong> that from 1 kg <strong>of</strong> carbon dioxide<br />
Smog Formation Smog Solvent’s capacity <strong>to</strong> release smog forming agents in<strong>to</strong> atmosphere<br />
Acidification Acid Related <strong>to</strong> <strong>the</strong> number <strong>of</strong> moles <strong>of</strong> H + created per number <strong>of</strong> moles <strong>of</strong> <strong>the</strong><br />
compound emitted<br />
Soil Adsorption Coefficient Soil Equilibrium ratio <strong>of</strong> <strong>the</strong> mass <strong>of</strong> a compound adsorbed per unit weight <strong>of</strong><br />
organic carbon in a soil <strong>to</strong> <strong>the</strong> concentration <strong>of</strong> <strong>the</strong> compound in a liquid<br />
phase<br />
Bio Concentration Fac<strong>to</strong>r BCF Ratio <strong>of</strong> a chemical’s concentration in <strong>the</strong> tissue <strong>of</strong> an aquatic organism <strong>to</strong> its<br />
concentration in water
P1: QKS<br />
LESA˙08˙251640 ESA.cls July 26, 2007 13:58<br />
245<br />
250<br />
255<br />
260<br />
265<br />
270<br />
275<br />
Solvents used in pharmaceutical manufacture 5<br />
where Mi is <strong>the</strong> scaled value <strong>of</strong> metric M for solvent i (dimensionless)<br />
xmin is <strong>the</strong> minimum value for all <strong>of</strong> <strong>the</strong> <strong>solvents</strong> in <strong>the</strong><br />
database for metric M<br />
xmax is <strong>the</strong> maximum value for all <strong>the</strong> <strong>solvents</strong> in <strong>the</strong><br />
databases for metric M<br />
xi represents <strong>the</strong> value <strong>of</strong> <strong>the</strong> environmental parameter for<br />
<strong>the</strong> specific solvent i<br />
Applying just <strong>the</strong> log <strong>to</strong> each individual parameter generates<br />
values ranging from −3.9 <strong>to</strong> 1 (Table 4), which is<br />
difficult <strong>to</strong> linearize for all <strong>the</strong> parameters. The linear scale<br />
shown above in Eqs. 1 and 2 fit <strong>the</strong> log scale fac<strong>to</strong>rs in<strong>to</strong> a<br />
normalized 0–1 scale. Both equations enable our scales <strong>to</strong><br />
invert between 0–1 and 1–0. High values for some parameters<br />
would signify a more environmentally benign effect<br />
and <strong>the</strong>refore would employ Eq. 1 <strong>to</strong> generate low weighted<br />
scales. Eq. 2 is used <strong>to</strong> generate low weighted scales if <strong>the</strong> pa-<br />
rameters have low values signifying relative <strong>greenness</strong>. This<br />
issue becomes extremely important when summing parameters<br />
in<strong>to</strong> an overall weighted index fac<strong>to</strong>r where those that<br />
are greener are lower than those deemed <strong>to</strong>xic. Table 4 depicts<br />
how each fac<strong>to</strong>r was scaled in terms <strong>of</strong> <strong>greenness</strong> due<br />
<strong>to</strong> relatively high/low parameter values. According <strong>to</strong> this<br />
table, TLV, ingestion, biodegradation, and aquatic <strong>to</strong>xicity<br />
are scaled using Eq. 1. The remaining parameters were<br />
scaled using Eq. 2.<br />
For example, <strong>to</strong> find <strong>the</strong> scaled value for <strong>the</strong> ingestion<br />
<strong>to</strong>xicity <strong>of</strong> ace<strong>to</strong>nitrile, Eq. 1 would be employed. Out<br />
<strong>of</strong> all <strong>the</strong> <strong>solvents</strong> and chemicals in <strong>the</strong> table, <strong>the</strong> highest<br />
value for ingestion <strong>to</strong>xicity is 25,000 ppm for water and <strong>the</strong><br />
lowest value is 24 ppm for mesitylene, also known as 1,3,5trimethylbenzene.<br />
The ingestion <strong>to</strong>xicity <strong>of</strong> ace<strong>to</strong>nitrile is<br />
3800 ppm. Inserting <strong>the</strong>se values in<strong>to</strong> Eq. 1, as shown next,<br />
would lead <strong>to</strong> a linearized value <strong>of</strong> 0.27 for ace<strong>to</strong>nitrile. All<br />
o<strong>the</strong>r chemicals would be linearized in a similar manner<br />
for <strong>the</strong> o<strong>the</strong>r parameters. Instead <strong>of</strong> assigning an absolute<br />
<strong>greenness</strong> <strong>to</strong> a particular chemical, this <strong>method</strong> allows<br />
<strong>the</strong> table <strong>of</strong> <strong>solvents</strong> <strong>to</strong> be expanded with o<strong>the</strong>r chemicals. 280<br />
Values for <strong>the</strong> o<strong>the</strong>r parameters for ace<strong>to</strong>nitrile are shown<br />
in Table 5.<br />
Scaled Ingestion ToxicityAce<strong>to</strong>nitrile = 1 − log25000 3800 − log25000 24<br />
= 0.27<br />
log25000 25000 − log25000 24<br />
An overall solvent index was <strong>the</strong>n tabulated as a summation<br />
<strong>of</strong> each <strong>of</strong> <strong>the</strong> parameters for a given solvent or<br />
chemical with <strong>the</strong> option <strong>to</strong> weigh fac<strong>to</strong>rs more so than<br />
o<strong>the</strong>rs. The tabulation was determined using Eq. 3.<br />
n<br />
285<br />
Overall solvent index, OSIsolvent =<br />
(3)<br />
αiMi<br />
i=1<br />
where αi is <strong>the</strong> weighting fac<strong>to</strong>r for <strong>the</strong> environmental/health/safety<br />
parameter and Mi is <strong>the</strong> weighted metric<br />
previously defined in Eqs. 1 and 2.<br />
The overall solvent index can be adjusted by <strong>the</strong>se weight- 290<br />
ing fac<strong>to</strong>rs <strong>to</strong> represent concerns <strong>of</strong> a particular industry.<br />
Based on discussions with <strong>the</strong> pharmaceutical industry,<br />
<strong>the</strong> index for pharmaceutical manufacture is dependent<br />
more on issues concerning worker’s safety (i.e., threshold<br />
limit value, ingestion, and carcinogenicity) than ecological 295<br />
interests. [22] Therefore <strong>the</strong> overall solvent index modified<br />
for <strong>the</strong> pharmaceutical industry would be represented in<br />
<strong>the</strong> following way:<br />
Overall Pharmaceutical Solvent Index<br />
= 2(MTLV + MIngestion + MCarcinogenicity) + MBiodeg<br />
+ MAqua + Mhalf life + MO3 + MGWP + MSmog + MAcid<br />
+ MSoil + MBCF<br />
(4)<br />
One <strong>of</strong> <strong>the</strong> most prominent features <strong>of</strong> this <strong>method</strong> is <strong>the</strong><br />
incorporation <strong>of</strong> a user-defined weighting fac<strong>to</strong>r for each 300<br />
metric. While incorporating all <strong>the</strong> given environmental parameters,<br />
this feature also addresses <strong>the</strong> issue concerning <strong>the</strong><br />
ambiguity <strong>of</strong> green engineering by letting users define which<br />
metrics <strong>the</strong>y wish <strong>to</strong> incorporate in<strong>to</strong> <strong>the</strong>ir overall weighted<br />
Table 4. Maximum and minimum values <strong>of</strong> parameters in which <strong>solvents</strong> are scaled upon based on all 64 <strong>solvents</strong> in database<br />
Parameter xmin xmax logmin logmax High values (use Eqn 1) Low values (use Eqn 2)<br />
TLV (ppm) 0.8 1000 0 1 Greener<br />
Ingestion <strong>to</strong>xicity (rat mg/kg) 24 25000 0.3 1 Greener<br />
Biodegradation (log Biodegradation) 1.60 3.90 0.00 1 Greener<br />
Aquatic Toxicity (mg/L) 3.8 84318 0.1 1 Greener<br />
Carcinogenicity (Unitless) 0 5 0 1 Greener<br />
Half Life (12 hr days) 0 8333 −0.2 1 Greener<br />
Ozone Depletion (Unitless) 0 1.1 0 0 Greener<br />
GWP (Unitless) 0 1400 0 1 Greener<br />
Smog Formation (Unitless) 0 6.5 −0.2 1 Greener<br />
Acidification (Unitless) 0 0 0 0 Greener<br />
Soil Adsorption (log Koc) 0 3.1 −3.9 1 Greener<br />
Bio Concentration Fac<strong>to</strong>r (log BCF) 0.3 2.9 −1.3 1 Greener<br />
Greenness with respect <strong>to</strong> relative values set in specified parameters.
P1: QKS<br />
LESA˙08˙251640 ESA.cls July 26, 2007 13:58<br />
305<br />
310<br />
315<br />
320<br />
325<br />
330<br />
6 Slater and Savelski<br />
Table 5. Original and scaled values (0–1) <strong>of</strong> each metric derived<br />
for ace<strong>to</strong>nitrile from solvent table database<br />
Scaled value,<br />
Metric Original value Mi(unitless)<br />
TLV 40 ppm 0.45<br />
Ingestion 3800 (rat mg/kg) 0.27<br />
Carcinogenicity 0 (unitless) 0<br />
Biodegradation 3.03 (log Biodeg) 0.27<br />
Aquatic Toxicity 4111 (mg/L) 0.3<br />
Half-Life 414 (12 hr days) 0.73<br />
Ozone Depletion 0 (unitless) 0<br />
GWP 11 (unitless) 0.33<br />
Smog Formation 0 (unitless) 0.2<br />
Acidification 0 (unitless) 0<br />
Soil Adsorption 0.653 (Log Koc) 0.72<br />
BioConcentration Fac<strong>to</strong>r 0.500 (log BCF) 0.27<br />
index. The larger <strong>the</strong> weighting fac<strong>to</strong>r is, <strong>the</strong> more heavily<br />
that parameter is considered in <strong>the</strong> calculation <strong>of</strong> <strong>the</strong> overall<br />
index. Any metric omitted or given a weighting fac<strong>to</strong>r<br />
<strong>of</strong> zero will not be fac<strong>to</strong>red in<strong>to</strong> <strong>the</strong> final index.<br />
The overall solvent index is <strong>the</strong>n fur<strong>the</strong>r normalized on a<br />
0 (green)–10 (not green) scale using <strong>the</strong> following equation<br />
where y = OSIsolvent<br />
OSI10, solvent = y − ymin × 10 (5)<br />
ymax − ymin ymax = maximum value <strong>of</strong> OSIsolvent for all <strong>solvents</strong> in<br />
database<br />
ymin = minimum value <strong>of</strong> OSIsolvent for all <strong>solvents</strong> in<br />
database<br />
This value is <strong>the</strong>n multiplied by <strong>the</strong> mass <strong>of</strong> that solvent used<br />
in <strong>the</strong> process <strong>to</strong> generate a <strong>to</strong>tal weighted solvent <strong>greenness</strong><br />
index for that particular solvent.<br />
Weighted Solvent Greenness Index solvent<br />
= (OSI10, solvent)(Masssolvent) (6)<br />
Then <strong>the</strong> values for all <strong>of</strong> <strong>the</strong> <strong>solvents</strong> used in <strong>the</strong> process<br />
are summed, and a final process score is obtained.<br />
TotalProcessGreennessIndex<br />
= WeightedSolventGreennessIndexsolvent (7)<br />
If <strong>the</strong> weighting fac<strong>to</strong>rs for a particular industry are used<br />
such as in Eq. 4, <strong>the</strong> <strong>greenness</strong> score can be named for that<br />
industry, e.g., pharmaceutical process <strong>greenness</strong> index. The<br />
lower <strong>the</strong> <strong>to</strong>tal score, <strong>the</strong> greener <strong>the</strong> process. Therefore, <strong>the</strong><br />
index can be used as a guide <strong>to</strong> assess quantitatively <strong>the</strong><br />
<strong>greenness</strong> between two or more <strong>solvents</strong> or processes.<br />
The quick and relatively easy <strong>greenness</strong> comparison between<br />
two processes can be accomplished through this<br />
<strong>method</strong>. The technique uses two data sets for two different<br />
<strong>solvents</strong> or processes. The different data sets enable <strong>the</strong><br />
user <strong>to</strong> compare differences in <strong>the</strong> overall solvent indices<br />
and <strong>the</strong> o<strong>the</strong>r environmental metrics for <strong>the</strong> two processes<br />
in <strong>the</strong> form <strong>of</strong> a “percent difference.” The values generated<br />
for each process are mass-dependent and, <strong>the</strong>refore, require<br />
<strong>the</strong> user <strong>to</strong> input <strong>the</strong> mass quantities from individual pro- 335<br />
cess streams or batch quantities.<br />
Ano<strong>the</strong>r feature available within <strong>the</strong> spreadsheet is<br />
a vapor pressure calculation using An<strong>to</strong>ine’s equation.<br />
Although vapor pressure is not directly considered an<br />
environmental metric, it is important in determining <strong>the</strong> 340<br />
ease <strong>of</strong> separation by distillation in binary systems. If a<br />
mixture is difficult <strong>to</strong> separate, more chemicals (such as<br />
entrainers) or energy will need <strong>to</strong> be utilized in order <strong>to</strong><br />
carry out <strong>the</strong> separation and, <strong>the</strong>refore, will have more <strong>of</strong><br />
an environmental impact. 345<br />
Essentially, <strong>the</strong> <strong>method</strong> is designed <strong>to</strong> compare similar<br />
processes that generate <strong>the</strong> same final product. The<br />
<strong>method</strong> is a valuable <strong>to</strong>ol in aiding <strong>the</strong> selection <strong>of</strong> <strong>solvents</strong><br />
for a particular process, but it has its limitations<br />
and should not be used exclusively. For example, solubil- 350<br />
ity <strong>of</strong> an intermediate or API in a solvent is an important<br />
parameter in solvent selection. Therefore, <strong>the</strong> <strong>the</strong>rmodynamic<br />
performance parameters and solvent/API interaction<br />
need <strong>to</strong> be considered in solvent selection. Despite <strong>the</strong><br />
limitations, <strong>the</strong> <strong>method</strong> is useful on many levels. The sol- 355<br />
vents included in <strong>the</strong> database are some <strong>of</strong> <strong>the</strong> most commonly<br />
used <strong>solvents</strong> within <strong>the</strong> pharmaceutical industry.<br />
The database has <strong>the</strong> ability <strong>to</strong> grow continually in terms <strong>of</strong><br />
<strong>the</strong> number <strong>of</strong> <strong>solvents</strong> and parameters used <strong>to</strong> calculate <strong>the</strong><br />
index. 360<br />
This <strong>method</strong> is useful <strong>to</strong> help assess how process <strong>greenness</strong><br />
improves as a drug goes through various stages <strong>of</strong> development<br />
over its lifespan. In <strong>the</strong> “discovery” phase <strong>of</strong><br />
a drug compound, which is also known as <strong>the</strong> medicinal<br />
chemistry route, <strong>the</strong> goal is <strong>to</strong> produce <strong>the</strong> pure API for 365<br />
initial pre-clinical testing. At this stage <strong>of</strong> development,<br />
no efforts have been made <strong>to</strong> optimize process routes or<br />
solvent use, <strong>the</strong> sole goal being <strong>to</strong> obtain a pure API. As<br />
<strong>the</strong> drug moves <strong>to</strong> “kilo” and “pilot scale” production for<br />
clinical trials, <strong>the</strong> process chemistry is more refined, and 370<br />
solvent usage decreases. This is due <strong>to</strong> both green chemistry<br />
in reducing syn<strong>the</strong>sis steps and green engineering using<br />
separation processes and sequences that reduce solvent<br />
consumption. In <strong>the</strong> final commercial route for producing<br />
<strong>the</strong> API, fur<strong>the</strong>r green engineering is employed for solvent 375<br />
recovery. The <strong>to</strong>tal pharmaceutical process <strong>greenness</strong> index<br />
score obtained through this <strong>method</strong> can be used <strong>to</strong> quantify<br />
<strong>the</strong> green improvements and represent variables that go<br />
beyond just quantities <strong>of</strong> solvent reduced.<br />
Case studies 380<br />
Several illustrative applications <strong>of</strong> <strong>the</strong> solvent selection index<br />
<strong>to</strong>ol will be given below. First, a simple comparison<br />
<strong>of</strong> two different solvent systems used in an API filtration<br />
step will be shown. Then <strong>the</strong> techniques will be applied<br />
<strong>to</strong> show quantitatively <strong>the</strong> improvements made in an 385
P1: QKS<br />
LESA˙08˙251640 ESA.cls July 26, 2007 13:58<br />
390<br />
395<br />
400<br />
405<br />
410<br />
415<br />
Solvents used in pharmaceutical manufacture 7<br />
Table 6. Values <strong>of</strong> filtration Process 1 and 2 solvent components based on TLV<br />
Process 1 Process 2<br />
Calculation Ace<strong>to</strong>ne Ace<strong>to</strong>nitrile Methyl isobutyl ke<strong>to</strong>ne n-Butanol n-Pentane n-Heptane<br />
Single Index Scale, SIS 0.19 0.9 0.83 0.83 0 0.19<br />
SIS10 0.96 4.47 4.16 4.16 0 0.96<br />
Mass <strong>of</strong> Solvent (kg) 120 100 90 80 80 100<br />
Weighted Solvent Index 116 447 375 333 0 96.3<br />
Process Solvent Index 938 429<br />
overall pharmaceutical manufacturing process where syn<strong>the</strong>sis<br />
steps and solvent quantities and <strong>to</strong>xicity are reduced.<br />
Filtration case study<br />
An illustrative example is provided <strong>to</strong> show one particular<br />
process design in which two solid-liquid filtration unit processes<br />
generate <strong>the</strong> same amount <strong>of</strong> final product. Process<br />
1 uses 120 kg ace<strong>to</strong>ne, 100 kg ace<strong>to</strong>nitrile, and 90 kg methyl<br />
isobutyl ke<strong>to</strong>ne. Process 2 uses 80 kg n-butanol, 80 kg npentane,<br />
and 100 kg n-heptane. For this design, both API<br />
and solvent reagents undergo filtration <strong>to</strong> obtain high purity<br />
product. Solvents used <strong>to</strong> make <strong>the</strong> API soluble vary within<br />
both processes, thus emit variable liquid waste or emissions.<br />
This example shows how <strong>the</strong> <strong>method</strong> determines which<br />
process is greener assuming all o<strong>the</strong>r parameters such as<br />
equipment, energy expenditure, product yield, etc. remain<br />
constant. To illustrate <strong>the</strong> importance <strong>of</strong> having a <strong>method</strong><br />
calculate a <strong>greenness</strong> score based on several fac<strong>to</strong>rs, a calculation<br />
based on only one parameter is first shown. If <strong>the</strong> two<br />
processes are compared using only solvent inhalation exposure,<br />
TLV, <strong>the</strong>n a single index scale based on that parameter<br />
would be used. No o<strong>the</strong>r health or environmental fac<strong>to</strong>rs<br />
would be used in <strong>the</strong> solvent index equation and <strong>the</strong>refore<br />
<strong>the</strong> weighted solvent index would rely solely on <strong>the</strong> scaled<br />
TLV values for each <strong>of</strong> <strong>the</strong> <strong>solvents</strong> in <strong>the</strong> process multiplied<br />
by <strong>the</strong>ir respective amounts used (Table 6). The final scores<br />
comparing <strong>the</strong> two processes represent only TLV as <strong>the</strong> environmental<br />
metric and show that Process 2 appears <strong>to</strong> be<br />
greener since it has an overall score <strong>of</strong> 429 compared <strong>to</strong> 938<br />
for Process 1. However, if <strong>the</strong> <strong>to</strong>tal process <strong>greenness</strong> index,<br />
which includes all 12 environmental metrics weighted for<br />
<strong>the</strong> pharmaceutical industry is considered, Process 1 is<br />
greener (Table 7). Process 1 has a pharmaceutical process<br />
<strong>greenness</strong> index <strong>of</strong> 892 vs. Process 2 score <strong>of</strong> 1091.<br />
This comparison shows <strong>the</strong> importance <strong>of</strong> <strong>the</strong> user’s definition<br />
<strong>of</strong> what metrics constitute a green process design. If 420<br />
just one metric is considered in <strong>the</strong> environmental assessment<br />
<strong>of</strong> a process, <strong>the</strong>n <strong>the</strong> assessment is limited <strong>to</strong> one area<br />
<strong>of</strong> impact. For instance, TLV describes <strong>the</strong> highest concentration<br />
at which no adverse health effects will be seen on<br />
inhalation, but it does not show <strong>the</strong> impact <strong>to</strong> aquatic life 425<br />
or <strong>the</strong> ability <strong>to</strong> bioaccumulate in <strong>the</strong> environment upon release.<br />
Comparison <strong>of</strong> both processes using more than one<br />
metric incorporates all <strong>the</strong> aspects <strong>of</strong> an environmental assessment<br />
and provides a more thorough evaluation <strong>of</strong> <strong>the</strong><br />
relative <strong>greenness</strong> <strong>of</strong> <strong>the</strong> process. Process comparisons need 430<br />
<strong>to</strong> be made using <strong>the</strong> same group <strong>of</strong> metrics for each process.<br />
The overall index weighs <strong>the</strong> parameters selected <strong>the</strong>n<br />
normalizes <strong>the</strong> calculated value again <strong>to</strong> produce a final<br />
index that would be different than just performing a calculation<br />
<strong>of</strong> each <strong>of</strong> <strong>the</strong> separate index scales and adding 435<br />
<strong>the</strong>m.<br />
Commercial drug production routes<br />
Pfizer’s sildenafil citrate process was recently recognized<br />
for its green chemistry improvements. [23] Improvements include<br />
a reduction in aqueous waste, organic solvent waste, 440<br />
and <strong>the</strong> variety and <strong>to</strong>xicity <strong>of</strong> <strong>solvents</strong> used. Their new syn<strong>the</strong>sis<br />
route does not require extensive purification operations.<br />
Solvent-intensive purification processes such as extraction<br />
are eliminated saving organic solvent usage and<br />
waste. Multiple chemical steps were combined, using a 445<br />
Table 7. Values <strong>of</strong> filtration Process 1 and 2 solvent components using overall solvent index weighted for <strong>the</strong> pharmaceutical industry<br />
Process 1 Process 2<br />
Calculation Ace<strong>to</strong>ne Ace<strong>to</strong>nitrile Methyl isobutyl ke<strong>to</strong>ne n-Butanol n-Pentane n-Heptane<br />
Overall Solvent Index, OSI 3.4 4.3 4.5 5.4 5.3 4.6<br />
OSI10 2.2 3.2 3.5 4.6 4.5 3.7<br />
Mass <strong>of</strong> Solvent (kg) 120 100 90 80 80 100<br />
Weighted Solvent Greenness Index 259 321 312 369 356 366<br />
Total Pharmaceutical Process Greenness<br />
Index<br />
892 1091
P1: QKS<br />
LESA˙08˙251640 ESA.cls July 26, 2007 13:58<br />
450<br />
455<br />
460<br />
465<br />
470<br />
475<br />
480<br />
8 Slater and Savelski<br />
Table 8. Solvent usage at various phases <strong>of</strong> <strong>the</strong> sildenafil citrate process development (L/kg API)<br />
Medicinal Process<br />
Chemistry Enabled Commercial Commercial Commercial<br />
Solvent Process (1990) Route (1994) Route (1997) Route (1998) Route (2005) Future Target<br />
Ethyl e<strong>the</strong>r 20<br />
Methanol 70<br />
Pyridine 0.5<br />
Ace<strong>to</strong>ne 130 29.2<br />
Dichloromethane 970 23.9<br />
t-Butanol 5.3 3.0 3.0 2.0<br />
Toluene 14.7 2.1 0.3 0.3 0.3<br />
Ethanol 80 0.5<br />
Ethyl acetate 10 14.3 7.9 1.6 1.5 1.5<br />
2-Butanone 10 11.0 9.3 9.3 2.3 2.3<br />
Total Solvent (L/kg API) 1290 98.9 22.3 14.2 ∗ 6.1 ∗∗ 4.6 ∗∗∗<br />
∗ Following <strong>the</strong> implementation <strong>of</strong> solvent recovery for <strong>to</strong>luene and ethyl acetate.<br />
∗∗ Following implementation <strong>of</strong> 2-butanone recovery and yield improvements on acylation cyclisation steps<br />
∗∗∗ Following introduction <strong>of</strong> ethanol/ethoxide process.<br />
Values courtesy <strong>of</strong> Peter Dunn, Pfizer, Inc. See also Reference 23.<br />
single solvent, which can be recovered. The overall organic<br />
<strong>solvents</strong> reduced as a result <strong>of</strong> <strong>the</strong> green chemistry<br />
improvements from <strong>the</strong> discovery scale <strong>to</strong> commercial<br />
production are shown in Table 8. The organic <strong>solvents</strong><br />
used are reduced from 1290 <strong>to</strong> 6.1 L/kg API (1540–5.0<br />
kg/kg API), and although <strong>the</strong> listing <strong>of</strong> <strong>solvents</strong> shows<br />
which ones were reduced, ano<strong>the</strong>r measure is needed <strong>to</strong><br />
quantify <strong>the</strong> degree <strong>of</strong> which more benign <strong>solvents</strong> were<br />
substituted.<br />
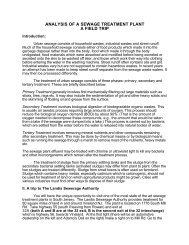
Applying our <strong>to</strong>tal pharmaceutical process <strong>greenness</strong> in-<br />
dex, we can show how significant and broad-based <strong>the</strong>ir<br />
improvements were (Fig. 2). In our example, we assume<br />
that each route would scale up <strong>to</strong> produce <strong>the</strong> same API<br />
quantity and convert <strong>the</strong> volumetric solvent amounts <strong>to</strong><br />
mass (kilograms) and report our index value per kg API.<br />
The <strong>greenness</strong> index decreases from 7472 in <strong>the</strong> original<br />
1990 medicinal chemistry process <strong>to</strong> 16.9 in <strong>the</strong> latest<br />
2005 commercial route. Our <strong>greenness</strong> score more thoroughly<br />
represents <strong>the</strong> benign nature <strong>of</strong> <strong>solvents</strong> substi-<br />
tuted and reduced in terms <strong>of</strong> health exposure fac<strong>to</strong>rs<br />
and environmental impact. For example, <strong>the</strong> elimination<br />
<strong>of</strong> highly volatile <strong>solvents</strong> such as dichloromethane, ethyl<br />
e<strong>the</strong>r, ace<strong>to</strong>ne, and methanol, which reduces air pollution,<br />
is represented in our pharmaceutical <strong>greenness</strong> in-<br />
dex score. Likewise, <strong>the</strong> elimination in <strong>the</strong> use <strong>of</strong> chlo-<br />
rinated <strong>solvents</strong>, e.g., dichlormethane, that pose serious<br />
health concerns are also represented in our pharmaceutical<br />
solvent index score. The score shows <strong>the</strong> level <strong>of</strong> green<br />
chemistry/engineering achieved in each sequential process<br />
improvement. The final commercial sildenafil citrate pro-<br />
cess uses more relatively benign <strong>solvents</strong>, which are recovered.<br />
The future target commercial route would include an<br />
ethanol/ethoxide process <strong>to</strong> reduce solvent use even fur<strong>the</strong>r<br />
<strong>to</strong> 4.6 L/kg (3.86 kg/kg API) representing a <strong>greenness</strong> index<br />
<strong>of</strong> 13.15.<br />
Tracking drugs in development<br />
Our <strong>greenness</strong> index <strong>to</strong>ol can also be used <strong>to</strong> show overall<br />
green improvements in a process or track environmental<br />
improvements without releasing details on specific process<br />
chemistry or specific <strong>solvents</strong> used. Through our partner- 485<br />
ship with Bris<strong>to</strong>l-Myers Squibb (BMS), <strong>the</strong> company has<br />
given us access <strong>to</strong> process chemistry and engineering information<br />
on <strong>the</strong> development <strong>of</strong> new cancer drug, drug “C.”<br />
To document how BMS has improved <strong>the</strong> process and incorporated<br />
greener processing strategies, an evaluation <strong>of</strong> 490<br />
<strong>the</strong> drug from discovery <strong>to</strong> pilot scale production (Phase II<br />
clinical trial) was performed. Since “drug C” is still in development,<br />
specifics can not be disclosed, but our solvent<br />
<strong>greenness</strong> measurement <strong>method</strong> can be used <strong>to</strong> show how<br />
<strong>the</strong> process was improved. 495<br />
Our analysis shows that <strong>the</strong> magnitude and variety <strong>of</strong><br />
<strong>solvents</strong> was reduced in <strong>to</strong>tal amounts and <strong>to</strong>xicity. In <strong>the</strong><br />
discovery phase where small amounts (
P1: QKS<br />
LESA˙08˙251640 ESA.cls July 26, 2007 13:58<br />
515<br />
Solvents used in pharmaceutical manufacture 9<br />
Fig. 2. Total pharmaceutical process <strong>greenness</strong> index for <strong>the</strong> sildenafil citrate process as a function <strong>of</strong> development phase.<br />
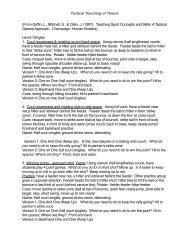
4, respectively. This shows that most <strong>of</strong> <strong>the</strong> improvements<br />
occur early in <strong>the</strong> development cycle with <strong>the</strong> most significant<br />
decreases in solvent use and <strong>greenness</strong> index for <strong>the</strong><br />
transition from discovery <strong>to</strong> initial scale-up. At this stage,<br />
<strong>the</strong> pharmaceutical <strong>greenness</strong> index is reduced from 11,990<br />
<strong>to</strong> 788 representing a 93% reduction. Fur<strong>the</strong>r improvements 520<br />
are made on <strong>the</strong> pilot scale process where <strong>the</strong> <strong>greenness</strong><br />
score is reduced 32% fur<strong>the</strong>r <strong>to</strong> 533.<br />
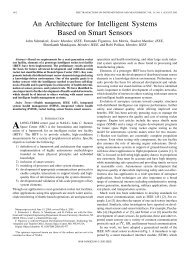
Fig. 3. Solvent mass intensity (usage) for <strong>the</strong> Bris<strong>to</strong>l-Myers Squibb cancer drug as it goes through various stages in <strong>the</strong> development<br />
process from discovery <strong>to</strong> kilo <strong>to</strong> pilot scale.
P1: QKS<br />
LESA˙08˙251640 ESA.cls July 26, 2007 13:58<br />
525<br />
530<br />
535<br />
540<br />
545<br />
550<br />
10 Slater and Savelski<br />
Fig. 4. Total pharmaceutical process <strong>greenness</strong> index for <strong>the</strong> Bris<strong>to</strong>l-Myers Squibb cancer drug as it goes through various stages in<br />
<strong>the</strong> development process from discovery <strong>to</strong> kilo <strong>to</strong> pilot scale.<br />
The process solvent <strong>greenness</strong> calculation <strong>method</strong><br />
is available <strong>to</strong> use from <strong>the</strong> <strong>Rowan</strong> University Green<br />
Engineering Education web site 〈www.rowan.edu/<br />
greenengineering〉. [24] The s<strong>of</strong>tware and a tu<strong>to</strong>rial can be<br />
accessed by logging on<strong>to</strong> <strong>the</strong> site as a “guest” (user name<br />
= guest; password = guest) and going <strong>to</strong> <strong>the</strong> S<strong>of</strong>tware<br />
section and selecting <strong>the</strong> Solvent Selection Table s<strong>of</strong>tware.<br />
The s<strong>of</strong>tware and accompanying tu<strong>to</strong>rial can <strong>the</strong>n be used<br />
on-line or downloaded. Users must make sure that <strong>the</strong>ir<br />
Micros<strong>of</strong>t Excel program is set with “macros enabled” for<br />
<strong>the</strong> program <strong>to</strong> run.<br />
Conclusions<br />
There are many process challenges in <strong>the</strong> green engineering<br />
<strong>of</strong> pharmaceutical development and manufacture. Effective<br />
and efficient use <strong>of</strong> <strong>solvents</strong> and o<strong>the</strong>r chemicals is an important<br />
issue. The solvent selection table and <strong>to</strong>tal process<br />
<strong>greenness</strong> index <strong>method</strong> have many applicable features designed<br />
specifically for use in pharmaceutical industries. Its<br />
capabilities include <strong>the</strong> compilation <strong>of</strong> several metrics, tabulation<br />
<strong>of</strong> <strong>solvents</strong>’ relative <strong>greenness</strong>, and computation <strong>of</strong><br />
ease <strong>of</strong> separation. The intent <strong>of</strong> this program is <strong>to</strong> quantify<br />
<strong>the</strong> relative <strong>greenness</strong> <strong>of</strong> possible solvent substitutes that<br />
sustain green engineering principles. It can help scientists<br />
and engineers early in <strong>the</strong> life cycle <strong>of</strong> product development<br />
and <strong>to</strong> those in manufacturing looking at improving<br />
a process.<br />
One <strong>of</strong> <strong>the</strong> advantages <strong>of</strong> using <strong>the</strong> <strong>method</strong> as opposed<br />
<strong>to</strong> o<strong>the</strong>r comparable alternatives is that it is easy <strong>to</strong> implement.<br />
The user has <strong>to</strong> input only <strong>the</strong> mass <strong>of</strong> each chemical<br />
in <strong>the</strong> process, and <strong>the</strong> <strong>method</strong> calculates an overall index<br />
based on <strong>the</strong> environmental parameters. Ano<strong>the</strong>r advantage<br />
is that <strong>the</strong> database is completely expandable. If <strong>the</strong><br />
user wants <strong>to</strong> include more chemicals or more parameters, 555<br />
<strong>the</strong>y could be incorporated in<strong>to</strong> <strong>the</strong> database with relative<br />
ease. One feature that most o<strong>the</strong>r tables or databases do<br />
not have is <strong>the</strong> cus<strong>to</strong>mizable weighted index option. The<br />
<strong>method</strong> presented in this paper allows <strong>the</strong> user <strong>to</strong> choose<br />
which metrics are most important and allows those <strong>to</strong> be 560<br />
weighted more than <strong>the</strong> o<strong>the</strong>rs.<br />
Acknowledgments<br />
Support for this project is funded by a grant from <strong>the</strong> U.S.<br />
Environmental Protection Agency, X1 97275805-0. We appreciate<br />
<strong>the</strong> guidance <strong>of</strong> Bris<strong>to</strong>l-Myers Squibb scientists 565<br />
and engineers Drs. San Kiang, Thomas LaPorte, Lori Spangler,<br />
and Stephan Taylor who played key roles in providing<br />
feedback on this project. We would like <strong>to</strong> acknowledge<br />
<strong>the</strong> following <strong>Rowan</strong> students who worked on this project:<br />
Scott Barnes, Nicholas DeSantis, Daniel Fichana, and Thor 570<br />
Farnsworth. We thank Dr. Robert Hesketh for his involvement<br />
in <strong>the</strong> early stages <strong>of</strong> <strong>the</strong> project. We thank Dr. Peter<br />
Dunn <strong>of</strong> Pfizer for supplying <strong>the</strong> solvent usage data on <strong>the</strong><br />
sildenafil citrate process.<br />
References 575<br />
[1] Allen, D.T.; Shonnard, D.R. Green Engineering: Environmentally<br />
Conscious Design <strong>of</strong> Chemical Processes. Prentice Hall, Upper Saddle<br />
River, NJ, 2002; 475–489.
P1: QKS<br />
LESA˙08˙251640 ESA.cls July 26, 2007 13:58<br />
580<br />
585<br />
590<br />
595<br />
600<br />
605<br />
610<br />
Solvents used in pharmaceutical manufacture 11<br />
[2] Compliance and Environmental Stewardship, 2003–2008 EPA<br />
Strategic Plan: Direction for <strong>the</strong> Future, EPA 190-R-03-003, U.S. Environmental<br />
Protection Agency, Washing<strong>to</strong>n, DC, 2003; 108–128.<br />
[3] Toxic Release Inven<strong>to</strong>ry, U.S. Environmental Protection Agency,<br />
〈http://www.epa.gov/tri/tridata/tri05/index.htm〉, accessed December<br />
20, 2006.<br />
[4] Slater, C.S.; Savelski, M.J.; Hesketh, R.P. The selection and reduction<br />
<strong>of</strong> organic <strong>solvents</strong> in <strong>the</strong> pharmaceutical industry. Abstracts<br />
<strong>of</strong> Papers, American Chemical Society 10th Green Chemistry and<br />
Engineering Conference, Washing<strong>to</strong>n, DC, June 2006, American<br />
Chemical Society, 10.<br />
[5] Jimenez-Gonzalez, C.; Curzons, A.D.; Constable, D.J.C.; Cunningham,<br />
V.L. Cradle-<strong>to</strong>-gate life cycle inven<strong>to</strong>ry and assessment <strong>of</strong> pharmaceutical<br />
compounds. Inter. J. Life Cycle Assessment 2004, 9(2),<br />
114–121.<br />
[6] Jimenez-Gonzalez, C.; Curzons, A.D.; Constable, D.J.C.; Cunningham,V.L.<br />
Expanding GSK’s solvent selection guide-application <strong>of</strong><br />
life cycle assessment <strong>to</strong> enhance solvent selections. Clean Technol.<br />
Envir. Policy 2005, 7, 42–50.<br />
[7] Gani, R.; Jimenez-Gonzalez, C.; tenKate, A.; Crafts, P.A.; Jones,<br />
M.; Powell, L.; A<strong>the</strong>r<strong>to</strong>n, J.H.; Cordiner, J.L.A modern approach<br />
<strong>to</strong> solvent selection, Chem. Eng. 2006, 113, 30–43.<br />
[8] Gani, R.; Jimenez-Gonzalez, C.; Constable, D.J.C. Method for selection<br />
<strong>of</strong> <strong>solvents</strong> for promotion <strong>of</strong> organic reactions. Comput. Chem.<br />
Eng. 2005, 29, 1661–1676.<br />
[9] Taylor, S.P. Bris<strong>to</strong>l-Myers Squibb process <strong>greenness</strong> scorecard. AS-<br />
PEN World Meeting, Orlando, FL, Oc<strong>to</strong>ber 2004.<br />
[10] Heinzle, E.; Weirich, D.; Brogli, F.; H<strong>of</strong>fman, V.H.; Koller, G.; Verduyn<br />
M.A.; Hungerbulhler, K. Ecological and economic objective<br />
functions for screening in integrated development <strong>of</strong> fine chemical<br />
processes. 1. Flexible and expandable framework using indices. Ind.<br />
Eng. Chem. Res. 1998, 37, 3395–3407.<br />
[11] H<strong>of</strong>fmann, V.H.; Hungerbuhler, K.; McRae, G.J. Multi-objective<br />
screening and evaluation <strong>of</strong> chemical process technologies. Ind. Eng.<br />
Chem. Res. 2001, 40, 4513–4524.<br />
[12] Kraft, R.L. Incorporate environmental reviews in<strong>to</strong> facility design.<br />
Chem. Eng. Prog. 1992, 88, 46–52.<br />
[13] Mulholland, K.L.; Dryer, J.A. Process analysis via waste minimiza- 615<br />
tion: using duPont’s <strong>method</strong>ology <strong>to</strong> identify process improvement<br />
opportunities. Environ. Prog. 2001, 20, 75–79.<br />
[14] Rossiter, A.P., Spriggs, H.D., Klee, H., Jr. Apply process integration<br />
<strong>to</strong> waste minimization. Chem. Eng. Prog. 1993, 89, 30–36.<br />
[15] Palaniappan, C.; Srinivasan, R.; Halim, I. A material centric 620<br />
<strong>method</strong>ology for developing inherently safer environmentally benign<br />
processes. Comput. Chem. Eng. 2002, 26, 757.<br />
[16] Chen, H.; Shonnard, D.R. Systematic framework for environmentally<br />
conscious chemical process design: early and detailed design<br />
stages. Ind. Eng. Chem. Res. 2004, 43, 535–552. 625<br />
[17] High Purity Chemicals for Exacting Needs & Critical Applications.<br />
J.T. Baker. 〈http://www.mallbaker.com/〉. accessed September 25,<br />
2005.<br />
[18] Sustainable Development Progress Metrics recommened for use in<br />
<strong>the</strong> Process Industries. IChemE. Davis Building, Rugby, Warwick- 630<br />
shire CV21 3HQ: Institution <strong>of</strong> Chemical Engineers. 25 Sept.–Oct.<br />
2005 〈http://www.icheme.org/sustainability/〉.<br />
[19] EPI Suite s<strong>of</strong>tware ver 3.12, U. S. Environmental Protection Agency,<br />
Washing<strong>to</strong>n, DC, 2000.<br />
[20] SOLV-DB, National Center for Manufacturing Science, Ann Arbor, 635<br />
MI.<br />
[21] Shonnard, D.; Lindner, A.; Nguyen, N.; Subamatram, R.; Fichana,<br />
D.; Hesketh, R.; Slater, C.S.; Engler, R. Green engineering—<br />
integration <strong>of</strong> green chemistry, pollution prevention, and risk based<br />
considerations. In: Handbook <strong>of</strong> Industrial Chemistry and Biotech- 640<br />
nology, Kent, J.A., Ed.; Springer Publishers, New York, NY 2007.<br />
[22] Taylor, S.P. Re: Overall solvent weighting fac<strong>to</strong>r. E-mail. 27 Oct.<br />
2005. Q1<br />
[23] Dunn, P.J.; Galvin, S.; Hettenbach, K. The development <strong>of</strong> an environmentally<br />
benign syn<strong>the</strong>sis <strong>of</strong> sildenafil citrate (Viagra) and 645<br />
its assessment by green chemistry metrics. Green Chem. 2004, 6,<br />
43–48.<br />
[24] Slater, C.S.; Hesketh, R.P.; Fichana, D.; Henry, J.; Flynn, A.M.;<br />
Abraham, M. Expanding <strong>the</strong> frontiers for chemical engineers<br />
in green engineering education. Inter. J. Eng. Educ. 2007, 23, 650<br />
309–324.