ECE 275B – Homework #2 Emended – Due ... - UCSD DSP Lab
ECE 275B – Homework #2 Emended – Due ... - UCSD DSP Lab
ECE 275B – Homework #2 Emended – Due ... - UCSD DSP Lab

Create successful ePaper yourself
Turn your PDF publications into a flip-book with our unique Google optimized e-Paper software.
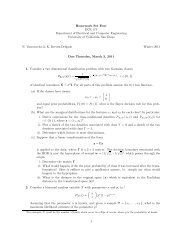
<strong>ECE</strong> <strong>275B</strong> <strong>–</strong> <strong>Homework</strong> <strong>#2</strong> <strong>Emended</strong> <strong>–</strong> <strong>Due</strong> Tuesday 2-10-09<br />
Reading<br />
MIDTERM is Scheduled for Thursday, February 12, 2009<br />
• Read and understand the Newton-Raphson and Method of Scores MLE procedures<br />
given in Kay, Example 7.11, pp. 178-82. Also read and understand the material in<br />
Section 7.8 of Kay.<br />
• Read and understand the Expectation<strong>–</strong>Maximization (EM) Algorithm described in<br />
Moon and stirling, Sections 17.1-17.6.<br />
• The following papers are recommended:<br />
<strong>–</strong> “Eliminating Multiple Root Problems in Estimation,” C.G. Small, J. Wang, and<br />
Z. Yang, Statistical Science, Vol. 15, No. 4 (Nov., 2000), pp. 313-332.<br />
<strong>–</strong> “Maximum Likelihood from Incomplete Data via the EM Algorithm,” A.P. Dempster;<br />
N.M. Laird, & D.B. Rubin, Journal of the Royal Statistical Society. Series<br />
B (Methodological),Vol. 39, No. 1, (1977), pp. 1-38. Highly Recommended.<br />
<strong>–</strong> “On the Convergence Properties of the EM Algorithm,” C.F. Jeff Wu, The Annals<br />
of Statistics, Vol. 11, No. 1 (Mar., 1983), pp. 95-103.<br />
<strong>–</strong> “On the Convergence of the EM Algorithm,” R.A. Boyles, Journal of the Royal<br />
Statistical Society. Series B (Methodological), Vol. 45, No. 1, 1983, pp. 47-50.<br />
<strong>–</strong> “Mixture Densities, Maximum Likelihood and the Em Algorithm,” R.A. Redner<br />
& H.F. Walker, SIAM Review, Vol. 26, No. 2 (Apr., 1984), pp. 195-239. Highly<br />
Recommended.<br />
<strong>–</strong> “Direct Calculation of the Information Matrix via the EM Algorithm,” D. Oakes,<br />
Journal of the Royal Statistical Society. Series B (Statistical Methodology), Vol. 61,<br />
No. 2 (1999), pp. 479-482.<br />
<strong>–</strong> “The Variational Approximation for Bayesian Inference: Life After the EM Algorithm,”<br />
D.G. Tzikas, A.C. Likas, and N.P. Galatsanos, IEEE Signal Processing<br />
Magazine, November 2008, pp. 131-146.<br />
Comments on the Above Cited Papers<br />
As mentioned in class, For highly nonlinear problems of the type considered by Kay and<br />
for parametric mixture distributions 1 there will generally be multiple roots to the likelihood<br />
equation corresponding to multiple local maxima to the likelihood function. The question<br />
of how to deal with this problem, and in particular the question of how to track the correct<br />
1 In both cases we are leaving the nice world of regular exponential family distributions<br />
1
zero of the score function (which might not correspond to the global maximum) which has<br />
the desired asymptotic property of efficiency is a difficult one of keen interest. In this regard,<br />
you might want to read the paper “Eliminating Multiple Root Problems in Estimation” cited<br />
above.<br />
Note that the Newton-Raphson procedure uses the Sample Information Matrix (SIM),<br />
while the Method of Scores uses the actual Fisher Information Matrix (FIM) which is the<br />
expected value of the SIM. As discussed in Kay, in the limit of an infinitely large number of<br />
samples it is the case that FIM ≈ SIM. Thus a perceived merit of the Newton-like numerical<br />
approaches is that an asymptotically valid estimate of the parameter error covariance matrix<br />
is provided by the availability of the SIM. 2<br />
One claimed potential drawback to the basic EM algorithm is the general lack of the<br />
availability of the SIM or FIM for use as a parameter error covariance matrix. 3 This issue<br />
is addressed in the above-cited paper “Direct Calculation of the Information Matrix via the<br />
EM Algorithm” which discusses the additional computations (over and above the basic EM<br />
algorithm computations) needed to compute an estimate of the information matrix.<br />
Important and useful background material on the history, applications, and convergence<br />
properties of the EM algorithm as a procedure for performing missing-data maximum likelihood<br />
estimation can be found in the classic paper by Dempster, Rubin, & Laird (DLR)<br />
cited above. The subsequent papers by Wu and Boyles, both cited above, correct errors in<br />
the convergence proof given in the original DLR paper. The DLR paper discusses a variety<br />
of applications, including mixture-density estimation and the example given in Moon. In<br />
the DLR paper the complete data space is not a simple cartesian product of the actual data<br />
and hidden data spaces.<br />
Also cited above is the excellent and highly recommended SIAM Review paper by Redner<br />
& Walker on applying the EM algorithm to the problem of mixture density estimation. This<br />
paper is well worth reading.<br />
Finally, the recent review paper by Tzikas et al. on the relationship between the EM<br />
algorithm and Variational approximation is a nice, short synopsis of material to be found<br />
in the textbook Pattern Recognition and Machine Learning, C. Bishop, Springer, 2006. The<br />
derivation of the EM algorithm given in this paper is slightly simpler than the one I give in<br />
lecture as (unlike DLR) they assume that the complete data space is the cartesian product<br />
of the actual data and hidden data spaces (Bishop makes this same simplifying assumption).<br />
2 Recall that for regular statistical families the MLE asymptotically attains the C-R lower bound, which<br />
is the inverse of the FIM. The availability of the error covariance matrix coupled with the fact that the MLE<br />
is asymptotically normal allows one to easily construct confidence intervals (error bars) about the estimated<br />
parameter values.<br />
3 On the one hand, the ability to avoid the explicit computation of the FIM (usually required to be<br />
updated at every iteration step) typically provides a huge computational savings relative to the Newton<br />
algorithm. On the other hand, having this matrix available once the algorithm has finally converged to an<br />
estimate of the unknown parameters allows one to construct confidence intervals (parameter error bars) for<br />
these parameters.<br />
2
<strong>Homework</strong> Problems and Matlab Programming Exercises<br />
1. Let the scalar random variables X1, · · · , Xn and Y1, · · · , Yn be all mutually independent,<br />
where Yi ∼ Poisson(β τi) and Xi ∼ Poisson(τi), i = 1, · · · n. The two data sets<br />
{Xi} n<br />
n<br />
i=1 and {Yi} i=1 taken together comprise the complete data. The parameters β<br />
and τi, i = 1, · · · , n, are deterministic and unknown. 4<br />
This provides a simple model of the incidence of a disease Yi seen in hospital i, where<br />
the underlying rate is a function of an overall (hospital independent) effect β due to<br />
the intrinsic virulence of the disease and an additional hospital specific factor τi. The<br />
availability of the measurements Xi allows one to directly estimate the hospital specific<br />
factor τi. 5<br />
(a) Find the complete information maximum likelihood estimate (MLE) of the unknown<br />
parameters.<br />
(b) Assume that the observation for X1 is missing. (Thus each hospital i, except for<br />
hospital 1, is able to provide a measurement of the quantity Xi.) Determine an EM<br />
algorithm for finding the actual information MLE of the unknown parameters.<br />
2. Let A = [aij] be an arbitrary real m × n matrix with ij-th component aij. For f a<br />
differentiable real-valued function of A, we define the matrix derivative and the matrix<br />
gradient of f(A) in a component-wise manner respectively as<br />
<br />
<br />
∂<br />
∂<br />
∂<br />
f(A) f(A) ; ∇A f(A) <br />
∂A ∂aji<br />
∂A f(A)<br />
T <br />
∂<br />
=<br />
∂aij<br />
<br />
f(A)<br />
Note that this convention is consistent with the convention used to define the vector<br />
derivative and (cartesian) gradient in <strong>ECE</strong>275A.<br />
For Σ square and invertible (but not necessarily symmetric) prove that<br />
∂<br />
∂Σ<br />
log det Σ = Σ−1<br />
and<br />
∂<br />
∂Σ tr Σ−1 W = −Σ −1 W Σ −1 .<br />
3. Let y be a gaussian random vector with unknown mean µ and unknown covariance<br />
matrix Σ which is assumed to be full rank. Given a collection of N iid samples of y use<br />
4 Recall that a Poisson(λ) distribution has the form<br />
pZ(z|λ) = e−λ λ z<br />
z!<br />
z = 0, 1, · · ·<br />
with mean E {z} = λ.<br />
5 For example, the parameter τi could depend upon the size and overall health of the population in the<br />
region served by hospital i and Xi could be the waiting time in minutes before an entering patient is first<br />
examined by a trained medical professional. Or τi could depend on the quality of the health care provided<br />
by hospital i and Xi could be the number of nurses with advanced training. Et cetera.<br />
3
the result of the previous homework problem to find the maximum likelihood estimates<br />
of µ and Σ. 6 Why is just determining a stationary point of the log<strong>–</strong>likelihood function<br />
generally sufficient to claim uniqueness and optimality of the solution?<br />
4. (i) In order to model the pdf of a scalar random variable, y, completely set up the<br />
M<strong>–</strong>component Gaussian mixture density problem as a hidden<strong>–</strong>data problem and then<br />
derive the EM algorithm for identifying the unknown mixture parameters. Assume<br />
that the individual mixture parameters are all independent. (ii) Write a program<br />
(in Matlab, or your favorite programming language) to implement your algorithm as<br />
requested in the problems given below.<br />
5. Note that the algorithm derived in problem 4 above requires no derivatives, hessians, or<br />
step-size parameters in its implementation. Is this true for a complete implementation<br />
of the EM solution given by Kay as equations (7.58) and (7.59)? Why? Can one always<br />
avoid derivatives when using the EM algorithm?<br />
6. On pages 290, 291, 293, and 294 (culminating in Example 9.3), Kay shows how to<br />
determine consistent estimates for the parameters of a zero<strong>–</strong>mean, unimodal gaussian<br />
mixture. What utility could these parameters have in determining MLE’s of the<br />
parameters via numerical means?<br />
7. Consider a two-gaussian mixture density p(y | Θ), with true mixture parameters α =<br />
α1 = 0.6, α = α2 = 1 − α = 0.4, means µ1 = 0, µ2 = 10, and variances σ 2 1, and σ 2 2.<br />
Thus Θ = {α, α, θ}, θ = {µ1, µ2, σ 2 1, σ 2 2}.<br />
The computer experiments described below are to be performed for the two cases<br />
σ 2 1 = σ 2 2 = 1 (i.e., both component standard deviations equal to 1) and σ 2 1 = σ 2 2 = 25<br />
(i.e., both component standard deviations equal to 5). Note that in the first case<br />
the means of the two component densities are located 10 standard deviations apart<br />
(probably a rarely seen situation in practice) whereas in the second case the means of<br />
the two component densities are located 2 standard deviations apart (probably a not<br />
so rare situation).<br />
(a) Plot the true pdf p(y | Θ) as a function of y. Generate and save 400 iid samples<br />
from the pdf. Show frequency histograms of the data for 25 samples, 50 samples,<br />
100 samples, 200 samples, and 400 samples, plotted on the same plot as the pdf.<br />
(b) (i) Derive an analytic expression for the mean µ, and variance σ 2 of y as a function<br />
of the mixture parameters, and evaluate this expression using the true parameter<br />
6 Do NOT use the gradient formulas for matrices constrained to be symmetric as is done by Moon and<br />
Stirling on page 558. Although the symmetrically<strong>–</strong>constrained derivative formulas are sometimes useful, they<br />
are not needed here because the stationary point of the likelihood just happens to turn out to be symmetric<br />
(a “happy accident”!) without the need to impose this constraint. This means that the (“accidently”<br />
symmetric) solution is optimal in the space of all matrices, not just on the manifold of symmetric matrices.<br />
I have never seen the symmetry constraint applied when taking the derivative except in Moon and Stirling.<br />
4
values. (ii) Compute the sample mean µ and sample variance σ 2 of y using the<br />
400 data samples and compare to the analytically determined true values. (iii)<br />
Show that the sample mean and sample variance are the ML estimates for the<br />
mean and variance of a (single) gaussian model for the data. Plot this estimated<br />
single gaussian model against the true two<strong>–</strong>gaussian mixture density.<br />
(c) (i) Assume that the true density is unknown and estimate the parameters for<br />
a two-component gaussian mixture 7 using the EM algorithm starting from the<br />
following initial conditions,<br />
What happens and why?<br />
µ1 = µ2 = µ , σ 2 1 = σ 2 2 = σ 2 , α = 1<br />
2 .<br />
(ii) Perturb the initial conditions slightly to destroy their symmetry and describe<br />
the resulting behavior of the EM algorithm in words.<br />
(iii) Again using all 400 samples, estimate the parameters for a variety of initial<br />
conditions and try to trap the algorithm in a false local optimum. Describe the<br />
results.<br />
(iv) Once you have determined a good set of initial conditions, estimate the mixture<br />
parameters for the two component model via the ME algorithm for 25, 50,<br />
100, 200, and 400 samples. Show that the actual data log-likelihood function increases<br />
monotonically with each iteration of the EM algorithm. Plot your final<br />
estimated parameter values versus log 2(Sample Number).<br />
(d) Discuss the difference between the case where the component standard deviations<br />
both have the value 1 and the case where they are both have the value 5.<br />
8. (i) For the two<strong>–</strong>component gaussian mixture case derive the EM algorithm when the<br />
constraint σ 2 1 = σ 2 2 = σ 2 is known to hold. (I.e., incorporate this known constraint<br />
into the algorithm.) Compare the resulting algorithm to the one derived in Problem<br />
4 above. (ii) Estimate the unknown parameters of a two-component gaussian mixture<br />
using the synthetic data generated in Problem 4 above using your modified algorithm<br />
and compare the results.<br />
9. EM computer experiment when one of the components is non-regular. Consider a twocomponent<br />
mixture model where the first component is uniformly distributed between<br />
0 and θ1, U(0, θ1), with mixture parameter α = 0.55, and the second component is<br />
normally distributed with mean µ and standard deviation σ 2 , θ2 = (µ, σ 2 ) T , with mixture<br />
parameter ¯α = 1 − α = 0.45. Assume that all of the parameters are independent<br />
of each other. Assume that 0 · log 0 = 0.<br />
7 By visual inspection of the data frequency histograms, one can argue that whatever the unknown distribution<br />
is, it is smooth with bimodal symmetric “humps” and hence should be adequately modelled by a<br />
two<strong>–</strong>component gaussian mixture.<br />
5
(a) i. Generate 1000 samples from the distribution described above for θ1 = 1,<br />
µ = 3<br />
2 , and σ2 = 1 . Plot a histogram of the data and the density function<br />
16<br />
on the same graph.<br />
ii. Now assume that you do not known how the samples were generated and learn<br />
the unknown distribution using 1, 2, 3, and 10 component gaussian mixture<br />
models by training on the synthesized data. Plot the true mixture distribution<br />
and the four learned gaussian mixture models on the same graph. Recall<br />
that the MLE-based density estimate is asymptotically closest to the true density<br />
in the Kullback-Liebler Divergence sense. Note that our learned models<br />
approximate an unknown non-regular mixture density by regular gaussian<br />
mixtures. Show that the actual data log-likelihood function increases monotonically<br />
with each iteration of the EM algorithm.<br />
iii. Repeat the above for the values µ = 1,<br />
1 and 2 mixtures.<br />
2<br />
(b) Suppose we now try to solve the non-regular two component mixture problem<br />
described above by actually modeling a uniform distribution plus gaussian twodensity<br />
mixture and applying the EM algorithm in an attempt to learn the components<br />
parameters θ1, µ and σ2 directly. Convince yourself that the Gaussian<br />
component can be handled as has already been done above, so that the novelty,<br />
and potential difficulty, is in dealing with the non-regular uniform distribution<br />
component.<br />
i. In the M-step of the EM algorithm show that if ˆxℓ,1 = 0 for some sample<br />
yℓ > θ1 then the function<br />
N<br />
ˆxj,1 log p1(yj; θ1)<br />
j=1<br />
is not bounded from below. What does this say about the admissible values<br />
of ˆ θ + 1 ?<br />
ii. Show that maximizing<br />
N<br />
ˆxj,1 log p1(yj; θ1)<br />
j=1<br />
with respect to θ1 is equivalent to maximizing<br />
N1 ˆ N<br />
1 <br />
θ1<br />
j ′ =1<br />
1(0,θ1)(yj ′) with θ1 ≥ yj ′ for all yj ′ (1)<br />
where {yj ′} are the data samples for which ˆxj ′ ,1 = 0. 1(0,θ1)(yj ′) is the indicator<br />
function that indicates whether or not yj ′ is in the interval (0, θ1).<br />
Maximize the expression (1) to obtain the estimate ˆ θ + 1 . (Hint: Compare to<br />
the full information MLE solution you derived last quarter.)<br />
6
Explain why the estimate provided by the EM algorithm remains stuck at<br />
the value of the very first update ˆ θ + , and never changes thereafter, and why<br />
the value one gets stuck at depends on the initialization value of ˆ θ1. Verify<br />
these facts in simulation (see below for additional simulation requests). Try<br />
various initialization values for ˆ θ1, including ˆ θ1 > max<br />
j yj. (Note that only<br />
initialization values that have an actual data log-likelihood that is bounded<br />
from below need be considered.) Show that the actual data log-likelihood<br />
function monotonically increases with each iteration of the EM algorithm<br />
(i.e., that we have monotonic hill-climbing on the actual data log-likelihood<br />
function).<br />
iii. Let us attempt to heuristically attempt to fix the “stickiness” problem of the<br />
EM algorithm. There is no guarantee that the procedure outlined below will<br />
work as we are not conforming to the theory of the EM algorithm. Thus,<br />
monotonic hill-climbing on the actual data log-likelihood function is not guaranteed.<br />
First put a floor on the value of ˆxj,1 for positive yj :<br />
If ˆxj,1 < ɛ and yj > 0 set ˆxj,1 = ɛ and ˆxj,2 = 1 − ɛ<br />
Choose ɛ to be a very small value. In particular choose ɛ ≪ 1/ ˆ θ1 where<br />
ˆθ1 > max<br />
j yj is the initialization value of the estimate of θ1.<br />
Next define two intermediate estimates, ˆ θ ′ 1 and ˆ θ ′′<br />
1, of θ1 as follows.<br />
ˆθ ′ 1 = 2<br />
ˆN1<br />
N<br />
j=1<br />
ˆxj,1 yj with ˆ N1 =<br />
ˆθ ′′<br />
1 = max ˆxj,1 yj e<br />
j<br />
−<br />
<br />
yj −ˆ θ ′ 2 1<br />
τ<br />
In the complete information case, which corresponds to setting ˆxj,1 = xj,1 and<br />
ˆN1 = N1, the estimate ˆ θ ′ 1 corresponds to the BLUE (and method of moments)<br />
estimate of θ1. We can refer to ˆ θ ′ 1 as the “pseudo-BLUE” estimate.<br />
The estimate ˆ θ ′′<br />
1 modifies the EM update estimate by adding the factor ˆxj,1,<br />
which weights yj according to the probability that it was generated by the<br />
uniform distribution, and an exponential factor which weights yj according to<br />
how far it is from the pseudo-BLUE estimate of θ1. We can refer to ˆ θ ′′<br />
1 as the<br />
“weighted EM update” of θ1. The parameter τ determines how aggressively<br />
we penalize the deviation of yj from ˆ θ ′ 1.<br />
N<br />
j=1<br />
We construct our final “Modified EM update” of θ1 as<br />
ˆxj,1<br />
ˆθ + 1 = β ˆ θ ′ 1 + ¯ β ˆ θ ′′<br />
1 for 0 ≤ β ≤ 1 and ¯ β = 1 − β<br />
7
For example, setting β = 1/2 yields<br />
ˆθ + 1 = 1<br />
2<br />
<br />
ˆθ ′<br />
1 + ˆ θ ′′<br />
<br />
1<br />
We see that there are three free parameters to be set when implementing the<br />
Modified EM update step. Namely, ɛ, τ, and β.<br />
Attempt to run the modified EM algorithm on 1000 samples generated from<br />
data for the cases θ1 = 1, σ2 = 1<br />
1 3<br />
and µ = , 1, , and 2. Plot the actual<br />
16 2 2<br />
data log-likelihood function to see if it fails to increase monotonically with<br />
each iteration of the EM algorithm.<br />
If the algorithm doesn’t work, don’t worry—I thought up this heuristic fix<br />
“on the fly” and I’m just curious to see if it has any chance of working. If<br />
you can get the procedure to work, describe its performance relative to the<br />
pure Gaussian mixture cases investigated above and show its performance for<br />
various choices of β, including β = 0, 0.5, and 1.<br />
8