Monitoring River and Lake Levels from Space - ESA
Monitoring River and Lake Levels from Space - ESA
Monitoring River and Lake Levels from Space - ESA

Create successful ePaper yourself
Turn your PDF publications into a flip-book with our unique Google optimized e-Paper software.
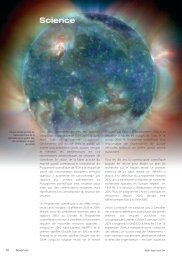
Earth Observation<br />
In this illustration, lakes seen by both ERS-2 <strong>and</strong><br />
Topex are shown in orange, lakes seen only by<br />
ERS-2 are in green, lakes not seen by either<br />
satellite are in blue, <strong>and</strong> three small lakes<br />
overflown only by Topex are shown in cyan. This<br />
dramatic difference in coverage is a consequence<br />
of the orbit patterns <strong>and</strong> the additional icetracking<br />
mode of the ERS Radar Altimeters<br />
of returns <strong>from</strong> inl<strong>and</strong> water/l<strong>and</strong><br />
composites over the Amazon Basin <strong>from</strong><br />
ERS-2 <strong>and</strong> Topex. This diversity in echo<br />
shapes means that it has not been possible<br />
to design just one retracking algorithm to<br />
reprocess all waveforms optimally. Rather,<br />
a suite of such algorithms is required, <strong>and</strong><br />
this is the approach that has been<br />
implemented for ERS-1/2, Envisat <strong>and</strong><br />
Topex data using the expert system<br />
developed at De Montfort University.<br />
Over rivers, ERS-2 shows significantly<br />
better performance than Topex, thanks to<br />
the Ice mode. The accompanying figure<br />
shows a typical 35-day cycle of ERS-2<br />
crossings (green) superimposed on the<br />
Amazon Basin bright-targets map developed<br />
<strong>from</strong> the ERS-1 geodetic mission (red).<br />
Four sample time series of river-height<br />
variations derived <strong>from</strong> the ERS-2<br />
retracked dataset are also shown. The large<br />
annual variation is clear.<br />
ERS-2 35-day crossings over the Amazon <strong>and</strong> samples of time<br />
series of river levels<br />
To illustrate the relative performance of<br />
a higher sampling frequency with an icemode<br />
altimeter, the next figure shows a<br />
similar map for ERS-2 three-day crossings<br />
(green) over Amazon Basin bright targets.<br />
Again, time-series data have been included<br />
to illustrate the satellite altimetry’s<br />
potential for identifying rapid temporal<br />
variations in river <strong>and</strong> stream height when<br />
using a satellite with a short orbit-repeat<br />
pattern.<br />
40 esa bulletin 117 - february 2004 www.esa.int