Evaluation Method for Ion Migration Using Dew Cycle Test (Part 2)
Evaluation Method for Ion Migration Using Dew Cycle Test (Part 2)
Evaluation Method for Ion Migration Using Dew Cycle Test (Part 2)

Create successful ePaper yourself
Turn your PDF publications into a flip-book with our unique Google optimized e-Paper software.
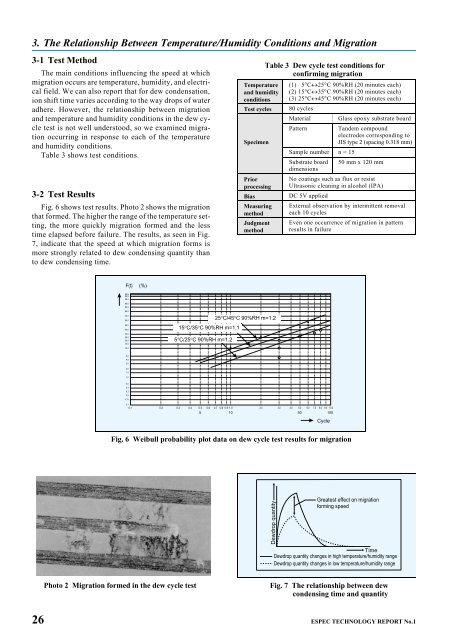
3. The Relationship Between Temperature/Humidity Conditions and <strong>Migration</strong><br />
3-1 <strong>Test</strong> <strong>Method</strong><br />
The main conditions influencing the speed at which<br />
migration occurs are temperature, humidity, and electrical<br />
field. We can also report that <strong>for</strong> dew condensation,<br />
ion shift time varies according to the way drops of water<br />
adhere. However, the relationship between migration<br />
and temperature and humidity conditions in the dew cycle<br />
test is not well understood, so we examined migration<br />
occurring in response to each of the temperature<br />
and humidity conditions.<br />
Table 3 shows test conditions.<br />
3-2 <strong>Test</strong> Results<br />
Fig. 6 shows test results. Photo 2 shows the migration<br />
that <strong>for</strong>med. The higher the range of the temperature setting,<br />
the more quickly migration <strong>for</strong>med and the less<br />
time elapsed be<strong>for</strong>e failure. The results, as seen in Fig.<br />
7, indicate that the speed at which migration <strong>for</strong>ms is<br />
more strongly related to dew condensing quantity than<br />
to dew condensing time.<br />
F(t) (%)<br />
Photo 2 <strong>Migration</strong> <strong>for</strong>med in the dew cycle test<br />
99.9<br />
99.8<br />
99.0<br />
95.0<br />
90.0<br />
80.0<br />
70.0<br />
60.0<br />
50.0<br />
40.0<br />
30.0<br />
25.0<br />
20.0<br />
15.0<br />
10.0<br />
5.0<br />
4.0<br />
3.0<br />
2.0<br />
1.5<br />
1.0<br />
0.5<br />
0.4<br />
0.3<br />
0.2<br />
0.15<br />
15°C/35°C 90%RH m=1.1<br />
5°C/25°C 90%RH m=1.2<br />
Temperature<br />
and humidity<br />
conditions<br />
<strong>Test</strong> cycles<br />
Specimen<br />
Prior<br />
processing<br />
Bias<br />
Measuring<br />
method<br />
Judgment<br />
method<br />
25°C/45°C 90%RH m=1.2<br />
Table 3 <strong>Dew</strong> cycle test conditions <strong>for</strong><br />
confirming migration<br />
<strong>Dew</strong>drop quantity<br />
(1) 5°C«25°C 90%RH (20 minutes each)<br />
(2) 15°C«35°C 90%RH (20 minutes each)<br />
(3) 25°C«45°C 90%RH (20 minutes each)<br />
80 cycles<br />
Material Glass epoxy substrate board<br />
Pattern Tandem compound<br />
electrodes corresponding to<br />
JIS type 2 (spacing 0.318 mm)<br />
Sample number n = 15<br />
Substrate board 50 mm x 120 mm<br />
dimensions<br />
No coatings such as flux or resist<br />
Ultrasonic cleaning in alcohol (IPA)<br />
DC 5V applied<br />
0.1<br />
0.1 0.2 0.3 0.4 0.5 0.6 0.7 0.8 0.9 1.0 2.0 3.0 4.0 5.0 6.0 7.0 8.0 9.0 10.0<br />
5 10 50 100<br />
External observation by intermittent removal<br />
each 10 cycles<br />
Even one occurrence of migration in pattern<br />
results in failure<br />
<strong>Cycle</strong><br />
Fig. 6 Weibull probability plot data on dew cycle test results <strong>for</strong> migration<br />
Greatest effect on migration<br />
<strong>for</strong>ming speed<br />
Time<br />
<strong>Dew</strong>drop quantity changes in high temperature/humidity range<br />
<strong>Dew</strong>drop quantity changes in low temperature/humidity range<br />
Fig. 7 The relationship between dew<br />
condensing time and quantity<br />
26 ESPEC TECHNOLOGY REPORT No.1