Performance analysis of opto-mechatronic image stabilization for a ...
Performance analysis of opto-mechatronic image stabilization for a ...
Performance analysis of opto-mechatronic image stabilization for a ...

Create successful ePaper yourself
Turn your PDF publications into a flip-book with our unique Google optimized e-Paper software.
342<br />
There is a clearly observable monotone dependency<br />
between the width <strong>of</strong> the spectral density <strong>of</strong> the random<br />
<strong>image</strong> model and the parameters <strong>of</strong> the <strong>image</strong> shift<br />
measurement error. Matching <strong>of</strong> more smoothed <strong>image</strong>s<br />
produces larger error. It is important, that similar spectra<br />
represent similar error parameters. For close spectral<br />
densities 1 and 2 the difference <strong>of</strong> the standard deviation<br />
is rather small (14–18%), whereas <strong>for</strong> wide apart spectral<br />
densities 5 and 6 the difference is 80%, which is about 4<br />
times larger.<br />
The range <strong>of</strong> <strong>image</strong> shifts <strong>for</strong> which a linear error model<br />
can be approximated is larger <strong>for</strong> more smoothed <strong>image</strong>s.<br />
In the experiment carried out, an interval <strong>of</strong> [71...710]<br />
pixels has been estimated.<br />
It can be assumed, that the comparison <strong>of</strong> the power<br />
spectrum <strong>of</strong> a given real <strong>image</strong> with spectral densities <strong>of</strong><br />
reference <strong>image</strong> models can allow the estimation <strong>of</strong><br />
parameters <strong>of</strong> the <strong>image</strong> shift measurement error.<br />
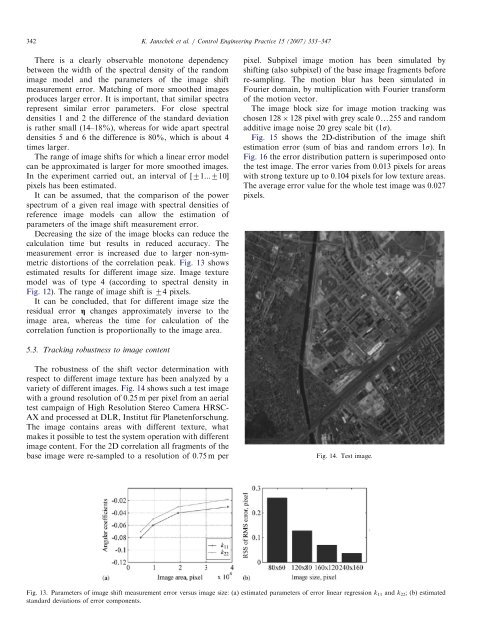
Decreasing the size <strong>of</strong> the <strong>image</strong> blocks can reduce the<br />
calculation time but results in reduced accuracy. The<br />
measurement error is increased due to larger non-symmetric<br />
distortions <strong>of</strong> the correlation peak. Fig. 13 shows<br />
estimated results <strong>for</strong> different <strong>image</strong> size. Image texture<br />
model was <strong>of</strong> type 4 (according to spectral density in<br />
Fig. 12). The range <strong>of</strong> <strong>image</strong> shift is 74 pixels.<br />
It can be concluded, that <strong>for</strong> different <strong>image</strong> size the<br />
residual error g changes approximately inverse to the<br />
<strong>image</strong> area, whereas the time <strong>for</strong> calculation <strong>of</strong> the<br />
correlation function is proportionally to the <strong>image</strong> area.<br />
5.3. Tracking robustness to <strong>image</strong> content<br />
The robustness <strong>of</strong> the shift vector determination with<br />
respect to different <strong>image</strong> texture has been analyzed by a<br />
variety <strong>of</strong> different <strong>image</strong>s. Fig. 14 shows such a test <strong>image</strong><br />
with a ground resolution <strong>of</strong> 0.25 m per pixel from an aerial<br />
test campaign <strong>of</strong> High Resolution Stereo Camera HRSC-<br />
AX and processed at DLR, Institut fu¨r Planeten<strong>for</strong>schung.<br />
The <strong>image</strong> contains areas with different texture, what<br />
makes it possible to test the system operation with different<br />
<strong>image</strong> content. For the 2D correlation all fragments <strong>of</strong> the<br />
base <strong>image</strong> were re-sampled to a resolution <strong>of</strong> 0.75 m per<br />
ARTICLE IN PRESS<br />
K. Janschek et al. / Control Engineering Practice 15 (2007) 333–347<br />
pixel. Subpixel <strong>image</strong> motion has been simulated by<br />
shifting (also subpixel) <strong>of</strong> the base <strong>image</strong> fragments be<strong>for</strong>e<br />
re-sampling. The motion blur has been simulated in<br />
Fourier domain, by multiplication with Fourier trans<strong>for</strong>m<br />
<strong>of</strong> the motion vector.<br />
The <strong>image</strong> block size <strong>for</strong> <strong>image</strong> motion tracking was<br />
chosen 128 128 pixel with grey scale 0y255 and random<br />
additive <strong>image</strong> noise 20 grey scale bit (1s).<br />
Fig. 15 shows the 2D-distribution <strong>of</strong> the <strong>image</strong> shift<br />
estimation error (sum <strong>of</strong> bias and random errors 1s). In<br />
Fig. 16 the error distribution pattern is superimposed onto<br />
the test <strong>image</strong>. The error varies from 0.013 pixels <strong>for</strong> areas<br />
with strong texture up to 0.104 pixels <strong>for</strong> low texture areas.<br />
The average error value <strong>for</strong> the whole test <strong>image</strong> was 0.027<br />
pixels.<br />
Fig. 14. Test <strong>image</strong>.<br />
Fig. 13. Parameters <strong>of</strong> <strong>image</strong> shift measurement error versus <strong>image</strong> size: (a) estimated parameters <strong>of</strong> error linear regression k11 and k22; (b) estimated<br />
standard deviations <strong>of</strong> error components.