SMEs and entrepreneurship in the EU - Eurostat - Europa
SMEs and entrepreneurship in the EU - Eurostat - Europa
SMEs and entrepreneurship in the EU - Eurostat - Europa

Create successful ePaper yourself
Turn your PDF publications into a flip-book with our unique Google optimized e-Paper software.
Statistics<br />
<strong>in</strong> focus<br />
INDUSTRY, TRADE AND<br />
SERVICES<br />
24/2006<br />
Author<br />
Manfred SCHMIEMANN<br />
Contents<br />
Size class profile....................... 2<br />
Labour productivity .................. 4<br />
Employment change................. 5<br />
Gender analysis of<br />
self-employment ....................... 6<br />
The motivation beh<strong>in</strong>d<br />
be<strong>in</strong>g self-employed ................. 6<br />
<br />
Manuscript completed on: 20.09.2006<br />
Data extracted on: 05.06.2006<br />
ISSN 1561-4840<br />
Catalogue number: KS-NP-06-024-EN-N<br />
© European Communities, 2006<br />
<strong>SMEs</strong> <strong>and</strong> <strong>entrepreneurship</strong><br />
<strong>in</strong> <strong>the</strong> <strong>EU</strong><br />
<br />
On <strong>the</strong> 6 May 2003, <strong>the</strong> European Commission adopted a new<br />
Recommendation 2003/361/EC 1 regard<strong>in</strong>g its def<strong>in</strong>ition of small <strong>and</strong> mediumsized<br />
enterprises (<strong>SMEs</strong>). The revision took account of economic<br />
developments s<strong>in</strong>ce 1996 <strong>and</strong> was aimed at reduc<strong>in</strong>g <strong>the</strong> possibility of<br />
circumvent<strong>in</strong>g <strong>the</strong> def<strong>in</strong>itions, particularly with regard to state aid, Structural<br />
Funds <strong>and</strong> <strong>the</strong> Research <strong>and</strong> Development Framework Programme. As a<br />
result of <strong>the</strong> changes, f<strong>in</strong>ancial ceil<strong>in</strong>gs were <strong>in</strong>creased <strong>in</strong> an attempt to avoid<br />
penalis<strong>in</strong>g enterprises that <strong>in</strong>vested.<br />
<strong>SMEs</strong> are def<strong>in</strong>ed by <strong>the</strong> European Commission as hav<strong>in</strong>g less than 250<br />
persons employed. They should also have an annual turnover of up to<br />
<strong>EU</strong>R 50 million, or a balance sheet total of no more than <strong>EU</strong>R 43 million.<br />
These def<strong>in</strong>itions are important when assess<strong>in</strong>g which enterprises may<br />
benefit from <strong>EU</strong> fund<strong>in</strong>g programmes aimed at promot<strong>in</strong>g <strong>SMEs</strong>, as well as <strong>in</strong><br />
relation to certa<strong>in</strong> policies such as SME-specific competition rules. European<br />
Commission policy <strong>in</strong> relation to <strong>SMEs</strong> is ma<strong>in</strong>ly concentrated <strong>in</strong> five priority<br />
areas, cover<strong>in</strong>g <strong>the</strong> promotion of <strong>entrepreneurship</strong> <strong>and</strong> skills, <strong>the</strong> improvement<br />
of <strong>SMEs</strong>’ access to markets, cutt<strong>in</strong>g red tape, <strong>the</strong> improvement of <strong>SMEs</strong>’<br />
growth potential <strong>and</strong> streng<strong>the</strong>n<strong>in</strong>g dialogue <strong>and</strong> consultation with SME<br />
stakeholders 2 . <strong>Eurostat</strong>’s structural bus<strong>in</strong>ess statistics (SBS) are <strong>the</strong> ma<strong>in</strong><br />
source of data for this publication. The SBS size class data presented <strong>in</strong> this<br />
Statistics <strong>in</strong> Focus are based solely on a def<strong>in</strong>ition relat<strong>in</strong>g to <strong>the</strong> number of<br />
persons employed.<br />
Entrepreneurs tend to start new enterprises as relatively small bus<strong>in</strong>esses.<br />
With<strong>in</strong> <strong>the</strong> <strong>EU</strong>-25, enterprises that employ less than two hundred <strong>and</strong> fifty<br />
people (so-called <strong>SMEs</strong>) have been <strong>the</strong> ma<strong>in</strong> driver of net employment growth<br />
with<strong>in</strong> <strong>the</strong> non-f<strong>in</strong>ancial bus<strong>in</strong>ess economy. Indeed, <strong>SMEs</strong> are <strong>the</strong> backbone<br />
of <strong>the</strong> <strong>EU</strong>’s non-f<strong>in</strong>ancial bus<strong>in</strong>ess economy (as def<strong>in</strong>ed by NACE Sections C<br />
to I <strong>and</strong> K), as <strong>the</strong>y represented 99.8 % of all <strong>EU</strong>-25 enterprises <strong>in</strong> 2003,<br />
employ<strong>in</strong>g about two thirds of <strong>the</strong> workforce <strong>and</strong> generat<strong>in</strong>g more than half<br />
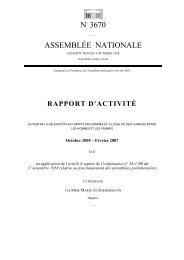
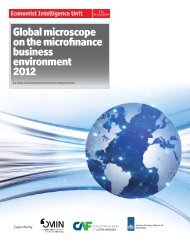
(57.3 %) of its value added (as shown <strong>in</strong> Figure 1).<br />
Figure 1: Breakdown of value added <strong>and</strong> number of persons employed by enterprise<br />
size-class, non-f<strong>in</strong>ancial bus<strong>in</strong>ess economy (NACE Sections C to I <strong>and</strong> K),<br />
<strong>EU</strong>-25, 2003 (% share of total)<br />
Small<br />
19.1%<br />
Micro<br />
20.5%<br />
Value added<br />
Medium<br />
17.8%<br />
Source: <strong>Eurostat</strong> SBS size class<br />
Large<br />
42.7%<br />
Micro<br />
29.8%<br />
Small<br />
20.8%<br />
Employment<br />
Large<br />
32.9%<br />
Medium<br />
16.5%<br />
1<br />
Commission Recommendation of 6 May 2003, OJ L 124 of 20.5.2003, p. 36.<br />
2<br />
More details can be found <strong>in</strong> <strong>the</strong> SME Envoy Report ‘activities of <strong>the</strong> European Union for small<br />
<strong>and</strong> medium-sized enterprises (<strong>SMEs</strong>)’, Commission staff work<strong>in</strong>g paper, SEC(2005)170.
N<strong>in</strong>e out of ten enterprises <strong>in</strong> <strong>the</strong> <strong>EU</strong>’s non-f<strong>in</strong>ancial<br />
bus<strong>in</strong>ess economy employed less than ten people <strong>in</strong><br />
2003 (see Table 1 below). These micro-enterprises<br />
accounted for about 30 % of all jobs <strong>and</strong> one fifth of<br />
<strong>the</strong> value added created.<br />
Small enterprises <strong>and</strong> medium-sized enterprises<br />
(def<strong>in</strong>ed as hav<strong>in</strong>g 10-49 persons employed <strong>and</strong> 50-<br />
249 persons employed respectively) toge<strong>the</strong>r<br />
employed a little over a third (37.3 %) of <strong>the</strong> nonf<strong>in</strong>ancial<br />
bus<strong>in</strong>ess economy workforce. They also<br />
generated broadly similar amounts of value added <strong>in</strong><br />
2003 (with 19.1 % <strong>and</strong> 17.8 % shares respectively of<br />
total <strong>EU</strong>-25 value added).<br />
Never<strong>the</strong>less, large enterprises (employ<strong>in</strong>g 250 or<br />
more people) generated <strong>the</strong> highest amount of value<br />
added (42.7 % of <strong>the</strong> total) of <strong>the</strong> four size classes,<br />
despite represent<strong>in</strong>g only 0.2 % of <strong>the</strong> total number<br />
of enterprises <strong>in</strong> 2003. The relatively few large<br />
enterprises employed about one third of <strong>the</strong><br />
workforce with<strong>in</strong> <strong>the</strong> <strong>EU</strong>'s non-f<strong>in</strong>ancial bus<strong>in</strong>ess<br />
economy (32.9 %).<br />
The share of value added with<strong>in</strong> <strong>the</strong> non-f<strong>in</strong>ancial<br />
bus<strong>in</strong>ess economy com<strong>in</strong>g from <strong>SMEs</strong> varied<br />
between 41.7 % <strong>in</strong> Slovakia <strong>and</strong> 70.4 % <strong>in</strong> Italy <strong>in</strong><br />
2003 (see Table 1). In terms of employment, <strong>the</strong><br />
relative importance of <strong>SMEs</strong> varied even more<br />
widely, from 49.3 % of total employment <strong>in</strong> Slovakia<br />
to 81.5 % <strong>in</strong> Italy. It is <strong>in</strong>terest<strong>in</strong>g to note <strong>the</strong> relative<br />
importance of micro enterprises <strong>in</strong> Italy <strong>and</strong> Spa<strong>in</strong> <strong>in</strong><br />
terms of both employment (47.1 % <strong>and</strong> 38.6 % of<br />
<strong>the</strong>ir respective non-f<strong>in</strong>ancial bus<strong>in</strong>ess economy) <strong>and</strong><br />
value added (31.7 % <strong>and</strong> 26.8 % respectively) when<br />
Size class profile<br />
Table 1: Breakdown of ma<strong>in</strong> <strong>in</strong>dicators by enterprise size class, non-f<strong>in</strong>ancial bus<strong>in</strong>ess economy<br />
(NACE Sections C- I <strong>and</strong> K), 2003 (% share of total) (1,2,3)<br />
compared with <strong>the</strong> <strong>EU</strong>-25 averages (29.8 % of<br />
employment <strong>and</strong> 20.5 % of value added). In contrast,<br />
large enterprises <strong>in</strong> Italy <strong>and</strong> Spa<strong>in</strong> accounted for a<br />
relatively low share of employment <strong>and</strong> value-added,<br />
while <strong>the</strong> opposite was true <strong>in</strong> Slovakia, <strong>the</strong> United<br />
K<strong>in</strong>gdom <strong>and</strong> F<strong>in</strong>l<strong>and</strong>, where large enterprises had a<br />
relatively big presence with<strong>in</strong> <strong>the</strong> non-f<strong>in</strong>ancial<br />
bus<strong>in</strong>ess economy.<br />
Four of <strong>the</strong> eight ma<strong>in</strong> sectors (NACE sections)<br />
provided more than four fifths (83.6 % <strong>in</strong> 2003) of <strong>the</strong><br />
<strong>EU</strong>-25’s value added with<strong>in</strong> <strong>the</strong> non-f<strong>in</strong>ancial<br />
bus<strong>in</strong>ess economy; manufactur<strong>in</strong>g provided 31.8 %,<br />
real estate, rent<strong>in</strong>g <strong>and</strong> bus<strong>in</strong>ess activities 20.6 %,<br />
distributive trades 19.4 % <strong>and</strong> transport <strong>and</strong><br />
communications 11.8 %. However, <strong>the</strong> size-class<br />
profiles of <strong>the</strong>se four activities were quite different<br />
from <strong>the</strong> non-f<strong>in</strong>ancial bus<strong>in</strong>ess economy average<br />
(see Figures 2 <strong>and</strong> 3). This is reflected by <strong>the</strong> fact<br />
that a relatively high proportion of wealth <strong>in</strong> 2003 was<br />
created by large enterprises with<strong>in</strong> transport <strong>and</strong><br />
communications (66.7 %) <strong>and</strong> manufactur<strong>in</strong>g<br />
(54.9 %), whereas a relatively low proportion of<br />
sectoral wealth was created by large enterprises <strong>in</strong><br />
distributive trades (29.6 %) <strong>and</strong> real estate, rent<strong>in</strong>g,<br />
<strong>and</strong> bus<strong>in</strong>ess activities – hereafter referred to <strong>in</strong> <strong>the</strong><br />
figures <strong>and</strong> tables as bus<strong>in</strong>ess activities (28.9 %).<br />
This dist<strong>in</strong>ction was even more marked <strong>in</strong> four of <strong>the</strong><br />
smaller sectors of <strong>the</strong> non-f<strong>in</strong>ancial bus<strong>in</strong>ess<br />
economy; as large enterprises accounted for 77.8 %<br />
of value added <strong>in</strong> electricity, gas <strong>and</strong> water supply<br />
(hereafter referred to as energy) <strong>and</strong> 65.8 % for<br />
m<strong>in</strong><strong>in</strong>g <strong>and</strong> quarry<strong>in</strong>g, compared with 23.3 % for<br />
hotels <strong>and</strong> restaurants <strong>and</strong> 17.4 % <strong>in</strong> construction.<br />
<strong>EU</strong>-25 BE CZ DK DE EE ES FR IT (4) LV LT (5)<br />
Number of enterprises<br />
Micro (1-9) 91.5 92.1 95.2 86.8 83.0 80.1 92.2 92.2 94.5 82.5 77.4<br />
Small (10-49) 7.3 6.7 3.9 10.9 14.2 16.4 6.9 6.5 4.9 14.5 18.2<br />
Medium (50-249) 1.1 1.0 0.7 1.9 2.3 3.1 0.8 1.1 0.5 2.7 3.8<br />
Large (250+)<br />
Number of persons employed<br />
0.2 0.2 0.2 0.3 0.5 0.4 0.1 0.2 0.1 0.4 0.5<br />
Micro (1-9) 29.8 29.0 32.6 19.6 19.6 : 38.6 23.3 47.1 20.6 17.7<br />
Small (10-49) 20.8 : 18.6 24.9 21.9 : 25.8 20.7 22.0 27.1 26.1<br />
Medium (50-249) 16.5 15.9 17.8 : 18.7 : 14.7 16.9 12.4 26.2 27.1<br />
Large (250+)<br />
Turnover<br />
32.9 : 31.0 : 39.8 : 20.9 39.2 18.5 26.1 29.1<br />
Micro (1-9) 19.4 22.8 19.4 21.4 12.3 : 25.3 20.0 29.0 17.6 11.9<br />
Small (10-49) 19.3 21.4 19.9 22.9 16.0 : 24.2 19.4 22.4 30.5 25.7<br />
Medium (50-249) 19.2 20.6 21.6 21.6 19.1 : 19.2 17.2 18.6 29.6 25.0<br />
Large (250+)<br />
Value added<br />
41.9 35.3 39.1 34.1 52.6 : 31.3 43.4 30.0 22.4 37.4<br />
Micro (1-9) 20.5 19.3 20.4 23.4 15.6 : 26.8 19.6 31.7 : 9.2<br />
Small (10-49) 19.1 : 17.1 21.2 18.3 : 24.5 18.2 22.4 25.6 21.8<br />
Medium (50-249) 17.8 19.0 19.3 : 18.6 : 17.1 16.0 16.3 27.6 25.3<br />
Large (250+) 42.7 : 43.2 : 47.6 : 31.6 46.2 29.6 : 43.6<br />
(1) Greece, Irel<strong>and</strong>, Cyprus, Luxembourg <strong>and</strong> Malta, not available.<br />
(2) The symbol “ : ” is used when data is ei<strong>the</strong>r not available or confidential.<br />
(3) For Belgium, Denmark, Estonia, <strong>the</strong> Ne<strong>the</strong>rl<strong>and</strong>s <strong>and</strong> Portugal, a very limited number of estimates were made.<br />
(4) Persons employed, turnover <strong>and</strong> value added data for NACE Section C, 2002.<br />
(5) All NACE Section I data, 2002.<br />
2 Statistics <strong>in</strong> focus — Industry, trade <strong>and</strong> services — 24/2006 ____________________________________________
Figure 2: Persons employed, <strong>EU</strong>-25, 2003<br />
(% share of total)<br />
M<strong>in</strong><strong>in</strong>g & quarry<strong>in</strong>g<br />
(Section C)<br />
Manufactur<strong>in</strong>g<br />
(Section D)<br />
Energy<br />
(Section E)<br />
Construction<br />
(Section F)<br />
Distributive trades<br />
(Section G)<br />
Hotels & restaurants<br />
(Section H)<br />
Transport & comm.<br />
(Section I)<br />
Bus<strong>in</strong>ess activities<br />
(Section K)<br />
Total<br />
(Sections C - I, K)<br />
Source: SBS size class<br />
<br />
0% 25% 50% 75% 100%<br />
Micro Small Medium Large<br />
With<strong>in</strong> a Member State, <strong>the</strong> relative importance of a<br />
particular size class with<strong>in</strong> a particular sector varied<br />
widely. It is <strong>in</strong>terest<strong>in</strong>g to highlight <strong>the</strong> role of micro<br />
enterprises <strong>in</strong> distributive trades, real estate, rent<strong>in</strong>g<br />
<strong>and</strong> bus<strong>in</strong>ess activities (Section K), construction <strong>and</strong><br />
hotels <strong>and</strong> restaurants <strong>in</strong> Italy. In all four of <strong>the</strong>se<br />
activities, micro enterprises <strong>in</strong> Italy provided an<br />
absolute majority of sectoral value added <strong>and</strong> up to<br />
two thirds of <strong>the</strong> workforce (with <strong>the</strong>ir share of total<br />
employment rang<strong>in</strong>g between 58 % <strong>and</strong> 67 %).<br />
Size class profile (cont<strong>in</strong>ued)<br />
Figure 3: Value added, <strong>EU</strong>-25, 2003<br />
(% share of total)<br />
M<strong>in</strong><strong>in</strong>g & quarry<strong>in</strong>g<br />
(Section C)<br />
Manufactur<strong>in</strong>g<br />
(Section D)<br />
Energy<br />
(Section E)<br />
Construction<br />
(Section F)<br />
Distributive trades<br />
(Section G)<br />
Hotels & restaurants<br />
(Section H)<br />
Transport & comm.<br />
(Section I)<br />
Bus<strong>in</strong>ess activities<br />
(Section K)<br />
Total<br />
(Sections C - I, K)<br />
Source: SBS size class<br />
0% 25% 50% 75% 100%<br />
Micro Small Medium Large<br />
Some sectors of <strong>the</strong> non-f<strong>in</strong>ancial bus<strong>in</strong>ess economy<br />
are more labour-<strong>in</strong>tensive than o<strong>the</strong>rs. The<br />
differentials <strong>in</strong> <strong>the</strong> relative shares of <strong>the</strong> total number<br />
of persons employed <strong>and</strong> total value added for <strong>the</strong><br />
size-class of a sector <strong>in</strong>dicate differences <strong>in</strong><br />
apparent labour productivity between <strong>the</strong> size<br />
classes of that sector.<br />
HU NL AT PL PT (6) SI (7) SK FI SE (8) UK BG RO<br />
Number of enterprises<br />
Micro (1-9) 94.7 88.1 86.7 96.3 92.4 92.8 73.3 92.1 90.8 86.4 90.8 87.1<br />
Small (10-49) 4.4 9.8 11.3 2.6 6.6 5.6 20.0 6.3 7.6 11.4 7.4 9.8<br />
Medium (50-249) 0.7 1.8 1.7 0.9 1.0 1.3 5.2 1.3 1.3 1.8 1.5 2.5<br />
Large (250+)<br />
Number of persons employed<br />
0.2 0.3 0.3 0.2 0.1 0.3 1.4 0.3 0.3 0.4 0.3 0.6<br />
Micro (1-9) 35.9 28.9 25.1 40.5 39.7 27.3 12.5 21.5 24.3 21.1 : :<br />
Small (10-49) 18.6 : : 11.5 23.6 17.3 14.6 19.2 : 17.9 : :<br />
Medium (50-249) 16.3 18.6 : 18.3 17.6 : 22.2 18.5 17.0 14.8 : :<br />
Large (250+)<br />
Turnover<br />
29.2 : : 29.6 19.1 : 50.7 40.9 : 46.2 : :<br />
Micro (1-9) 21.1 16.4 : 25.3 : : 12.7 15.6 : 15.4 25.2 15.0<br />
Small (10-49) 19.0 22.2 : 14.5 : : 15.9 15.6 : 16.3 21.9 22.1<br />
Medium (50-249) 18.6 24.5 : 22.1 : : 19.8 19.8 : 18.0 19.9 20.2<br />
Large (250+)<br />
Value added<br />
41.2 36.9 : 38.1 : : 51.5 48.9 : 50.3 32.9 42.7<br />
Micro (1-9) 17.2 : 18.9 16.0 22.5 19.2 11.7 18.1 17.6 17.9 : :<br />
Small (10-49) 16.2 : : 11.0 21.0 17.6 12.3 16.0 : 16.1 : :<br />
Medium (50-249) 18.4 : : 21.4 21.9 : 17.6 19.0 19.1 16.5 : :<br />
Large (250+) 48.2 : : 51.7 34.6 : 58.3 46.8 : 49.4 : :<br />
(6) Persons employed <strong>and</strong> value added data for NACE Section C, 2002.<br />
(7) Persons employed data for NACE Sections E, H <strong>and</strong> K, 2002; value added data for NACE Section E, 2002.<br />
(8) All NACE Sections C to G data, 2002.<br />
Source: <strong>Eurostat</strong> SBS size class<br />
___________________________________________ 24/2006 — Industry, trade <strong>and</strong> services — Statistics <strong>in</strong> focus 3
Labour productivity<br />
Figure 4: Apparent labour productivity, <strong>EU</strong>-25, 2003 (<strong>EU</strong>R 1 000 per person employed)<br />
250<br />
225<br />
200<br />
175<br />
150<br />
125<br />
100<br />
75<br />
50<br />
25<br />
0<br />
M<strong>in</strong><strong>in</strong>g & quarry<strong>in</strong>g<br />
(Section C)<br />
Manufactur<strong>in</strong>g<br />
(Section D)<br />
Energy<br />
(Section E)<br />
Construction<br />
(Section F)<br />
Source: <strong>Eurostat</strong>, SBS size class<br />
Apparent labour productivity is a measure of <strong>the</strong><br />
average value added, or wealth created, by each<br />
member of <strong>the</strong> workforce with<strong>in</strong> an enterprise. For<br />
many activities, economic <strong>the</strong>ory would suggest that<br />
economies of scale may lead to medium-sized <strong>and</strong><br />
large enterprises generat<strong>in</strong>g more value added per<br />
person employed than micro or small enterprises.<br />
However, this is not necessarily <strong>the</strong> case with<strong>in</strong> many<br />
parts of <strong>the</strong> service sector of <strong>the</strong> economy, where<br />
economies of scale are not so obvious, barriers to<br />
entry are sometimes low, <strong>and</strong> where proximity to<br />
market is often of considerable importance.<br />
In 2003, apparent labour productivity <strong>in</strong> <strong>the</strong> <strong>EU</strong>-25<br />
was on average highest for energy (an average of<br />
<strong>EU</strong>R 109 000 per person employed), <strong>and</strong> for m<strong>in</strong><strong>in</strong>g<br />
<strong>and</strong> quarry<strong>in</strong>g enterprises (<strong>EU</strong>R 97 000 per person<br />
employed), <strong>and</strong> lowest for hotels <strong>and</strong> restaurants<br />
(<strong>EU</strong>R 19 000 per person employed). None of <strong>the</strong>se<br />
three activities accounted for more than a 3.5 %<br />
share of total value added with<strong>in</strong> <strong>the</strong> <strong>EU</strong>-25's nonf<strong>in</strong>ancial<br />
bus<strong>in</strong>ess economy <strong>in</strong> 2003. None<strong>the</strong>less, it<br />
is <strong>in</strong>terest<strong>in</strong>g to note that large enterprises dom<strong>in</strong>ated<br />
energy <strong>and</strong> m<strong>in</strong><strong>in</strong>g <strong>and</strong> quarry<strong>in</strong>g activities<br />
(account<strong>in</strong>g for 78 % <strong>and</strong> 66 % of sectoral value<br />
added respectively), while <strong>the</strong> correspond<strong>in</strong>g share<br />
for hotels <strong>and</strong> restaurants (at 23 %) was well below<br />
that accounted for by micro enterprises (38 %). Note<br />
that enterprises with a high proportion of part-time<br />
employment (whe<strong>the</strong>r from work<strong>in</strong>g reduced hours or<br />
a reduced number of days), will tend to report<br />
relatively low apparent labour productivity ratios<br />
because <strong>the</strong> calculation of this <strong>in</strong>dicator relies solely<br />
on head-counts of employment (<strong>and</strong> not full-time<br />
equivalents). As such, this expla<strong>in</strong>s to some degree<br />
<strong>the</strong> relatively low apparent labour productivity<br />
recorded for hotels <strong>and</strong> restaurants <strong>and</strong> for<br />
distributive trades.<br />
Distributive trades<br />
(Section G)<br />
Micro Small Medium Large<br />
Hotels & restaurants<br />
(Section H)<br />
Transport &<br />
communications<br />
(Section I)<br />
4 Statistics <strong>in</strong> focus — Industry, trade <strong>and</strong> services — 24/2006 ____________________________________________<br />
Bus<strong>in</strong>ess activities<br />
(Section K)<br />
In manufactur<strong>in</strong>g, construction, hotels <strong>and</strong> restaurants,<br />
<strong>and</strong> transport <strong>and</strong> communications, <strong>the</strong>re was a pattern<br />
of <strong>in</strong>creas<strong>in</strong>g levels of apparent labour productivity with<br />
each larger size class across <strong>the</strong> <strong>EU</strong>-25 as a whole. In<br />
m<strong>in</strong><strong>in</strong>g <strong>and</strong> quarry<strong>in</strong>g as well as energy activities, microsized<br />
enterprises <strong>in</strong> <strong>the</strong> <strong>EU</strong>-25 recorded <strong>the</strong> highest<br />
apparent labour productivity across <strong>the</strong> respective size<br />
classes. In distributive trades <strong>and</strong> real estate, rent<strong>in</strong>g<br />
<strong>and</strong> o<strong>the</strong>r bus<strong>in</strong>ess activities (Section K), small <strong>and</strong><br />
medium-sized enterprises had higher apparent labour<br />
productivity levels than large enterprises. Note that<br />
<strong>the</strong>re are very few micro units operat<strong>in</strong>g with<strong>in</strong> energy<br />
<strong>and</strong> water supply sectors <strong>and</strong> that <strong>the</strong>ir economic<br />
weight is limited (account<strong>in</strong>g for 2.9 % of employment<br />
with<strong>in</strong> Section E). Those micro enterprises <strong>in</strong>clude<br />
power plants that may generate electricity with very few<br />
persons employed, thus result<strong>in</strong>g <strong>in</strong> relatively high<br />
apparent labour productivity figures.<br />
Apparent labour productivity was much lower <strong>in</strong> <strong>the</strong> ten<br />
Member States that jo<strong>in</strong>ed <strong>the</strong> <strong>EU</strong> <strong>in</strong> 2004 than it was<br />
for all of <strong>the</strong> <strong>EU</strong>-15 Member States except Portugal.<br />
However, <strong>the</strong> differences <strong>in</strong> <strong>the</strong> levels of apparent<br />
productivity that were observed between <strong>the</strong> eight nonf<strong>in</strong>ancial<br />
bus<strong>in</strong>ess economy NACE sections at <strong>the</strong> <strong>EU</strong>-<br />
25 level were generally reflected among <strong>the</strong> Member<br />
States. Fur<strong>the</strong>rmore, <strong>the</strong> differences observed between<br />
<strong>the</strong> size classes of enterprises with<strong>in</strong> a s<strong>in</strong>gle activity<br />
were also largely repeated, particularly for <strong>the</strong> largest<br />
activities. Interest<strong>in</strong>gly, large enterprises <strong>in</strong> real estate,<br />
rent<strong>in</strong>g <strong>and</strong> o<strong>the</strong>r bus<strong>in</strong>ess activities (Section K) had <strong>the</strong><br />
lowest apparent labour productivity among <strong>the</strong><br />
respective size classes <strong>in</strong> 17 of <strong>the</strong> 22 Member States<br />
for which <strong>in</strong>formation was available. Indeed, <strong>in</strong><br />
Germany <strong>and</strong> France <strong>the</strong> general pattern was that <strong>the</strong><br />
larger <strong>the</strong> size of an enterprise <strong>in</strong> this activity, <strong>the</strong> lower<br />
its apparent labour productivity.
Data on <strong>the</strong> changes <strong>in</strong> <strong>the</strong> numbers of persons<br />
employed can only be analysed over a relatively short<br />
period of time due to <strong>the</strong> availability of <strong>EU</strong>-25 totals. As<br />
such, <strong>the</strong> follow<strong>in</strong>g analysis is based on a comparison<br />
of <strong>the</strong> number of persons employed between reference<br />
years 2001 <strong>and</strong> 2003. The changes <strong>in</strong> employment (as<br />
shown <strong>in</strong> Table 2) are detailed by size class <strong>and</strong> by<br />
sector (NACE section) with<strong>in</strong> <strong>the</strong> non-f<strong>in</strong>ancial bus<strong>in</strong>ess<br />
economy, <strong>and</strong> are represented <strong>in</strong> terms of overall<br />
percentage changes <strong>in</strong> employment levels between<br />
<strong>the</strong>se two years. It should be noted that <strong>the</strong> percentage<br />
ga<strong>in</strong>s/losses are <strong>the</strong> net result of ga<strong>in</strong>s/losses through<br />
movements between activities (enterprises chang<strong>in</strong>g<br />
activity), between size classes (as enterprises grow or<br />
shr<strong>in</strong>k), <strong>and</strong> births <strong>and</strong> deaths of enterprises.<br />
The notion that <strong>SMEs</strong> are often a driver of<br />
employment growth is supported by data shown <strong>in</strong><br />
Table 2 (at least for <strong>the</strong> period studied). Note that<br />
where <strong>the</strong>re have been net employment ga<strong>in</strong>s, <strong>the</strong><br />
growth <strong>in</strong> employment has been higher among <strong>SMEs</strong><br />
than among large enterprises. For hotels <strong>and</strong><br />
restaurants, transport <strong>and</strong> communications,<br />
distributive trades, <strong>and</strong> bus<strong>in</strong>ess services, <strong>the</strong> pace<br />
of employment growth <strong>in</strong> <strong>the</strong> SME size classes<br />
consistently outstripped that of large enterprises. In<br />
<strong>the</strong> case of construction activities, net <strong>in</strong>creases<br />
among <strong>the</strong> SME size classes offset <strong>the</strong> net job losses<br />
observed among <strong>the</strong> large enterprise size class.<br />
Table 2: Ga<strong>in</strong>s/losses <strong>in</strong> <strong>the</strong> number of persons employed,<br />
<strong>EU</strong>-25, 2001-2003 (overall % change) (1)<br />
M<strong>in</strong><strong>in</strong>g <strong>and</strong> quarry<strong>in</strong>g<br />
(Section C)<br />
Manufactur<strong>in</strong>g<br />
(Section D)<br />
Energy<br />
(Section E)<br />
Construction<br />
(Section F)<br />
Distributive trades<br />
(Section G)<br />
Hotels <strong>and</strong> restaurants<br />
(Section H)<br />
Transport <strong>and</strong><br />
communications<br />
(Section I)<br />
Bus<strong>in</strong>ess activities<br />
(Section K)<br />
Overall<br />
change<br />
Micro<br />
(1-9)<br />
Small<br />
(10-49)<br />
Medium<br />
(50-249)<br />
<strong>SMEs</strong><br />
(1-249)<br />
Employment change<br />
Large<br />
(250+)<br />
-5.7 -1.0 -7.0 1.5 -2.6 -7.2<br />
-3.2 -0.4 -1.3 -2.5 -1.6 -5.6<br />
-3.2 1.8 0.8 -0.1 0.3 -4.2<br />
3.0 7.8 0.7 1.1 4.0 -4.4<br />
4.8 5.5 5.6 2.7 5.1 4.1<br />
8.3 9.6 12.5 4.8 9.8 1.9<br />
2.8 9.0 3.8 5.0 6.2 0.2<br />
3.6 5.4 1.8 3.8 4.0 2.8<br />
(1) Sections F & K are based on partial <strong>EU</strong> averages.<br />
Source: <strong>Eurostat</strong> SBS size class<br />
Even <strong>in</strong> those sectors where <strong>the</strong>re were significant<br />
overall job losses between 2001 <strong>and</strong> 2003, <strong>SMEs</strong> as a<br />
whole experienced ei<strong>the</strong>r a slower rate of decl<strong>in</strong>e than<br />
large enterprises or saw little change <strong>in</strong> <strong>the</strong>ir<br />
employment level.<br />
These results for <strong>the</strong> <strong>EU</strong>-25 were widely reflected<br />
across most of <strong>the</strong> Member States (see Figure 5),<br />
with particularly high net <strong>in</strong>creases <strong>in</strong> employment <strong>in</strong><br />
Spa<strong>in</strong> <strong>and</strong> Italy over <strong>the</strong> period considered. In Spa<strong>in</strong>,<br />
employment growth was largely concentrated with<strong>in</strong><br />
real estate, rent<strong>in</strong>g <strong>and</strong> o<strong>the</strong>r bus<strong>in</strong>ess activities<br />
(Section K), distributive trades <strong>and</strong> construction. In all<br />
three of <strong>the</strong>se activities, <strong>SMEs</strong> were largely<br />
responsible for <strong>the</strong> net job creation.<br />
Figure 5: Ga<strong>in</strong>s/losses <strong>in</strong> <strong>the</strong> number of persons employed,<br />
non-f<strong>in</strong>ancial bus<strong>in</strong>ess economy (NACE Sections<br />
C-I <strong>and</strong> K), 2001-2003 (thous<strong>and</strong>s of persons)<br />
-500 -250 0 250 500 750 1000<br />
___________________________________________<br />
24/2006 — Industry, trade <strong>and</strong> services — Statistics <strong>in</strong> focus 5<br />
<br />
ES<br />
IT (1)<br />
AT (2)<br />
CZ (1)<br />
FR<br />
PT (1)<br />
HU (1)<br />
LV (1)<br />
FI (2)<br />
SK (3)<br />
DK (1)<br />
BE (1)<br />
DE<br />
UK<br />
Micro Small Medium Large<br />
(1) Exclud<strong>in</strong>g m<strong>in</strong><strong>in</strong>g <strong>and</strong> quarry<strong>in</strong>g (Section C).<br />
(2) Exclud<strong>in</strong>g m<strong>in</strong><strong>in</strong>g <strong>and</strong> quarry<strong>in</strong>g <strong>and</strong> energy (Sections C & E).<br />
(3) Exclud<strong>in</strong>g hotels <strong>and</strong> restaurants (Section H).<br />
Source: <strong>Eurostat</strong> SBS size class<br />
Austria, <strong>the</strong> Czech Republic, France, Portugal <strong>and</strong><br />
Hungary also recorded overall growth <strong>in</strong> <strong>the</strong>ir<br />
respective employment levels with<strong>in</strong> <strong>the</strong>ir nonf<strong>in</strong>ancial<br />
bus<strong>in</strong>ess economies between 2001 <strong>and</strong><br />
2003. In each case, this was driven by growth among<br />
<strong>the</strong> SME size classes, as net job reductions were<br />
recorded for <strong>the</strong> large enterprise size class.<br />
In Germany, <strong>the</strong> majority of net job losses also came<br />
from <strong>the</strong> large enterprise size class, while <strong>the</strong>re was<br />
a net <strong>in</strong>crease <strong>in</strong> persons employed by <strong>the</strong> micro<br />
enterprise size class. On <strong>the</strong> o<strong>the</strong>r h<strong>and</strong>, <strong>in</strong> <strong>the</strong><br />
rema<strong>in</strong><strong>in</strong>g Member States that recorded net job<br />
reductions for <strong>the</strong>ir respective non-f<strong>in</strong>ancial bus<strong>in</strong>ess<br />
economies, <strong>and</strong> most particularly <strong>in</strong> <strong>the</strong> United<br />
K<strong>in</strong>gdom, <strong>the</strong> SME size classes recorded a higher<br />
proportion of job losses.
With<strong>in</strong> <strong>the</strong> <strong>EU</strong>-25, self-employment accounted for about<br />
16.0 % of total employment across <strong>the</strong> non-f<strong>in</strong>ancial<br />
bus<strong>in</strong>ess economy <strong>in</strong> 2005, with over three times as<br />
many male self-employed workers as women.<br />
Among <strong>the</strong> eight NACE sections that make-up <strong>the</strong> nonf<strong>in</strong>ancial<br />
bus<strong>in</strong>ess economy (subject to data availability),<br />
<strong>the</strong> highest rates of self-employment <strong>in</strong> 2005 were<br />
recorded for construction (24.5 %), real estate, rent<strong>in</strong>g<br />
<strong>and</strong> o<strong>the</strong>r bus<strong>in</strong>ess activities (Section K, 22.6 %),<br />
distributive trades (19.8 %) <strong>and</strong> hotels <strong>and</strong> restaurants<br />
(19.4 %). These were, perhaps unsurpris<strong>in</strong>gly, <strong>the</strong> same<br />
four activities that recorded <strong>the</strong> highest proportion of<br />
<strong>the</strong>ir total employment among <strong>SMEs</strong> <strong>and</strong> also showed<br />
<strong>the</strong> highest rates of net job ga<strong>in</strong>s dur<strong>in</strong>g <strong>the</strong> period 2001<br />
to 2003.<br />
Among <strong>the</strong> Member States, <strong>the</strong> highest rates of selfemployment<br />
were registered <strong>in</strong> Greece (31.9 %), Italy<br />
(28.7 %), Cyprus (24.0 %) <strong>and</strong> Portugal (20.9 %). It is<br />
<strong>in</strong>terest<strong>in</strong>g to note, however, that with<strong>in</strong> each of <strong>the</strong>se<br />
Member States <strong>the</strong> enthusiasm to be self-employed was<br />
among <strong>the</strong> lowest <strong>in</strong> <strong>the</strong> <strong>EU</strong>-25 (see next section). This<br />
may suggest that labour markets do not provide<br />
Accord<strong>in</strong>g to a Eurobarometer survey held with<strong>in</strong> <strong>the</strong><br />
European Economic Area <strong>and</strong> <strong>the</strong> United States <strong>in</strong> April<br />
2004, a relatively high proportion of <strong>EU</strong>-25 citizens<br />
declared a preference for be<strong>in</strong>g an employee; with 50 %<br />
aspir<strong>in</strong>g to be employees compared with 45 % who<br />
would prefer to be self-employed (5 % ‘do not know’).<br />
This contrasted with <strong>the</strong> United States, where<br />
Americans were much more <strong>in</strong>cl<strong>in</strong>ed to have a<br />
preference for be<strong>in</strong>g self-employed (61 %).<br />
There were fairly strong differences among <strong>the</strong> Member<br />
States concern<strong>in</strong>g self-employment preferences. The<br />
highest preference for self-employment was declared <strong>in</strong><br />
F<strong>in</strong>l<strong>and</strong> (68 %), followed by <strong>the</strong> Ne<strong>the</strong>rl<strong>and</strong>s (66 %) <strong>and</strong><br />
Sweden (61 %), with <strong>the</strong> lowest shares <strong>in</strong> Spa<strong>in</strong> (34 %),<br />
Portugal <strong>and</strong> Cyprus (each 32 %).<br />
Over half of all men <strong>in</strong> <strong>the</strong> <strong>EU</strong>-25 preferred <strong>the</strong> idea of<br />
self-employment (51 %), a much higher proportion than<br />
that recorded for women (39 %), an <strong>in</strong>dication of why<br />
<strong>the</strong>re might be such a disparity <strong>in</strong> <strong>the</strong> gender breakdown<br />
of those actually <strong>in</strong> self-employment.<br />
Among those <strong>EU</strong>-25 citizens that declared a preference<br />
for ideally be<strong>in</strong>g self-employed, <strong>the</strong> ma<strong>in</strong> reason given<br />
was that self-employment was perceived as provid<strong>in</strong>g<br />
<strong>in</strong>dependence <strong>and</strong> self-fulfilment. O<strong>the</strong>r overlapp<strong>in</strong>g<br />
reasons were an <strong>in</strong>terest <strong>in</strong> <strong>the</strong> tasks accomplished<br />
(77 % of respondents), as well as <strong>the</strong> possibility of<br />
creat<strong>in</strong>g <strong>the</strong>ir own work<strong>in</strong>g environment (16 %). These<br />
three answers are presented toge<strong>the</strong>r <strong>in</strong> po<strong>in</strong>t 1 of<br />
Table 3 <strong>and</strong> were by far <strong>the</strong> most popular reasons given<br />
Gender analysis of self-employment<br />
sufficient opportunities to be paid employees, forc<strong>in</strong>g<br />
some people <strong>in</strong>to self-employment when <strong>the</strong>y would<br />
prefer to work for an employer. The lowest rates of selfemployment<br />
were recorded <strong>in</strong> <strong>the</strong> Baltic Member States<br />
(7 % to 9 %).<br />
Figure 6: Proportion of self-employment <strong>in</strong> total employment,<br />
<strong>EU</strong>-25, 2005 (%) (1)<br />
Bus<strong>in</strong>ess activities<br />
(Section K)<br />
Transport & comm.<br />
(Section I)<br />
Hotels & restaurants<br />
(Section H)<br />
Distributive trades<br />
(Section G)<br />
Construction<br />
(Section F)<br />
Manufactur<strong>in</strong>g<br />
(Section D)<br />
0 10 20 30<br />
Men Women<br />
(1) Data for Sections C <strong>and</strong> E, not available.<br />
Source: <strong>Eurostat</strong> LFS<br />
The motivation beh<strong>in</strong>d be<strong>in</strong>g self-employed<br />
for want<strong>in</strong>g to be self-employed (93 % of respondents).<br />
The second most often given reason was <strong>the</strong> prospect<br />
of a better <strong>in</strong>come (23 %).<br />
Please note that multiple answers were allowed for <strong>EU</strong>-<br />
25 respondents to this question, while this was not <strong>the</strong><br />
case for <strong>the</strong> United States data set, where those<br />
<strong>in</strong>terviewed were only asked for <strong>the</strong>ir primary reason for<br />
want<strong>in</strong>g to be self-employed.<br />
Table 3: Reasons for be<strong>in</strong>g self-employed, April 2004<br />
1 Personal <strong>in</strong>dependence, self-fulfilment,<br />
<strong>in</strong>terest<strong>in</strong>g tasks, no need to adapt to an<br />
environment & possibility to create own<br />
environment<br />
6 Statistics <strong>in</strong> focus — Industry, trade <strong>and</strong> services — 24/2006 ____________________________________________<br />
<strong>EU</strong>-25 US<br />
93 82<br />
2 Better <strong>in</strong>come prospects 23 9<br />
3 A bus<strong>in</strong>ess opportunity 8 2<br />
4 To avoid uncerta<strong>in</strong>ty related to<br />
employment<br />
4 2<br />
5 Members of family, friends are selfemployed<br />
3 0<br />
6 Lack of attractive employment<br />
opportunities generally<br />
2 0<br />
7 Favourable economic climate 2 1<br />
8 Lack of attractive employment<br />
opportunities <strong>in</strong> my region specifically<br />
1 0<br />
Source: European Commission Flash Eurobarometer 160,<br />
‘Entrepreneurship’ Directorate General Enterprise<br />
<strong>and</strong> Directorate General Press & Communication
ESSENTIAL INFORMATION – METHODOLOGICAL NOTES<br />
<br />
Data sources:<br />
The source of all figures presented <strong>in</strong> this publication is<br />
<strong>Eurostat</strong> (except Flash Eurobarometer figures<br />
presented <strong>in</strong> Table 3) <strong>and</strong> reflects <strong>the</strong> state of data<br />
availability <strong>in</strong> <strong>Eurostat</strong>’s on-l<strong>in</strong>e database as of June<br />
2006.<br />
Structural bus<strong>in</strong>ess statistics (SBS) is <strong>the</strong> ma<strong>in</strong> data<br />
source for this publication. SBS data are collected<br />
with<strong>in</strong> <strong>the</strong> framework of Council Regulation on Structural<br />
Bus<strong>in</strong>ess Statistics (EC, <strong>EU</strong>RATOM) No. 58/97 of<br />
December 1996. The SBS Regulation governs <strong>the</strong><br />
transmission of data to <strong>Eurostat</strong> from <strong>the</strong> reference year<br />
1995 onwards <strong>and</strong> covers Sections C to K of NACE<br />
Rev. 1.1. For fur<strong>the</strong>r <strong>in</strong>formation on <strong>the</strong> NACE<br />
classification, visit:<br />
http://ec.europa.eu/comm/eurostat/ramon/<strong>in</strong>dex.cfm?<br />
TargetUrl=DSP_PUB_WELC.<br />
The ma<strong>in</strong> SBS data set used <strong>in</strong> this publication is<br />
annual enterprise statistics broken down by size<br />
class. This <strong>and</strong> o<strong>the</strong>r SBS data sets are available under<br />
<strong>the</strong>me 4: ‘Industry, trade <strong>and</strong> services’ on <strong>the</strong> <strong>Eurostat</strong><br />
website (see back page for more <strong>in</strong>formation). Selected<br />
publications, data <strong>and</strong> background <strong>in</strong>formation are<br />
available <strong>in</strong> <strong>the</strong> section dedicated to European<br />
Bus<strong>in</strong>ess, located directly under <strong>the</strong> <strong>the</strong>me ‘Industry,<br />
trade <strong>and</strong> services’ on <strong>the</strong> <strong>Eurostat</strong> website.<br />
Labour Force Survey (LFS) is a household sample<br />
survey provid<strong>in</strong>g annual <strong>and</strong> quarterly results on labour<br />
participation of people aged 15 <strong>and</strong> over as well as on<br />
persons outside <strong>the</strong> labour force. The reference year is<br />
<strong>the</strong> calendar year except <strong>in</strong> Germany (March 2004),<br />
Irel<strong>and</strong> <strong>and</strong> <strong>the</strong> United K<strong>in</strong>gdom (December 2003 to<br />
November 2004) <strong>and</strong> Cyprus (April 2004 to March<br />
2005). For fur<strong>the</strong>r <strong>in</strong>formation, visit:<br />
http://forum.europa.eu.<strong>in</strong>t/irc/dsis/employment/<strong>in</strong>fo/data/<br />
eu_lfs/f_lfs_concepts.htm<br />
Flash Eurobarometers are ad hoc <strong>the</strong>matical<br />
telephone <strong>in</strong>terviews conducted at <strong>the</strong> request of any<br />
service of <strong>the</strong> European Commission or o<strong>the</strong>r <strong>EU</strong><br />
<strong>in</strong>stitution. Flash Eurobarometer surveys enable <strong>the</strong><br />
Commission to obta<strong>in</strong> results relatively quickly <strong>and</strong> to<br />
focus on specific target groups, as <strong>and</strong> when required.<br />
The methodology used for <strong>the</strong> ‘<strong>entrepreneurship</strong>’ survey<br />
was that of <strong>the</strong> Flash Eurobarometer of <strong>the</strong> Directorate-<br />
General Press <strong>and</strong> Communication (Op<strong>in</strong>ion Polls,<br />
Press Reviews, Europe Direct Unit). For fur<strong>the</strong>r<br />
<strong>in</strong>formation, visit:<br />
http://ec.europa.eu/public_op<strong>in</strong>ion/archives/<br />
flash_arch_en.htm<br />
Def<strong>in</strong>ition of <strong>the</strong> activities used <strong>in</strong> this publication:<br />
In this publication, statistics are presented by economic<br />
activity accord<strong>in</strong>g to NACE Rev. 1.1. The whole nonf<strong>in</strong>ancial<br />
bus<strong>in</strong>ess economy is def<strong>in</strong>ed as NACE<br />
Sections C to I <strong>and</strong> K, <strong>the</strong> sections be<strong>in</strong>g m<strong>in</strong><strong>in</strong>g <strong>and</strong><br />
quarry<strong>in</strong>g (Section C), manufactur<strong>in</strong>g (Section D),<br />
electricity, gas <strong>and</strong> water supply (referred to <strong>in</strong> this<br />
publication as energy) (Section E), construction (Section<br />
F), distributive trades (Section G), hotels <strong>and</strong><br />
restaurants (Section H), transport <strong>and</strong> communications<br />
(Section I) <strong>and</strong> real estate, rent<strong>in</strong>g <strong>and</strong> bus<strong>in</strong>ess<br />
services (referred to <strong>in</strong> this publication as bus<strong>in</strong>ess<br />
activities) (Section K).<br />
Def<strong>in</strong>ition of variables used <strong>in</strong> <strong>the</strong> publication:<br />
Variables are def<strong>in</strong>ed accord<strong>in</strong>g to Commission<br />
Regulation No 2700/98 <strong>and</strong> <strong>in</strong>clude:<br />
Number of enterprises: <strong>the</strong> number of enterprises<br />
active dur<strong>in</strong>g at least part of <strong>the</strong> reference period.<br />
Number of persons employed: <strong>the</strong> total number of<br />
persons who work <strong>in</strong> <strong>the</strong> observation unit, as well as<br />
persons who work outside <strong>the</strong> unit who belong to it <strong>and</strong><br />
are paid by it. It <strong>in</strong>cludes work<strong>in</strong>g proprietors, unpaid<br />
family workers, part-time workers, seasonal workers etc.<br />
Value added at factor cost: production value m<strong>in</strong>us<br />
purchases of goods <strong>and</strong> services, adjusted for change<br />
<strong>in</strong> stocks, subsidies <strong>and</strong> taxes.<br />
Turnover: <strong>the</strong> totals <strong>in</strong>voiced by <strong>the</strong> observation unit<br />
dur<strong>in</strong>g <strong>the</strong> reference period; this corresponds to market<br />
sales of goods or services supplied to third parties.<br />
Apparent labour productivity: this is a simple ratio<br />
calculated as value added divided by persons<br />
employed.<br />
<strong>EU</strong>-25<br />
<strong>EU</strong>-25 aggregates from <strong>the</strong> SBS size class data-set<br />
were supplemented, where necessary <strong>and</strong> appropriate,<br />
by rounded <strong>EU</strong> estimates based on non-confidential<br />
data. Some differences between aggregates <strong>and</strong> subcomponents<br />
may exist due to round<strong>in</strong>g. In a few cases,<br />
<strong>the</strong>se were complemented by partial <strong>EU</strong> averages<br />
created us<strong>in</strong>g a coherent set of data across selected<br />
Member States. Note that no data were available for<br />
Greece.<br />
___________________________________________<br />
24/2006 — Industry, trade <strong>and</strong> services — Statistics <strong>in</strong> focus 7
Fur<strong>the</strong>r <strong>in</strong>formation:<br />
Data: Website <strong>EU</strong>ROSTAT/Home page/Industry, trade <strong>and</strong> services/Data<br />
Industry, trade <strong>and</strong> services<br />
Industry, trade <strong>and</strong> services - horizontal view<br />
Structural Bus<strong>in</strong>ess Statistics (Industry, Construction, Trade <strong>and</strong> Services)<br />
Annual enterprise statistics broken down by size classes<br />
Journalists can contact <strong>the</strong> media support<br />
service:<br />
Bech Build<strong>in</strong>g Office A4/125<br />
L - 2920 Luxembourg<br />
Tel. (352) 4301 33408<br />
Fax (352) 4301 35349<br />
E-mail: eurostat-mediasupport@ec.europa.eu<br />
A list of worldwide sales outlets is available at <strong>the</strong>:<br />
Office for Official Publications of <strong>the</strong> European Communities.<br />
2, rue Mercier<br />
L - 2985 Luxembourg<br />
URL: http://publications.europa.eu<br />
E-mail: <strong>in</strong>fo-<strong>in</strong>fo-opoce@ec.europa.eu<br />
European Statistical Data Support:<br />
<strong>Eurostat</strong> set up with <strong>the</strong> members of <strong>the</strong> ‘European<br />
statistical system’ a network of support centres, which<br />
will exist <strong>in</strong> nearly all Member States as well as <strong>in</strong> some<br />
EFTA countries.<br />
Their mission is to provide help <strong>and</strong> guidance to Internet<br />
users of European statistical data.<br />
Contact details for this support network can be found on<br />
our Internet site: http://ec.europa.eu/eurostat/


![Joint Report on Social Protection and Social Inclusion [2005]](https://img.yumpu.com/19580638/1/190x132/joint-report-on-social-protection-and-social-inclusion-2005.jpg?quality=85)