SMEs and entrepreneurship in the EU - Eurostat - Europa
SMEs and entrepreneurship in the EU - Eurostat - Europa
SMEs and entrepreneurship in the EU - Eurostat - Europa

You also want an ePaper? Increase the reach of your titles
YUMPU automatically turns print PDFs into web optimized ePapers that Google loves.
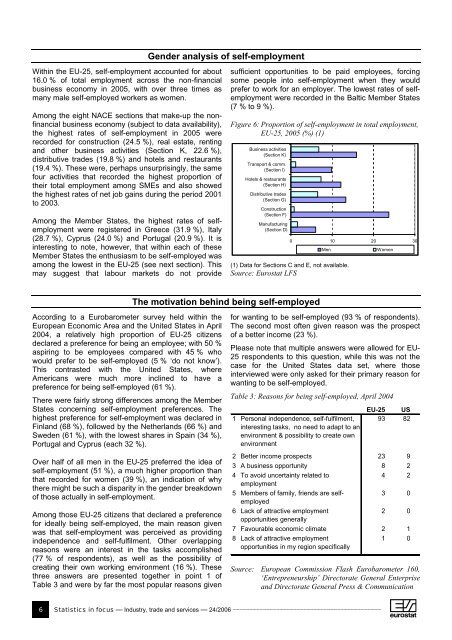
With<strong>in</strong> <strong>the</strong> <strong>EU</strong>-25, self-employment accounted for about<br />
16.0 % of total employment across <strong>the</strong> non-f<strong>in</strong>ancial<br />
bus<strong>in</strong>ess economy <strong>in</strong> 2005, with over three times as<br />
many male self-employed workers as women.<br />
Among <strong>the</strong> eight NACE sections that make-up <strong>the</strong> nonf<strong>in</strong>ancial<br />
bus<strong>in</strong>ess economy (subject to data availability),<br />
<strong>the</strong> highest rates of self-employment <strong>in</strong> 2005 were<br />
recorded for construction (24.5 %), real estate, rent<strong>in</strong>g<br />
<strong>and</strong> o<strong>the</strong>r bus<strong>in</strong>ess activities (Section K, 22.6 %),<br />
distributive trades (19.8 %) <strong>and</strong> hotels <strong>and</strong> restaurants<br />
(19.4 %). These were, perhaps unsurpris<strong>in</strong>gly, <strong>the</strong> same<br />
four activities that recorded <strong>the</strong> highest proportion of<br />
<strong>the</strong>ir total employment among <strong>SMEs</strong> <strong>and</strong> also showed<br />
<strong>the</strong> highest rates of net job ga<strong>in</strong>s dur<strong>in</strong>g <strong>the</strong> period 2001<br />
to 2003.<br />
Among <strong>the</strong> Member States, <strong>the</strong> highest rates of selfemployment<br />
were registered <strong>in</strong> Greece (31.9 %), Italy<br />
(28.7 %), Cyprus (24.0 %) <strong>and</strong> Portugal (20.9 %). It is<br />
<strong>in</strong>terest<strong>in</strong>g to note, however, that with<strong>in</strong> each of <strong>the</strong>se<br />
Member States <strong>the</strong> enthusiasm to be self-employed was<br />
among <strong>the</strong> lowest <strong>in</strong> <strong>the</strong> <strong>EU</strong>-25 (see next section). This<br />
may suggest that labour markets do not provide<br />
Accord<strong>in</strong>g to a Eurobarometer survey held with<strong>in</strong> <strong>the</strong><br />
European Economic Area <strong>and</strong> <strong>the</strong> United States <strong>in</strong> April<br />
2004, a relatively high proportion of <strong>EU</strong>-25 citizens<br />
declared a preference for be<strong>in</strong>g an employee; with 50 %<br />
aspir<strong>in</strong>g to be employees compared with 45 % who<br />
would prefer to be self-employed (5 % ‘do not know’).<br />
This contrasted with <strong>the</strong> United States, where<br />
Americans were much more <strong>in</strong>cl<strong>in</strong>ed to have a<br />
preference for be<strong>in</strong>g self-employed (61 %).<br />
There were fairly strong differences among <strong>the</strong> Member<br />
States concern<strong>in</strong>g self-employment preferences. The<br />
highest preference for self-employment was declared <strong>in</strong><br />
F<strong>in</strong>l<strong>and</strong> (68 %), followed by <strong>the</strong> Ne<strong>the</strong>rl<strong>and</strong>s (66 %) <strong>and</strong><br />
Sweden (61 %), with <strong>the</strong> lowest shares <strong>in</strong> Spa<strong>in</strong> (34 %),<br />
Portugal <strong>and</strong> Cyprus (each 32 %).<br />
Over half of all men <strong>in</strong> <strong>the</strong> <strong>EU</strong>-25 preferred <strong>the</strong> idea of<br />
self-employment (51 %), a much higher proportion than<br />
that recorded for women (39 %), an <strong>in</strong>dication of why<br />
<strong>the</strong>re might be such a disparity <strong>in</strong> <strong>the</strong> gender breakdown<br />
of those actually <strong>in</strong> self-employment.<br />
Among those <strong>EU</strong>-25 citizens that declared a preference<br />
for ideally be<strong>in</strong>g self-employed, <strong>the</strong> ma<strong>in</strong> reason given<br />
was that self-employment was perceived as provid<strong>in</strong>g<br />
<strong>in</strong>dependence <strong>and</strong> self-fulfilment. O<strong>the</strong>r overlapp<strong>in</strong>g<br />
reasons were an <strong>in</strong>terest <strong>in</strong> <strong>the</strong> tasks accomplished<br />
(77 % of respondents), as well as <strong>the</strong> possibility of<br />
creat<strong>in</strong>g <strong>the</strong>ir own work<strong>in</strong>g environment (16 %). These<br />
three answers are presented toge<strong>the</strong>r <strong>in</strong> po<strong>in</strong>t 1 of<br />
Table 3 <strong>and</strong> were by far <strong>the</strong> most popular reasons given<br />
Gender analysis of self-employment<br />
sufficient opportunities to be paid employees, forc<strong>in</strong>g<br />
some people <strong>in</strong>to self-employment when <strong>the</strong>y would<br />
prefer to work for an employer. The lowest rates of selfemployment<br />
were recorded <strong>in</strong> <strong>the</strong> Baltic Member States<br />
(7 % to 9 %).<br />
Figure 6: Proportion of self-employment <strong>in</strong> total employment,<br />
<strong>EU</strong>-25, 2005 (%) (1)<br />
Bus<strong>in</strong>ess activities<br />
(Section K)<br />
Transport & comm.<br />
(Section I)<br />
Hotels & restaurants<br />
(Section H)<br />
Distributive trades<br />
(Section G)<br />
Construction<br />
(Section F)<br />
Manufactur<strong>in</strong>g<br />
(Section D)<br />
0 10 20 30<br />
Men Women<br />
(1) Data for Sections C <strong>and</strong> E, not available.<br />
Source: <strong>Eurostat</strong> LFS<br />
The motivation beh<strong>in</strong>d be<strong>in</strong>g self-employed<br />
for want<strong>in</strong>g to be self-employed (93 % of respondents).<br />
The second most often given reason was <strong>the</strong> prospect<br />
of a better <strong>in</strong>come (23 %).<br />
Please note that multiple answers were allowed for <strong>EU</strong>-<br />
25 respondents to this question, while this was not <strong>the</strong><br />
case for <strong>the</strong> United States data set, where those<br />
<strong>in</strong>terviewed were only asked for <strong>the</strong>ir primary reason for<br />
want<strong>in</strong>g to be self-employed.<br />
Table 3: Reasons for be<strong>in</strong>g self-employed, April 2004<br />
1 Personal <strong>in</strong>dependence, self-fulfilment,<br />
<strong>in</strong>terest<strong>in</strong>g tasks, no need to adapt to an<br />
environment & possibility to create own<br />
environment<br />
6 Statistics <strong>in</strong> focus — Industry, trade <strong>and</strong> services — 24/2006 ____________________________________________<br />
<strong>EU</strong>-25 US<br />
93 82<br />
2 Better <strong>in</strong>come prospects 23 9<br />
3 A bus<strong>in</strong>ess opportunity 8 2<br />
4 To avoid uncerta<strong>in</strong>ty related to<br />
employment<br />
4 2<br />
5 Members of family, friends are selfemployed<br />
3 0<br />
6 Lack of attractive employment<br />
opportunities generally<br />
2 0<br />
7 Favourable economic climate 2 1<br />
8 Lack of attractive employment<br />
opportunities <strong>in</strong> my region specifically<br />
1 0<br />
Source: European Commission Flash Eurobarometer 160,<br />
‘Entrepreneurship’ Directorate General Enterprise<br />
<strong>and</strong> Directorate General Press & Communication


![Joint Report on Social Protection and Social Inclusion [2005]](https://img.yumpu.com/19580638/1/190x132/joint-report-on-social-protection-and-social-inclusion-2005.jpg?quality=85)