SMEs and entrepreneurship in the EU - Eurostat - Europa
SMEs and entrepreneurship in the EU - Eurostat - Europa
SMEs and entrepreneurship in the EU - Eurostat - Europa
Create successful ePaper yourself
Turn your PDF publications into a flip-book with our unique Google optimized e-Paper software.
Data on <strong>the</strong> changes <strong>in</strong> <strong>the</strong> numbers of persons<br />
employed can only be analysed over a relatively short<br />
period of time due to <strong>the</strong> availability of <strong>EU</strong>-25 totals. As<br />
such, <strong>the</strong> follow<strong>in</strong>g analysis is based on a comparison<br />
of <strong>the</strong> number of persons employed between reference<br />
years 2001 <strong>and</strong> 2003. The changes <strong>in</strong> employment (as<br />
shown <strong>in</strong> Table 2) are detailed by size class <strong>and</strong> by<br />
sector (NACE section) with<strong>in</strong> <strong>the</strong> non-f<strong>in</strong>ancial bus<strong>in</strong>ess<br />
economy, <strong>and</strong> are represented <strong>in</strong> terms of overall<br />
percentage changes <strong>in</strong> employment levels between<br />
<strong>the</strong>se two years. It should be noted that <strong>the</strong> percentage<br />
ga<strong>in</strong>s/losses are <strong>the</strong> net result of ga<strong>in</strong>s/losses through<br />
movements between activities (enterprises chang<strong>in</strong>g<br />
activity), between size classes (as enterprises grow or<br />
shr<strong>in</strong>k), <strong>and</strong> births <strong>and</strong> deaths of enterprises.<br />
The notion that <strong>SMEs</strong> are often a driver of<br />
employment growth is supported by data shown <strong>in</strong><br />
Table 2 (at least for <strong>the</strong> period studied). Note that<br />
where <strong>the</strong>re have been net employment ga<strong>in</strong>s, <strong>the</strong><br />
growth <strong>in</strong> employment has been higher among <strong>SMEs</strong><br />
than among large enterprises. For hotels <strong>and</strong><br />
restaurants, transport <strong>and</strong> communications,<br />
distributive trades, <strong>and</strong> bus<strong>in</strong>ess services, <strong>the</strong> pace<br />
of employment growth <strong>in</strong> <strong>the</strong> SME size classes<br />
consistently outstripped that of large enterprises. In<br />
<strong>the</strong> case of construction activities, net <strong>in</strong>creases<br />
among <strong>the</strong> SME size classes offset <strong>the</strong> net job losses<br />
observed among <strong>the</strong> large enterprise size class.<br />
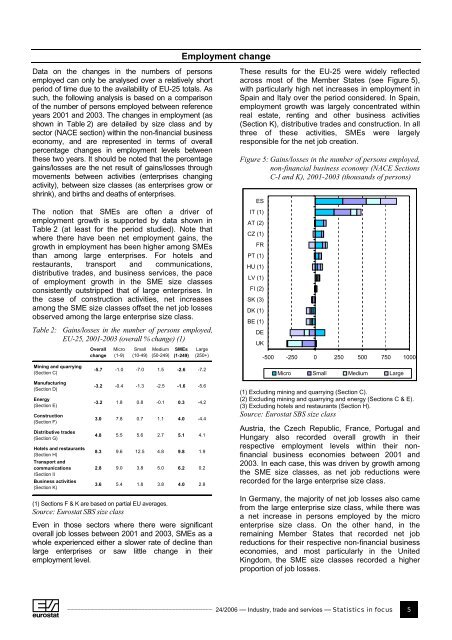
Table 2: Ga<strong>in</strong>s/losses <strong>in</strong> <strong>the</strong> number of persons employed,<br />
<strong>EU</strong>-25, 2001-2003 (overall % change) (1)<br />
M<strong>in</strong><strong>in</strong>g <strong>and</strong> quarry<strong>in</strong>g<br />
(Section C)<br />
Manufactur<strong>in</strong>g<br />
(Section D)<br />
Energy<br />
(Section E)<br />
Construction<br />
(Section F)<br />
Distributive trades<br />
(Section G)<br />
Hotels <strong>and</strong> restaurants<br />
(Section H)<br />
Transport <strong>and</strong><br />
communications<br />
(Section I)<br />
Bus<strong>in</strong>ess activities<br />
(Section K)<br />
Overall<br />
change<br />
Micro<br />
(1-9)<br />
Small<br />
(10-49)<br />
Medium<br />
(50-249)<br />
<strong>SMEs</strong><br />
(1-249)<br />
Employment change<br />
Large<br />
(250+)<br />
-5.7 -1.0 -7.0 1.5 -2.6 -7.2<br />
-3.2 -0.4 -1.3 -2.5 -1.6 -5.6<br />
-3.2 1.8 0.8 -0.1 0.3 -4.2<br />
3.0 7.8 0.7 1.1 4.0 -4.4<br />
4.8 5.5 5.6 2.7 5.1 4.1<br />
8.3 9.6 12.5 4.8 9.8 1.9<br />
2.8 9.0 3.8 5.0 6.2 0.2<br />
3.6 5.4 1.8 3.8 4.0 2.8<br />
(1) Sections F & K are based on partial <strong>EU</strong> averages.<br />
Source: <strong>Eurostat</strong> SBS size class<br />
Even <strong>in</strong> those sectors where <strong>the</strong>re were significant<br />
overall job losses between 2001 <strong>and</strong> 2003, <strong>SMEs</strong> as a<br />
whole experienced ei<strong>the</strong>r a slower rate of decl<strong>in</strong>e than<br />
large enterprises or saw little change <strong>in</strong> <strong>the</strong>ir<br />
employment level.<br />
These results for <strong>the</strong> <strong>EU</strong>-25 were widely reflected<br />
across most of <strong>the</strong> Member States (see Figure 5),<br />
with particularly high net <strong>in</strong>creases <strong>in</strong> employment <strong>in</strong><br />
Spa<strong>in</strong> <strong>and</strong> Italy over <strong>the</strong> period considered. In Spa<strong>in</strong>,<br />
employment growth was largely concentrated with<strong>in</strong><br />
real estate, rent<strong>in</strong>g <strong>and</strong> o<strong>the</strong>r bus<strong>in</strong>ess activities<br />
(Section K), distributive trades <strong>and</strong> construction. In all<br />
three of <strong>the</strong>se activities, <strong>SMEs</strong> were largely<br />
responsible for <strong>the</strong> net job creation.<br />
Figure 5: Ga<strong>in</strong>s/losses <strong>in</strong> <strong>the</strong> number of persons employed,<br />
non-f<strong>in</strong>ancial bus<strong>in</strong>ess economy (NACE Sections<br />
C-I <strong>and</strong> K), 2001-2003 (thous<strong>and</strong>s of persons)<br />
-500 -250 0 250 500 750 1000<br />
___________________________________________<br />
24/2006 — Industry, trade <strong>and</strong> services — Statistics <strong>in</strong> focus 5<br />
<br />
ES<br />
IT (1)<br />
AT (2)<br />
CZ (1)<br />
FR<br />
PT (1)<br />
HU (1)<br />
LV (1)<br />
FI (2)<br />
SK (3)<br />
DK (1)<br />
BE (1)<br />
DE<br />
UK<br />
Micro Small Medium Large<br />
(1) Exclud<strong>in</strong>g m<strong>in</strong><strong>in</strong>g <strong>and</strong> quarry<strong>in</strong>g (Section C).<br />
(2) Exclud<strong>in</strong>g m<strong>in</strong><strong>in</strong>g <strong>and</strong> quarry<strong>in</strong>g <strong>and</strong> energy (Sections C & E).<br />
(3) Exclud<strong>in</strong>g hotels <strong>and</strong> restaurants (Section H).<br />
Source: <strong>Eurostat</strong> SBS size class<br />
Austria, <strong>the</strong> Czech Republic, France, Portugal <strong>and</strong><br />
Hungary also recorded overall growth <strong>in</strong> <strong>the</strong>ir<br />
respective employment levels with<strong>in</strong> <strong>the</strong>ir nonf<strong>in</strong>ancial<br />
bus<strong>in</strong>ess economies between 2001 <strong>and</strong><br />
2003. In each case, this was driven by growth among<br />
<strong>the</strong> SME size classes, as net job reductions were<br />
recorded for <strong>the</strong> large enterprise size class.<br />
In Germany, <strong>the</strong> majority of net job losses also came<br />
from <strong>the</strong> large enterprise size class, while <strong>the</strong>re was<br />
a net <strong>in</strong>crease <strong>in</strong> persons employed by <strong>the</strong> micro<br />
enterprise size class. On <strong>the</strong> o<strong>the</strong>r h<strong>and</strong>, <strong>in</strong> <strong>the</strong><br />
rema<strong>in</strong><strong>in</strong>g Member States that recorded net job<br />
reductions for <strong>the</strong>ir respective non-f<strong>in</strong>ancial bus<strong>in</strong>ess<br />
economies, <strong>and</strong> most particularly <strong>in</strong> <strong>the</strong> United<br />
K<strong>in</strong>gdom, <strong>the</strong> SME size classes recorded a higher<br />
proportion of job losses.


![Joint Report on Social Protection and Social Inclusion [2005]](https://img.yumpu.com/19580638/1/190x132/joint-report-on-social-protection-and-social-inclusion-2005.jpg?quality=85)
