SMEs and entrepreneurship in the EU - Eurostat - Europa
SMEs and entrepreneurship in the EU - Eurostat - Europa
SMEs and entrepreneurship in the EU - Eurostat - Europa

You also want an ePaper? Increase the reach of your titles
YUMPU automatically turns print PDFs into web optimized ePapers that Google loves.
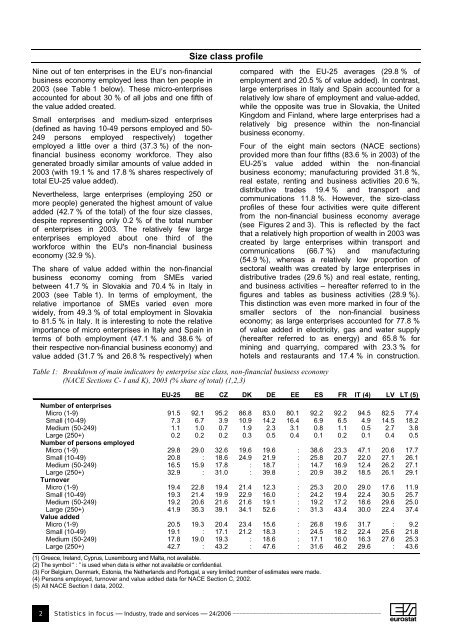
N<strong>in</strong>e out of ten enterprises <strong>in</strong> <strong>the</strong> <strong>EU</strong>’s non-f<strong>in</strong>ancial<br />
bus<strong>in</strong>ess economy employed less than ten people <strong>in</strong><br />
2003 (see Table 1 below). These micro-enterprises<br />
accounted for about 30 % of all jobs <strong>and</strong> one fifth of<br />
<strong>the</strong> value added created.<br />
Small enterprises <strong>and</strong> medium-sized enterprises<br />
(def<strong>in</strong>ed as hav<strong>in</strong>g 10-49 persons employed <strong>and</strong> 50-<br />
249 persons employed respectively) toge<strong>the</strong>r<br />
employed a little over a third (37.3 %) of <strong>the</strong> nonf<strong>in</strong>ancial<br />
bus<strong>in</strong>ess economy workforce. They also<br />
generated broadly similar amounts of value added <strong>in</strong><br />
2003 (with 19.1 % <strong>and</strong> 17.8 % shares respectively of<br />
total <strong>EU</strong>-25 value added).<br />
Never<strong>the</strong>less, large enterprises (employ<strong>in</strong>g 250 or<br />
more people) generated <strong>the</strong> highest amount of value<br />
added (42.7 % of <strong>the</strong> total) of <strong>the</strong> four size classes,<br />
despite represent<strong>in</strong>g only 0.2 % of <strong>the</strong> total number<br />
of enterprises <strong>in</strong> 2003. The relatively few large<br />
enterprises employed about one third of <strong>the</strong><br />
workforce with<strong>in</strong> <strong>the</strong> <strong>EU</strong>'s non-f<strong>in</strong>ancial bus<strong>in</strong>ess<br />
economy (32.9 %).<br />
The share of value added with<strong>in</strong> <strong>the</strong> non-f<strong>in</strong>ancial<br />
bus<strong>in</strong>ess economy com<strong>in</strong>g from <strong>SMEs</strong> varied<br />
between 41.7 % <strong>in</strong> Slovakia <strong>and</strong> 70.4 % <strong>in</strong> Italy <strong>in</strong><br />
2003 (see Table 1). In terms of employment, <strong>the</strong><br />
relative importance of <strong>SMEs</strong> varied even more<br />
widely, from 49.3 % of total employment <strong>in</strong> Slovakia<br />
to 81.5 % <strong>in</strong> Italy. It is <strong>in</strong>terest<strong>in</strong>g to note <strong>the</strong> relative<br />
importance of micro enterprises <strong>in</strong> Italy <strong>and</strong> Spa<strong>in</strong> <strong>in</strong><br />
terms of both employment (47.1 % <strong>and</strong> 38.6 % of<br />
<strong>the</strong>ir respective non-f<strong>in</strong>ancial bus<strong>in</strong>ess economy) <strong>and</strong><br />
value added (31.7 % <strong>and</strong> 26.8 % respectively) when<br />
Size class profile<br />
Table 1: Breakdown of ma<strong>in</strong> <strong>in</strong>dicators by enterprise size class, non-f<strong>in</strong>ancial bus<strong>in</strong>ess economy<br />
(NACE Sections C- I <strong>and</strong> K), 2003 (% share of total) (1,2,3)<br />
compared with <strong>the</strong> <strong>EU</strong>-25 averages (29.8 % of<br />
employment <strong>and</strong> 20.5 % of value added). In contrast,<br />
large enterprises <strong>in</strong> Italy <strong>and</strong> Spa<strong>in</strong> accounted for a<br />
relatively low share of employment <strong>and</strong> value-added,<br />
while <strong>the</strong> opposite was true <strong>in</strong> Slovakia, <strong>the</strong> United<br />
K<strong>in</strong>gdom <strong>and</strong> F<strong>in</strong>l<strong>and</strong>, where large enterprises had a<br />
relatively big presence with<strong>in</strong> <strong>the</strong> non-f<strong>in</strong>ancial<br />
bus<strong>in</strong>ess economy.<br />
Four of <strong>the</strong> eight ma<strong>in</strong> sectors (NACE sections)<br />
provided more than four fifths (83.6 % <strong>in</strong> 2003) of <strong>the</strong><br />
<strong>EU</strong>-25’s value added with<strong>in</strong> <strong>the</strong> non-f<strong>in</strong>ancial<br />
bus<strong>in</strong>ess economy; manufactur<strong>in</strong>g provided 31.8 %,<br />
real estate, rent<strong>in</strong>g <strong>and</strong> bus<strong>in</strong>ess activities 20.6 %,<br />
distributive trades 19.4 % <strong>and</strong> transport <strong>and</strong><br />
communications 11.8 %. However, <strong>the</strong> size-class<br />
profiles of <strong>the</strong>se four activities were quite different<br />
from <strong>the</strong> non-f<strong>in</strong>ancial bus<strong>in</strong>ess economy average<br />
(see Figures 2 <strong>and</strong> 3). This is reflected by <strong>the</strong> fact<br />
that a relatively high proportion of wealth <strong>in</strong> 2003 was<br />
created by large enterprises with<strong>in</strong> transport <strong>and</strong><br />
communications (66.7 %) <strong>and</strong> manufactur<strong>in</strong>g<br />
(54.9 %), whereas a relatively low proportion of<br />
sectoral wealth was created by large enterprises <strong>in</strong><br />
distributive trades (29.6 %) <strong>and</strong> real estate, rent<strong>in</strong>g,<br />
<strong>and</strong> bus<strong>in</strong>ess activities – hereafter referred to <strong>in</strong> <strong>the</strong><br />
figures <strong>and</strong> tables as bus<strong>in</strong>ess activities (28.9 %).<br />
This dist<strong>in</strong>ction was even more marked <strong>in</strong> four of <strong>the</strong><br />
smaller sectors of <strong>the</strong> non-f<strong>in</strong>ancial bus<strong>in</strong>ess<br />
economy; as large enterprises accounted for 77.8 %<br />
of value added <strong>in</strong> electricity, gas <strong>and</strong> water supply<br />
(hereafter referred to as energy) <strong>and</strong> 65.8 % for<br />
m<strong>in</strong><strong>in</strong>g <strong>and</strong> quarry<strong>in</strong>g, compared with 23.3 % for<br />
hotels <strong>and</strong> restaurants <strong>and</strong> 17.4 % <strong>in</strong> construction.<br />
<strong>EU</strong>-25 BE CZ DK DE EE ES FR IT (4) LV LT (5)<br />
Number of enterprises<br />
Micro (1-9) 91.5 92.1 95.2 86.8 83.0 80.1 92.2 92.2 94.5 82.5 77.4<br />
Small (10-49) 7.3 6.7 3.9 10.9 14.2 16.4 6.9 6.5 4.9 14.5 18.2<br />
Medium (50-249) 1.1 1.0 0.7 1.9 2.3 3.1 0.8 1.1 0.5 2.7 3.8<br />
Large (250+)<br />
Number of persons employed<br />
0.2 0.2 0.2 0.3 0.5 0.4 0.1 0.2 0.1 0.4 0.5<br />
Micro (1-9) 29.8 29.0 32.6 19.6 19.6 : 38.6 23.3 47.1 20.6 17.7<br />
Small (10-49) 20.8 : 18.6 24.9 21.9 : 25.8 20.7 22.0 27.1 26.1<br />
Medium (50-249) 16.5 15.9 17.8 : 18.7 : 14.7 16.9 12.4 26.2 27.1<br />
Large (250+)<br />
Turnover<br />
32.9 : 31.0 : 39.8 : 20.9 39.2 18.5 26.1 29.1<br />
Micro (1-9) 19.4 22.8 19.4 21.4 12.3 : 25.3 20.0 29.0 17.6 11.9<br />
Small (10-49) 19.3 21.4 19.9 22.9 16.0 : 24.2 19.4 22.4 30.5 25.7<br />
Medium (50-249) 19.2 20.6 21.6 21.6 19.1 : 19.2 17.2 18.6 29.6 25.0<br />
Large (250+)<br />
Value added<br />
41.9 35.3 39.1 34.1 52.6 : 31.3 43.4 30.0 22.4 37.4<br />
Micro (1-9) 20.5 19.3 20.4 23.4 15.6 : 26.8 19.6 31.7 : 9.2<br />
Small (10-49) 19.1 : 17.1 21.2 18.3 : 24.5 18.2 22.4 25.6 21.8<br />
Medium (50-249) 17.8 19.0 19.3 : 18.6 : 17.1 16.0 16.3 27.6 25.3<br />
Large (250+) 42.7 : 43.2 : 47.6 : 31.6 46.2 29.6 : 43.6<br />
(1) Greece, Irel<strong>and</strong>, Cyprus, Luxembourg <strong>and</strong> Malta, not available.<br />
(2) The symbol “ : ” is used when data is ei<strong>the</strong>r not available or confidential.<br />
(3) For Belgium, Denmark, Estonia, <strong>the</strong> Ne<strong>the</strong>rl<strong>and</strong>s <strong>and</strong> Portugal, a very limited number of estimates were made.<br />
(4) Persons employed, turnover <strong>and</strong> value added data for NACE Section C, 2002.<br />
(5) All NACE Section I data, 2002.<br />
2 Statistics <strong>in</strong> focus — Industry, trade <strong>and</strong> services — 24/2006 ____________________________________________


![Joint Report on Social Protection and Social Inclusion [2005]](https://img.yumpu.com/19580638/1/190x132/joint-report-on-social-protection-and-social-inclusion-2005.jpg?quality=85)