- Page 1 and 2: REGIONAL ALL-HAZARD MITIGATION PLAN
- Page 3 and 4: Jefferson County Hazard Mitigation
- Page 5 and 6: Jefferson County Hazard Mitigation
- Page 7 and 8: Jefferson County Hazard Mitigation
- Page 9 and 10: Jefferson County Hazard Mitigation
- Page 11 and 12: Jefferson County Hazard Mitigation
- Page 13 and 14: Jefferson County Hazard Mitigation
- Page 15 and 16: 2 Jefferson County - Section 1 resi
- Page 17 and 18: 4 FIGURE FIGURE J3 J3 GEOLOGIC GEOL
- Page 19 and 20: 6 FIGURE FIGURE J4 J4 SURFICIAL SUR
- Page 21 and 22: 8 Form Form of of Government Govern
- Page 23: 10 KHITs 96 FM KNLC-24 KLOU 103.3 F
- Page 27 and 28: 14 TABLE TABLE J5 J5 JEFFERSON JEFF
- Page 29 and 30: 16 Jefferson County - Section 1 Lan
- Page 31 and 32: 18 Jefferson County - Section 1 The
- Page 33 and 34: 20 Jefferson County - Section 1 mus
- Page 35 and 36: 22 Jefferson County - Section 1 Air
- Page 37 and 38: 24 Table Table J9A J9A JEFFERSON JE
- Page 39 and 40: 26 Jefferson County - Section 1 FAC
- Page 41 and 42: 28 Jefferson County - Section 1 FIG
- Page 43 and 44: 30 Jefferson County - Section 1 Tab
- Page 45 and 46: 32 Recreation Recreation Facilities
- Page 47 and 48: 34 Jefferson County - Section 1 Hig
- Page 49 and 50: 36 Transportation Transportation- T
- Page 51 and 52: 38 Motor Motor Freight Freight Tran
- Page 53 and 54: 40 1 = Creve Coeur 8 = St. Charles
- Page 55 and 56: 42 TABL TABLE TABL E J16 TELECOMMUN
- Page 57 and 58: 44 TABLE TABLE J17 J17 JEFFERSON JE
- Page 59 and 60: 46 TABLE TABLE J17 J17 JEFFERSON JE
- Page 61 and 62: 48 TABLE TABLE J17 J17 JEFFERSON JE
- Page 63 and 64: 50 Laclede Gas Company 720 Olive St
- Page 65 and 66: 52 Jefferson County - Section 1 In
- Page 67 and 68: 54 Jefferson County - Section 1 TAB
- Page 69 and 70: 56 Average Average Unit Unit Cost C
- Page 71 and 72: 58 TABLE TABLE TABLE J26 J26 Cities
- Page 73 and 74: 60 TABLE TABLE TABLE J26 J26 Cities
- Page 75 and 76:
62 TABLE TABLE TABLE J26 J26 Cities
- Page 77 and 78:
64 TABLE TABLE TABLE J26 J26 Cities
- Page 79 and 80:
2 Jefferson County - Section 2 Thes
- Page 81 and 82:
4 Jefferson County - Section 2 A fl
- Page 83 and 84:
6 Jefferson County - Section 2 disr
- Page 85 and 86:
8 Jefferson County - Section 2 Area
- Page 87 and 88:
10 FIGURE FIGURE J17 J17 COMMERCIAL
- Page 89 and 90:
12 FIGURE FIGURE J18 J18 PUBLIC PUB
- Page 91 and 92:
14 FIGURE FIGURE J19 J19 RESIDENTIA
- Page 93 and 94:
16 FIGURE FIGURE J20 J20 TRANSPORTA
- Page 95 and 96:
18 FIGURE FIGURE J21A J21A UTILITIE
- Page 97 and 98:
20 FIGURE FIGURE J21B J21B EMERGENC
- Page 99 and 100:
22 Jefferson County - Section 2 TAB
- Page 101 and 102:
24 Jefferson County - Section 2 tim
- Page 103 and 104:
26 Jefferson County - Section 2 Dur
- Page 105 and 106:
28 Jefferson County - Section 2 TAB
- Page 107 and 108:
30 Jefferson County - Section 2 TAB
- Page 109 and 110:
32 Jefferson County - Section 2 TAB
- Page 111 and 112:
34 Jefferson County - Section 2 TAB
- Page 113 and 114:
36 Seasonal Seasonal Pattern Patter
- Page 115 and 116:
38 Jefferson County - Section 2 bas
- Page 117 and 118:
40 Public Public Law Law 84 84-99 8
- Page 119 and 120:
42 TABLE TABLE J29A J29A J29A LIST
- Page 121 and 122:
44 FIGURE FIGURE J22F J22F Confluen
- Page 123 and 124:
46 FIGURE FIGURE J22H J22H St. St.
- Page 125 and 126:
48 maps across the country. Jeffers
- Page 127 and 128:
50 Recent Recent Levee Levee Projec
- Page 129 and 130:
52 Jefferson County - Section 2 tha
- Page 131 and 132:
54 Earthquake Earthquake Earthquake
- Page 133 and 134:
56 FIGURE FIGURE J25 J25 LANDSLIDE
- Page 135 and 136:
58 Likely Likely Locations Location
- Page 137 and 138:
60 Jefferson County - Section 2 pla
- Page 139 and 140:
62 Jefferson County - Section 2 TAB
- Page 141 and 142:
64 Frequency Frequency of of Occurr
- Page 143 and 144:
66 Jefferson County - Section 2 lin
- Page 145 and 146:
68 FIGURE FIGURE J29 J29 PEAK PEAK
- Page 147 and 148:
70 Seasonal Seasonal Pattern Patter
- Page 149 and 150:
72 Jefferson County - Section 2 roc
- Page 151 and 152:
74 VI Highly Likely VII Highly Like
- Page 153 and 154:
76 Financial Limited Comments none
- Page 155 and 156:
78 Jefferson County - Section 2 Whe
- Page 157 and 158:
80 Jefferson County - Section 2 abo
- Page 159 and 160:
82 Hazard Hazard Hazard Event Event
- Page 161 and 162:
84 Jefferson County - Section 2 26
- Page 163 and 164:
86 TABLE TABLE J35 J35 SEVERE SEVER
- Page 165 and 166:
88 TABLE TABLE J35 J35 SEVERE SEVER
- Page 167 and 168:
90 January January Jefferson County
- Page 169 and 170:
92 Seasonal Seasonal Pattern Patter
- Page 171 and 172:
94 Jefferson County - Section 2 lik
- Page 173 and 174:
96 Jefferson County - Section 2 los
- Page 175 and 176:
98 Jefferson County - Section 2 TAB
- Page 177 and 178:
100 Locations/Areas Locations/Areas
- Page 179 and 180:
102 Without Without Mitigation Miti
- Page 181 and 182:
104 Jefferson County - Section 2 of
- Page 183 and 184:
106 Characteristics Characteristics
- Page 185 and 186:
108 Jefferson County - Section 2 re
- Page 187 and 188:
110 Intensity Intensity or or Stren
- Page 189 and 190:
112 Jefferson County - Section 2 ca
- Page 191 and 192:
114 Jefferson County - Section 2 pr
- Page 193 and 194:
116 Jefferson County - Section 2 an
- Page 195 and 196:
118 Jefferson County - Section 2 Th
- Page 197 and 198:
120 Jefferson County - Section 2 fr
- Page 199 and 200:
122 Jefferson County - Section 2 TA
- Page 201 and 202:
124 Jefferson County - Section 2 an
- Page 203 and 204:
126 Jefferson County - Section 2 Re
- Page 205 and 206:
128 Without Without Mitigation Miti
- Page 207 and 208:
130 Jefferson County - Section 2 th
- Page 209 and 210:
132 Jefferson County - Section 2 re
- Page 211 and 212:
134 TABLE TABLE J48 J48 JEFFERSON J
- Page 213 and 214:
136 Type Type Type of of Damage Dam
- Page 215 and 216:
138 Locations/Areas Locations/Areas
- Page 217 and 218:
140 Low Likely Statement Statement
- Page 219 and 220:
142 Jefferson County - Section 2 Th
- Page 221 and 222:
144 Frequency Frequency Of Of Occur
- Page 223 and 224:
146 With With Mitigation Mitigation
- Page 225 and 226:
148 Jefferson County - Section 2 Vu
- Page 227 and 228:
150 Hazard: Hazard: Dam Dam Failur
- Page 229 and 230:
152 HAZARD HAZARD ANALYSIS ANALYSIS
- Page 231 and 232:
154 HAZARD HAZARD ANALYSIS ANALYSIS
- Page 233 and 234:
156 HAZARD HAZARD ANALYSIS ANALYSIS
- Page 235 and 236:
158 HAZARD HAZARD ANALYSIS ANALYSIS
- Page 237 and 238:
160 Jefferson County - Section 2 S
- Page 239 and 240:
162 HAZARD HAZARD ANALYSIS ANALYSIS
- Page 241 and 242:
164 EA EARTHQUAKES EA RTHQUAKES Jef
- Page 243 and 244:
166 FLOOD FLOOD HAZARD HAZARD PROFI
- Page 245 and 246:
168 JEFFERSON JEFFERSON COUNTY COUN
- Page 247 and 248:
170 JEFFERSON JEFFERSON COUNTY COUN
- Page 249 and 250:
172 HAZARD: HAZARD: Wildland fires
- Page 251 and 252:
174 HAZARD: HAZARD: Heat Wave JEFFE
- Page 253 and 254:
176 HAZARD: HAZARD: Tornado JEFFERS
- Page 255 and 256:
178 HAZARD: HAZARD: Winter Winter W
- Page 257 and 258:
180 RISK RISK ASSESSMENT ASSESSMENT
- Page 259 and 260:
182 RISK RISK ASSESSMENT ASSESSMENT
- Page 261 and 262:
184 RISK RISK INDEX INDEX INDEX WOR
- Page 263 and 264:
186 FLOOD: FLOOD: FLOOD: JEFFERSON
- Page 265 and 266:
188 Jefferson County - Section 2 DR
- Page 267 and 268:
190 EARTHQUAKE: EARTHQUAKE: JEFFERS
- Page 269 and 270:
192 WILDFIRE: WILDFIRE: JEFFERSON J
- Page 271 and 272:
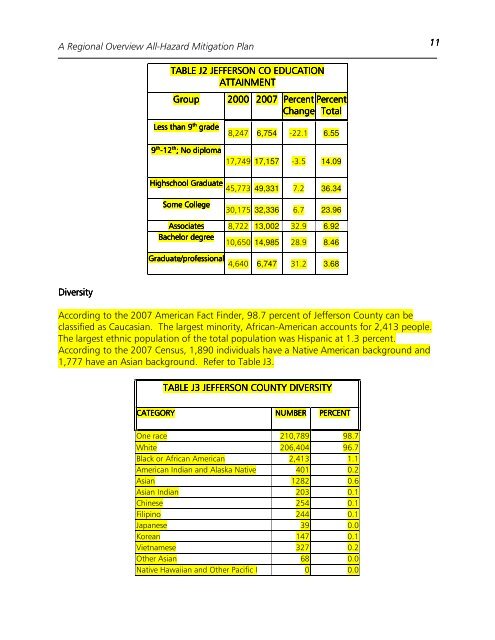
A Regional Overview All-Hazard Miti
- Page 273 and 274:
A Regional Overview All-Hazard Miti
- Page 275 and 276:
A Regional Overview All-Hazard Miti
- Page 277 and 278:
A Regional Overview All-Hazard Miti
- Page 279 and 280:
A Regional Overview All-Hazard Miti
- Page 281 and 282:
A Regional Overview All-Hazard Miti
- Page 283 and 284:
A Regional Overview All-Hazard Miti
- Page 285 and 286:
A Regional Overview All-Hazard Miti
- Page 287 and 288:
A Regional Overview All-Hazard Miti
- Page 289 and 290:
A Regional Overview All-Hazard Miti
- Page 291 and 292:
A Regional Overview All-Hazard Miti
- Page 293 and 294:
A Regional Overview All-Hazard Miti
- Page 295 and 296:
A Regional Overview All-Hazard Miti
- Page 297 and 298:
A Regional Overview All-Hazard Miti
- Page 299 and 300:
A Regional Overview All-Hazard Miti
- Page 301 and 302:
A Regional Overview All-Hazard Miti
- Page 303 and 304:
A Regional Overview All-Hazard Miti
- Page 305 and 306:
A Regional Overview All-Hazard Miti
- Page 307 and 308:
A Regional Overview All-Hazard Miti
- Page 309 and 310:
A Regional Overview All-Hazard Miti
- Page 311 and 312:
A Regional Overview All-Hazard Miti
- Page 313:
A Regional Overview All-Hazard Miti