Jefferson County - East-West Gateway Coordinating Council
Jefferson County - East-West Gateway Coordinating Council
Jefferson County - East-West Gateway Coordinating Council

Create successful ePaper yourself
Turn your PDF publications into a flip-book with our unique Google optimized e-Paper software.
REGIONAL ALL-HAZARD MITIGATION PLAN<br />
UPDATE<br />
JEFFERSON COUNTY<br />
And<br />
PARTICIPATING COMMUNITIES AND SCHOOL DISTRICTS*<br />
Prepared by the <strong>East</strong>-<strong>West</strong> <strong>Gateway</strong> <strong>Council</strong> of Governments<br />
October 2009<br />
*See Updated Community Participation List for 2010 for most recent<br />
information on communities and school districts which have adopted<br />
Resolution of Support and Participation.
All Hazard Mitigation Plan<br />
Community Participant Update<br />
July 2010<br />
<strong>Jefferson</strong> <strong>County</strong> Hazard Mitigation Plan<br />
<strong>Jefferson</strong> <strong>County</strong> Communities<br />
Jurisdiction Continuing Pending New<br />
Arnold X<br />
Byrnes Mill X<br />
Cedar Hill Lakes X<br />
Crystal City X<br />
De Soto X<br />
Festus X<br />
Herculaneum X<br />
Hillsboro X<br />
Kimmswick X<br />
Olympian Village X<br />
Parkdale X<br />
Pevely X<br />
Scotsdale X<br />
No Longer<br />
Participating
<strong>Jefferson</strong> <strong>County</strong> Hazard Mitigation Plan i<br />
Participating Participating Communities Communities All All-Hazard All Hazard Mitigation Plan Plan<br />
Jurisdiction Jurisdiction Continuing Continuing Pending Pending New<br />
New<br />
Arnold X<br />
Byrnes Mill X<br />
Cedar Hill Lakes X<br />
Crystal City X<br />
De Soto X<br />
Festus X<br />
Herculaneum X<br />
Hillsboro X<br />
Kimmswick X<br />
Olympian Village X<br />
Parkdale X<br />
Pevely X<br />
Scotsdale X<br />
No No Longer<br />
Longer<br />
Participating<br />
Participating
<strong>Jefferson</strong> <strong>County</strong> Hazard Mitigation Plan ii<br />
PARTICIPATING PARTICIPATING SCHOOL SCHOOL SCHOOL DISTRICTS DISTRICTS ALL ALL-HAZARD ALL HAZARD HAZARD MITIGATION PLAN<br />
District District Continuing Continuing Pending Pending<br />
New<br />
New<br />
Affton 101 District X<br />
Bayless District X<br />
Brentwood District X<br />
Clayton District X<br />
Crystal City 47 District X<br />
DeSoto 73 District X<br />
Dunklin R-V District X<br />
Ferguson-Florissant R-II X<br />
Festus R-VI District X<br />
Fort Zumwalt R-II District X<br />
Fox C-6 District X<br />
Francis Howell R-III X<br />
Franklin <strong>County</strong> R-II<br />
District<br />
Grandview R-II District X<br />
Hancock Place District X<br />
Hazelwood District X<br />
Hillsboro R-3 District X<br />
<strong>Jefferson</strong> <strong>County</strong> R-VII<br />
District<br />
Jennings District X<br />
Kirkwood R-VII District X<br />
Ladue District X<br />
Lindbergh R-VIII District X<br />
Lonedell R-XIV District X<br />
Mehlville R-IX District<br />
Meramec Valley R-III<br />
X<br />
District<br />
MRH District(Maplewood<br />
Richmond Heights)<br />
New Haven District X<br />
Normandy District X<br />
Northwest R-I District X<br />
Orchard Farm R-5<br />
District<br />
Parkway District X<br />
Pattonville R-III District X<br />
Ritenour District X<br />
Riverview Gardens<br />
District<br />
X<br />
Rockwood R-VI District X<br />
X<br />
X<br />
x<br />
X<br />
X<br />
No No Longer<br />
Longer<br />
Participating<br />
Participating
<strong>Jefferson</strong> <strong>County</strong> Hazard Mitigation Plan iii<br />
District District Continuing Continuing Pending Pending<br />
New<br />
New<br />
Special School District of<br />
St. Louis <strong>County</strong><br />
X<br />
Reorganized R-XV<br />
District (Spring Bluff)<br />
X<br />
St. Charles R-VI District X<br />
St. Clair R-XIII District X<br />
St. Louis Board of<br />
Education<br />
X<br />
Strain-Japan R-16<br />
District<br />
X<br />
Sullivan District X<br />
Sunrise R-IX District X<br />
Union R-XI District X<br />
University City District X<br />
Valley Park District X<br />
Washington District X<br />
Webster Groves District X<br />
Wellston District X<br />
Wentzville R-IV District X<br />
Windsor C-1District X<br />
No No No Longer Longer<br />
Longer<br />
Participating<br />
Participating
<strong>Jefferson</strong> <strong>County</strong> Hazard Mitigation Plan iv<br />
JEFFERSON JEFFERSON JEFFERSON COUNTY<br />
COUNTY<br />
Table Table of of Contents<br />
Contents<br />
Section Section 1 1 <strong>County</strong>/Community <strong>County</strong>/Community <strong>County</strong>/Community Profiles Profiles ................................<br />
................................................................<br />
................................ ................................<br />
........................................<br />
................................ ........ ........1 ........<br />
Community Profiles......................................................................................................1<br />
<strong>Jefferson</strong> <strong>County</strong> Profile ...............................................................................................1<br />
Development/History……………… ..............................................................................1<br />
Geography, Geology and Climate.................................................................................2<br />
Form of Government…................................................................................................8<br />
Community Partnerships ..............................................................................................8<br />
Public Awareness.........................................................................................................8<br />
Media Relations...........................................................................................................9<br />
Demographic Information..........................................................................................10<br />
Age ...........................................................................................................................10<br />
Per Capita Income and Persons Below the Federal Poverty Level..................................10<br />
Education Levels ........................................................................................................10<br />
Diversity.....................................................................................................................11<br />
Economy, Employment and Industry ..........................................................................12<br />
Labor Force ...............................................................................................................12<br />
Average Wage Rate ...................................................................................................13<br />
Primary Employers and Industries...............................................................................13<br />
Access to Employment; Incommuting and Outcommuting .........................................14<br />
Codes/Regulations for Building, Stormwater, Zoning, Fire...........................................15<br />
Existing Community Plans ..........................................................................................15<br />
Land Use Information.. ..............................................................................................16<br />
Development Trends and Annexation.........................................................................17<br />
Floodplain Management............................................................................................18<br />
Wetlands Issues .........................................................................................................20<br />
NFIP Participation ......................................................................................................21<br />
Environmental Concerns ............................................................................................21<br />
Endangered Species, Historic Properties/Districts, Archaeological Sites ........................22<br />
Identified Assets ........................................................................................................23<br />
Inventory of Critical/Key/Essential Facilities..................................................................23<br />
Medical Facilities........................................................................................................23<br />
Long Term Care Facilities............................................................................................24<br />
Day Care Centers .......................................................................................................25<br />
Schools......................................................................................................................27<br />
Government Facilities.................................................................................................29<br />
Recreation Facilities....................................................................................................32<br />
Inventory of Infrastructure .........................................................................................35<br />
Roadways/Transportation...........................................................................................37<br />
Motor Freight Transportation.....................................................................................38<br />
Railroads ...................................................................................................................38<br />
Airports .....................................................................................................................39<br />
Public Transportation.................................................................................................40
<strong>Jefferson</strong> <strong>County</strong> Hazard Mitigation Plan v<br />
Communications .......................................................................................................40<br />
Water and Sewer Facilities .........................................................................................42<br />
Electricity and Natural Gas .........................................................................................48<br />
Solid Waste Disposal..................................................................................................51<br />
Law Enforcement.......................................................................................................52<br />
Emergency Services (911)...........................................................................................52<br />
Emergency Medical Services.......................................................................................53<br />
Fire Protection ...........................................................................................................53<br />
Underground Infrastructure .......................................................................................54<br />
Inventory of Housing Structures .................................................................................55<br />
Number of Dwelling Units..........................................................................................55<br />
Average Unit Cost......................................................................................................56<br />
Total Inventory of Structures ......................................................................................56<br />
Cities and Villages Profiles……………………………………………………….…………56<br />
Section Section 2 2 2 – Risk Risk Assessment Assessment ................................<br />
................................................................<br />
................................<br />
................................<br />
......................................................<br />
................................ ......................<br />
......................1<br />
......................<br />
Natural Hazard Identification and Elimination Process ..................................................1<br />
Community Wide Hazard Profile and List of Hazards Identified .....................................1<br />
Flood...........................................................................................................................2<br />
Levees ................................................................................................................36<br />
Earthquake................................................................................................................54<br />
Tornado/Severe Thunderstorm ...................................................................................76<br />
Severe Winter Weather ..............................................................................................94<br />
Drought ..................................................................................................................102<br />
Heat Wave...............................................................................................................114<br />
Dam Failure .............................................................................................................128<br />
Wildfire ...................................................................................................................141<br />
Multi-Jurisdictional Risk Assessment .........................................................................146<br />
Worksheets ..………………………………………………………………………………149<br />
Section Section 3 3 – <strong>Jefferson</strong> <strong>Jefferson</strong> <strong>County</strong> <strong>County</strong> Capability Capability Assessment Assessment................................<br />
Assessment Assessment................................<br />
....................................................<br />
................................ ....................<br />
....................1<br />
....................<br />
Mitigation Management Policies ..................................................................................1<br />
Existing Plans...............................................................................................................1<br />
Mitigation Programs ....................................................................................................1<br />
<strong>Jefferson</strong> <strong>County</strong> Capabilities (Organization, Staffing, Training) ....................................3<br />
Responsibilities and Authorities....................................................................................3<br />
Intergovernmental and Interagency Coordination.........................................................4<br />
Vulnerability Assessment of <strong>County</strong> Policies and Development Trends…. ......................4<br />
Commitments to a Comprehensive Mitigation Program................................................4<br />
Laws, Regulations, and Policies Related to Development in Hazard-Prone Areas ............4<br />
<strong>County</strong> Laws, Regulations and Policies Related to Hazard Mitigation in General ............4<br />
How Local Risk Assessments are Incorporated and Prioritized into Local Planning .........5<br />
Current Criteria Used to Prioritize Mitigation Funding...................................................5<br />
Integration of Hazard Mitigation with the <strong>County</strong> Department’s Plans……………….…5<br />
How the <strong>County</strong> Determines Cost-Effectiveness of Mitigation Programs………………...6
<strong>Jefferson</strong> <strong>County</strong> Hazard Mitigation Plan vi<br />
Mitigation Funding Options, Including Current and Potential Sources of Federal, State,<br />
Local and Private Funds................................................................................................6<br />
How Governments Meet Requirements for Hazard Mitigation Funding Programs..........6<br />
Recommendations for Improvement ............................................................................6<br />
<strong>County</strong> and Municipal Policies and Development Trends...............................................7<br />
Funding Sources ..........................................................................................................8<br />
Worksheets………………………………………………………………………………….15<br />
Section Section 4 4 - Mitigation Mitigation................................<br />
Mitigation<br />
................................<br />
................................................................<br />
................................ ................................<br />
...............................................................<br />
................................ ...............................<br />
...............................1<br />
...............................<br />
Introduction to Mitigation ...........................................................................................1<br />
Definition of Mitigation ...............................................................................................1<br />
Categories of Mitigation ..............................................................................................1<br />
Mitigation Versus Preparedness....................................................................................2<br />
Mitigation Versus Response and Recovery ....................................................................3<br />
Mitigation Plan Benefits ...............................................................................................3<br />
Hazard Mitigation Goals, Objectives, Strategy and Coordination...................................3<br />
Surveys........................................................................................................................5<br />
Evaluation .................................................................................................................11<br />
Strategic Implementation...........................................................................................16<br />
Cities with Higher Exposure to <strong>County</strong> Hazards……………………………………….….17<br />
Analysis and Prioritization of Mitigation Actions.........................................................17<br />
Monitoring, Evaluating and Updating the Plan...........................................................18<br />
Worksheets. ........………………………………………………………………………..... 20
<strong>Jefferson</strong> <strong>County</strong> Hazard Mitigation Plan vii<br />
LIST LIST OF OF TABLES<br />
TABLES<br />
Section Section Section 1 1 – <strong>County</strong>/Community <strong>County</strong>/Community Profiles Profiles................................<br />
Profiles Profiles................................<br />
................................................................<br />
................................ ................................<br />
......................................<br />
................................ ...... ......1 ......<br />
TABLE J1 JEFFERSON COUNTY INCOME AND POVERTY LEVEL...........................................................10<br />
TABLE J2 JEFFERSON COUNTY EDUCATION ......................................................................................11<br />
TABLE J3 JEFFERSON COUNTY DEMOGRAPHICS ...............................................................................11<br />
TABLE J4 JEFFERSON COUNTY EMPLOYMENT STATUS ......................................................................13<br />
TABLE J5 JEFFERSON COUNTY TOP EMPLOYERS 2007 ......................................................................13<br />
TABLE J6 JEFFERSON COUNTY EMPLOYMENT BY INDUSTRY .............................................................14<br />
TABLE J7 JEFFERSON COUNTY COMMUTING TO WORK....................................................................14<br />
TABLE J8 JEFFERSON COUNTY NFIP INSURANCE PARTICIPATING MUNICIPALITIES.............................21<br />
TABLE J9A JEFFERSON COUNTY MEDICAL FACILITIES..........................................................................23<br />
TABLE J9B JEFFERSON COUNTY LONG TERM HEALTHCARE FACILITIES ................................................24<br />
TABLE J10 JEFFERSON COUNTY CHILDCARE CENTERS.........................................................................25<br />
TABLE J11A JEFFERSON COUNTY PRIVATE SCHOOLS ............................................................................28<br />
TABLE J11B JEFFERSON COUNTY PUBLIC SCHOOL DISTRICTS ................................................................28<br />
TABLE J12 JEFFERSON COUNTY GOVERNMENT FACILITIES..................................................................29<br />
TABLE J13 RECREATIONAL FACILITIES IN JEFFERSON COUNTY ............................................................33<br />
TABLE J14 JEFFERSON COUNTY FREIGHT CARRERS .............................................................................38<br />
TABLE J15 AIRPORT OPERATIONS: ST. LOUIS REGION .........................................................................39<br />
TABLE J16 PRIMARY LOCAL TELECOMMUNICATIONS PROVIDERS.......................................................40<br />
TABLE J17 WASTEWATER TREATMENT FACILITIES IN ST. LOUIS COUNTY............................................42<br />
TABLE J18 ST. LOUIS REGIONAL AREA SOLID WASTE DISPOSAL ........................................................51<br />
TABLE J19 ST. LOUIS REGIONAL AREA LANDFILLS ..............................................................................52<br />
TABLE J20 JEFFERSON COUNTY FIRE PROTECTION DISTRICTS AND RESOURCES ..................................53<br />
TABLE J21 UNDERGROUND INFRASTRUCTURE....................................................................................54<br />
TABLE J22 JEFFERSON COUNTY INVENTORY OF HOUSEING UNITS .....................................................55<br />
TABLE J23 JEFFERSON COUNTY HOUSING UNITS BREAKDOWN..........................................................55<br />
TABLE J24 JEFFERSON COUNTY MEDIAN VALUE OF HOMES...............................................................56<br />
TABLE J25 INVENTORY OF STRUCTURES .............................................................................................56<br />
TABLE J26 INDIVIDUAL PROFILE: MUNICIPALITIES LOCATED IN JEFFERSON .........................................57<br />
Section 2 2 – Risk Risk Assessment Assessment ................................<br />
................................................................<br />
................................<br />
................................<br />
.....................................................<br />
................................ .....................<br />
.....................1<br />
.....................<br />
TABLE J27A PROBABILITY OF HAZARDS FROM NATUREAL DISASTERS.....................................................2<br />
TABLE J27B MISSISSIPPI AND MERAMEC RIVER STAGES: JEFFERSON COUNTY ......................................22<br />
TABLE J27C JEFFERSON COUNTY NFIP INSURANCE PARTICIPATING MUNICIPALITIES.............................25<br />
TABLE J27D JEFFERSON COUNTY UNMITIGATED PROPERTIES – REPETITIVE LOSSES ..............................26<br />
TABLE J28 SEASONAL PATTERN FOR RAIN EVENTS FOR ST. LOUIS REGION.........................................36<br />
TABLE J29A LIST OF LEVEES .................................................................................................................41<br />
TABLE J29B DAMAGE ASSESSMENT OF TOTAL LEVEE FAILURE ............................................................46<br />
TABLE J30A LARGEST EARTHQUAKES IN CONTIGUOUS UNITED STATES ...............................................60<br />
TABLE J30B RECENT EARTHQUAKE EVENTS 1.0 OR GREATER ...............................................................60<br />
TABLE J30C HISTORICAL EARTHQUAKE EVENTS....................................................................................62<br />
TABLE J30D LANDSLIDE, SINKHOLE ST. LOUIS METROPOLITAN REGION ...............................................63<br />
TABLE J31 JEFFERSON COUNTY BRIDGES ............................................................................................66<br />
TABLE J32 FREQUENCY OF EARTHQUAKES .........................................................................................70<br />
TABLE J33 FUJITA TORNADO MEASUREMENT SCALE..........................................................................81<br />
TABLE J34 TORNADO EVENTS IN JEFFERSON COUNTY........................................................................83<br />
TABLE J35 SEVERE THUNDERSTORM EVENTS IN JEFFERSON COUNTY.................................................84<br />
TABLE J36 TORNADOES: JEFFERSON COUNTY 1950-1998 ..................................................................90<br />
TABLE J37 STORM INTENSITIES: JEFFERSON COUNTY REGION (FUJITA SCALE) ....................................90<br />
TABLE J38 JEFFERSON COUNTY TORNADO PROBABILITY .....................................................................93
<strong>Jefferson</strong> <strong>County</strong> Hazard Mitigation Plan viii<br />
TABLE J39 JEFFERSON COUNTY WINTER STORMS 1994-2003 ............................................................96<br />
TABLE J40 JEFFERSON COUNTY WINTER STORMS 1994 TO 2007 .......................................................97<br />
TABLE J41 PALMER CLASSIFICATIONS...............................................................................................105<br />
TABLE J42 RIVER LEVEL STAGES IN DROUGHT CONDITIONS IN JEFFERSON COUNTY ........................108<br />
TABLE J43<br />
PALMER DROUGHT SEVERITY INDEX MONTHLY ...................................................108<br />
TABLE J44 TOP FIFTEEN CONSECUTIVE DAYS 90 DEGREES OR HIGHER .............................................120<br />
TABLE J45 HEAT MORBIDITY BY LOCATION 1989 TO 2002...............................................................121<br />
TABLE J46 ST. LOUIS METROPOLITAN REGION HEAT WAVE DAMAGES ............................................122<br />
TABLE J47 SUMMARY OF MISSOURI DAMS BY HAZARD CLASSIFICATION................................. 133<br />
TABLE J48 JEFFERSON COUNTY HIGH HAZARD DAMS ......................................................... 133<br />
TABLE J49 RECENT DAM FAILURES IN MISSOURI................................................................ 137<br />
TABLE J50 REASONS FOR FIRES IN MISSOURI .................................................................... 141<br />
Section Section Section 4 4 4 – Mitigation Mitigation ................................<br />
................................................................<br />
................................ ................................<br />
..............................................................<br />
................................ ..............................<br />
..............................1<br />
..............................<br />
TABLE J51A LIST OF EMD AUTHORITIES .............................................................................. 4<br />
TABLE J51B LOCAL JURISDICTIONS .................................................................................... 5<br />
TABLE J51C SCHOOL DISTRICTS......................................................................................... 6<br />
TABLE J51D SURVEY RESULTS ........................................................................................... 8<br />
TABLE J51E 2009 ALL HAZARD MITIGATION PLAN UPDATE LOCAL GOVERNMENT SURVEY 1 ........... 9<br />
TABLE J51F 2009 ALL HAZARD MITIGATION PLAN UPDATE LOCAL GOVERNMENT SURVEY 2 ..........10<br />
TABLE J52 JEFFERSON COUNTY PROPOSED MITIGATION ACTION EVALUATION ................................11
<strong>Jefferson</strong> <strong>County</strong> Hazard Mitigation Plan ix<br />
LIST LIST OF OF FIGURES<br />
FIGURES<br />
Section Section Section 1 1 – <strong>County</strong>/Community <strong>County</strong>/Community Profiles Profiles................................<br />
Profiles Profiles................................<br />
................................................................<br />
................................ ................................<br />
......................................<br />
................................ ...... ......1 ......<br />
FIGURE J2 TOPOGRAPHIC RELIEF MAP OF MISSOURI ............................................................................3<br />
FIGURE J3 GENERALIZED GEOLOGIC MAP OF MISSOURI.......................................................................4<br />
FIGURE J4 SURFICIAL MATERIALS IN MISSOURI ....................................................................................6<br />
FIGURE J6 JEFFERSON COUNTY LAND USE..........................................................................................16<br />
FIGURE J9 JEFFERSON COUNTY SCHOOL DISTRICTS ............................................................................28<br />
FIGURE J10 TRANSPORTATION MAP JEFFERSON COUNTY.....................................................................36<br />
FIGURE J11 ST. LOUIS METROPOLITAN AIRPORTS .................................................................................39<br />
FIGURE J12 AMEREN UE ELECTRIC COVERAGE .....................................................................................49<br />
FIGURE J13 NATURAL GAS COVERAGE .................................................................................................50<br />
Section Section 2 2 – Risk Risk Assessment Assessment ................................<br />
................................................................<br />
................................<br />
................................<br />
.....................................................<br />
................................ .....................<br />
.....................1<br />
.....................<br />
FIGURE J14 SATELLITE IMAGE ST LOUIS AREA FLOODING 1993 ...........................................................3<br />
FIGURE J15 AERIAL IMAGE ST LOUIS AREA FLOODING 1993 .................................................................3<br />
FIGURE J16 1993 MIDWEST FLOOD........................................................................................................7<br />
FIGURE J17 COMMERCIAL AND INDUSTRIAL ........................................................................................10<br />
FIGURE J18 PUBLIC FACILITIES ..............................................................................................................12<br />
FIGURE J19 RESIDENTIAL PROPERTIES...................................................................................................14<br />
FIGURE J20 TRANSPORTATION .............................................................................................................16<br />
FIGURE J21A UTILITIES DAMAGES ..........................................................................................................18<br />
FIGURE J21B EMERGENCY EXPENSES.....................................................................................................20<br />
FIGURE J22A LEVEE DESIGN ...................................................................................................................37<br />
FIGURE J22B UNDERSEEPAGE.................................................................................................................38<br />
FIGURE J22C LEVEE DSITRICT CONCERN EXAMPLE..................................................................................39<br />
FIGURE J22D ST. ALBANS AND AUGUSTA BOTTOMS LEVEE SYSTEM ......................................................42<br />
FIGURE J22E ST. PETERS AND CHESTERFIELD VALLEY LEVEE SYSTEM ......................................................43<br />
FIGURE J22F CONFLUENCE LEVEE SYSTEM .............................................................................................44<br />
FIGURE J22G ST. LOUIS REGIONAL MAP OF LEVEES................................................................................45<br />
FIGURE J22H ST. LOUIS AND ST. CHARLES COUNTY LEVEE MAP.............................................................46<br />
FIGURE J25 LANDSLIDE POTENTIAL.......................................................................................................56<br />
FIGURE J27 EARTHQUAKE DAMAGE INTERIOR BUILDING .....................................................................59<br />
FIGURE J28 EARTHQUAKE DAMAGE EXTERIOR BUILDING ....................................................................59<br />
FIGURE J29 PEAK ACCELERATION .........................................................................................................68<br />
FIGURE J30 MODIFIED MERCALLI SCALE...............................................................................................69<br />
FIGURE J31<br />
EARTHQUAKES IN MISSOURI .............................................................................................71<br />
FIGURE J32 VIEW OF TORNADIC THUNDERSTORM ...............................................................................77<br />
FIGURE J33 HAIL PICTURE.....................................................................................................................79<br />
FIGURE J34 FLOODING PICTURE ...........................................................................................................79<br />
FIGURE J35 LIGHTNING PICTURE...........................................................................................................79<br />
FIGURE J36 WIND ZONES ....................................................................................................................80<br />
FIGURE J37 FUJITA TORNADO MEASUREMENT DAMAGE F1.................................................................82<br />
FIGURE J38 FUJITA TORNADO MEASUREMENT DAMAGE F2.................................................................82<br />
FIGURE J39 FUJITA TORNADO MEASUREMENT DAMAGE F3.................................................................82<br />
FIGURE J40 FUJITA TORNADO MEASUREMENT DAMAGE F4.................................................................82<br />
FIGURE J41 FUJITA TORNADO MEASUREMENT DAMAGE F5.................................................................82<br />
FIGURE J42 TORNADO SEASONAL PATTERN .........................................................................................89<br />
FIGURE J43 PERCENTAGE BREAKDOWN OF TORNADOES BY CATEGORY ..............................................91<br />
FIGURE J44 REGIONAL TORNADO STORM TRACKS ...............................................................................91<br />
FIGURE J46 MISSOURI DROUGHT REGIONS ........................................................................................106<br />
FIGURE J47 DROUGHT SEVERITY INDEX BY YEAR................................................................................110
<strong>Jefferson</strong> <strong>County</strong> Hazard Mitigation Plan x<br />
FIGURE J48 PALMER DROUGHT INDEX ...............................................................................................113<br />
FIGURE J49 HEAT INDEX CHART .........................................................................................................117<br />
FIGURE J50 1980 MIDWEST HEAT WAVE ...........................................................................................126<br />
FIGURE J52 WILDFIRE PICTURE ...........................................................................................................141<br />
Volume 2 contains Figures J1, J5, J7, J8, J10, J23, J24, J26, J45, J51 and J54
<strong>Jefferson</strong> <strong>County</strong> Hazard Mitigation Plan xi
A Regional Overview All-Hazard Mitigation Plan<br />
SECTION SECTION 1<br />
1<br />
Community Community Profiles<br />
Profiles<br />
Natural hazards impact not only the citizens of the <strong>East</strong>-<strong>West</strong> <strong>Gateway</strong> <strong>Council</strong> of<br />
Governments (EWG) planning region, but also their property, the environment and the<br />
economy. Natural hazards, defined here as flooding, windstorms, severe winter storms,<br />
earthquakes, heat waves, drought, dam failure and wildfires, have exposed the region’s<br />
residents and businesses to the financial and emotional costs of recovering after disasters.<br />
The risk associated with hazards increases as more people move to areas affect by hazards.<br />
The inevitability of hazards and growing population and activity within the planning region<br />
create an urgent need to develop strategies, coordinate resources and increase public<br />
awareness to reduce risk and prevent loss from future hazard events. Identifying risks<br />
posed by hazards, as well as developing strategies to reduce the impact of a hazard event<br />
can assist in protecting life and property of citizens and communities. Local residents and<br />
businesses are encouraged to work together to implement a Hazard Mitigation Plan that<br />
addresses the potential impact of hazard events.<br />
Below is a description and profile of <strong>Jefferson</strong> <strong>County</strong> within the EWG planning region.<br />
<strong>County</strong> <strong>County</strong> Profile: Profile: <strong>Jefferson</strong> <strong>Jefferson</strong> <strong>County</strong> <strong>County</strong><br />
<strong>County</strong><br />
Development/Hist<br />
Development/History<br />
Development/Hist ory<br />
<strong>Jefferson</strong> <strong>County</strong> is located in eastern Missouri, just west of the Mississippi River. It is<br />
bordered on the north by St. Louis <strong>County</strong> and the Meramec River, on the south by Ste.<br />
Genevieve and St. Francois Counties, and on the west by Washington and Franklin<br />
Counties. The county is part of the St. Louis Metropolitan Statistical Area as defined by the<br />
United States Census Bureau. The county has an area of about 425,280 acres that includes<br />
about 2,176 acres of water in the Meramec, Mississippi and Big Rivers and other large<br />
impoundments. Interstate I-55 runs north and south through the county. <strong>Jefferson</strong><br />
<strong>County</strong> was separated from St. Louis and St. Genevieve Counties and established in 1818<br />
(effective January 1, 1819). Prior to settlement by Europeans, Native Americans including<br />
the Delaware, Missouri, Osage and Shawnee tribes inhabited the region. Charles III, the<br />
King of Spain, encouraged settlements by offering land grants. John Hildebrand,<br />
recognized as the first settler, settled on Saline Creek in 1774, later known as the Meramec<br />
Settlement. Lead, silica, zinc, barite, limestone and other mineral deposits lured settlers to<br />
the area. The first lead shot tower west of Pennsylvania was erected in 1809 in the<br />
southern part of Herculaneum. Sandstone mined from the St. Peter Sandstone Formation<br />
was used to manufacture glass. See Figure J1 in the back of the Technical Appendix.<br />
The county had a population of 213,600 as of the 2007 Census. There are 78,867<br />
households in the county with an average size of 2.87 persons and the median age of<br />
1
2<br />
<strong>Jefferson</strong> <strong>County</strong> – Section 1<br />
residents is 30.7 years. Median household income is $32,281 annually. Six percent of<br />
county families and 7.4 percent of the total population have incomes below the poverty<br />
level. There are 1,290 miles of roadways in <strong>Jefferson</strong> <strong>County</strong> with 75 percent maintained<br />
by municipal and county governments, and 25 percent maintained by the state of Missouri.<br />
Approximately 80 percent of workers drive to work alone and 0.3 percent take public<br />
transportation to work.<br />
While urbanization in the northern part of <strong>Jefferson</strong> <strong>County</strong> has been increasing, much of<br />
the remainder of the county retains its rural, small town character. Once predominantly<br />
rural, <strong>Jefferson</strong> <strong>County</strong> has experienced more than 50 years of growth pressure from the St.<br />
Louis area. This growth has influenced the county, putting pressure on existing land uses,<br />
natural resources and infrastructure. In 1997, the increase in sales tax revenues was only<br />
3.27 percent, while for the last three years the increase has averaged over 7 percent per<br />
year. This growth in sales tax increases not only impacts the general revenue monies, but<br />
also has a tremendous effect on the budgets for the Sheriff’s department and the highway<br />
department.<br />
Geography, Geography, Geology Geology and and Climate<br />
Climate<br />
<strong>Jefferson</strong> <strong>County</strong> is divided into seven distinct physiographic regions. From the northeast<br />
to the south these regions include: a small area of Dissected Till Plains, the River Hills, the<br />
Zell Platform, the Burlington Escarpment, the Crystal Escarpment, the Salem Plateau and<br />
the Avon Escarpment. These regions have landscape shapes controlled by separate<br />
geologic units with variable bedding, thickness, weatherability and time of deposition. The<br />
Dissected Till Plains consist of rolling and partially dissected basin with low hills and broad<br />
ridges adjacent to the lower Meramec and Mississippi Rivers. Thick layers of alluvium and<br />
loess have covered glacial till and outwash materials. The River Hills consist of a narrow<br />
band of uplands bounded on the east by the Mississippi River and on the west by the<br />
Burlington Escarpment. The Glaize, Joachim, Plattin, Pomme and Rock Creeks dissect this<br />
area. Ridges and north and east slopes are covered with loess. <strong>West</strong> and south slopes<br />
consist of upper cherty red clays and limestone outcrops on the lower slopes. The Zell<br />
Platform is a small valley with rolling topography east of Selma south to Ste. Genevieve<br />
<strong>County</strong>.<br />
The River Hills are on the east and the Crystal Escarpment is on the west. The Burlington<br />
Escarpment is a band that borders the River Hills and the Crystal Escarpment. The Salem<br />
Plateau is the largest area in the county and borders the Crystal Escarpment to the north<br />
and east and the Avon Escarpment to the south. The Avon Escarpment is the highest area<br />
in the county located in the southwest corner. The Salem Plateau is on the north. Major<br />
soils in this area are Goss and Wrengart. The highest point in the county is Vinegar Hill<br />
about 1,060 feet above sea level. The lowest point is about 385 feet above sea level in the<br />
Mississippi River bottoms. Floodplains of the Big, Meramec and Mississippi Rivers and their<br />
tributaries are the most fertile of the county. Topography varies considerably throughout<br />
<strong>Jefferson</strong> <strong>County</strong>. Much of the county can be classified as rugged. Large areas, with<br />
greater than 20 percent slopes are common throughout northern and southern portions of
A Regional Overview All-Hazard Mitigation Plan<br />
the county. The central one-third of the county consists of wider and flatter crests and<br />
shallower valleys. The three largest rivers in <strong>Jefferson</strong> <strong>County</strong> are the Mississippi River,<br />
Meramec River and Big River. These waterways offer commercial and recreational<br />
opportunities, but a significant portion of the county is subject to flooding.<br />
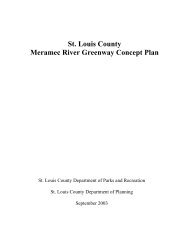
Due to the amount of waterways, as well as fluctuations in water levels the Big River drains<br />
about 37 percent of the county; the Meramec River drains approximately 15 percent of the<br />
county. Smaller streams draining directly into the Mississippi River make up about 48<br />
percent of the county. Big River flows into Meramec River, which then flows into<br />
Mississippi River. Both Joachim and Plattin Creeks flow into the Mississippi River. Refer to<br />
Figure J2 below.<br />
FIGURE FIGURE J2 J2 MISSOURI MISSOURI TOPOGRAPHY<br />
TOPOGRAPHY<br />
Source: Missouri Department of Natural Resources<br />
3
4<br />
FIGURE FIGURE J3 J3 GEOLOGIC GEOLOGIC MAP MAP OF OF MIS MISSOURI MIS MISSOURI<br />
SOURI<br />
<strong>Jefferson</strong> <strong>County</strong> – Section 1<br />
Source: Missouri Department of Natural Resources<br />
There are 22 geologic formations exposed in <strong>Jefferson</strong> <strong>County</strong>, which range from Cambrian<br />
to Pennsylvanian systems in age (Missouri Geological Survey, 1961). The Cambrian system<br />
has the oldest rocks that crop out, and are composed of massive dolostone. Lead and zinc<br />
ores and barite have been mined from Cambrian formations that occur in areas bordering<br />
Big River and larger creeks in the southern part of the county. The Ordovician system is<br />
exposed in almost three fourths of the county and has had a significant role in the<br />
economic growth and development of the area. Limestone and dolostone quarries have<br />
furnished building stones, aggregate and cement for highways, bridges, and buildings.<br />
Sand mined in the St. Peter Sandston is used by the glass industry.<br />
The Devonian system is represented by a narrow band of sandstone, shale and limestone<br />
that crosses the northeastern part of the county. The Mississippian system is
A Regional Overview All-Hazard Mitigation Plan<br />
predominantly limestone and cherty limestone. The limestone weathers easily and<br />
produces deep cherty soils (in the northeastern part of the county). The Pennsylvanian<br />
system consists of reddish-brown sandstone and bluish-gray to purple shale found in<br />
sinkholes and vertical bedrock joints. Geologic units consist of flat to gently dipping<br />
bedrock dominated by dolostone, sandstone and limestone formations. Several zones of<br />
high angle faults that are downthrown are considered to be extensions of the Ste.<br />
Genevieve Fault System. They are the Crystal City anticline, the Plattin Creek anticline, the<br />
Roselle lineament, the Rugley School fault block, the Summit Park structure and the Valles<br />
Mines-Vineland fault zone. A structure known as the Eureka-House Springs anticline has<br />
been traced from the Mississippi River to near Wright City (McCracken, 1971). The<br />
potential for landslide or slump occurs in areas of the Maquoketa and Warsaw shales.<br />
Sinkholes are numerous in the Kimmswick limestone. Refer to Figure J3 above.<br />
5
6<br />
FIGURE FIGURE J4 J4 SURFICIAL SURFICIAL SURFICIAL MA MATERIALS MA TERIALS MAP MAP<br />
Source: Missouri Department of Natural Resources<br />
<strong>Jefferson</strong> <strong>County</strong> – Section 1<br />
Soils Soils Soils - There are a total of six soil associations in <strong>Jefferson</strong> <strong>County</strong> including the Haynie-<br />
Tice-Waldron Association, the Sonsac-Useful Association, the Wrengart-Goss Association,<br />
the Menfro-Gasconade Association, the Minnith-Pevely Association, and the Haymond-<br />
Freeburg-Horsecreek-Bloomdale Association.<br />
The Haynie-Tice Waldron Association includes zero to two percent slopes, formed in<br />
Mississippian River alluvium. It covers one percent of the county and is present mainly on<br />
natural levees, bottomlands and old meanders. It consists of 48 percent well drained<br />
Haynie soils (silty loam), 29 percent somewhat poorly drained Tice soils (silty loam), 20<br />
percent somewhat poorly drained Waldron soils (silty loam) and three percent minor soils.
A Regional Overview All-Hazard Mitigation Plan<br />
The Sonsac-Useful-Moko Association ranges from three to 55 percent slope. It covers<br />
approximately 58 percent of the county. These soils are most commonly found on narrow<br />
ridgetops, backslopes and summits. The parent materials are loess and residuum. Welldrained<br />
Sonsac soils (gravelly silt loam-well drained) make up 44 percent of the association.<br />
Useful soils (silty loam-moderately well drained) make up 30 percent of the association.<br />
Well-drained Moko soils (stony soils) make up 15 percent of the association and the<br />
remaining 11 percent are minor soils.<br />
The Wrengart-Goss Association ranges from three to 55 percent slope. It covers about 13<br />
percent of the county and consists of soils located on summits, ridgetops, and backslopes.<br />
The parent materials are loess and residuum. The moderately well drained Wrengart soils<br />
(silty loam) make up 47 percent of the association, well-drained Goss soils (cobbly silty<br />
loam) make up 45 percent of the association and eight percent of minor soils make up the<br />
balance.<br />
The Menfro-Gasconade Association ranges from three to 50 percent slope. It covers about<br />
five percent of the county and is located mainly in the summit and backslope areas. Parent<br />
materials consist of loess and residuum. The well-drained Menfro soils (silty loam) make up<br />
69 percent of the association. Excessively well-drained Gasconade soils (rubbly soils) make<br />
up 17 percent and the remaining 14 percent are minor soils.<br />
The Minnith-Pevely Association ranges from three to 50 percent slope. It covers about<br />
eight percent of the county. These soils are commonly found on ridgetops and backslopes.<br />
The parent materials consist of loess and residuum. The moderately well drained Minnith<br />
soils (silty loam) consist of 51 percent of the association. The moderately well drained<br />
Pevely soils (silty loam) make up 32 percent of the association and minor soils make up the<br />
remaining 17 percent.<br />
The Haymond-Freeburg-Horsecreek-Bloomsdale Association ranges from zero to five<br />
percent slope. It covers about 15 percent of the county. It is commonly found in the<br />
floodplains and terraces. The parent material is alluvium. The well-drained Haymond soils<br />
(silty loam) make up 26 percent of the association. The somewhat poorly drained Freeburg<br />
soils (silty loam) make up 25 percent of the association. The well-drained Horsecreek soils<br />
(silty loam) make up 25 percent of the association and the well-drained Bloomsdale soils<br />
(silty loam) makes up about 24 percent of the association. Refer to Figure J4 above.<br />
Climate Climate - Surficial materials in <strong>Jefferson</strong> <strong>County</strong> consist of residuum from cherty limestone<br />
(clay and gravel) up to 50 feet in thickness. These materials are located in the northern half<br />
of the county. Surficial materials in the southern half of the county consist of residuum<br />
from cherty dolomite (clay, silt and gravel). The materials are normally less than ten feet<br />
thick, but can exceed 50 feet in thickness. Surficial materials in the southwest corner of the<br />
county consist of residuum from sandstone and cherty dolomite (clay, silt, sand, gravel and<br />
boulders) and can be up to 200 feet thick.<br />
7
8<br />
Form Form of of Government<br />
Government<br />
<strong>Jefferson</strong> <strong>County</strong> – Section 1<br />
<strong>Jefferson</strong> <strong>County</strong> is classified as a first class county and has its county seat in Hillsboro.<br />
November 2008 citizens of <strong>Jefferson</strong> <strong>County</strong> approved a Home Rule Charter. A sevenmember<br />
<strong>County</strong> <strong>Council</strong> governs the county and 13 municipalities. The county<br />
government is divided into the following departments and divisions: Assessors office,<br />
Auditor’s office, Circuit Court Clerk, Collector of Revenue, <strong>County</strong> Clerk, <strong>County</strong><br />
Commission, Data Processing, Department of Administration, Economic Development,<br />
<strong>Jefferson</strong> <strong>County</strong> Health Center, Juvenile Office, Land Use Development and Code<br />
Enforcement, Parks and Recreation, Public Administrator’s Office, Public Works, Recorder of<br />
Deeds, and the Sheriff’s Department.<br />
Community Community Partnerships<br />
Partnerships<br />
As part of the EWG region, <strong>Jefferson</strong> <strong>County</strong> collaborates on numerous issues including<br />
infrastructure, law enforcement and emergency services. MoDOT, Franklin, St. Francois,<br />
Washington, Ste. Genevieve and St. Louis Counties collaborate on county lines, as well as<br />
transportation issues where it applies to infrastructure systems across the Meramec Rivers.<br />
Other community partnerships include the Rock Creek Watershed Management Plan group<br />
and the St. Louis-<strong>Jefferson</strong> <strong>County</strong> Solid Waste Management District. <strong>Jefferson</strong> <strong>County</strong><br />
Planning Division, along with the Missouri Natural Resource Conservation Service (NRCS),<br />
and the Great Rivers Alliance of Natural-Resource Districts (GRAND) are working together<br />
to address watershed plans for <strong>Jefferson</strong> <strong>County</strong>. Organizations that closely participate<br />
with various hazard mitigation activities include <strong>Jefferson</strong> College, <strong>Jefferson</strong> <strong>County</strong> Soil<br />
and Water District, <strong>Jefferson</strong> Online Information Network, and the University of Missouri<br />
Outreach and Extension Office.<br />
Public Public Awareness<br />
Awareness<br />
Most of the communities contacted in <strong>Jefferson</strong> <strong>County</strong> have been very responsive to the<br />
Hazard Mitigation Plan initiative. The initial meeting was held on March 31, 2009.<br />
Approximately 8 representatives from the county and communities were invited to learn<br />
about the advantages of developing hazard mitigation plans.<br />
<strong>Jefferson</strong> <strong>County</strong>:<br />
8 Partakers Represented:<br />
Lindbergh School District, Affton School District, <strong>Jefferson</strong> <strong>County</strong> Emergency Management<br />
Agency, Olympian Village, SEMA, University City School District, and the City of Shrewsbury.<br />
School Concerns:<br />
• Funding for public education<br />
• Safe rooms from tornados being multi-purpose<br />
• Unified Communication System for schools to work on separate network in case of an<br />
emergency
A Regional Overview All-Hazard Mitigation Plan<br />
• Panorama views of inner school facilities given to emergency crews to help mitigate loss<br />
of life in the case of a disaster<br />
Community Concerns:<br />
• Pre Debris-Removal to mitigate hazards in the future<br />
• Debris removal measure in purchasing ex: chainsaws<br />
• Strapping down moveable objects to better secure vital resources (water heater) in the<br />
case of a natural disaster (earthquake).<br />
• 75% government funding 25% local funding may be too much in today’s economic<br />
stagnation to use mitigation dollars<br />
• Contamination from methamphetamines and other illicit drugs<br />
• Environmental impacts on the mitigation of asbestos both before and after disasters<br />
• Build green before and after natural disasters. Ex: Rain Gardens to prevent flooding<br />
• Reverse 911 calling dollars<br />
• Restrict development trends: Ex: Northwest District High School flooded 3 times in past<br />
12 months after subdivision built up stream from location<br />
Dams:<br />
<strong>Jefferson</strong> <strong>County</strong> has the greatest number of unregulated Dams in the State of Missouri.<br />
• Look into mitigation measures in securing dams in high hazard areas<br />
• Funding for public awareness in the dangers of unregulated dams<br />
Media Media Relations<br />
Relations<br />
Newspapers published for <strong>Jefferson</strong> <strong>County</strong> are listed below:<br />
St. Louis Post Dispatch/<strong>Jefferson</strong> <strong>County</strong> Suburban Journals<br />
Festus - <strong>Jefferson</strong> <strong>County</strong> Leader<br />
Hillsboro - <strong>Jefferson</strong> <strong>County</strong> Watchman<br />
Arnold - Imperial Rock, <strong>Jefferson</strong> <strong>County</strong> Journal- Leader Publications<br />
Meramec Journal<br />
News Democrat Journal<br />
A variety of radio and television stations are available which include:<br />
Radio Television<br />
KDJR 100.1 FM KETC-PBS<br />
KGNA 89.9 FM KMOV-CBS<br />
KTBJ 89.3 FM KPLR-Independent/WB<br />
KDHX 88.1 FM Cable Channel 3<br />
KEZK 102.5 FM KTVI-Fox<br />
KFUO 99 FM KDNL- 30<br />
9
10<br />
KHITs 96 FM KNLC-24<br />
KLOU 103.3 FM KSDK-NBC<br />
KMOX 1120 AM <strong>Jefferson</strong> College JC-TV<br />
KNSX 93.3 FM<br />
KPNT 105.7 FM<br />
KSHE 95 FM<br />
KSLQ 104.5 FM<br />
KTRS 550<br />
KWMU 90.7 FM<br />
Demographic Demographic Information<br />
Information<br />
Age<br />
Age<br />
<strong>Jefferson</strong> <strong>County</strong> – Section 1<br />
According to the 2007 American Fact Finder, <strong>Jefferson</strong> <strong>County</strong> has a total of 59,867<br />
persons under the age of 19; 132,256 persons between the age of 20 to 64 and 21,477<br />
persons 65 years of age and older. <strong>Jefferson</strong> <strong>County</strong> has a younger population and has<br />
fewer residents over the age of 64 years when compared to Missouri statewide population.<br />
The median age of 36 in <strong>Jefferson</strong> <strong>County</strong> is the same as the 36.0 median age for Missouri.<br />
Per Per Capita Capita Income Income and and Persons Persons Below Below the the Federal Federal Poverty Poverty Level<br />
Level<br />
Compared to statewide statistics, most data categories show that <strong>Jefferson</strong> <strong>County</strong> had<br />
higher levels of income and lower levels of poverty. The 2000 Census noted that the per<br />
capita income for <strong>Jefferson</strong> <strong>County</strong> was $19,435, and 13,253 persons were living below<br />
the federal poverty level. Refer to Table J1 below.<br />
TABLE TABLE J1 J1 JEFFERSON JEFFERSON COUNTY COUNTY INCOME INCOME AND AND POVERTY POVERTY LEVEL<br />
LEVEL LEVEL<br />
CATEGORIES CATEGORIES<br />
VALUE<br />
VALUE<br />
Median money income, 1999 $55,295<br />
Persons below poverty level, percent, 1999 7.4<br />
Education Education Education Levels<br />
Levels<br />
The 2007 American Fact Finder noted that 25,996 individuals had not completed high<br />
school, 45,773 persons had completed high school, and 10,650 persons had graduated<br />
from college with a Bachelor’s degree. Refer to Table J2 below.
A Regional Overview All-Hazard Mitigation Plan<br />
Diversity<br />
Diversity<br />
TABLE TABLE J2 J2 JEFFERSON JEFFERSON JEFFERSON CO CO EDUCATION<br />
EDUCATION<br />
ATTAINMENT<br />
ATTAINMENT<br />
Group Group 2000 2000 2000 2007 2007 2007 Percent<br />
Percent Perc Percent Perc ent<br />
Change<br />
Change Total<br />
Total<br />
Less Less than than 9 9<br />
th grade grade<br />
8,247 6,754 -22.1 6.55<br />
9 th th-12 12 th<br />
12<br />
th ; ; No No diploma diploma<br />
diploma<br />
17,749 17,157 -3.5 14.09<br />
Highschool Highschool Graduate Graduate<br />
45,773 49,331 7.2 36.34<br />
Some Some College College<br />
College<br />
30,175 32,336 6.7 23.96<br />
Associates Associates 8,722 13,002 32.9 6.92<br />
Bachelor Bachelor degree<br />
degree<br />
10,650 14,985 28.9 8.46<br />
Graduate/professional<br />
Graduate/professional Graduate/professional<br />
4,640 6,747 31.2 3.68<br />
According to the 2007 American Fact Finder, 98.7 percent of <strong>Jefferson</strong> <strong>County</strong> can be<br />
classified as Caucasian. The largest minority, African-American accounts for 2,413 people.<br />
The largest ethnic population of the total population was Hispanic at 1.3 percent.<br />
According to the 2007 Census, 1,890 individuals have a Native American background and<br />
1,777 have an Asian background. Refer to Table J3.<br />
TABLE TABLE J3 J3 JEFFERSON JEFFERSON COUNTY COUNTY DIVERSITY<br />
DIVERSITY<br />
CATEGORY CATEGORY<br />
NU NUMBER NU<br />
MBER PERCENT<br />
PERCENT<br />
One race 210,789 98.7<br />
White 206,404 96.7<br />
Black or African American 2,413 1.1<br />
American Indian and Alaska Native 401 0.2<br />
Asian 1282 0.6<br />
Asian Indian 203 0.1<br />
Chinese 254 0.1<br />
Filipino 244 0.1<br />
Japanese 39 0.0<br />
Korean 147 0.1<br />
Vietnamese 327 0.2<br />
Other Asian 68 0.0<br />
Native Hawaiian and Other Pacific I 0 0.0<br />
11
12<br />
TABLE TABLE J3 J3 JEFFERSON JEFFERSON JEFFERSON COUNTY COUNTY DIVERSITY<br />
DIVERSITY<br />
CATEGORY CATEGORY<br />
NU NUMBER NU<br />
MBER PERCENT<br />
PERCENT<br />
Native Hawaiian 0 0.0<br />
Guamanian or Chamorro 0 0.0<br />
Samoan 0 0.0<br />
Other Pacific Islander 0 0.0<br />
Some other race 228 0.1<br />
Two or more races 2,802 1.3<br />
Race Race alone alone or or in in combination combination with with one<br />
one<br />
or or more more other other races<br />
races<br />
0.0<br />
White 209,152 98.0<br />
Black or African American 2,926 1.4<br />
American Indian and Alaska Native 1,890 0.9<br />
Asian 1,777 0.8<br />
Native Hawaiian and Other Pacific<br />
Islander<br />
348 0.2<br />
Economy, Economy, Employment Employment and and Industry Industry<br />
Industry<br />
Labor Labor Labor Force<br />
Force<br />
Some other race 508 0.2<br />
Hispanic or Latino (of any race) 2,797 1.3<br />
<strong>Jefferson</strong> <strong>County</strong> – Section 1<br />
In 2007, <strong>Jefferson</strong> <strong>County</strong> had a labor force of 149,213 people and an unemployment rate<br />
of 6.0 percent, up substantially from 3.2 percent in 2000. In 1990 the unemployment rate<br />
was 7.7 percent. As of 2000, most employed county residents worked in retail, service,<br />
and government sectors. According to the 2007 Census, 185 persons were in the Armed<br />
Forces, 114,886 individuals were in the civilian labor force, 115,071 individuals were<br />
employed, and 7,028 were unemployed. See Table J4 below. A total of 50,276 individuals<br />
were not included in the labor force.
A Regional Overview All-Hazard Mitigation Plan<br />
Average Average Wage Wage Rate<br />
Rate<br />
TABLE TABLE J4 J4 JEFFERSON JEFFERSON JEFFERSON CO CO CO EMPLOYMENT EMPLOYMENT STATUS<br />
STATUS<br />
Group Group Group 2000 2000 2007 2007 Percent<br />
Percent Percent<br />
Percent<br />
Change<br />
Change Total Total<br />
Total<br />
Population 16 & over 165,347 165,347<br />
100.0<br />
In labor 115,071 69.6<br />
Not in labor 50,276 30.4<br />
Population 16 & over 115,071 115,071<br />
69.6<br />
Civilian 114,886 69.5<br />
Armed Forces 185 0.1<br />
Civilian Labor Force 114,886 69.5<br />
Employed 107,858 65.2<br />
Unemployed 7,028 4.3<br />
The average wage rate at the time of the 2007 American Fact Finder, according to U.S.<br />
Department of Commerce, Bureau of Economic Analysis was $23,787 (based on place of<br />
work). The median wage rate, based on 1999 place of residence data from the U.S.<br />
Census, was $25,332.<br />
Primary Primary Employers Employers and and Industries<br />
Industries<br />
The top industries in <strong>Jefferson</strong> <strong>County</strong>, based on 2007 data on employers that have 200<br />
employees or greater, is found in Table J5 below.<br />
TABLE TABLE TABLE J5 J5 JEFFERSON JEFFERSON CO CO TOP TOP EMPLOYERS EMPLOYERS 2007<br />
2007<br />
Company<br />
Company Employees Employees in<br />
in Business Business Type<br />
Type<br />
Name/Website<br />
Name/Website St. St. Louis<br />
Louis<br />
<strong>Jefferson</strong> Memorial<br />
Hospital<br />
Northwest R-I<br />
School District<br />
Dobbs Tire and Auto<br />
Centers Inc<br />
<strong>Jefferson</strong> <strong>County</strong><br />
LMC Industries<br />
Hillsboro School<br />
Distirict<br />
1,200 Health Care<br />
873 Education<br />
700 Service<br />
550 Government<br />
400 Manufacturing<br />
390 Education<br />
13
14<br />
TABLE TABLE J5 J5 JEFFERSON JEFFERSON CO CO CO TOP TOP EMPLOYERS EMPLOYERS 2007 2007<br />
2007<br />
Company<br />
Company Employees Employees in<br />
in Business Business Type Type<br />
Type<br />
Name/Website<br />
Name/Website St. St. Louis<br />
Louis<br />
Sinclair and Rush,<br />
Arnold Plant<br />
Windsor School<br />
Distict<br />
360 Manufacturing<br />
350 Education<br />
Table J6 Employment by Industry – 2007 Percentage<br />
Agriculture, Mining 0.50<br />
Construction 10.40<br />
Trade, Transp., Utilities 22.70<br />
Manufacturing 16.60<br />
Public Administration 2.80<br />
Financial services 5.10<br />
Information 2.70<br />
Education and Health 16.50<br />
Leisure and Hospitality 7.20<br />
Professional Bus. Services 5.80<br />
Other services 9.60<br />
Acc Access Acc Access<br />
ess to Employment; Incommuting and Outcommuting<br />
<strong>Jefferson</strong> <strong>County</strong> – Section 1<br />
Approximately twice as many <strong>Jefferson</strong> <strong>County</strong> citizens commuted to work outside their<br />
county of residence, as compared to citizens that worked within the county. According to<br />
the 2007 Census, 73.5% of individuals worked within their county of residence, and 26.5<br />
percent worked outside of their county of residence. See Table J7 below.<br />
TABLE TABLE J7 J7 JEFFERSON JEFFERSON CO CO COMMUTING COMMUTING WORK WORK<br />
WORK<br />
Group Group 2000 2000 2007 2007 Change Change Percent<br />
Percent<br />
Total<br />
Total<br />
Workers 16 &<br />
over<br />
Car, truck,<br />
van, alone<br />
98,030 104,574 6.7 100.0<br />
82,666 87,626 6.0 83.8<br />
Carpool/public 11,929 11,889 -0.3 11.4<br />
Walk 205 184 -10.2 0.2<br />
Other 801 1,177 46.9 1.1<br />
Work at home 1,149 2,862 149.1 2.7
A Regional Overview All-Hazard Mitigation Plan<br />
Codes/Regulations Codes/Regulations for for Building, Building, Stormwater, Stormwater, Fire, Fire, Zoning<br />
Zoning<br />
http://www.jeffcomo.org/BuildingCode.aspx?nodeID=BuildingDivision<br />
Following are Codes in effect for <strong>Jefferson</strong> <strong>County</strong>, which can be found for free at the<br />
International Code <strong>Council</strong>’s website:<br />
International Residential Code 2003<br />
International Building Code 2003<br />
International Fire Code 2003<br />
International Mechanical Code 2003<br />
International Energy Code 2003<br />
International Plumbing Code 2003<br />
International Private Sewage System Disposal Code 2003<br />
National Electric Code 2002<br />
Existing Existing Community Community Plans<br />
Plans<br />
The Planning Division within the Department of Land Use, Development and Code<br />
Enforcement conducts the planning efforts for the county government primarily in the area<br />
of land use, but increasingly in the areas of infrastructure and public services. The Division<br />
maintains and implements the <strong>County</strong>'s Zoning Ordinance. This service may include<br />
information on permitted uses for a specific piece of property, building setbacks, current<br />
zoning, and information on processes available to change zoning. This service is generally<br />
paid for by the citizens of <strong>Jefferson</strong> <strong>County</strong> as part of the one-half cent sales tax collected<br />
for general government operations. The Division conducts numerous research efforts on<br />
countywide issues as well as on site-specific issues. This research may include<br />
environmental analyses, project feasibility studies, and reviews of project proposals.<br />
The Planning Division is organized into three sections, each of which reports to the<br />
Manager of the Planning Division. The Current Planning Section is responsible for daily<br />
operations including planning and zoning issues and proposed development. The second<br />
section is the Comprehensive Planning Section and is responsible for long-range planning<br />
functions including watershed management plans, the Master Plan and other special area<br />
or functional plans. The third section is the Technical Operations, which is responsible for<br />
technical operations and inspection efforts of the Division. The Planning Division produces<br />
plans and reports, the Comprehensive Master Plan, program guides and demographics,<br />
maps and statistics. Planning documents released to date include <strong>Jefferson</strong> <strong>County</strong>’s<br />
Master Plan, Rock Creek Watershed Management Plan, <strong>Jefferson</strong> <strong>County</strong> Transportation<br />
Mobility Plan, <strong>Jefferson</strong> <strong>County</strong> Transit Needs Study and the <strong>Jefferson</strong> <strong>County</strong> Economic<br />
Development Plan.<br />
15
16<br />
<strong>Jefferson</strong> <strong>County</strong> – Section 1<br />
Land Land Use Use Information<br />
Information Information (most (most current current information information in in accordance accordance accordance wit with wit with<br />
h EW <strong>Gateway</strong>) <strong>Gateway</strong>)<br />
<strong>Gateway</strong>)<br />
Land use in <strong>Jefferson</strong> <strong>County</strong>, per EWG data is divided into the following categories:<br />
residential (35,753 acres) commercial (2,491 acres), industrial (2,379 acres), public (4,137<br />
acres), recreational (2,932 acres), transportation, and undeveloped (farmland with 376,217<br />
acres). Refer to Figure J6 below that depicts the land use for <strong>Jefferson</strong> <strong>County</strong> (according<br />
to <strong>Jefferson</strong> <strong>County</strong> Planning).<br />
FIGURE FIGURE J6 J6 JEFFERSON JEFFERSON COUNTY COUNTY LAND LAND LAND USE USE MAP<br />
MAP<br />
Source: <strong>Jefferson</strong> <strong>County</strong> Planning
A Regional Overview All-Hazard Mitigation Plan<br />
Development Development Trends Trends and and and Annexation<br />
The population of <strong>Jefferson</strong> <strong>County</strong> tripled from 1950 to 1970, with 16.9 percent of the<br />
residents living in incorporated areas. In 1990, the population had increased to 171,380<br />
with 27 percent of the residents living in incorporated areas. The next 25 years are<br />
projected to see a continuation of the growth trend in <strong>Jefferson</strong> <strong>County</strong>. The county will<br />
likely see an increase of population of 11 percent or 22,000 people over the next 10 years<br />
and an increase of almost 28 percent over the next 25 years. <strong>Jefferson</strong> <strong>County</strong> will likely<br />
experience less growth than St. Charles <strong>County</strong>, but more than St. Louis <strong>County</strong>. With the<br />
steady increase in population, the county is faced with ever-increasing environmental<br />
demands. The <strong>Jefferson</strong> <strong>County</strong> Soil, Water Conservation District, <strong>Jefferson</strong> Co Department<br />
of <strong>County</strong> Services, and Code Enforcement are assisting with identifying and addressing<br />
problems related to the environment.<br />
The economy in <strong>Jefferson</strong> <strong>County</strong> has improved, as indicated by a growing labor force,<br />
increased employment opportunities and lower unemployment rates. Growth in residential<br />
and commercial building permits has also helped the county prosper. While the rest of the<br />
state has been in a recession, <strong>Jefferson</strong> <strong>County</strong> has had good residential growth.<br />
Residential building permits for 2001 were up over 15 percent. This growth is expected to<br />
continue. <strong>Jefferson</strong> <strong>County</strong> plans to continue responsible growth patterns, while keeping a<br />
unique identity for <strong>Jefferson</strong> <strong>County</strong>. In addition, the need for a variety of housing options<br />
and concerns exist about increased amount of mobile homes in the county.<br />
Moreover, growth in commercial building permits has helped to balance the economics of<br />
the county. Since 1998, commercial building permits have continued to rise, increasing<br />
108 percent from 1998 to 2001. In 1998, the construction cost of the commercial permits<br />
was 4.6 million dollars, and a major benefit was the size of those commercial operations.<br />
In 2001 the construction costs were 24.1 million dollars, an increase of almost 425<br />
percent.<br />
The local labor market is helping fuel increases in residential permits, and especially<br />
commercial building permits. <strong>Jefferson</strong> <strong>County</strong> will continue to strive to provide more<br />
employment opportunities within the county, for almost 67 percent of the workforce has<br />
jobs outside the <strong>County</strong>. Polls on economic development indicated that efforts should be<br />
made to attract commercial/retail development and to expand the tax base and promote<br />
economic growth. The poll also indicates that growth needs to be planned and financially<br />
responsible for county and that some residents do not want Tax Increment Financing to<br />
assist developers.<br />
An issue of concern in the county is the lack of communication among different<br />
jurisdictions, infrastructure districts (sewer and water) and community service providers<br />
(police, fire and ambulance), as well as a low level of communication/coordination among<br />
the county and the other entities listed above regarding development of the county.<br />
17
18<br />
<strong>Jefferson</strong> <strong>County</strong> – Section 1<br />
The <strong>Jefferson</strong> <strong>County</strong> Master Plan has identified the following five goals pertaining to<br />
trends:<br />
1. Promote growth and development that creates a quality environment, preserves<br />
natural resources and provides community amenities. This goal will 1) include plans<br />
for phased growth in an orderly manner, 2) promote more compact settlement<br />
patterns that maintain overall low densities and preserve rural character of the<br />
county, 3) promote application of site designs that are efficient and sensitive to the<br />
environment, 4) support existing neighborhoods and develop new neighborhoods<br />
that provide quality environments, 5) provide convenient locations for goods and<br />
services, 6) provide economic and physical diversity of housing options, and 7)<br />
ensure maintenance of public safety and protection of public and private property.<br />
2. Create a housing plan for economic development to attract quality development<br />
and jobs to the county.<br />
3. Provide infrastructure and transportation that adequately services the community<br />
and new development.<br />
4. Ensure the maintenance of the environment and open space in an environmentally<br />
sensitive development, especially in large-scale development areas.<br />
5. To provide quality public awareness and high levels of education and<br />
communications regarding planning and development issues.<br />
Floodplain Floodplain Floodplain Management<br />
Management<br />
<strong>Jefferson</strong> <strong>County</strong> adopted a new ordinance on April 22, 1999, termed “The <strong>Jefferson</strong><br />
<strong>County</strong>, Missouri Flood Damage Prevention Ordinance.”<br />
The Legislature of the State of Missouri in Section 49.600 RSMo delegated the<br />
responsibility to local governmental units to adopt floodplain management regulations<br />
designed to protect, health, safety and welfare. <strong>Jefferson</strong> <strong>County</strong> adopted the ordinance to<br />
establish and maintain the community’s eligibility for participation in the National Flood<br />
Insurance Program as defined in 44 CFR 59.22(a)(3) and to meet the requirements of 44<br />
CFR 60.3(d). The ordinance applies to lands that are unincorporated and identified as<br />
numbered and unnumbered A zones. <strong>Jefferson</strong> <strong>County</strong> requires that no development shall<br />
be permitted in the zones except through the issuance of a floodplain development permit<br />
granted by the <strong>County</strong> Commission. The <strong>Jefferson</strong> <strong>County</strong> Building Official is the<br />
Floodplain Administrator.<br />
The duties of the Floodplain Administrator include: (1) review of applications for floodplain<br />
development permits to assure that federal, state and local governmental agencies have<br />
given prior approval; (2) ensure sites are safe from flooding and the floodplain<br />
development permit requirements of this ordinance have been satisfied; (3) ensure that<br />
manufactured home parks are safe from flooding; (4) issue floodplain development<br />
permits; (5) notification of adjacent communities and ensure SEMA/FEMA have been
A Regional Overview All-Hazard Mitigation Plan<br />
contacted prior to alteration or relocation of a watercourse; (6) ensure that maintenance is<br />
provided in the altered or relocated portion of the watercourse so that the flood-carrying<br />
capacity is not diminished; (7) verify and maintain records of actual elevations that the new<br />
or substantially improved non-residential structures have been floodproofed; and (8) ensure<br />
that <strong>Jefferson</strong> <strong>County</strong> Building Official obtain certification from registered professional<br />
engineer or architect when floodproofing techniques are utilized for non-residential<br />
structures.<br />
Floodplain development requires a permit with specific information including: (1) a legal<br />
description of the land; (2) description of work to be done; (3) type of use or occupancy for<br />
which work is intended; (4) assessed value of structure and fair market value; (5)<br />
identification if development is in flood fringe or floodway; (6) identification of existing<br />
base flood elevation and elevation of proposed development; and (7) include plans and<br />
signature.<br />
Provisions for flood hazard reduction includes five sections: general standards, specific<br />
standards, manufactured homes, floodway and recreational vehicles. General standards<br />
require that: (1) no development will be granted in any numbered or unnumbered A zones<br />
unless all conditions are satisfied; (2) if flood insurance studies are not available, the<br />
community will obtain and utilize flood data; (3) until a floodway is designated, no new<br />
construction will be permitted in any numbered A zone on the FIRM unless it is<br />
demonstrated that the cumulative effect of the development (and all other surrounding<br />
development) will not increase the water elevation of the base flood more than one foot;<br />
(4) all new construction, improvements and other development will require design or<br />
adequate anchorage; materials resistant to flooding; use of methods that minimize flood<br />
damage; all utility/service facilities designed and located to prevent water from<br />
entering/accumulating in the components from flooding; water supply/sanitary sewage<br />
systems designed to minimize/eliminate infiltration of floodwaters and discharges from<br />
systems into floodwaters located to avoid impairment or contamination; (5) storage,<br />
material, and equipment within special flood hazard area is prohibited, and storage of<br />
other material may be allowed if not subject to major damage by floods; (6) agricultural<br />
structures may be constructed at grade and wet-floodproofed, provided there is no human<br />
occupancy, is of single-wall design, no permanent retail, wholesale or manufacturing use<br />
and a variance has been issued; (7) accessory structures such as parking areas, not larger<br />
than 400 square feet, may be constructed at grade and wet-floodproofed, no human<br />
habitation, is of single wall design and a variance has been issued; (8) hazardous material<br />
storage and handling must be out of the special flood hazard area; and (9) a<br />
nonconforming structure may be continued, subject to: if the structure is destroyed<br />
(including through flooding), it can’t be reconstructed if the cost is more than 50 percent<br />
of the pre-damage market value of the structure.<br />
Specific standards of the floodplain ordinance requires the following: (1) new construction<br />
or substantial improvement of residential structures must have the lowest floor, including<br />
the basement, elevated to two feet above the base flood elevation. The building envelope<br />
19
20<br />
<strong>Jefferson</strong> <strong>County</strong> – Section 1<br />
must be filled to an elevation one foot above base flood elevation; (2) new construction or<br />
substantial improvement of any commercial, industrial or nonresidential structures,<br />
including manufactured homes, must have the lowest floor, including basement elevated<br />
to one foot above the base flood elevation, together with utility and sanitary facilities<br />
floodproofed so that below the base flood elevation, the structure is watertight with walls<br />
impermeable to water with structural components with the capability of resisting<br />
hydrostatics and hydrodynamic loads, an engineer must certify that the structure has met<br />
these standards; and (3) for all new construction and substantial improvements, that all<br />
fully enclosed areas below the lowest floor used only for parking of vehicles, building<br />
access, or storage in an area other than the basement must be designed to equalize<br />
hydrostatic flood forces, and the design must be certified by a registered engineer or<br />
architect.<br />
Manufactured homes to be placed within all unnumbered and numbered A zones on the<br />
community’s FIRM must be installed using methods to minimize flood damage. The<br />
homes must be elevated and anchored to resist movement. These homes must be placed<br />
on elevated permanent foundations so that the lowest floor of the home is elevated two<br />
feet above the base flood elevation and securely attached to prevent movement.<br />
Manufactured homes that are not subject to provisions of Article 4 Section C(2) of the<br />
ordinance must be elevated so that the lowest floor of the home is two feet above the base<br />
flood elevation, or the home chassis is supported by reinforced piers so that there are no<br />
less than 36 inches above the grade and securely attached.<br />
The floodplain ordinance also requires that the community select and adopt a regulatory<br />
floodway, that the community prohibit encroachments (fill, construction) in the floodway,<br />
unless it had demonstrated through standard engineering practices that the encroachment<br />
would not result in flood levels. The community, in unnumbered A zones will obtain and<br />
use base flood elevation data from sources in Article 4, Section A(2).<br />
Recreational vehicles, as stipulated in the floodplain ordinance, can only be placed on sites<br />
within unnumbered and numbered A zones on the community’s FIRM for fewer than 180<br />
consecutive days, and fully licensed for use or meeting the permitting, elevating and<br />
anchoring requirements for manufactured homes.<br />
The floodplain damage prevention ordinance has variance procedures and conditions for<br />
approving floodplain management variances, for agricultural structures, accessory<br />
structures, and penalties for violation of the ordinance.<br />
<strong>Jefferson</strong> <strong>County</strong> has regulations to help control stromwater runoff through the <strong>County</strong><br />
land Disturbance Ordinance and The Erosion Sediments Control/Design Manual.<br />
Wetlands Wetlands Issues<br />
Issues<br />
The Sierra Club has provided wetlands comments on various projects within <strong>Jefferson</strong><br />
<strong>County</strong>. Included in these comments were concerns about the loss of habitat over 14 miles
A Regional Overview All-Hazard Mitigation Plan<br />
of new four-lane highway through rural farms, forests and streams associated with the<br />
Highway 21 project in <strong>Jefferson</strong> <strong>County</strong>.<br />
The United States Corps of Engineers, St. Louis District, issues Nationwide Permits for<br />
wetlands in their jurisdiction within <strong>Jefferson</strong> <strong>County</strong>. In accordance with the St. Louis<br />
District, and District-Designated Waters: for any discharge or excavation activity requiring<br />
authorization, proposed under NWPs 39, 41, 42 and 43, in any ephemeral, intermittent,<br />
and perennial streams in the following Missouri watersheds, the permittee must notify the<br />
District Engineer in accordance with the "Notification" general condition 13 (Federal<br />
Register, 67 FR 2090-2092). This pertains to the following watersheds in <strong>Jefferson</strong> <strong>County</strong>:<br />
Saline/Sugar/Romaine Creeks, Rock Creek, Dulin/Bourne/Heads/Bear Creeks, La Barque<br />
Creek, Glaize Creek, and Joachim/Sandy Creeks.<br />
National National Flood Flood Insurance Insurance (NFIP) (NFIP) (NFIP) Participation<br />
Participation<br />
The National Flood Insurance Policy member number for <strong>Jefferson</strong> <strong>County</strong> is 290808.<br />
Table Table J8 J8 NATIONAL FLOOD INSURANCE PROGRAM PROGRAM- PROGRAM<br />
MUNICI PARTICIPATING<br />
COMMUNITY COMMUNITY NAME NAME NAME INIT INIT FHBM FHBM INIT INIT FIRM FIRM FIRM CURR CURR EFF EFF EMERG EMERG DAT<br />
DAT<br />
ARNOLD, CITY OF 06/28/74 01/16/80 04/05/06 01/16/80<br />
BYRNES MILL, CITY OF 07/29/80 05/16/83 04/05/06 05/16/83<br />
CRYSTAL CITY,CITY OF 03/15/74 09/01/77 04/05/06 09/01/77<br />
DE SOTO, CITY OF 05/26/72 04/05/06 05/26/72<br />
FESTUS,CITY OF 10/18/74 02/14/76 04/05/06 02/14/76<br />
HERCULANEUM, CITY OF 05/17/74 05/15/78 04/05/06 05/15/78<br />
HILLSBORO, CITY OF 10/22/76 04/01/84 04/05/06 04/01/04<br />
JEFFERSON COUNTY* 07/29/80 05/16/83 04/05/06 05/16/83<br />
KIMMSWICK, CITY OF 11/01/74 01/06/82 04/05/06 01/06/82<br />
PEVELY, CITY OF 10/29/76 09/18/85 04/05/06 09/18/85<br />
SCOTSDALE, TOWN OF 05/16/83 04/05/06 10/21/02<br />
CEDAR HILL LAKES, VILLAGE OF 04/05/06 04/05/06 04/05/07<br />
MUNIC MUNICIPALITIES MUNIC MUNIC IPALITIES NOT NOT PARTICIPATING<br />
PARTICIPATING<br />
Cedar Hills Lake - sanction date April 5, 2007<br />
Environmental Environmental Concerns<br />
Concerns<br />
The recently completed “<strong>Jefferson</strong> <strong>County</strong> Wastewater Management Report” identifies as a<br />
concern septic system failure, including soil types within portions of the county that are not<br />
conducive for on-site wastewater treatment systems and their leach-ate fields. Through<br />
the growth and development of strategies identified in the Master Plan, many of the onsite<br />
wastewater treatment system problems can be remedied by the use of public systems<br />
that are more reliable and longer lasting. Sensitivity has been given to topographic<br />
considerations because they relate to the health of the watersheds and watercourses in the<br />
region.<br />
21
22<br />
<strong>Jefferson</strong> <strong>County</strong> – Section 1<br />
Air pollution is a major concern in the St. Louis metropolitan area. Numerous initiatives<br />
continue to improve air quality including: St. Louis Community Air Project, <strong>Gateway</strong> Clean<br />
Air Program, and the St. Louis Regional Clean Air Partnership. Sixteen air qualitymonitoring<br />
stations exist within the metropolitan area that monitors six air pollutants:<br />
carbon monoxide, sulfur dioxide, particulates, lead, carbon dioxide and ozone. The Air<br />
Quality Index (AQI) is a standardized method of reporting air pollution values. Over the<br />
past 25 years, the air quality in St. Louis has greatly improved, and, through the<br />
introduction of controls, ozone levels have significantly decreased.<br />
In 2002, the St. Louis Metropolitan area (Missouri-Illinois) reached a significant air quality<br />
milestone. Based on 2000-2002 air quality monitoring data, the area attained the onehour<br />
standard. On May 12, 2003, the United States Environmental Protection Agency<br />
(USEPA) designated the area as in maintenance of the one-hour standard. However, this is<br />
only one step on the road to cleaner air in the St. Louis region. The area must soon meet<br />
the eight-hour ozone standard, as well as the fine particulate standard.<br />
Protection and preservation of natural environment is important. This includes air quality,<br />
water quality, streams and topography. Stormwater runoff and land erosion is a<br />
significant issue in <strong>Jefferson</strong> <strong>County</strong>. <strong>Jefferson</strong> <strong>County</strong> plans to prepare land development<br />
policies and regulations to address erosion during land development and construction<br />
process.<br />
A number of hazardous waste facilities are located in <strong>Jefferson</strong> <strong>County</strong>. These sites include:<br />
• Doe Run Company resource recovery facility, located in Herculaneum<br />
• Dow Company hazardous waste facility, located in Pevely, Missouri<br />
• British Nuclear Fuels Ltd., <strong>West</strong>inghouse's parent company, owns a nuclear fuel<br />
plant in Hematite, Missouri; potential for chemical solvents and possible traces of<br />
technetium-99, a radioactive fission product thought to be present.<br />
Endangered Endangered Species, Species, Historic Historic Properties/Districts, Properties/Districts, Arch Archaeological Arch aeological Sites<br />
Sites<br />
The federal and state listing of endangered species in <strong>Jefferson</strong> <strong>County</strong> includes the Pink<br />
Mucket, Gray Bat, Indiana Bat, Ozark Big Eared Bat, Flathead Chub, Crystal Darter, Bald<br />
Eagle, <strong>East</strong>ern Prairie Fringed Orchid, Peregrine Falcon, Northern Harrier, Lake Sturgeon<br />
and the Red-Cockaded Woodpecker.<br />
In accordance with the National Historic Preservation Act of 1966, the Archaeological and<br />
Historic Preservation Act of 1974 and the Antiquities Act of 1906, information regarding<br />
specific locations of archaeological sites cannot be released. The Missouri State Historic<br />
Preservation Office (SHPO) within the Outreach Office of MDNR is in the process of setting<br />
up a GIS database that will house archaeological sites in Missouri. Individuals in need of<br />
information may contact the SHPO for information on specific sites. Reference for further
A Regional Overview All-Hazard Mitigation Plan<br />
information can be made to Missouri Department of Natural Resources, 1-800-361-4827<br />
or their website at http://www.dnr.mo.gov/shpo/homepage.htm. The Missouri<br />
Archaeological Society’s website is located at http://coas.missouri.edu/mas/ and provides<br />
reference documents on archaeological sites in Missouri.<br />
There are ten sites listed on the national register of historic properties in <strong>Jefferson</strong> <strong>County</strong>.<br />
A list of these are found below and can also be found on the Missouri state website at<br />
http://www.dnr.mo.gov/shpo/<strong>Jefferson</strong>.htm.<br />
Beaumont-Tyson Quarry District, address restricted (10/10/74) (also in St. Louis <strong>County</strong>)<br />
Boemler Archaeological District, address restricted (10/01/74)<br />
Boland Archaeological District, address restricted (10/01/74)<br />
Fletcher, Thomas C., House, Elm St. between 1st & 2nd Sts., Hillsboro (11/19/74)<br />
Greystone-Meissner, Gustave, House, NE of Pevely off US 61/67 (12/31/74); additional<br />
information (3/11/85)<br />
Kimmswick Bone Bed, Mastodon State Historic Site, NW of Imperial, Kimmswick vicinity<br />
(11/05/80)<br />
Leight, Valentine, General Store, 4566 Main St., House Springs (8/18/92)<br />
Moder Archaeological District, address restricted (10/16/74)<br />
Sandy Creek Covered Bridge State Historic Site, 5 mi. N of Hillsboro off US 21 (7/08/70)<br />
Windsor Harbor Road Bridge, Windsor Harbor Rd. at Rock Cr., Kimmswick (9/08/83)<br />
Identified Identified Assets<br />
Assets<br />
Inventory Inventory Inventory of of Critical/Key/Essential Critical/Key/Essential Facilities<br />
Facilities<br />
Medical Medical Facilities<br />
Facilities<br />
Relevant facilities include medical facilities, schools, long-term care facilities, day care<br />
centers and government structures. These facilities represent resources for care and shelter<br />
as well as populations requiring a higher level of care and installations critical to<br />
community services.<br />
The hospitals and other facilities that service <strong>Jefferson</strong> <strong>County</strong> are included in Table J9A.<br />
Physician’s offices, clinics, and urgent care centers within the city are too numerous to list<br />
here. See Figures J7 and J8 located in the back of the Technical Appendix.<br />
Table Table J9A J9A JEFFERSON JEFFERSON COUNTY COUNTY MEDICAL MEDICAL FACILITIES<br />
FACILITIES<br />
Hospitals Hospitals and and Other Other Facilities Facilities Location Number Number of of Beds<br />
<strong>Jefferson</strong> Memorial Hospital 1400 US Hwy 61, Festus, MO 225<br />
Unity Health Arnold Care Ctr 3619 Richardson Square N.A.<br />
Community Treatment N.A N.A.<br />
Disability Support Systems N.A N.A.<br />
<strong>Jefferson</strong> <strong>County</strong> Support for N.A N.A.<br />
23
24<br />
Table Table J9A J9A JEFFERSON JEFFERSON JEFFERSON COUNTY COUNTY MEDICAL MEDICAL MEDICAL FACILITIES<br />
FACILITIES<br />
<strong>Jefferson</strong> <strong>County</strong> – Section 1<br />
Hospitals Hospitals and and Other Other Facilities Facilities<br />
the Handicapped<br />
Location Number Number of of Beds<br />
<strong>Jefferson</strong> <strong>County</strong> Health Dept N.A N.A.<br />
Long Long Term Term Care Care Facilities<br />
Facilities<br />
Long-term care facilities are more likely to be impacted in a disaster. These facilities fulfill a<br />
range of needs including retirement, assisted living, intermediate and long term continuing<br />
care. Residents may have mobility and/or cognitive issues that present special problems.<br />
Refer to Table J9B below.<br />
TABLE TABLE J9B J9B LONG LONG TERM TERM CARE CARE FACILTIES FACILTIES IN IN JEFFERSON JEFFERSON COUNTY<br />
COUNTY<br />
FACILITY FACILITY<br />
ADDRESS ADDRESS<br />
CITY CITY BEDS BEDS # # CAP CAP<br />
CAP<br />
COLONIAL HOUSE OF FESTUS I 500 SUNSHINE DRIVE FESTUS 34 No<br />
BAISCH NURSING CENTER 3260 BAISCH DRIVE DESOTO 18 No<br />
BAISCH NURSING CENTER 3260 BAISCH DRIVE DESOTO 61 No<br />
COLONIAL HOUSE<br />
122 EAST PRATT STREET,<br />
PO BOX 638<br />
DESOTO 27 No<br />
CORI MANOR HEALTHCARE &<br />
REHABILITATION CENTER<br />
560 CORISANDE HILL<br />
ROAD<br />
FENTON 22 No<br />
CORI MANOR HEALTHCARE &<br />
REHABILITATION CENTER<br />
560 CORISANDE HILL<br />
ROAD<br />
FENTON 124 No<br />
FESTUS MANOR<br />
627 WESTWOOD DRIVE<br />
SOUTH<br />
FESTUS 120 No<br />
FESTUS REST HOME<br />
705 MOORE STREET, PO<br />
BOX 51<br />
FESTUS 20 No<br />
SOUTH COUNTY NURSING HOME, INC<br />
1101 WEST OUTER 21<br />
ROAD<br />
ARNOLD 153 No<br />
TWIN CITY RESIDENTIAL CARE<br />
#1 HOLDING LANE, PO<br />
BOX 92<br />
HERCULANEUM 48 No<br />
ARBOR PLACE OF FESTUS, INC 12827 HIGHWAY TT FESTUS 81 Yes<br />
COLONIAL HOUSE OF FESTUS II 129 GRAY STREET FESTUS 25 No<br />
STRILER'S CARE CENTER<br />
134 GRAY STREET, PO<br />
BOX 356<br />
FESTUS 20 No<br />
SCENIC NURSING AND REHABILITATION<br />
CENTER, LLC<br />
1333 SCENIC DRIVE HERCULANEUM 23 No<br />
SCENIC NURSING AND REHABILITATION<br />
CENTER, LLC<br />
1333 SCENIC DRIVE HERCULANEUM 166 Yes<br />
MY PLACE RESIDENTIAL CARE 23 NORTH SIXTH STREET FESTUS 44 No<br />
WOODLAND MANOR NURSING CENTER 100 WOODLAND COURT ARNOLD 178 No<br />
CEDAR RIDGE MANOR 6400 THE CEDARS COURT CEDAR HILL 150 No<br />
VILLAS, THE 1550 VILLAS DRIVE DESOTO 80 No<br />
VILLAS, THE 1550 VILLAS DRIVE DESOTO 51 No<br />
MAGNOLIA HOME, THE 204 GRAND AVENUE FESTUS 12 No<br />
AUTUMN RIDGE<br />
300 AUTUMN RIDGE<br />
DRIVE<br />
HERCULANEUM 69 No<br />
LOVING CARE REST HOME, INC 1107 CLARKE STREET DESOTO 47 No
A Regional Overview All-Hazard Mitigation Plan<br />
TABLE TABLE J9B J9B LONG LONG TERM TERM CARE CARE FACILTIES FACILTIES IN IN JEFFERSON JEFFERSON COUNTY<br />
COUNTY<br />
FACILITY FACILITY<br />
ADDRESS ADDRESS<br />
CITY CITY BEDS BEDS # # CAP CAP<br />
CAP<br />
FOUNTAINBLEAU NURSING CENTER<br />
1349 HIGHWAY 61, PO<br />
BOX 700<br />
FESTUS 16 No<br />
FOUNTAINBLEAU NURSING CENTER<br />
1349 HIGHWAY 61, PO<br />
BOX 700<br />
FESTUS 97 Yes<br />
HILLCREST CARE CENTER, INC 1108 CLARKE STREET DESOTO 120 No<br />
KEATON CENTER 120 NORTH MILL STREET FESTUS 24 No<br />
COLONIAL HOUSE OF CRYSTAL CITY 26 MISSISSIPPI AVENUE CRYSTAL CITY 52 No<br />
CRYSTAL OAKS<br />
1500 CALVARY CHURCH<br />
ROAD, PO BOX 680<br />
CRYSTAL OAKS 60 Yes<br />
CRYSTAL OAKS<br />
1500 CALVARY CHURCH<br />
ROAD, PO BOX 680<br />
CRYSTAL CITY 99 Yes<br />
Day Day Day Care Care Facilities<br />
Facilities<br />
Day care centers represent yet another population that needs special consideration,<br />
especially during a disaster situation. Most day care centers cater to children ages two to<br />
five, although some day care centers serve older adults. Those facilities represent<br />
specialized mitigation needs. The following tables show a current population in schools,<br />
day care, preschools and residential facilities. This list of schools and other facilities is<br />
deemed “Facilities Requiring Special Consideration” for evacuation purposes in the<br />
<strong>Jefferson</strong> <strong>County</strong> Emergency Operations Plans. Refer to Table J10 below.<br />
FACILITY FACILITY NAME NAME<br />
TABLE TABLE J10 J10 JEFFERSON JEFFERSON JEFFERSON COUNTY COUNTY CHILDCARE CHILDCARE CENTERS<br />
CENTERS<br />
LOCATION LOCATION<br />
CAPACITY<br />
CAPACITY<br />
A CHILD'S PLACE INC. 8325 OLD LEMAY FERRY RD 50<br />
A PLACE LIKE HOME LLC 6008 HIGHWAY B 60<br />
ABC PRESCHOOL OF ARNOLD 2315 LONEDELL RD 49<br />
ADVENTURES IN LEARNING -DESOTO 1107 CLARKE ST 126<br />
ALL ABOARD LEARNING CENTER 544 KAREN DR 41<br />
ALPHA AND OMEGA CHILD CARE II 429 MAPLE LN 97<br />
ANTONIA HEAD START 6283 OLD LEMAY FERRY RD 27<br />
BRIGHT BEGINNING LEARNING CENTER 1549 W MAIN ST 124<br />
CHILDREN'S HOUSE OF HILLSBORO 603 MAPLE ST 50<br />
CHILDRENS LEARNING CENTER 2713 CAPETOWN VILLAGE RD 86<br />
CHILDTIME LEARNING CENTER 2130 MICHIGAN AVE 143<br />
CHILDTIME LEARNING CENTER 17 MUNICIPAL DR 144<br />
CREATIVE EXPRESSIONS LEARNING CENTER 2862 SECKMAN RD 100<br />
DESOTO HEAD START 1812 ROCK ROAD 20<br />
FENTON HEAD START 1201 SALINE RD 20<br />
FENTON PLAY AND LEARN 1051 OLD GRAVOIS RD 191<br />
FIRST STEP CHILD DEVELOPMENT CENTER 4215 OLD STATE ROUTE 21 102<br />
25
26<br />
<strong>Jefferson</strong> <strong>County</strong> – Section 1<br />
FACILITY FACILITY NAME NAME<br />
TABLE TABLE J10 J10 JEFFERSON JEFFERSON COUNTY COUNTY CHILDCARE CHILDCARE CENTERS<br />
CENTERS<br />
LOCATION LOCATION<br />
CAPACITY<br />
CAPACITY<br />
FOR KIDS ONLY CHILD CARE 5432 B HIGHWAY 61 67 99<br />
HEMATITE HEAD START 3680 HILLSBORO HEMATITE RD 60<br />
HIGH RIDGE LEARNING CENTER 3028 HIGH RIDGE BLVD 32<br />
HOUSE SPRINGS HEAD START 4869 SCOTTSDALE 30<br />
ITS FUN 2 LEARN 3225 BAISCH DR 60<br />
JEFFERSON COLLEGE CHILD DEVELOPMENT CENTER 1000 VIKING DR 100<br />
JEFFERSON COUNTY TELEGRAPH KIDS KORNER 1265 DOOLING HOLLOW RD 50<br />
JEFFERSON R SEVEN PRESCHOOL 2400 R-7 SCHOOL RD 20<br />
JEFFERSON R7 KIDS KORNER 2400 HWY 61 40<br />
KID'S COUNTRY 1645 MARRIOTT 60<br />
KIDS KLUBHOUSE AND ACTIVITY CENTER LLC 38 FOX VALLEY CENTER 51<br />
LA PETITE ACADEMY 3607 RICHARDSON SQ 126<br />
LIL THINKERS\BIG THINKERS, INC 102 FOURTH STREET 113<br />
MAPLE MEADOWS LEARNING CENTER 510 MAPLE MEADOWS 30<br />
MINI SCHOOL OF JEFFERSON COUNTY INC 6434 UPPER BYRNES MILL RD 128<br />
MISS CINDY'S LEARNING CENTER 1757 BIG BILL RD 58<br />
MOMMA BEAR'S CHILD CARE 8085 HIGHWAY 30 45<br />
NORTHWEST PRESCHOOL PROGRAM 6992 RIVERMONT TRL 20<br />
PRIME TIME CHILD CARE ACADEMY 5181 WARREN RD 98<br />
THE GINGERBREAD HOUSE DAYCARE 2000 EL LAGO AVE STE 7 97<br />
THE GODDARD SCHOOL 3228 MILLER RD 145<br />
THE PLAYGROUND CHILD CARE CENTER LLC 1302 KENNER ST 56<br />
WARM HEARTS CHILD CARE CENTER LLC 4235 GRAVOIS RD 60<br />
WEE CARE LEARNING CENTER 821 AMERICAN LEGION DR 252<br />
YMCA JEFFERSON COUNTY ATHENA ELEMENTARY 3775 ATHENA SCHOOL RD 20<br />
YMCA JEFFERSON COUNTY BRANCH FESTUS 1515 MID MEADOW LN 60<br />
YMCA JEFFERSON COUNTY BRANCH OUR LADYS 1550 ST MARY'S LN 50<br />
YMCA JEFFERSON COUNTY CRYSTAL CITY ELEMENTARY 600 MISSISSIPPI 20<br />
YMCA OF JEFFERSON COUNTY DUNKLIN R-V 300 COUNTY RD 50<br />
YMCA OF JEFFERSON COUNTY HILLSBORO 101 LEON HALL PKY 50<br />
YOUNG HEARTS LEARNING CENTER LLC 1420 GRAVOIS RD 77<br />
BEST FRIENDS LEARNING CENTER LLC 3653 GAIL DR 10<br />
BRADLEY, PATRICIA 2528 MEDFORD LN 10<br />
BURKARD, CAROL 929 NATCHEZ TRCE 10<br />
DITTER, MARY F 2205 PARKWOOD CT 10<br />
EMERSON, CATHERINE 132 SOUTHMOORE 10<br />
ENNIS, GLENDA 5888 TERRACE 10<br />
FORD, DEBORAH 2129 SUNSWEPT LN 10<br />
GANNON, PAULA 714 EMIL DR 10<br />
HASKINS, SUSAN JEANNE 105 LAVERNEL LN 10<br />
HODA'S MONTESSORI LLC 8 ENCHANTED FOREST DR 10<br />
MALIN, DEBORAH 1855 BUENA VISTA DR 10<br />
NUGENT, TINA 1109 ETHEL CT 10<br />
SCHMITT, CONNIE SUE 815 VINE 10
A Regional Overview All-Hazard Mitigation Plan<br />
FACILITY FACILITY NAME NAME NAME<br />
TABLE TABLE J10 J10 JEFFERSON JEFFERSON COUNTY COUNTY CHILDCARE CHILDCARE CENTERS<br />
CENTERS<br />
LOCATION LOCATION LOCATION<br />
CAPACITY<br />
CAPACITY<br />
SCHUBERT, CONSTANCE 1018 CRABAPPLE DR 10<br />
SHELBY, HOLLY A 1520 PREHISTORIC HILL DR 10<br />
SHOWERS, KATHRYN 2774 PINEBROOK DR 10<br />
TEDDY BEAR DAY CARE 106 DELLA DR 10<br />
THE LEARN & PLAY CHILDCARE CENTER 2278 CASTLEGATE DR 10<br />
TIGHE, MARGOT M 4933 FERRIS CT 10<br />
VANCE, JANE ELLEN 3163 OLD HWY A 10<br />
WATSON, JENNIFER 4081 STONEY CRK 10<br />
COUNTRY KIDS LLC 3318 HWY 61 20<br />
DESOTO DAYCARE INC 1733 KOCH LN 20<br />
TINY TOWN CHILD CARE 13197 TIMBERWOOD LN 20<br />
ANGELS IN JOYLAND 450 BAILEY RD<br />
APPLE TREE LEARNING CENTER 365 SALINE RD 0<br />
CHILDREN OF DESTINY CHILD CARE 15533 GAMEL CEMETERY RD<br />
CHRIST THE VINE LUTHERAN SCHOOL 1615 VINE SCHOOL RD<br />
FELLOWSHIP BAPTIST PRESCHOOL 2735 HIGH RIDGE BLVD 0<br />
GOOD SHEPHERD LUTHERAN PRESCHOOL 2211 TENBROOK RD 0<br />
HOPE LUTHERAN EARLY CHILDHOOD CENTER 2308 GRAVOIS RD<br />
IMMANUEL LUTHERAN CHRISTIAN CHILDCARE AND PRESCHOOL 19 N 3RD ST 0<br />
LITTLE SCHOLARS PRESCHOOL 409 DEER CROSSING DR<br />
MUSTARD SEED PRESCHOOL 6439 HIGHWAY 61-67 0<br />
NEW HOPE UNITED METHODIST CHURCH 3921 JEFFCO BLVD<br />
OLYMPIAD GYMNASTICS 215 N MILL ST<br />
PEACE TABERNACLE DAYCARE 11096 HIGHWAY 21 0<br />
REDEEMER PRESCHOOL 1620 NEW BOYD ST<br />
ST MARTINS LEARNING CENTER 7890 DITTMER RIDGE RD 0<br />
URSULINE DAY CARE CENTER 201 BRIERTON LN 0<br />
VALLEY VIEW DAY CARE 2010 SECKMAN RD<br />
VICTORY CHILDRENS CENTER 1 VICTORY DR 0<br />
YMCA OF JEFFERSON COUNTY LIL RASCALS PRESCHOOL 1303 YMCA DR<br />
Schools<br />
Schools<br />
More than 43,211 students attend various preschool, public and parochial elementary,<br />
middle, and high schools and one community college in <strong>Jefferson</strong> <strong>County</strong>. There are 11<br />
public school districts in <strong>Jefferson</strong> <strong>County</strong>. Schools represent yet another population that<br />
needs special consideration, especially in a disaster situation. Most schools have students<br />
that range from five through the age of 25. The following Figure J9 and Tables J11A and<br />
J11B show a current population in schools and location of the districts. Some of the<br />
districts overlap into neighboring counties. This list of schools and other facilities is<br />
deemed “Facilities Requiring Special Consideration” for evacuation purposes in the<br />
<strong>Jefferson</strong> <strong>County</strong> Emergency Operations Plans.<br />
27
28<br />
<strong>Jefferson</strong> <strong>County</strong> – Section 1<br />
FIGURE FIGURE J9 J9 JEFFERSON JEFFERSON COUNTY COUNTY PUBLIC PUBLIC SCHOOL SCHOOL DISTRICTS DISTRICTS<br />
DISTRICTS<br />
TABLE TABLE J11A J11A J11A JEFFERSON JEFFERSON CO. CO. PRIVATE PRIVATE PRIVATE SCHOOLS SCHOOLS ADDRESS ADDRESS<br />
ENROLLMENT<br />
ENROLLMENT<br />
CENTRAL BAPTIST CHRISTIAN ACADEMY 1812 E MCCARTY STREET 36<br />
HELIAS HIGH SCHOOL 1305 SWIFTS HIGHWAY 895<br />
IMMACULATE CONCEPTION SCHOOL 1208 E MCCARTY STREET 501<br />
IMMANUEL LUTHERAN SCHOOL 8231 TANNER BRIDGE ROAD 97<br />
KIM SCHOOL MONTESSORI 1022 TARA ROAD 31<br />
KINDERGARTEN CONNECTION 623 OHIO STREET 41<br />
MOREAU MONTESSORI SCHOOL 900 MOREAU DRIVE 43<br />
ST FRANCIS XAVIER SCHOOL 7307 ROUTE M 195<br />
ST JOSEPH CATHEDRAL SCHOOL 2303 WEST MAIN STREET 464<br />
ST MARTIN ELEMENTARY SCHOOL 7206 SAINT MARTINS BOULEVARD 226<br />
ST PETER ELEMENTARY SCHOOL 314 W HIGH STREET 516<br />
ST STANISLAUS SCHOOL 6410 ROUTE W 310<br />
TRINITY LUTHERAN EARLY CHILDHOOD 809 SWIFTS HIGHWAY 46<br />
TRINITY LUTHERAN SCHOOL 812 STADIUM BOULEVARD 327
A Regional Overview All-Hazard Mitigation Plan<br />
Government Government Facilities<br />
Facilities<br />
TABLE TABLE J11B J11B JEFFERSON JEFFERSON CO CO CO PUBLIC PUBLIC SCHOOL SCHOOL DISTR DISTRICTS DISTR ICTS<br />
PUBLIC PUBLIC SCHOOL SCHOOL DISTRICTS DISTRICTS LOCATION LOCATION STUDENTS<br />
STUDENTS<br />
Northwest R-I 2843 Community Ln 7066<br />
Grandview R-II 11470 Hwy C 829<br />
Hillsboro R-III 20 Hawk Dr 3691<br />
Dunklin R-V 497 Joachim 1342<br />
Festus R-VI 1515 Mid-Meadow Ln 3103<br />
<strong>Jefferson</strong> Co. R-VII 1250 Dooling Hollow Rd 751<br />
Sunrise R-IX 4485 Sunrise School Rd 326<br />
Windsor C-1 6208 Hwy 61-67 3017<br />
Fox C-6 745 Jeffco Blvd 11833<br />
Crystal City 47 1100 Mississippi Ave 718<br />
DeSoto 73 610 Vineland School Rd 2950<br />
Table J12 below details city, county, state and federal government centers, police stations,<br />
fire stations, ambulance bases and the 911 Emergency Operations Center.<br />
Table Table J12 J12 GOVERNMENT GOVERNMENT FACILITIES FACILITIES IN IN JEFFERSON JEFFERSON COUNTY COUNTY<br />
COUNTY<br />
GOVERNMENT GOVERNMENT CENTERS CENTERS-CITY CENTERS CITY AND<br />
FEDERAL<br />
FEDERAL<br />
LOCATION<br />
LOCATION<br />
Office of Job Training 2 Merchants Drive<br />
Department of Agriculture 10820 Hwy 21<br />
Office of Russ Carnahan 517 Bailey Rd<br />
Recruiting Office 109 Walnut<br />
Barnhart Post Office 1835 Marriot St<br />
Herculaneum Post Office 1234 Commercial Blvd<br />
Cedar Hill Post Office 7050 State Rd BB<br />
Crystal City Post Office 324 Bailey<br />
DeSoto Post Office 950 Boyd<br />
Dittmer Post Office 7768 Gravois Rd<br />
Festus Post Office 109 Walnut<br />
Fletcher Post Office 7682 Old State Rd H<br />
Grubville Post Office Highway Y<br />
Hematite Post Office 3677 State Rd P<br />
Hillsboro Post Office 4620 Yeager Rd<br />
Imperial Post Office 6035 S. Outer Rd<br />
Kimmswick Post Office Front and Market<br />
Liguori Post Office 1 Liguori Rd<br />
Mapaville Post Office 4049 Highway Z<br />
Peveley Post Office N.A.<br />
Richwoods Post Office Highway A<br />
Valle Mines Post Office 3225 State Rd V<br />
29
30<br />
<strong>Jefferson</strong> <strong>County</strong> – Section 1<br />
Table Table J12 J12 GOVERNMENT GOVERNMENT FACILITIES FACILITIES IN IN JEFFERSON JEFFERSON COUNTY<br />
COUNTY<br />
GOVERNMENT GOVERNMENT CENTERS CENTERS-CITY CENTERS CITY AND<br />
FEDERAL<br />
FEDERAL<br />
LOCATION<br />
LOCATION<br />
Arnold Post Office 1314 Jeffco Blvd<br />
Fenton Post Office 10 Fenton Plaza<br />
High Ridge Post Office 2829 High Ridge Blvd<br />
House Springs Post Office Highway 30<br />
Arnold Recruiting Center<br />
<strong>County</strong> <strong>County</strong> Government Government Cen Centers Cen Centers<br />
ters<br />
471 Jeffco Blvd<br />
<strong>Jefferson</strong> <strong>County</strong> Court House 300 2nd Street, Hillsboro<br />
<strong>Jefferson</strong> <strong>County</strong> Economic Development<br />
Bldg<br />
725 Maple<br />
<strong>Jefferson</strong> <strong>County</strong> Health Department-<br />
Arnold<br />
<strong>Jefferson</strong> <strong>County</strong> Health Department-<br />
Hillsboro<br />
3838 Jeffco Blvd.<br />
405 2 nd Street<br />
<strong>Jefferson</strong> <strong>County</strong> Parks and Recreation 2800 Community Drive<br />
<strong>Jefferson</strong> <strong>County</strong> Library 3033 High Ridge Blvd<br />
<strong>Jefferson</strong> <strong>County</strong> Library 2101 Jeffco Blvd<br />
<strong>Jefferson</strong> <strong>County</strong> Library 3021 High Ridge<br />
<strong>Jefferson</strong> <strong>County</strong> Library 7479 Metropolitan Blvd<br />
<strong>Jefferson</strong> <strong>County</strong> Juvenile Office 2101 Jeffco Blvd<br />
<strong>Jefferson</strong> <strong>County</strong> Juvenile Office<br />
Police Police<br />
Police<br />
3857 Gravois Rd<br />
<strong>Jefferson</strong> <strong>County</strong> Sheriff’s Department-<br />
North<br />
34 Dillion Plaza<br />
<strong>Jefferson</strong> <strong>County</strong> Sheriff 300 2 nd St, Hillsboro<br />
<strong>Jefferson</strong> <strong>County</strong> Sheriff-South Hwy 21 & Viking Dr. Hillsboro<br />
<strong>Jefferson</strong> <strong>County</strong> <strong>East</strong> Hwy 61-67 & Windsor Harbor Rd<br />
Arnold 2101 Jeffco Blvd<br />
Byrnes Mill Osage Executive Dr<br />
Cedar Hill 7322 Springdale<br />
Crystal City 130 Mississippi Ave<br />
DeSoto 17 Boyd<br />
Festus 100 Park<br />
Herculaneum 1 Parkwood Ct<br />
Hillsboro 101 Second St<br />
Kimmswick 3 rd and Vine<br />
Olympian Village 205 Kronos Dr<br />
Peveley P.O. Box 304
A Regional Overview All-Hazard Mitigation Plan<br />
Table Table J12 J12 GOVERNMENT GOVERNMENT FACILITIES FACILITIES IN IN JEFFERSON JEFFERSON COUNTY<br />
COUNTY<br />
GOVERNMENT GOVERNMENT CENTERS CENTERS-CITY CENTERS CITY AND<br />
LOCATION<br />
LOCATION<br />
FEDERAL<br />
FEDERAL<br />
Ambulance Ambulance Districts<br />
Districts<br />
Big River P.O. Box 348, Cedar Hill<br />
Joachim-Plattin Township 619 Collins Dr, Fstus<br />
North <strong>Jefferson</strong> <strong>County</strong> P.O. Box 233, High Ridge<br />
Rock Township P.O. Box 629, Arnold<br />
Valle 12363 Highway 21, Desoto<br />
429 <strong>East</strong> Osage, Pacific<br />
3279 Highway 100, Villa Ridge<br />
Meramec<br />
31768 Highway O, Robertsville<br />
1060 Hwy W<br />
Eureka Fire Protection and Ambulance 1815 W 5<br />
District<br />
th St<br />
3571 Wright Oak School Rd<br />
Fire Fire Fire Departments/Distric<br />
Departments/Districts<br />
Departments/Distric ts<br />
Antonia 3538 Highway M, Imperial<br />
6766 Cedar Hill Rd<br />
8800 Highway 30, Dittmer<br />
Cedar Hill<br />
8790 Byrnes Rd<br />
Crystal City 130 Mississippi Avenue<br />
17 Boyd Street<br />
201 <strong>East</strong> Miller<br />
3610 Highway V<br />
DeSoto<br />
12545 Ware<br />
Dunklin 1987 Highway Z<br />
Eureka 1060 Highway W, Eureka<br />
Goldman 9001 Old Lemay Ferry Rd, Hillsboro<br />
304 Rice Street<br />
Hematite<br />
3067 Meyer Rd<br />
Herculaneum 848 Broad<br />
2839 High Ridge Blvd<br />
1434 Gravois<br />
High Ridge<br />
6969 Wild, House Springs<br />
120 5<br />
Hillsboro<br />
th Street<br />
480 Second St<br />
<strong>Jefferson</strong> <strong>County</strong> Fire Protection District 13000 Highway T, Festus<br />
Mapaville 3701 Mapaville Fire Dept Rd<br />
Pacific 910 <strong>West</strong> Osage, Pacific<br />
1533 Jeffco Blvd, Arnold<br />
1020 Main, Imperial<br />
3540 Londell Rd, Arnold<br />
Rock Community FPD<br />
3889 Miller<br />
Shady Valley FPD 4535 Old Hwy 21, Imperial<br />
1691 S Hwy 141, Fenton<br />
Springdale FPD<br />
2198 Saline Rd, Fenton<br />
Festus 212 N Mill St, 213 N Mill St,<br />
Ridge Street<br />
31
32<br />
Recreation Recreation Facilities<br />
Facilities<br />
<strong>Jefferson</strong> <strong>County</strong> – Section 1<br />
Table Table J12 J12 GOVERNMENT GOVERNMENT FACILITIES FACILITIES IN IN JEFFERSON JEFFERSON COUNTY<br />
COUNTY<br />
GOVERNMENT GOVERNMENT CENTERS CENTERS-CITY CENTERS CITY AND<br />
FEDERAL<br />
FEDERAL<br />
State State Properties<br />
Properties<br />
LOCATION<br />
LOCATION<br />
Mapaville State School<br />
Highway A<br />
Region Office 2901 Hwy 61-4 Mi S Festus<br />
Service Bldg 2901 Hwy 61-4 Mi S Festus<br />
Residence 2901 Hwy 61-4 Mi S Festus<br />
Warehouse 2901 Hwy 61-4 Mi S Festus<br />
Service Bldg/Office 20 Mi S St. Louis-Hwy 67<br />
Pit Latrine 5 Mi N Hillsboro-Hwy 21<br />
Tidwell House 20 Mi S St. Louis-Hwy 67<br />
Pit Latrine 20 Mi S St. Louis-Hwy 67<br />
Pit Latrine 20 Mi S St. Louis-Hwy 67<br />
Supt Residence (New) 20 Mi S St. Louis-Hwy 67<br />
Storage Barn 2901 Hwy 61-4 Mi S Festus<br />
Pole Storage 2901 Hwy 61-4 Mi S Festus<br />
Interpretive Museum 20 Mi S St. Louis-Hwy 67<br />
Storage Building 20 Mi S St. Louis-Hwy 67<br />
Open Shelter 20 Mi S St. Louis-Hwy 67<br />
Desoto Armory State Hwy E 63020<br />
Festus Armory Junction Hwy A&P<br />
Unheat. Stor Bldg Desoto State Hwy E 63020<br />
Festus OMS Junction Hwy A&P<br />
Festus Unheat Stor Bldg Junction Hwy A&P<br />
Core Building 10434 State Rd BB<br />
Housing Unit A 10434 State Rd BB<br />
Housing Unit B/C 10434 State Rd BB<br />
Maintenance Building 2 Mi N Hillsboro On Hwy 21<br />
Student Center Building 2 Mi N Hillsboro On Hwy 21<br />
Arts & Science Building 2 Mi N Hillsboro On Hwy 21<br />
Library Learning Center 2 Mi N Hillsboro On Hwy 21<br />
Vocational Technical Building 2 Mi N Hillsboro On Hwy 21<br />
Vo-Prep Building 2 Mi N Hillsboro On Hwy 21<br />
Field House 2 Mi N Hillsboro On Hwy 21<br />
Fine Arts Center 2 Mi N Hillsboro On Hwy 21<br />
Arts And Science 2 Mi N Hillsboro On Hwy 21<br />
Technology Center 2 Mi N Hillsboro On Hwy 21<br />
<strong>Jefferson</strong> College- Arnold 4500 Jeffco Blvd<br />
Child Care Center 2mi N Hillsboro On Hwy 21<br />
Veterinary Technology Facility 2mi N Hillsboro On Hwy 21<br />
<strong>Jefferson</strong> <strong>County</strong> has approximately 145 acres of parks and recreation space for public use.<br />
This is represented in 11 county parks that include hiking trails, passive recreation space,<br />
and fishing and boating opportunities. The <strong>Jefferson</strong> <strong>County</strong> Master Plan noted that,
A Regional Overview All-Hazard Mitigation Plan<br />
based on Missouri Statewide Outdoor Recreation Plan, the supply of parks and recreation<br />
space is significantly low to serve the population of the county and that future<br />
development opportunities should include measures to remedy this situation. Refer to<br />
Table J13 below.<br />
TABLE ABLE J13 JEFFERSON COUNTY RECREATIONAL FACILITIES<br />
Big River Saddle Club 10 * * * * * * *<br />
Brown's Ford 2 * * * * *<br />
Cedar Hill 7 * * * * * *<br />
Fletcher House .6 * * * *<br />
High Ridge Civic Center 2 * * * * * * * *<br />
Rockford Beach 8.2 * * * * * * * * *<br />
<strong>Jefferson</strong> Winter Park 40 * * * * * * * *<br />
Morse Mill 10 * * * * * * * *<br />
Pleasant Valley 40 * * * * * * *<br />
Sunridge 6 * * * * * * * *<br />
NW <strong>Jefferson</strong> <strong>County</strong><br />
Sports Complex<br />
20 * * * * *<br />
Morse Mill Park- The Big River is located at Morse Mill Park. This location can be<br />
used to launch canoes or inner tubes for a 10.9-mile float to Cedar.<br />
Brown’s Ford Park- This facility is located on the Big River. A canoe or inner tube<br />
can be launched at the boat ramp and take 18.3-mile trip down to Morse Mill<br />
Park.<br />
Cedar Hill Park- This facility provides picnicking, fishing and swimming<br />
opportunities on the Big River. The old mill and dam are overlooking the fast<br />
flowing water dropping over rocks. This is a good location to launch a canoe or<br />
inner tubes for a 9.8-mile float to Rockford Beach.<br />
Fletcher House- Built in 1851 by Thomas E. Fletcher (Missouri's first native-born<br />
Governor, and Friend of the Sixteenth President, Abraham Lincoln). The Fletcher<br />
House is operated as a "House Museum" through the cooperative efforts of the<br />
<strong>Jefferson</strong> <strong>County</strong> Parks and Recreation Department and the Fletcher House<br />
Foundation.<br />
33
34<br />
<strong>Jefferson</strong> <strong>County</strong> – Section 1<br />
High Ridge Civic Center- A wide variety of services provided at the Civic Center.<br />
Rockford Beach- Located on the Big River. A dam creates a cascading waterfall.<br />
The river is commonly used for fishing, swimming and boating. Picnic facilities<br />
provide tables, grills and volleyball court.<br />
<strong>Jefferson</strong> <strong>County</strong> Winter Park- Facilities include volleyball courts and picnic tables<br />
over looking the Meramec River. Swimming, personal watercrafts, powerboats<br />
and fishing can be done.<br />
Pleasant Valley Park Preserve – This park offers 40 acres of secluded areas, wild<br />
flowers, wildlife and walking trails. This facility has picnic facilities, playground,<br />
or trails.<br />
Sunridge Park- This facility has the only tower open to the public. Shelter<br />
houses, picnic facilities and playground are also available.<br />
Northwest <strong>Jefferson</strong> <strong>County</strong> Sports Complex- The <strong>Jefferson</strong> <strong>County</strong> Parks and<br />
Recreation Department acquired the Northwest <strong>Jefferson</strong> <strong>County</strong> Sports<br />
Complex, formerly the Cedar Hill Ballfields. This 20-acre complex, which currently<br />
provides four baseball fields with backstops, as well as a designated soccer area,<br />
currently is the home of Youth Instructional Soccer Program and Summer Soccer<br />
Camps.<br />
The cities of Arnold, Pevely, Herculaneum, Crystal City, Festus, Hillsboro, and<br />
Byrnes Mill all have city parks. In addition, there is Mastodon State Historic Site<br />
in Imperial and several State Department of Conservation areas.<br />
Sandy Creek Covered Bridge boasts the picture-perfect appearance of an old red<br />
barn. It was one of six bridges built in 1872 to allow passage from the <strong>Jefferson</strong><br />
<strong>County</strong> seat of Hillsboro to St. Louis.<br />
Mastodon State Historic Site contains an important archaeological and<br />
paleontological site - the Kimmswick Bone Bed. Bones of mastodons and other<br />
now-extinct animals were first found here in the early 1800s. The area was<br />
identified as one of the most extensive Pleistocene ice age deposits in the<br />
country. Archaeological history was made at the site in 1979 when scientists<br />
excavated a stone spear point made by hunters of the Clovis culture (14,000 -<br />
10,000 years ago) in direct association with mastodon bones. This was the first<br />
solid evidence of the coexistence of people and these giant prehistoric beasts.<br />
Today, the 425-acre property preserves this National Register of Historic Places<br />
site and provides recreational opportunities. A museum tells the natural and<br />
cultural story of the oldest American Indian site one can visit in the state's park<br />
system. A full-size replica of a mastodon skeleton highlights the exhibits.
A Regional Overview All-Hazard Mitigation Plan<br />
Gov. Daniel Dunklin's Grave State Historic Site, Herculaneum, houses the grave of<br />
Missouri's fifth governor (1832-1836). The site interprets Dunklin's role as the<br />
Father of Public Schools, and provides a scenic overlook of the Mississippi River.<br />
Inventory Inventory of of Infrastructures<br />
Infrastructures<br />
<strong>County</strong> infrastructures include transportation, communications, water/sewer,<br />
electricity and natural gas, solid waste disposal, law enforcement, fire protection,<br />
emergency medical services and emergency management.<br />
35
36<br />
Transportation<br />
Transportation- Transportation FIGURE J10<br />
<strong>Jefferson</strong> <strong>County</strong> – Section 1
A Regional Overview All-Hazard Mitigation Plan<br />
Roadways<br />
Roadways<br />
The road network has a great impact on <strong>Jefferson</strong> <strong>County</strong>. On the eastern side of the<br />
county lies the primary north/south transportation route, Interstate I-55. I-55 connects the<br />
St. Louis region to points north and south. Internally, a web of state and county roads<br />
connects <strong>Jefferson</strong> <strong>County</strong>. State Highway 61/67 and 21 are the primary north/south<br />
connectors. Highway 30 runs northeast/southwest through the northwest quadrant of the<br />
county. Highways M and MM provide a major east/west connection from I-55 and<br />
highway 30, in the northern part of the county. The county lacks major east/west<br />
connections south of the M-MM corridor. Narrow county roads provide indirect access in<br />
much of the southern portion of the county. Local roads that serve subdivisions and<br />
neighborhoods are classified as privately owned and dedicated to public use. Thus, for<br />
these subdivisions, the homeowner’s association is responsible for maintenance. See<br />
Figure J10 located in the back of the Technical Appendix.<br />
The <strong>County</strong> Commission convened the Transportation Advisory Committee on September<br />
16, 1999. The overall purpose of the TAC is to serve as the source of long-range planning<br />
and strategies and shared local transportation policy making for <strong>Jefferson</strong> <strong>County</strong>. They will<br />
advise the <strong>County</strong> Commission on funding, administration, and operation of publicly<br />
supported agencies involved in the delivery of services for all modes of transportation, and<br />
they will act as a focal point for cooperation and coordination between all stakeholders in<br />
the delivery of transportation services.<br />
One of the immediate tasks of the Transportation Advisory Committee (TAC) was to<br />
investigate the transportation needs of the elderly, handicapped, Welfare-to-work<br />
population and others with special medical and job service needs. The TAC found that the<br />
transportation needs of these segments of the <strong>Jefferson</strong> <strong>County</strong> population are not being<br />
sufficiently met. The key issues surrounding this finding are: 1) insufficient funding for<br />
current providers; 2) communication between service providers is limited; 3) there is no<br />
mass transit available in the <strong>County</strong>; 4) data on needed services is not available; 5) there is<br />
no standard on data collection; and 6) the <strong>County</strong> is not accessing all the money available<br />
to resource transportation services. All of these issues impact the physically disabled, the<br />
elderly, and others with medical and job service needs.<br />
The TAC has the following short term recommendations to address these issues: 1)<br />
contract a public transit needs study; 2) create a centralized automated information center;<br />
3) expand dialog with mass transit providers; 4) research the availability for potential<br />
funding sources; and 5) implement strategies based on the findings of the transit needs<br />
study.<br />
37
38<br />
Motor Motor Freight Freight Transportation<br />
Transportation<br />
<strong>Jefferson</strong> <strong>County</strong> – Section 1<br />
Approximately 550 motor freight carriers and 148 freight shipping establishments serve<br />
Greater St. Louis. Truck terminals are located throughout Greater St. Louis and are<br />
strategically located near rail, port and pipeline facilities. See Table J14 below.<br />
TABLE TABLE J14 J14 TRANS TRANSPORTATION TRANS PORTATION CARRIERS<br />
Sample Sample of of Motor Motor Freight Freight Freight Carriers Carriers<br />
Carriers<br />
ABF Freight Systems Inc. Mabro Corporation<br />
American Freightways Inc. Overnite Transportation Company<br />
Beelman Truck Company Roadway Express Inc.<br />
Cassens Corp. Truck Transport Inc.<br />
CF Motor Freight USF Holland Motor Express<br />
Creech Bros. Truck Lines Inc. Witte Brothers Exchange Inc.<br />
Henry Transportation Inc. Yellow Freight Systems Inc.<br />
Railroads: Railroads: Class Class Class I I<br />
Railroads: Railroads: Regional<br />
Regional<br />
Amtrak (Passenger) Kansas City Southern<br />
Burlington Northern Santa Fe Canadian National Railway<br />
CSX Transportation<br />
Norfolk Southern<br />
Union Pacific<br />
Railroads: Railroads: Switching Switching and and Terminal<br />
Terminal<br />
Alton and Southern Railway<br />
Manufacturers Railway Company<br />
Terminal Railroad<br />
Amtrak passenger service is available in the City of St. Louis<br />
Central Midland Railway<br />
Illinois <strong>West</strong>ern Railway
A Regional Overview All-Hazard Mitigation Plan<br />
Airports Airports Most Most Up Up to to date date data data for for smaller smaller aircraft aircraft facilities<br />
facilities<br />
TABLE TABLE J15 J15 Year 2000 Fourth Quarter St. Louis Metropolitan Region Region Aircraft<br />
Aircraft<br />
Operations Operations Summary Summary at at Public Public-Use Public Use Airports<br />
St. Louis <strong>County</strong>, Missouri<br />
Spirit of St. Louis 47,447<br />
Creve Coeur 9,555<br />
St. Charles <strong>County</strong>, Missouri St. Charles <strong>County</strong>, Smartt 12,045<br />
St. Charles Municipal 9,490<br />
Franklin <strong>County</strong>, Missouri<br />
Sullivan Regional 5,824<br />
Washington Memorial 8,918<br />
St. Clair Regional 3,185<br />
<strong>Jefferson</strong> <strong>County</strong>, Missouri Festus Memorial 3,731<br />
St. Clair <strong>County</strong>, Illinois St. Louis Downtown-Parks* 40,195<br />
Madison <strong>County</strong>, Illinois<br />
St. Louis Regional* 19,435<br />
Shafer Metro-<strong>East</strong> 3,913<br />
Total 163,738<br />
*Aircraft operation estimates reflect activity measured after normal ATC operating hours. This activity, when<br />
combined with ATC traffic counts results in a slightly higher total aircraft operation count for that airport, when<br />
compared to ATC reports.<br />
In addition to the above figures and Table J17, Lambert-St. Louis International<br />
Airport had 4,837general aviation aircraft operations and Mid America Airport in<br />
Illinois had 785 general aviation aircraft operations for a total of 169,360<br />
operations. Figure J11 depicts the regional metropolitan airports.<br />
FIGURE FIGURE J11 J11 ST. ST. ST. LOUIS LOUIS METROPOLITAN METROPOLITAN AIRPORTS AIRPORTS<br />
AIRPORTS<br />
39
40<br />
1 = Creve Coeur 8 = St. Charles Municipal<br />
2 = Festus Memorial 9 = St. Clair Regional<br />
3 = <strong>Jefferson</strong> <strong>County</strong> (proposed) 10 = St. Louis Downtown - Parks<br />
4 = Lambert-St. Louis Intl Airport 11 = St. Louis Regional<br />
5 = MidAmerica 12 = Spirit of St. Louis<br />
6 = Shafer Metro-<strong>East</strong> 13 = Sullivan Regional<br />
7 = St. Charles <strong>County</strong> Smartt 14 = Washington Memorial<br />
Public Public Trans Transportation<br />
Trans portation<br />
<strong>Jefferson</strong> <strong>County</strong> – Section 1<br />
Public Transportation for <strong>Jefferson</strong> <strong>County</strong> consists of J.C. Transit (JCT) and OATS. (800)<br />
201-6287. Attempts in the past have been made to support public transportation from the<br />
urban St. Louis area to <strong>Jefferson</strong> <strong>County</strong>.<br />
Communications<br />
Communications<br />
New infrastructures and services are enhancing county residents’ quality of lives. The<br />
following list of communication facilities is not all-inclusive, but represents the major<br />
providers of the county’s communication infrastructure. See Table J16 below.<br />
TABL TABLE TABL TABL E J16 J16 TELECOMMUNICATIONS PROVIDERS<br />
Access U.S. Advanced Satellite Systems Inc.<br />
Advantage CTI Communications Inc. Advertisenet<br />
AirTouch Paging Alpha Telecommunications LLC<br />
American Paging Inc. American Technology Corporation<br />
AmericaNetworks Angel Technologies Corp.<br />
AnsaRing Corporation Apple A Day Inc. (An)<br />
Arch Communications Inc. Ascom Nexion<br />
Associated Engineered Systems Inc. Astralink Technology Inc.<br />
AT&T (<strong>Jefferson</strong> City Office) AT&T (St. Louis Operations)<br />
AT&T Wireless Services Auto Cellular Inc.<br />
Avtex Corp. Axon Telecom LLC<br />
Barron Communications Inc. BigWideSky<br />
Birch Telecom Black Box Inc.<br />
Brick Network BusComm Inc.<br />
Cable & Wireless Inc. Capital Cellular Inc.<br />
Centergistic Solutions Central Business Communications Inc.<br />
Central District Alarm Inc. Centras Networks Inc.<br />
Charter Pipeline Cingular Wireless Corporation<br />
ClearPages.com CMS Communications Inc.<br />
Com Trol Company Com-Sal Inc.<br />
Communications Technologies Inc. Communitronics Corporation<br />
ComTrol Company Concentric Network- St. Louis<br />
Connell Communications Inc. Continental Cement Company LLC<br />
Convergent Communications of St. Louis CoreExpress LLC<br />
CTitek Inc. Custom Cellular Inc.<br />
Cybercon Inc. Cyberedge Technologies<br />
Cybermill Communications Data Wiring & Systems Inc.
A Regional Overview All-Hazard Mitigation Plan<br />
TABL TABLE TABL E J16 TELECOMMUNICATIONS PROVIDERS<br />
Datacomm Research Company Dial-A-Page<br />
Dictaphone Corporation Dielmann & Associates<br />
Dietrich Lockard Group Digitized Communications Systems<br />
Double Eagle LLC Ellington Telephone Co. Inc.<br />
Empire Paging & Cellular Inc. EPC Inc.<br />
ESCO Technologies Inc. Everest Connections Corp.<br />
Everest Global Tech Group LLC Evoke Communications Inc.<br />
Executive Systems Inc. Expressive Tek<br />
Falcon Technologies Inc. Fidelity Communications Company<br />
First Internet Alliance G&D Communications Inc.<br />
<strong>Gateway</strong> City Connections <strong>Gateway</strong> Communications Group<br />
Global Crossing Graybar Electric Company Inc.<br />
GSI Inc. Honeywell Inc.<br />
ICNS Inc. Inlink Corp.<br />
Integrated Design Engineering Inc. Inter-Tel Technology Inc.<br />
Interchange Technologies Inc. Intermedia Communications Inc.<br />
Internet <strong>Gateway</strong> Inc. Intira Corporation<br />
Ionex Telecommunications Inc. Jato Communications Inc.<br />
JBM Electronics Inc. JWC Jurisprudence Wireless Communications<br />
Kataman Communications Kaufman Broadcast Services<br />
Kincaid Studios Kingdom Telephone Company<br />
L&R Paging & Cellular Inc. LaBarge Inc.<br />
Lanier Worldwide Inc. LDD Inc.<br />
New Equipment Inc. Lowry Computer Products<br />
Lucent Technologies Inc. Main Net (The)<br />
Marconi Global Service Marz Inc.<br />
Mastor Telecom Equipment Inc. Maximum Communications<br />
MCI Worldcom McLeod USA Information Technology Systems<br />
Med-Products Healthcare Inc. Metro One Telecommunications Inc.<br />
Metro Tele-Communications Inc. Metropark Communications<br />
Mid-America Telephone Systems Midwest Telecom Resellers Inc.<br />
Mobile Select Systems Inc. Mobilecom<br />
MobileComm Moore Design Group<br />
Mpower Communications MVP Cellular<br />
National Pager Services Inc. Net Impact (The)<br />
Next Wave Communications Corp. Nextel Communications Inc.<br />
Northern Telecom Inc. NorthPoint Communications<br />
Nothing But Net Inc. NuVox Communications Inc.<br />
Omnifax Division of Danka On Hold Studios Plus<br />
ONE Inc. Optitek Inc.<br />
Page Girls Inc. PageNet<br />
Paging Network of St. Louis Partner Communications & Services Inc.<br />
Phoenix Networks Inc. Phone Craft Inc.<br />
Phonetell Technologies Inc. PrivSystems Inc<br />
PSI Net Pulitzer Technologies Inc.<br />
Roberts Wireless Communications LLC Rome Net Solutions<br />
SAVVIS Communications Corp. Diamond NET ISP Inc.<br />
SBC Advanced Solutions Inc. SecurityLink<br />
Shared Technologies Slingshott Communications<br />
Software Application Professionals Inc. SONACOM IT Partners<br />
41
42<br />
TABL TABLE TABL E J16 TELECOMMUNICATIONS PROVIDERS<br />
Southwestern Bell Telephone Company Spectrum Resources Inc.<br />
Sprint Corporation Sprint PCS<br />
Water/Sewer<br />
Water/Sewer<br />
<strong>Jefferson</strong> <strong>County</strong> – Section 1<br />
<strong>Jefferson</strong> <strong>County</strong> consists of eight public water districts, ten public and six municipal water<br />
districts. Table J17 below represents the wastewater treatment plants and water supply<br />
facilities in <strong>Jefferson</strong> <strong>County</strong>.<br />
TABLE TABLE J17 J17 JEFFERSON JEFFERSON CO CO WASTEWATER WASTEWATER TREATMENT TREATMENT FACILTIES<br />
FACILTIES<br />
FACILITY FACILITY<br />
RECEIVING RECEIVING STREAMS STREAMS STREAMS CITY<br />
CITY<br />
PACE CONSTRUCTION COMPANY TRIB GLAIZE CR ANTONIA<br />
SIMPSON CONST MAT-JEFFERS MERAMEC ARNOLD<br />
ARNOLD SMALL MS4 TRIB MERAMEC RIVER ARNOLD<br />
METAL CONTAINER CORP TRIB LITTLE MUDDY CR ARNOLD<br />
SINCLAIR & RUSH INC MERAMEC RIVER ARNOLD<br />
JERRY'S SUNOCO TENBROOK CR ARNOLD<br />
WMM MERAMEC MERAMEC R ARNOLD<br />
WOODGLEN APARTMENTS TRIB ROMAINE CR ARNOLD<br />
BROOKSHIRE COURT APTS TRIB MERAMEC R ARNOLD<br />
NPSD RANDOLPH HILLS DUTCH BOTTOM RD BR ARNOLD<br />
ARNOLD CHURCH OF NAZARENE BR POMME CR ARNOLD<br />
MERAMEC HTS SHOPNG CENTER TRIB MERAMEC R ARNOLD<br />
TESSON HILLS APARTMENTS TRIB ROMAINE CREEK ARNOLD<br />
GLAIZE CREEK SEWER DISTRI GLAIZE CR BARNHART<br />
KOA,SELSOR DEVELOPMNT GRP TRIB MISSISSIPPI R. BARNHART<br />
COUNTRY TRAIL ESTATES MHP TRIB OF HEADS CREEK BARNHART<br />
WILLOW BEND MHP TRIB GLAIZE CR BARNHART<br />
WALLACH SEPTIC SERV, INC TRIB BIG RV CEDAR HILL<br />
MO AMERICAN, CEDAR HILL L UN TR BIG R CEDAR HILL<br />
COUNTRY AIRE MANOR MHP BR ISUM CR CEDAR HILL<br />
LAKES OF DEERWOOD SUBD TRIB ISUM CR. CEDAR HILL<br />
LAKE ADELLE SEWER DIST TRIB SKULLBONE CR CEDAR HILL<br />
BEL AIR ESTATES MHP SUBD TRIB ISUM CR CEDAR HILL<br />
LAKE TAMARAC SUBD TRIB SAND CR. CEDAR HILL<br />
PARADISE ESTATES MHP WWTF TRIB SKULL BONES CR CEDAR HILL<br />
EL CHAPARREL EST SUBD ASO TRIB SAND CREEK CEDAR HILL<br />
COUNTRY LIFE ACRES SUBD TRIB BELEW CR CEDAR HILL<br />
CEDAR HILL FIRE PRO DIST TRIB BIG R CEDAR HILL<br />
AUSTIN TRAILS WWTF TRIB SAND CR CEDAR HILL<br />
MO AMERICAN, SAND CREEK F SAND CR CEDAR HILL<br />
SECLUDED FOREST SUBD ISUM CR. CEDAR HILL<br />
WEDGEWOOD VILLAGE PLAT 2 TRIB ISUM CR CEDAR HILL<br />
SENNAWOOD VILLAGE SUBD ISUM CR. CEDAR HILL<br />
SUNRISE ACRES SUBDIVISION TRIB BIG RIVER CEDAR HILL
A Regional Overview All-Hazard Mitigation Plan<br />
TABLE TABLE J17 J17 JEFFERSON JEFFERSON CO CO WASTEWATER WASTEWATER TREATMENT TREATMENT FACILTIES<br />
FACILTIES<br />
FACILITY FACILITY<br />
RECEIVING RECEIVING STREAMS STREAMS STREAMS CITY<br />
CITY<br />
PHILLIPS PROPERTY WWTF TRIB SAND CR CEDAR HILL<br />
CEDAR HILL U-GAS TRIB BIG RIVER CEDAR HILL<br />
CRYSTAL CITY SAND MISSISSIPPI R CRYSTAL CITY<br />
CRYSTAL CITY WTP MISSISSIPPI RIVER CRYSTAL CITY<br />
FRED WEBER INC/ASPHALT PL UNNAMED TRIB CRYSTAL CITY<br />
TWIN CITY AUTO SALVAGE DITCH PLATTIN CK CRYSTAL CITY<br />
UPS, CRYSTAL CITY TRIB PLATTIN CREEK CRYSTAL CITY<br />
FESTUS-CRYSTAL CITY STP PLATTIN CREEK CRYSTAL CITY<br />
FESTUS AIRPORT LAGOON TRIB PLATTIN CR CRYSTAL CITY<br />
ARNOLD READY MIX CORP - D TRIB JOACHIM CREEK DE SOTO<br />
ARCH JOHNSTON COMPANY INC FRITZ CR DE SOTO<br />
COUNTRY CORNER TRIB FLUCOM CR DE SOTO<br />
TIMBER CREEK RESORT TRIB MCMULLEN BR DE SOTO<br />
JONES PLUMBING SERVICES TRIB JOACHIM CK DE SOTO<br />
JEFFCO FEED & FERTILIZER FRITZ CR DE SOTO<br />
DE SOTO WWTP JOACHIM CR DE SOTO<br />
SOUTH JEFFERSON COUNTY UT FALLING ROCK BRANCH DE SOTO<br />
WALKER HILL MHC TRIB JOACHIM CR DE SOTO<br />
ATHENA ELEMENTARY TRIB HAVERSTICK CR DE SOTO<br />
AUTUMN'S HAVEN BRANCH HAVERSTICK CR DE SOTO<br />
BAISCH NURSING CENTER MCMULLEN BR DE SOTO<br />
LAKE KINIPPI SUBDIVISION UNNAMED BR DRY CREEK DE SOTO<br />
SUNRISE R-9 ELEM SCHOOL TRIB JOACHIM CR DE SOTO<br />
VALLE LAKE SEWER DISTRICT TRIB JOACHIM CR DE SOTO<br />
OLYMPIAN VILLAGE WWTP UN TR PLATTIN CR DE SOTO<br />
CAESARS MOBILE HOME PARK MCMULLEN/JOACHIM CR DE SOTO<br />
TIMBER CREEK RESORT MCMULLEN BR DE SOTO<br />
POWER MODEL SUPPLY CO. TRIB FLUCOM CR DE SOTO<br />
PINE FORD VILLAGE MHP TRIB BIG R. DE SOTO<br />
ATHENA CENTER TRIB HAVERSTICK CR DE SOTO<br />
UNION PAC RR DESOTO CAR S TRIB JOACHIM CR DE SOTO<br />
WALKER CAR WASH TRIB TANYARD BR DE SOTO<br />
BRIARWOOD ESTATES TRIB JOACHIM CREEK DE SOTO<br />
WILDWOOD LAKE TRIB PLATTIN CR DE SOTO<br />
AA QUICK SEWER TRIB BIG R DITTMER<br />
ABR SEPTIC SERVICE INC TRIB BIG RIVER DITTMER<br />
DITTMER MEAT PACKING COMP TRIB BIG RIVER DITTMER<br />
SUNSET FIREWORKS LDT/GLOB W FORK TO JONES CR DITTMER<br />
SYCAMORE GREEN ACRES MHP TRIB SKULLBONES CR. DITTMER<br />
FOREST HILL MANOR MHP TRIB CALVEY CR. DITTMER<br />
MAPLE GROVE ELEM SCHOOL TRIB BIG RIVER DITTMER<br />
CAMP SUNNYHILL ADVENTURE TRIB DUTCH CR DITTMER<br />
CEDAR GROVE MHP TRIB CALVEY CR DITTMER<br />
ST MARTIN'S UNITED CHURCH TRIB SKULLBONES CR DITTMER<br />
43
44<br />
TABLE TABLE J17 J17 JEFFERSON JEFFERSON CO CO WASTEWATER WASTEWATER TREATMENT TREATMENT FACILTIES FACILTIES<br />
FACILTIES<br />
FACILITY FACILITY<br />
RECEIVING RECEIVING STREAMS STREAMS STREAMS CITY<br />
CITY<br />
<strong>Jefferson</strong> <strong>County</strong> – Section 1<br />
EUREKA MATERIALS COMPANY MERAMEC RIVER EUREKA<br />
GRAPHIC FINISHERS OF AMER TRIB MERAMEC RV FENTON<br />
IMPERIAL ORNAMENTAL METAL TRIB FENTON CR FENTON<br />
AERO METAL FINISHING INC TRIB SALINE CR FENTON<br />
PRODUCTION CASTINGS, INC TRIB SALINE CREEK FENTON<br />
SIR THOMAS MANOR APTS TRIB SUGAR CR FENTON<br />
BIG VALLEY MHC ROMAINE CREEK FENTON<br />
MERAMEC SEWER COMPANY TRIB MERAMEC R FENTON<br />
NEPSD - TERRY JEAN ACRES SUGAR CR. FENTON<br />
YOUNG SUBDIVISION TRIB FENTON CR FENTON<br />
MCARTHY HOMESITES #2 BR ROMAINE CR FENTON<br />
KOLLER CRAFT PLASTIC PROD TRIB SALINE CR FENTON<br />
NPSD, INTERIM SALINE CR MERAMEC R FENTON<br />
MDNR, ST.FRANCOIS MOUNTAI TRIB MISSISSIPPI RIV FESTUS<br />
ARCH JOHNSTON COMPANY INC TRIB TO MUDDY CREEK FESTUS<br />
H SAND & GRAVEL PLATTIN CR FESTUS<br />
PLATTIN VALLEY STABLES TRIB PLATTIN CREEK FESTUS<br />
PLATTIN VALLEY SAND-GRAV. TRIB PLATTIN CREEK FESTUS<br />
CATHY JOKERST WATER TREAT TRIB JOACHIM CR FESTUS<br />
CENTERPOINT ENERGY MISSIS TR PLATTIN CR FESTUS<br />
MURPHY USA STORE #5775 TRIB PLATTIN CK FESTUS<br />
DPC ENTERPRISES TRIB PLATTIN CR FESTUS<br />
SHAPIRO BROTHERS INC TRIB PLATTIN CR FESTUS<br />
RED-E MIX TRANSPORTATION TRIB MISSISSIPPI RV FESTUS<br />
RIVER CEMENT CO/SELMA CLIFFDALE HOLLOW FESTUS<br />
AMERENUE, RUSH ISLAND PP MISSISSIPPI RIVER FESTUS<br />
WESTINGHOUSE ELECTRIC COM TRIB JOACHIM CR FESTUS<br />
RIVER CEMENT COMPANY MISSISSIPPI RIVER FESTUS<br />
LIFESTYLE MHP TRIB TO BUCK CR FESTUS<br />
M.C.L. MHP TRIB MUDDY CR. FESTUS<br />
EDGEWOOD HEIGHTS SUBD TRIB TO SANDY CR. FESTUS<br />
RCSD-GODFREY GARDENS TRIB JOACHIM CR FESTUS<br />
MAPAVILLE MEADOWS SUBDIVI TRIB SANDY CR. FESTUS<br />
LAKESIDE MANOR PLATTIN CR FESTUS<br />
SUNSET POINTE MHP TRIB JOACHIM CR FESTUS<br />
SELMA VILLAGE SEWER DISTR TRIB MUDDY CR FESTUS<br />
TOULON HEIGHTS SUBD TRIB LITTLE CR FESTUS<br />
FESTUS,LAMBERT HILLS SUBD TRIB TO JOACHIM CR. FESTUS<br />
PLATTIN PRIMARY SCHOOL TRIB SELMA HOLLOW FESTUS<br />
OSCARS FAMILY RESTAURANT BR SELMA HOLLOW CR FESTUS<br />
ARBOR PLACE OF FESTUS TRIB HOCUM HOLLOW FESTUS<br />
TWIN GABLES MHP SELMA HOLLOW/MISS R. FESTUS<br />
MANDERLEY COURT MOBILE HO UN TRIB PLATTEN CR FESTUS<br />
MAPAVILLE MEADOWS SUBDIVI SANDY CR. FESTUS
A Regional Overview All-Hazard Mitigation Plan<br />
TABLE TABLE J17 J17 JEFFERSON JEFFERSON CO CO WASTEWATER WASTEWATER TREATMENT TREATMENT FACILTIES<br />
FACILTIES<br />
FACILITY FACILITY<br />
RECEIVING RECEIVING STREAMS STREAMS STREAMS CITY<br />
CITY<br />
OAKLAND MANOR MHP TRIB PLATTIN CR FESTUS<br />
HAPPY HOLLOW MOBILE HOME TRIB BUCK CR FESTUS<br />
BERWIN BUSINESS CENTER BUCK CR FESTUS<br />
FESTUS, GREEN BRIER EST. TRIB BUCK CR FESTUS<br />
FESTUS, INTERIM WEST TP JOACHIM CR FESTUS<br />
LAKE VIRGINIA SUBD E LAG TRIB JOACHIM CR HEMATITE<br />
DOE RUN, HERCULANEUM SMLT MISSISSIPPI R HERCULANEUM<br />
HERCULANEUM WASTEWATER TR JOACHIM CREEK HERCULANEUM<br />
SIEVEKING INC TRIB SALINE CREEK HIGH RIDGE<br />
COUNTRY CLUB OF SUGAR CR TRIB SALINE CR HIGH RIDGE<br />
BEAUMONT SCOUT SWIMMING TRIB LITTLE ANTIRE C HIGH RIDGE<br />
H-J ENTERPRISES INC TRIB SALINE CR HIGH RIDGE<br />
SIMMLER INC TRIB SALINE CREEK HIGH RIDGE<br />
TIRE SHREDDERS UNLIMITED TRIB SALINE R HIGH RIDGE<br />
WOODRIDGE APARTMENTS TRIB TO WILLIAMS CR HIGH RIDGE<br />
SUNNY ACRES II LLC LITTLE ANTIRE CR HIGH RIDGE<br />
STARLIGHT APTS. TRIB OF BEAR CR HIGH RIDGE<br />
VILLAS OF WILLIAMS CREEK TRIB L ANTIRE CR HIGH RIDGE<br />
LAUREL ACRES MHP ANTIRE CR. HIGH RIDGE<br />
NPSD-PERE CLIFF TRIB L ANTIRE CREEK HIGH RIDGE<br />
MURPHY ANN APARTMENTS TRIB TO SALINE CR. HIGH RIDGE<br />
PEMBROKE PARK APARTMENTS ANTIRE CR HIGH RIDGE<br />
NPSD, CRYSTAL HILLS TRIB SALINE CR HIGH RIDGE<br />
H R ELECTRONICS ANTIRE CR HIGH RIDGE<br />
NPSD WALNUT RIDGE WWTF ANTIRE CR HIGH RIDGE<br />
ENGINEERED COIL COMPANY ANTIRE CR HIGH RIDGE<br />
NPSD, ANTIRE SPRINGS PLNT TRIB ANTIRE CREEK HIGH RIDGE<br />
JEFFERSON CO PWSD #2 TRIB BIG RIVER HIGH RIDGE<br />
JEFFERSON COUNTY LIBRARY TRIB BEAR CR HIGH RIDGE<br />
NPSD, HUNNING HILLS STP TRIB SALINE CR HIGH RIDGE<br />
NATCHEZ ESTATES APARTMENT TRIB SALINE CREEK HIGH RIDGE<br />
NPSD, COUNTRY CLUB OF SUG TRIB SALINE CR HIGH RIDGE<br />
FEED MY PEOPLE BR BEAR CR HIGH RIDGE<br />
NPSD - PARADISE VALLEY WILLIAMS CR HIGH RIDGE<br />
SEVEN SPRINGS/TWIN LAKES TRIB BIG RIVER HIGH RIDGE<br />
TEEN CHALLENGE OF ST LOUI TRIB SALINE CR HIGH RIDGE<br />
CONCRETE RESOURCES INC - TRIB SANDY CR HILLSBORO<br />
DRY CREEK MATERIALS INC DRY CREEK HILLSBORO<br />
DRY CREEK MATERIALS, INC. DRY CR HILLSBORO<br />
ALL WEATHER SEW SERV INC TRIB COTTER CR HILLSBORO<br />
JEFFERSON CNTY SMALL MS4 MERAMEC RIVER HILLSBORO<br />
L W SEWER CORP TRIB DRY CR HILLSBORO<br />
GRANDVIEW R-II SCHOOL DIS TRIB DRY CR HILLSBORO<br />
FAWN MEADOWS SUBD WWTF TRIB OF SANDY CREEK HILLSBORO<br />
45
46<br />
TABLE TABLE J17 J17 JEFFERSON JEFFERSON CO CO WASTEWATER WASTEWATER TREATMENT TREATMENT FACILTIES FACILTIES<br />
FACILTIES<br />
FACILITY FACILITY<br />
RECEIVING RECEIVING STREAMS STREAMS STREAMS CITY<br />
CITY<br />
<strong>Jefferson</strong> <strong>County</strong> – Section 1<br />
OAK RIDGE TRAILER COURT TRIB SANDY CR HILLSBORO<br />
MAPA ACRES M H P TRIB SANDY CR HILLSBORO<br />
HILLSBORO WW RECLAMATION BELEW CR HILLSBORO<br />
CHAPEL HILL MHC TRIB SANDY CR HILLSBORO<br />
FISHER COMMERCIAL AREA TRIB BELEW CR HILLSBORO<br />
PARC GREENWOOD MHP TRIB TO SANDY CR. HILLSBORO<br />
SANDIA HEIGHTS MHP SUBD SANDY CR/JOACHIM CR HILLSBORO<br />
MOCKINGBIRD SUBD WWTF TRIB BIG CREEK HILLSBORO<br />
LEONARD MOBILE HOME PARK TRIB SANDY CR HILLSBORO<br />
HILLTOP MOBILE HOME ESTAT MURRIL BR HILLSBORO<br />
RAINTREE PLANTATION GALLIGHER CR. HILLSBORO<br />
SWISS LODGE APARTMENTS TRIB SANDY CR HILLSBORO<br />
JEFFERSON WOODS SUBD TRIB BIG CR/SANDY CR HILLSBORO<br />
PIONEER TRAIL SUBD TRIB TO SANDY CR. HILLSBORO<br />
LAKEWOOD TRAILS WWTF TRIB JOACHIM CREEK HILLSBORO<br />
GRANADA MEADOWS WWTP TRIB SANDY CREEK HILLSBORO<br />
PERSIMMON POINT DRWBRDG E TRIB SANDY CREEK HILLSBORO<br />
HILLSBORO, JAMESTOWN MOBI TRIB MURREL BR HILLSBORO<br />
HILLSBORO NORTH WWTF SANDY CR HILLSBORO<br />
LOCKEPORT LANDING WWTF TRIB BIG CREEK HILLSBORO<br />
SANDY BRANCH SUBD WWTF HILLSBORO<br />
KING SEPTIC SERVICE TRIB BIG RIVER HOUSE SPRINGS<br />
IMPERIAL PUMPING TRIB GLAIZE CK HOUSE SPRINGS<br />
O'BRIEN EXCAVATING TRIB HEADS CR HOUSE SPRINGS<br />
RITE NOW SEPTIC CLEANING TRIB BIG RIVER HOUSE SPRINGS<br />
BONACKER FARMS INC TRIB BIG RIVER HOUSE SPRINGS<br />
BIG 3 AUTO PARTS & SALVAG HEADS CR HOUSE SPRINGS<br />
NORTHWEST R-1 SCHOOL DIST TRIB BEAR CREEK HOUSE SPRINGS<br />
HSSC, NORTHWEST HIGH SCH BEAR CR HOUSE SPRINGS<br />
OUR LADY QUEEN OF PEACE TRIB DULIN CR HOUSE SPRINGS<br />
CREST MANOR MHP TRIB TO BEAR CR. HOUSE SPRINGS<br />
GREEN ACRES MHP BEAR CR HOUSE SPRINGS<br />
GOLDEN ACRES MHP TRIB HEADS CREEK HOUSE SPRINGS<br />
ELDERLY HOUSING PARTNERSH DULIN CREEK HOUSE SPRINGS<br />
HSSC, HOUSE SPGS MID SCH HEAD'S CR. HOUSE SPRINGS<br />
HSSC, ECHO VALLEY EST HEAD'S CR. HOUSE SPRINGS<br />
HSSC, BEAR CREEK ESTATES TRIB BEAR CREEK HOUSE SPRINGS<br />
HSSC, WOODRIDGE ESTATES TRIB HEADS CR. HOUSE SPRINGS<br />
HSSC, PINE GROVE MANOR TRIB BEAR CR HOUSE SPRINGS<br />
BYRNES MILL MOBILE HOME P TRIB BIG RIVER HOUSE SPRINGS<br />
HSSC, MEADOW BROOK ESTATE TRIB HEADS CR HOUSE SPRINGS<br />
SYCAMORE SPRINGS MHP HEADS CREEK HOUSE SPRINGS<br />
HSSC, CEDAR SPGS ELEM SCH DULIN CREEK HOUSE SPRINGS<br />
BYRNES MILL SOUTH WWTP BIG RIVER HOUSE SPRINGS
A Regional Overview All-Hazard Mitigation Plan<br />
TABLE TABLE J17 J17 JEFFERSON JEFFERSON CO CO WASTEWATER WASTEWATER TREATMENT TREATMENT FACILTIES<br />
FACILTIES<br />
FACILITY FACILITY<br />
RECEIVING RECEIVING STREAMS STREAMS STREAMS CITY<br />
CITY<br />
MEADOWBROOK VALLEY ESTATE TRIB BIG R HOUSE SPRINGS<br />
WINTERWOOD SUBDIVISION TRIB LA BARQUE CR HOUSE SPRINGS<br />
HSSC, MILLER CROSSING WTF TRIB HEADS CR HOUSE SPRINGS<br />
HSSC, FISHER RD TRIB BEAR CR HOUSE SPRINGS<br />
BLUFFS WWTF BIG RIVER HOUSE SPRINGS<br />
AAA ZOELLNER MATERIALS IN TRIB HEADS CR IMPERIAL<br />
ARNOLD READY MIX CORP - I TRIB ROCK CR IMPERIAL<br />
MASTERCHEM INDUSTRIES INC GLAIZE CR IMPERIAL<br />
NPSD ARCHVIEW SUBDIVISION TRIB ROMAINE CR IMPERIAL<br />
EV'S PLAZA SHOPPING CENTE TRIB GLAIZE CR IMPERIAL<br />
VERDA VISTA APARTMENTS GLAIZE CR. IMPERIAL<br />
JOHN'S AUTO BODY TRIB TO ROCK CR. IMPERIAL<br />
CEDAR GROVE MHP CHESLEY ISLND SLOUGH IMPERIAL<br />
RCSD, SECKMAN SCHOOL ROCK CREEK IMPERIAL<br />
SUBURBAN AUTO AUCTIO TRIB TO ROCK CR IMPERIAL<br />
LION'S DEN OUTDOOR LRNG ROCK CR IMPERIAL<br />
WASTE MANAGEMENT OF MO - ROCK CREEK KIMMSWICK<br />
RCSD, KIMMSWICK WWTP MISSISSIPPI RIVER KIMMSWICK<br />
BROOKSTONE ESTATES SUBD TRIB SANDY CR MAPAVILLE<br />
DISABILITY SUPPORT SYSTEM TRIB SANDY CR MAPAVILLE<br />
MAPAVILLE STATE SCHOOL FO WET WEATHER BR MAPAVILLE<br />
PONY BIRD INC TRIB SANDY CR MAPAVILLE<br />
BRECKENRIDGE JEFFCO PLANT MERAMEC R MURPHY<br />
LAKE CATTAILS SUBDIVISION TRIB MERAMEC RIVER PACIFIC<br />
LAKEWOOD CARE CENTER TRIB MERAMEC R PACIFIC<br />
PALISADES VILLAGE SUBD MERAMEC R PACIFIC<br />
H. TRAUTMAN QUARRY INC TRIB SANDY CREEK PEVELY<br />
BRECKENRIDGE PEVELY PLANT TRIB SANDY CR PEVELY<br />
TEAMSTERS LOC 688 HEALTH TRIB MISSISSIPPI R PEVELY<br />
SCORE TRIB MISSISSIPPI R PEVELY<br />
CARONDELET CORP TRIB SANDY CREEK PEVELY<br />
HUNT INDUSTRIAL SERVICE C TRIB JOACHIM CREEK PEVELY<br />
DOW CHEMICAL - RIVERSIDE TRIB MISSISSIPPI R PEVELY<br />
E & J AUTO SALVAGE TRIB TO JOACHIM CR PEVELY<br />
CHERRY LANE SUBD TRIB TO SANDY CR. PEVELY<br />
PEVELY WWTP TRIB SANDY CR PEVELY<br />
TEAMSTERS LOCAL 688 HEALT TRIB MISSISSIPPI R PEVELY<br />
GRIFFITH'S FIRST ADDITION TRIB SANDY CR. PEVELY<br />
SAINT-GOBAIN CONTAINERS TRIB SANDY CR PEVELY<br />
HAZELWOOD COURT MHP TRIB TO SANDY CR. PEVELY<br />
VICTORY CHRISTIAN FELLOWS TRIB TO JOACHIM CR PEVELY<br />
SAND CASTLE SUBDIVISION JOACHIM CR PEVELY<br />
PEVELY, HUNTERS GLEN SUBD TRIB MISSISSIPPI R PEVELY<br />
UNIMIN CORPORATION - PEVE UN TR SANDY CR PEVELY<br />
47
48<br />
TABLE TABLE J17 J17 JEFFERSON JEFFERSON CO CO WASTEWATER WASTEWATER TREATMENT TREATMENT FACILTIES FACILTIES<br />
FACILTIES<br />
FACILITY FACILITY<br />
RECEIVING RECEIVING STREAMS STREAMS STREAMS CITY<br />
CITY<br />
<strong>Jefferson</strong> <strong>County</strong> – Section 1<br />
O'NEAIL'S SEPTIC SERVICES TRIB PLATTIN CK VALLES MINES<br />
COUNTRY AIR EST/RETIREMEN TRIB FLOCUM CR VALLES MINES<br />
Electricity Electricity and and Natural Natural Natural Gas<br />
Gas<br />
Ameren UE operates 18 power-generating plants, with five located in the region and<br />
Dynegy operates six, with three located in the region. Ameren IP operates the distribution<br />
system in Illinois. The total capability for all power plants is 12,769 megawatts. Refer to<br />
Figures J 12 and J13 below.<br />
Electricity/Gas Electricity/Gas Providers<br />
Providers<br />
Ameren UE<br />
1901 Chouteau Ave.<br />
St. Louis, Missouri 63103<br />
314-621-3222<br />
Serves Missouri portion of region
A Regional Overview All-Hazard Mitigation Plan<br />
FIGURE FIGURE J12 J12 AMEREN AMEREN UE UE COVERAGE<br />
COVERAGE<br />
Source: Ameren UE<br />
49
50<br />
Laclede Gas Company<br />
720 Olive Street<br />
St. Louis, Missouri 63101<br />
314-342-0500<br />
Serves Missouri portion of region<br />
FIGURE FIGURE J13 J13 LACLEDE LACLEDE GAS GAS COVERAGE<br />
COVERAGE<br />
Source: Laclede Gas<br />
<strong>Jefferson</strong> <strong>County</strong> – Section 1
A Regional Overview All-Hazard Mitigation Plan<br />
Solid Solid Solid Waste Waste Disposal<br />
Disposal<br />
<strong>Jefferson</strong> <strong>County</strong> is a part of the St. Louis-<strong>Jefferson</strong> Solid Waste Management District. The<br />
following list identifies those waste providers for the municipalities identified. See Table<br />
J18 below.<br />
TABLE TABLE J18 J18 SOLID SOLID WASTE WASTE DISPOSAL<br />
DISPOSAL<br />
Jurisdiction<br />
Jurisdiction<br />
Municipal Municipal<br />
Municipal<br />
Directory Directory Directory Waste Waste Provider Provider Provider Address 12976 St. Charles<br />
Provider Provider City City<br />
<strong>Jefferson</strong> Arnold Midwest Waste Rock Rd.<br />
Midwest Waste,<br />
Waste Mngt, M 12976 St. Charles<br />
Bridgeton<br />
<strong>Jefferson</strong> Byrnes Mill & M Hauling Rock Rd Bridgeton<br />
<strong>Jefferson</strong> Cedar Hill Lakes<br />
City of Crystal<br />
<strong>Jefferson</strong> Crystal City City<br />
Waste<br />
130 Mississippi Ave Crystal City<br />
<strong>Jefferson</strong> De Soto Management<br />
Waste<br />
7320 Hall St St. Louis<br />
<strong>Jefferson</strong> Festus Management 7320 Hall St St. Louis<br />
<strong>Jefferson</strong> Herculaneum Republic Waste 18716 State Hwy 177 Jackson<br />
<strong>Jefferson</strong> Hillsboro Republic Waste 18716 State Hwy 177 Jackson<br />
Midwest Waste,<br />
Kraemer<br />
Hauling<br />
12976 St. Charles<br />
Rock Rd Bridgeton<br />
<strong>Jefferson</strong> Kimmswick<br />
Olympian<br />
<strong>Jefferson</strong> Village Republic Waste 18716 State Hwy 177 Jackson<br />
<strong>Jefferson</strong> Parkdale<br />
Waste<br />
<strong>Jefferson</strong> Pevely Management 7320 Hall St St. Louis<br />
<strong>Jefferson</strong> Scotsdale<br />
Solid Waste<br />
Franklin St. Clair Solutions P.O. Box 228 St. Clair<br />
Franklin Sullivan CWI of Missouri 18716 State Hwy 177<br />
12976 St. Charles<br />
Jackson<br />
Franklin Union Midwest Waste Rock Rd<br />
City of<br />
Bridgeton<br />
Franklin Washington Washington 405 <strong>Jefferson</strong> Washington<br />
51
52<br />
<strong>Jefferson</strong> <strong>County</strong> – Section 1<br />
In 1989-1990, there were 13 sanitary landfills in the St. Louis metropolitan area (Missouri-<br />
Illinois), which includes the District, with an estimated remaining lifespan of 8.8 years. One<br />
landfill was publicly owned. By 1995-1996, there were seven sanitary landfills in the<br />
region: three in Missouri and four in Illinois. All landfills but one are now privately owned<br />
and operated. Since 1989-1990, six sanitary landfills have closed and one has been<br />
decommissioned. In the last two years a privately owned landfill in St. Clair <strong>County</strong>, Illinois<br />
has opened. See Table J19 below.<br />
Law Law Enforcement<br />
Enforcement<br />
TABLE TABLE J19 J19 2007 2007 LANDFILLS LANDFILLS IN IN REGION<br />
REGION<br />
Landfill Landfill<br />
<strong>County</strong> State<br />
Fred Weber St. Louis Missouri<br />
Veloia Oak Ridge St. Louis Missouri<br />
Roxana Madison Illinois<br />
WMI - Milam St. Clair Illinois<br />
WMI – Cotton Woods St. Clair Illinois<br />
Source: St. Louis-<strong>Jefferson</strong> Solid Waste Management District<br />
The <strong>Jefferson</strong> <strong>County</strong> Sheriff’s Department includes 196 officers. In addition, Crystal City<br />
has 20 officers, DeSoto has 19 officers, Festus has 29 officers, Hillsboro has 14 officers,<br />
Kimmswick has 6 officers, Pevely has 22 officers, Herculaneum has 17 officers, Byrnes Mill<br />
has 15 officers, Arnold has 46 officers, and Olympian Village has 2 officers. The<br />
departments participate in mutual aid agreements with all incorporated areas within the<br />
county. <strong>Jefferson</strong> <strong>County</strong> officers working in the north zone are headquartered out of High<br />
Ridge. Officers working in the south zone are headquartered out of Hillsboro. Officers<br />
working out of the east zone are headquartered out of Imperial.<br />
Emergency Emergency Services Services (911)<br />
(911)<br />
Emergency management for <strong>Jefferson</strong> <strong>County</strong> is conducted and coordinated by the<br />
<strong>Jefferson</strong> <strong>County</strong> Emergency Management & Public Information Office. They help to<br />
protect, preserve and enhance the quality of life of county residents by working with the<br />
community in managing the mitigation of, preparedness for, response to, and recovery<br />
from natural and technological disasters and intentional destructive acts. Their focus is on<br />
the preservation of: the lives and health of citizens, the environment within which they live,<br />
and their property. They cooperate with participating agencies, municipalities,<br />
organizations, industries and media, then providing the citizens of the county with<br />
information to prepare for and recover from disasters.<br />
The Department of Administration is primarily responsible for staff functions within the<br />
<strong>County</strong> and consists of two staff offices and three line divisions. The functional areas of the<br />
department are the Office of the Contracts and Grants Administrator, the Office of<br />
Emergency Management and Public Information Administrator, the Division of Human<br />
Resources, the Division of General Services, and the Division of Animal Control. The
A Regional Overview All-Hazard Mitigation Plan<br />
address for the Emergency Management Office is the <strong>Jefferson</strong> <strong>County</strong> Courthouse<br />
Basement, 300 Main Street, Hillsboro, MO 63050.<br />
Emergency Emergency Medical Medical Services<br />
Services<br />
The Joachim-Plattin Ambulance District (JPAD) protects 63000 people living in an area of<br />
180 square miles. The district is a public department whose members are on a paid status<br />
and operates out of two stations. Joachim Plattin Ambulance District (JPAD) provides<br />
emergency and non-emergency medical care and transport to the south-eastern region of<br />
<strong>Jefferson</strong> <strong>County</strong>, Missouri (approx 30 miles south of St. Louis). JPAD began providing<br />
service in September 1975. The district includes a wide range of demographics from rural<br />
farming areas, to small cities and areas of heavy industry. JPAD spans across nine separate<br />
fire districts and five different police departments (including <strong>Jefferson</strong> <strong>County</strong> Sheriff's<br />
Department).<br />
<strong>Jefferson</strong> <strong>County</strong> has seven ambulance districts that include the following:<br />
• Big River Ambulance District: P.O. Box 348, Cedar Hill, MO<br />
• Joachim-Plattin Townships Ambulance District: 619 Collins Drive, Festus, Mo<br />
• North <strong>Jefferson</strong> county Ambulance District: P.O. Box 233, High Ridge, MO<br />
• Rock Township Ambulance District: P.O. Box 629, Arnold, MO<br />
• Valle Ambulance District: 12363 Highway 21, Desoto, MO<br />
• Meramec –Ambulance District- House 1 (Unit 8517) 429 <strong>East</strong> Osage, Pacific MO<br />
63069; House 2 (Unit 8527) 3279 Highway 100, Villa Ridge MO.; House, 31768<br />
Highway O, Robertsville, MO. 63072<br />
• Eureka Fire Protection and Ambulance District– House 1, 1060 Hwy W; House 2,<br />
1815 W 5 th ; House 3, 3571 Wright Oak School Rd.<br />
Fire Fire Pr Protection Pr otection<br />
Table 20 lists the 19 fire protection districts providing fire services and their resources in<br />
<strong>Jefferson</strong> <strong>County</strong>.<br />
The districts that service the <strong>County</strong> provide the following resources in Table J20.<br />
TABLE TABLE J20 J20 JEFFERSON JEFFERSON COUNTY COUNTY FIRE FIRE PROTECTI PROTECTION PROTECTI ON RESOURCES 2003<br />
2003<br />
Fire Fire Protection Protection Protection District District Stations Stations Vehicles Staff (Professional (Professional & &<br />
Volunteer)<br />
Volunteer)<br />
Antonia 1 4 36<br />
Cedar Hill 3 5 66<br />
Crystal City 1 6 30<br />
DeSoto City 1 2 34<br />
DeSoto Rural 3 12 50<br />
Dunklin 1 6 30<br />
Eureka 1 N.A. 27<br />
53
54<br />
<strong>Jefferson</strong> <strong>County</strong> – Section 1<br />
TABLE TABLE J20 J20 J20 JEFFERSON JEFFERSON COUNTY COUNTY FIRE FIRE PROTECTI PROTECTION PROTECTI ON RESOURCES 2003 2003<br />
2003<br />
Fire Fire Protection Protection Protection District District Stations Stations Vehicles Staff (Professional (Professional &<br />
Volunteer)<br />
Volunteer)<br />
Goldman 1 7 33<br />
Hematite 2 6 21<br />
Herculaneum 1 8 20<br />
High Ridge 3 5 58<br />
Hillsboro 2 6 38<br />
<strong>Jefferson</strong> R-7 FPD 1 N.A. 41<br />
Mapaville FPD 1 7 25<br />
Pacific 1 N.A. N.A.<br />
Rock Community FPD 4 9 64<br />
Shady Valley 1 7 29<br />
Springdale 2 6 N.A.<br />
Festus 3 10 42<br />
Underground Underground Underground Infrastructure<br />
Infrastructure<br />
Due to homeland security concerns, underground utilities are not mapped in this plan.<br />
According to the Missouri One Call System, Inc. as of April 4, 2003, the following<br />
companies maintain underground utility lines within <strong>Jefferson</strong> <strong>County</strong>. Emergency<br />
information concerning these utility lines in contained in the <strong>County</strong>’s Emergency<br />
Operations Plan. The <strong>Jefferson</strong> <strong>County</strong> Emergency Management director’s telephone<br />
number is 636-797-5381.<br />
The following companies listed in Table J21 have underground lines running through<br />
<strong>Jefferson</strong> <strong>County</strong>:<br />
TABLE TABLE TABLE J21 J21 UNDERGROUND UNDERGROUND INFRASTRUCTURE<br />
INFRASTRUCTURE<br />
Ameren UE AT & T Corp<br />
Broadwing Communications Cablevision, LLC<br />
Charter Citizens Electric Corp<br />
City of Arnold City of Crystal City<br />
City of DeSoto City of Eureka<br />
City of Festus City of Pevely<br />
Crawford Electric Coop, Inc House Springs Sewer Co.<br />
<strong>Jefferson</strong> Co. Public Works <strong>Jefferson</strong> Co. CPWSD-C-1<br />
<strong>Jefferson</strong> Co. PWSD 1 <strong>Jefferson</strong> Co. PWSD 10<br />
<strong>Jefferson</strong> Co. PWSD 2 <strong>Jefferson</strong> Co. PWSD 3<br />
<strong>Jefferson</strong> Co. PWSD 5 <strong>Jefferson</strong> Co. PWSD 6<br />
<strong>Jefferson</strong> Co. PWSD 7 <strong>Jefferson</strong> Co. PWSD 8<br />
KMB Utility Corp Laclede Gas Company<br />
Level 3 Communications Lightcore (DTI)<br />
MCI Worldcom Metropolitan St. Louis Sewer District<br />
Mississippi River Trans Missouri American Water Co.<br />
Missouri Natural Gas Northeast Public Sewer Dist<br />
Northeast Public Sewer Dist Phillips Pipeline Co.<br />
SBC (Southwestern Bell) Sprint Long Distance<br />
Valle Lake Sewer District
A Regional Overview All-Hazard Mitigation Plan<br />
The Missouri One Call utility location telephone number is 1-800-344-7483.<br />
Inventory Inventory of of Housing Housing Structures Structures<br />
Structures<br />
Number Number of of Dwelling Dwelling Units<br />
Units<br />
According to the American Fact Finder 2007 there are 84,919 households in the county<br />
with an average size of 2.69 persons and the median age of residents is 36.2 years.<br />
Median household income is $55,295 annually with 7.4 percent of county families and 9.1<br />
percent of the total population with incomes below the poverty level.<br />
Average Average Unit Unit Cost<br />
Cost<br />
The average dwelling unit cost (including rental properties) for <strong>Jefferson</strong> <strong>County</strong> is<br />
$147,300 up from $91,690 in 2000.<br />
TABLE TABLE J22 J22 JEFFERSON JEFFERSON COUNTY COUNTY COUNTY HOUS HOUSING HOUS HOUSING<br />
ING UNITS<br />
Total Total Housing Housing Units Units<br />
84,919 84,919 Percent<br />
Percent<br />
Unweighted Sample HU Count<br />
Total Housing Units (100 percent Count) 84,919<br />
Est Occupied Housing Units (100 percent Count) 78,867<br />
Est Vacant Housing Units (100 percent Count) 6,052<br />
Pct of Occupied HUs in Sample 92.9<br />
Pct of Vacant HUs in Sample 7.1<br />
TOTAL OCCUPIED HOUSING UNITS 78,867<br />
Owner occupied units 66,679 84.5<br />
Renter occupied units 12,188 15.5<br />
Vacant Housing Units 6,052 7.1<br />
TABLE TABLE TABLE J23 J23 J23 JEFFERSON JEFFERSON JEFFERSON COUNTY COUNTY COUNTY HHOUSING<br />
H OUSING<br />
BREAKDOWN<br />
BREAKDOWN<br />
BREAKDOWN<br />
Total Total Units Units Percent<br />
Percent<br />
Single Family Units 65,498 77.7<br />
2 to 4 Units 3,759 4.4<br />
5 to 19 Units 2,576 3.2<br />
In Buildings with 20+ Units 290 0.3<br />
Mobile Homes 12,115 14.4<br />
Boat, RV, Van, etc. 0 0.0<br />
55
56<br />
Average Average Unit Unit Cost<br />
Cost<br />
Total Total Inventory Inventory of of Structures Structures<br />
Structures<br />
TABLE TABLE J24 J24 VALUE VALUE OOF<br />
O F HOMES IN JEFFERSON<br />
COUNTY<br />
COUNTY<br />
Home Home Home Value Value Number Number Percent<br />
Percent<br />
House Value < $50,000 7,682 11.5<br />
Value $50,000 to $99,999 8,570 12.9<br />
Value $100,000 to $149,999 18,620 28<br />
Value $150,000 to $199,999 15,759 24<br />
Value $200,000 to $299,999 11,433 17.2<br />
Value $300,000 to $499,999 4,109 6.2<br />
Value $500,000 to $999,999 713 1.1<br />
Value $1 million or more 117 0.02<br />
Median House Value $147,300<br />
Source: 2007 U.S. Census<br />
<strong>Jefferson</strong> <strong>County</strong> – Section 1<br />
The total <strong>Jefferson</strong> <strong>County</strong> assessed valuation for the year 2000, including both real estate<br />
and personal property was $1,863,308,707, according to Missouri Department of<br />
Revenue. State assessed utilities accounted for $151,536,040.<br />
TABLE TABLE J25 J25 Inventory Inventory Inventory of of Structures<br />
Structures<br />
Parcel Parcel Classification Classification<br />
Total Assessed # of of Recor Records Recor<br />
ds Average Average Assessed<br />
Assessed<br />
Commercial & Agricultural $1,468,600 32 $45,893.75<br />
Commercial & Agricultural & Residential $4,333,900 30 $144,463.33<br />
Agricultural Vacant $2,598,700 1903 $1,365.58<br />
Agricultural $630,400 255 $2,472.16<br />
Commercial $271,718,000 2089 $130,070.85<br />
Commercial Vacant $15,239,400 350 $43,541.14<br />
Residential $1,006,396,400 61942 $16,247.40<br />
Residential Vacant $44,626,200 16819 $2,653.32<br />
Commercial & Residential $43,678,100 602 $72,554.98<br />
Cities Cities and and Villages Villages (No (No (No Change Change 2000 2000 Census)<br />
Census)<br />
Below is a listing of the municipalities within <strong>Jefferson</strong> <strong>County</strong>. This information is based<br />
on the results of the capabilities questionnaires sent out to all of the jurisdictions. Included<br />
in this listing is demographic statistics, municipal information on mitigation policies,<br />
programs and regulations, as well as asset data. Blanks in the database indicate that the<br />
municipality did not respond to the question.
A Regional Overview All-Hazard Mitigation Plan<br />
TABLE TABLE TABLE J26 J26 Cities Cities and and Villages Villages<br />
2000<br />
2000<br />
<strong>Jefferson</strong> <strong>Jefferson</strong> <strong>Jefferson</strong> <strong>County</strong> <strong>County</strong> unincorporated<br />
unincorporated<br />
unincorporated<br />
Total population 145,820<br />
Classification 1st Class, Home Rule<br />
Leadership structure <strong>County</strong> Executive <strong>Council</strong><br />
Median household income, 1999 $48,470<br />
Total housing units<br />
Housing unit, median year built<br />
54,506<br />
Median gross rent $504<br />
Median owner-occupied housing value $102,081<br />
Master plan yes-'03<br />
Emergency Operations Plan yes<br />
Zoning regulations yes<br />
Building regulations BOCA '96<br />
Subdivision regulations yes<br />
Stormwater regulations yes<br />
Floodplain regulations yes- 2'<br />
Water service Water Districts; individual<br />
Sewer service Sewer Districts; individual<br />
Electric service AmerenUE<br />
Natural gas service MO NG<br />
Fire service multiple<br />
Ambulance service multiple<br />
Arnold<br />
Arnold<br />
Total population 19744<br />
Classification City-3rd class<br />
Leadership structure Mayor/<strong>Council</strong><br />
Median household income, 1999 $47,188<br />
Total housing units 7913<br />
Housing unit, median year built 1972<br />
Median gross rent $575<br />
Median owner-occupied housing value $97,500<br />
Master plan yes<br />
Emergency Operations Plan yes<br />
Zoning regulations yes<br />
Building regulations IBC 2000; #7.30<br />
Subdivision regulations yes<br />
Stormwater regulations yes<br />
Floodplain regulations Zoning sec 6;art 5.76-5.97;ord 7.5, sec5-13<br />
Water service PWSD #1<br />
Sewer service PWSD #10<br />
Electric service AmerenUE<br />
Natural gas service Midwest MO Gas<br />
Fire service RockCom FPD<br />
Ambulance service RockTNAD<br />
57
58<br />
TABLE TABLE TABLE J26 J26 Cities Cities and and Villages Villages<br />
2000<br />
2000<br />
Byrnes Byrnes Byrnes Mill<br />
Mill<br />
Total population 1172<br />
Classification City-4th class<br />
Leadership structure Mayor/<strong>Council</strong><br />
Median household income, 1999 $51,211<br />
Total housing units 935<br />
Housing unit, median year built 1985<br />
Median gross rent $484<br />
Median owner-occupied housing value $121,600<br />
Master plan yes-'91<br />
Emergency Operations Plan yes<br />
Zoning regulations yes<br />
Building regulations IBC 2000<br />
Subdivision regulations yes<br />
Stormwater regulations yes<br />
Floodplain regulations yes<br />
Water service PWSD #1; PWSD #10<br />
Sewer service Byrnes Mill<br />
Electric service AmerenUE<br />
Natural gas service Laclede<br />
Fire service High Ridge FPD<br />
Ambulance Big River AD<br />
Cedar Cedar Hill Hill Lakes<br />
Lakes<br />
Total population 229<br />
Classification Village<br />
Leadership structure Bd of trustees<br />
Median household income, 1999 $54,375<br />
Total housing units 95<br />
Housing unit, median year built 1962<br />
Median gross rent $483<br />
Median owner-occupied housing value<br />
Master plan<br />
Emergency Operations Plan<br />
Zoning regulations<br />
Building regulations<br />
Subdivision regulations<br />
Stormwater regulations<br />
Floodplain regulations<br />
$67,500<br />
Water service community well; indiviual wells<br />
Sewer service individual<br />
Electric service AmerenUE<br />
Natural gas service none<br />
Fire service Cedar Hill FPD<br />
Ambulance service Big River AD<br />
<strong>Jefferson</strong> <strong>County</strong> – Section 1
A Regional Overview All-Hazard Mitigation Plan<br />
TABLE TABLE TABLE J26 J26 Cities Cities and and Villages Villages<br />
2000<br />
2000<br />
Crystal Crystal City<br />
City<br />
Total population 4247<br />
Classification City-3rd class<br />
Leadership structure Mayor/<strong>Council</strong><br />
Median household income, 1999 $36,117<br />
Total housing units 1,769<br />
Housing unit, median year built 1955<br />
Median gross rent $452<br />
Median owner-occupied housing value $85,400<br />
Master plan yes<br />
Emergency Operations Plan yes<br />
Zoning regulations yes<br />
Building regulations IBC 2000; #1374<br />
Subdivision regulations yes<br />
Stormwater regulations yes<br />
Floodplain regulations #1096<br />
Water service Crystal City<br />
Sewer service Crystal City<br />
Electric service AmerenUE<br />
Natural gas service MO NG<br />
Fire service Crystal City FD<br />
Ambulance service JPT AD<br />
Desoto<br />
Desoto<br />
Total population 6375<br />
Classification City-3rd class<br />
Leadership structure Mayor/<strong>Council</strong><br />
Median household income, 1999 $30,725<br />
Total housing units 2741<br />
Housing unit, median year built 1954<br />
Median gross rent $406<br />
Median owner-occupied housing value $67,200<br />
Master plan yes-'60<br />
Emergency Operations Plan yes<br />
Zoning regulations yes<br />
Building regulations BOCA 2000<br />
Subdivision regulations yes<br />
Stormwater regulations yes<br />
Floodplain regulations yes<br />
Water service Desoto<br />
Sewer service Desoto<br />
Electric service AmerenUE<br />
Natural gas service MO NG<br />
Fire service Desoto F&R<br />
Ambulance service Valle AD<br />
59
60<br />
TABLE TABLE TABLE J26 J26 Cities Cities and and Villages Villages<br />
2000<br />
2000<br />
Festus<br />
Festus<br />
Total population 9660<br />
Classification City-3rd class<br />
Leadership structure Mayor/<strong>Council</strong><br />
Median household income, 1999 $36,687<br />
Total housing units 4,040<br />
Housing unit, median year built 1966<br />
Median gross rent $474<br />
Median owner-occupied housing value $87,300<br />
Master plan Yes- -'03<br />
Emergency Operations Plan yes<br />
Zoning regulations yes<br />
Building regulations IBC 2000; #716<br />
Subdivision regulations yes<br />
Stormwater regulations yes<br />
Floodplain regulations Chap 11<br />
Water service Festus<br />
Sewer service Festus<br />
Electric service AmerenUE<br />
Natural gas service MO NG<br />
Fire service Festus FD<br />
Ambulance service JPT AD<br />
Herculaneum<br />
Herculaneum<br />
Total population 2805<br />
Classification City-4th class<br />
Leadership structure Mayor/<strong>Council</strong><br />
Median household income, 1999 $40,365<br />
Total housing units 1078<br />
Housing unit, median year built 1964<br />
Median gross rent $582<br />
Median owner-occupied housing value<br />
Master plan<br />
Emergency Operations Plan<br />
Zoning regulations<br />
Building regulations<br />
Subdivision regulations<br />
Stormwater regulations<br />
Floodplain regulations<br />
$87,400<br />
Water service Herculaneum<br />
Sewer service Herculaneum<br />
Electric service AmerenUE<br />
Natural gas service MO NG<br />
Fire service Herculaneum FD<br />
<strong>Jefferson</strong> <strong>County</strong> – Section 1
A Regional Overview All-Hazard Mitigation Plan<br />
TABLE TABLE TABLE J26 J26 Cities Cities and and Villages Villages<br />
2000<br />
2000<br />
Ambulance service JPT AD<br />
Hillsboro<br />
Hillsboro<br />
Total population 1675<br />
Classification City-4th class<br />
Leadership structure Mayor/<strong>Council</strong><br />
Median household income, 1999 $36,850<br />
Total housing units 620<br />
Housing unit, median year built 1971<br />
Median gross rent $501<br />
Median owner-occupied housing value $93,800<br />
Master plan yes<br />
Emergency Operations Plan yes<br />
Zoning regulations yes<br />
Building regulations yes<br />
Subdivision regulations yes<br />
Stormwater regulations yes<br />
Floodplain regulations yes<br />
Water service Hillsboro<br />
Sewer service Hillsboro<br />
Electric service AmerenUE<br />
Natural gas service MO NG<br />
Fire service Hillsboro FPD<br />
Ambulance service Valle AD<br />
Kimmswick<br />
Kimmswick<br />
Total population 94<br />
Classification City-4th class<br />
Leadership structure Mayor/<strong>Council</strong><br />
Median household income, 1999 $54,688<br />
Total housing units 36<br />
Housing unit, median year built pre1940<br />
Median gross rent $650<br />
Median owner-occupied housing value $121,400<br />
Master plan<br />
Emergency Operations Plan<br />
Zoning regulations<br />
Building regulations<br />
Subdivision regulations<br />
Stormwater regulations<br />
Floodplain regulations<br />
Water service PWSD #10<br />
Sewer service<br />
Electric service AmerenUE<br />
61
62<br />
TABLE TABLE TABLE J26 J26 Cities Cities and and Villages Villages<br />
2000<br />
2000<br />
Natural gas service none<br />
Fire service RockCom FPD<br />
Ambulance service RockTNAD<br />
Olympian Olympian Village<br />
Village<br />
Total population 669<br />
Classification City-4th class<br />
Leadership structure Mayor/<strong>Council</strong><br />
Median household income, 1999 $41,447<br />
Total housing units 232<br />
Housing unit, median year built 1974<br />
Median gross rent $467<br />
Median owner-occupied housing value<br />
Master plan<br />
Emergency Operations Plan<br />
Zoning regulations<br />
Building regulations<br />
Subdivision regulations<br />
Stormwater regulations<br />
Floodplain regulations<br />
$72,800<br />
Water service PWSD #5<br />
Sewer service Olympian Village<br />
Electric service AmerenUE<br />
Natural gas service MO NG<br />
Fire service <strong>Jefferson</strong> R-7 FPD<br />
Ambulance service Valle AD<br />
Parkdale<br />
Parkdale<br />
Total population 205<br />
Classification Village<br />
Leadership structure Bd of Trustees<br />
Median household income, 1999 $52,000<br />
Total housing units 71<br />
Housing unit, median year built 1958<br />
Median gross rent $0<br />
Median owner-occupied housing value $63,900<br />
Master plan<br />
Emergency Operations Plan<br />
Zoning regulations<br />
Building regulations<br />
Subdivision regulations<br />
Stormwater regulations<br />
Floodplain regulations<br />
Water service<br />
<strong>Jefferson</strong> <strong>County</strong> – Section 1
A Regional Overview All-Hazard Mitigation Plan<br />
TABLE TABLE TABLE J26 J26 Cities Cities and and Villages Villages<br />
2000<br />
2000<br />
Sewer service<br />
Electric service<br />
Natural gas service<br />
Fire service High Ridge FPD<br />
Ambulance service NJC AD<br />
Pevely<br />
Pevely<br />
Total population 3768<br />
Classification City-4th class<br />
Leadership structure Mayor/<strong>Council</strong><br />
Median household income, 1999 $34,916<br />
Total housing units 1482<br />
Housing unit, median year built 1980<br />
Median gross rent $379<br />
Median owner-occupied housing value $80,200<br />
Master plan yes-'96<br />
Emergency Operations Plan yes<br />
Zoning regulations yes<br />
Building regulations IBC 2000; #958<br />
Subdivision regulations yes<br />
Stormwater regulations yes<br />
Floodplain regulations FEMA model #956<br />
Water service Pevely<br />
Sewer service Pevely<br />
Electric service AmerenUE<br />
Natural gas service MO NG<br />
Fire service Dunklin FPD<br />
Ambulance service JPT AD<br />
Scotsdale Scotsdale<br />
Scotsdale<br />
Total population 211<br />
Classification Town<br />
Leadership structure Bd of Trustees<br />
Median household income, 1999 $53,750<br />
Total housing units 68<br />
Housing unit, median year built 1978<br />
Median gross rent $563<br />
Median owner-occupied housing value $95,800<br />
Master plan<br />
Emergency Operations Plan<br />
Zoning regulations<br />
Building regulations<br />
Subdivision regulations<br />
63
64<br />
TABLE TABLE TABLE J26 J26 Cities Cities and and Villages Villages<br />
2000<br />
2000<br />
Stormwater regulations<br />
Floodplain regulations<br />
Water service<br />
Sewer service<br />
Electric service<br />
Natural gas service<br />
Fire service Cedar Hill FPD<br />
Ambulance service Big River AD<br />
<strong>Jefferson</strong> <strong>County</strong> – Section 1
A Regional Overview All-Hazard Mitigation Plan 1<br />
SECTION SECTION 2<br />
2<br />
Risk Risk Assessment<br />
Assessment<br />
Hazard Hazard Identification Identification and and Elimination Elimination Elimination Process<br />
Process<br />
During the course of this study, many sources were researched for data relating to hazards.<br />
Primary sources included FEMA, SEMA, National Climate Data Center (NCDC) and the<br />
National Oceanic and Atmospheric Administration (NOAA). The U.S. Geological Survey<br />
(USGS) and Center for Earthquake Research and Information (CERI), Central U.S.<br />
Earthquake Consortium (CUSEC) were major sources for earthquake information. MDNR’s<br />
Dam and Reservoir Safety Program provided major information concerning dams.<br />
Additional research was based on data from USACE, National Park Service, National Forest<br />
Service, other departments within Missouri Department of Natural Resources, St. Louis<br />
University, State of Missouri Climatologist, Missouri Department of Conservation, and<br />
University of Missouri, Columbia. Additional sources included county officials; existing<br />
county, regional and state plans, reports on the floods of 1993 and 1995; position papers<br />
on transportation issues and information from local officials and residents. Past State and<br />
federal disaster designations, current Flood Insurance Rate Maps (FIRMS) and available local<br />
mitigation plans were also utilized.<br />
In order to identify the hazards relevant to <strong>Jefferson</strong> <strong>County</strong>, the above information sources<br />
were searched for incidents of all possible hazards occurring within the county. Some<br />
hazards are regional in scope and included in the hazard profiles. Location-specific hazards<br />
not found through the information search were further investigated to determine whether<br />
there would be a future possibility of occurrence. Hazard event histories, repetitive loss<br />
information and conversations with local residents were used to identify relevant hazards.<br />
Communi Community Communi Community<br />
ty-Wide ty Wide Hazard Profile and List of Hazards Identified<br />
The largest disaster to impact <strong>Jefferson</strong> <strong>County</strong> in the recent past was the Great Flood of<br />
1993. The loss of homes, businesses and infrastructures, as well as the temporary closing<br />
of some local businesses, contributed to economic losses throughout the <strong>County</strong> and<br />
beyond. Several hazards can affect <strong>Jefferson</strong> <strong>County</strong>. History indicates that <strong>Jefferson</strong><br />
<strong>County</strong> could be at risk of tornadoes and severe thunderstorms, riverine flooding (including<br />
flash flooding), severe winter weather (snow, ice, extreme cold), drought, heat wave,<br />
earthquakes, wildfires and dam failures. Worksheet #1, <strong>Jefferson</strong> <strong>County</strong> Hazard<br />
Identification and Analysis, is included at the end of the Technical Appendix and shows<br />
earthquakes as the hazard with the greatest possible impact. <strong>Jefferson</strong> <strong>County</strong> has<br />
experienced a number of slight tremors from the New Madrid Fault Zone. Disasters ranked<br />
in descending order after earthquakes include flood, dam, severe windstorms, winter<br />
weather, drought, wildfires, and heat wave.
2<br />
<strong>Jefferson</strong> <strong>County</strong> – Section 2<br />
These disasters can precipitate cascading hazards or those hazards caused as a result of<br />
disasters. Cascading hazards could include interruption of power supply, water supply,<br />
business and transportation. Disasters also can cause civil unrest, computer failure and<br />
environmental health hazards. Any of these, alone or in combination, could possibly<br />
impact emergency response activities. Table J27A shows the relationships found between<br />
<strong>Jefferson</strong> <strong>County</strong>’s disasters and categories of possible cascading disasters. Examples of<br />
specific disasters include nuclear power plant damage, hazardous materials release, mass<br />
transportation accidents and disease outbreak due to unsanitary conditions.<br />
Hazards Hazards Not Not Included Included and and Reasons Reasons For For Elimi Elimination Elimi nation<br />
Based on the lack of documented historical occurrence and research, it was determined<br />
that the following hazards would not be evaluated for the purposes of this Hazard<br />
Mitigation Plan: coastal storms, hurricanes, tsunamis, avalanche and volcanic activity.<br />
These hazards do not exist within <strong>Jefferson</strong> <strong>County</strong> due to its geographic location and<br />
geologic conditions.<br />
TABLE J27A CASCADING HAZARDS HAZARDS RESULTING RESULTING FROM FROM DISASTERS DISASTERS<br />
DISASTERS<br />
Disaster<br />
Disaster<br />
Power Power &<br />
&<br />
Communications<br />
Communications<br />
Interruption<br />
Interruption<br />
Water Water Supply<br />
Supply<br />
Interruption<br />
Interruption<br />
Business Business<br />
Interruption<br />
Interruption<br />
Civil Civil Unrest<br />
Unrest<br />
Computer Computer Failure<br />
Failure<br />
& & Loss Loss of of Records Records<br />
Transportation<br />
Transportation<br />
Interruption<br />
Interruption<br />
Health Health &<br />
&<br />
Environmental<br />
Environmental<br />
Hazard<br />
Hazard<br />
Tornado/<br />
Tornado/<br />
Windstorm<br />
Windstorm<br />
X X X X X X X<br />
Flood Flood X X X X X X<br />
Winter Winter X X X X X X<br />
Drought Drought<br />
X X<br />
Heat Heat<br />
X X X<br />
Earthquake/<br />
Earthquake/<br />
Landsl Landslide Landsl ide<br />
X X X X X X X<br />
Dams Dams X X X X X X<br />
Fires Fires Fires<br />
X X X<br />
X = More than 50% chance of a side effect in the case of a disaster<br />
Flood Flood Hazard Hazard Profile<br />
Profile<br />
The Mississippi River is the eastern boundary of the <strong>County</strong>. <strong>Jefferson</strong> <strong>County</strong> is just<br />
downstream from the Missouri River. <strong>Jefferson</strong> <strong>County</strong> is highly susceptible to annual<br />
flooding events in the spring. Flooding poses a threat to lives and safety and can cause<br />
severe damage to public and private property. With the exception of fire, floods are the<br />
most common and widespread of all disasters. Most communities in the United States<br />
have experienced some kind of flooding, after spring rains, heavy thunderstorms or winter<br />
snow thaws. Refer to Figures J14 and J15 below.
A Regional Overview All-Hazard Mitigation Plan 3<br />
FIGURE FIGURE J14 J14<br />
FIGURE FIGURE J15<br />
J15<br />
Satellite image of flooding at Aerial photo along the Mississippi River 1993<br />
Missouri/Mississippi River confluence.<br />
Background<br />
Background<br />
Background<br />
The first step to floodplain management as a nonstructural alternative to flood control was<br />
incorporated into the National Flood Insurance Act of 1968. This was 40 years after the<br />
Flood Control Act of 1928 that authorized the United States Corps of Engineers (USACE) to<br />
control the Mississippi River with dams, levees and diversion channels. This Act authorized<br />
the USACE to undertake a structural approach to reducing flood damages (thus keeping<br />
water from people). After numerous floods, and having spent billions of dollars on floods<br />
and disasters, Congress looked at another approach to reduce flood losses, adding a nonstructural<br />
approach in the National Flood Insurance Act of 1968. The National Flood<br />
Insurance program (NFIP) required local governments to adopt regulations governing new<br />
development activities in identified flood plains in order to be eligible for the sale of flood<br />
insurance within their jurisdictions.<br />
Description Description of of Hazard<br />
Hazard<br />
Flooding is a natural event and has been characteristic of rivers throughout history. It<br />
becomes a disaster when it is of such magnitude that both man-made and natural<br />
landforms and human lives are destroyed or seriously damaged (Gaffney). Through<br />
analysis of existing federal Flood Insurance Rate Maps (FIRM) and Flood Insurance Studies,<br />
the Hazard Mitigation Plan Unit of EWG has determined that the counties included in the<br />
EWG planning region including St. Louis <strong>County</strong>, St. Charles <strong>County</strong>, Franklin <strong>County</strong>,<br />
<strong>Jefferson</strong> <strong>County</strong> and the City of St. Louis have 100-year floodplains (in addition to 500year<br />
floodplains) and may be affected by flooding hazards. A variety of factors affect the<br />
type and severity of flooding throughout the planning region, including urban<br />
development and infrastructure and topography.
4<br />
<strong>Jefferson</strong> <strong>County</strong> – Section 2<br />
A flood is defined as an overflow or inundation that comes from a river or other body of<br />
water (Barrows, 1948) and causes or threatens damage or any relatively high streamflow<br />
overtopping the natural or artificial banks in any reach of a stream (Leopold and Maddock,<br />
1954). A flood is defined by the National Flood Insurance Program as: “A general and<br />
temporary condition of partial or complete inundation of two or more acres of normally<br />
dry land area or of two or more properties from:<br />
• Overflow of inland or tidal waters,<br />
• Unusual and rapid accumulation or runoff of surface waters from any source, or<br />
• A mudflow.<br />
Characteristics<br />
Characteristics<br />
Riverine flooding includes headwater, backwater, and interior drainage. Floods can be<br />
slow or fast rising, depending on the intensity of the rainstorms in the watershed over a<br />
certain length of time, or from rapid snowmelt or icemelt. Floods generally develop over a<br />
period of days. During heavy rains from storm systems (including severe thunderstorms),<br />
water flows down the watershed, collecting in, and then overtopping, valley streams and<br />
rivers.<br />
Flash flooding is characterized by rapid accumulation or runoff of surface waters from any<br />
source. This type of flooding can occur within six hours of a rain event, after a dam or<br />
levee failure, or the sudden release of water held by an ice or debris dam. Because flash<br />
flood can develop in just a matter of hours, flash floods can catch people unprepared and<br />
most flood-related deaths result from this type of flooding. Most flash flooding is caused<br />
by slow-moving thunderstorms or heavy rains.<br />
Several factors contribute to both riverine and flash flooding. Two key elements are rainfall<br />
intensity (the rate of rainfall) and duration (length of time that the rainfall lasts). Type of<br />
ground cover, soil type and topography all play important roles in flooding.<br />
Flooding potential is further exacerbated in urban areas (disturbed lands) by the increased<br />
runoff up from two to six times over what would occur on undisturbed terrain. Soils lose<br />
their ability to absorb rain as land is converted from fields or woodlands to buildings and<br />
pavement. During periods of urban flooding, streets become rivers, and basements and<br />
viaducts become death traps as they fill with water.<br />
Floodplains are located in relatively flat lowland areas and adjoin rivers and streams. These<br />
lowland areas adjacent to rivers and stream banks serve to carry excess floodwater during<br />
rapid runoff. Floodplains are a vital part of a larger entity called a watershed basin. A<br />
watershed basin is defined as all the land drained by a river and its branches. In some<br />
cases, flooding may not be attributed to a river, stream or lake. It may be the combination<br />
of excessive rainfall, snowmelt, saturated ground and inadequate drainage.The term “base<br />
flood” or 100-year flood is the area in the floodplain that is subject to a one percent or<br />
greater chance of flooding in any given year, based on historical records. A 500-year flood
A Regional Overview All-Hazard Mitigation Plan 5<br />
is defined as the area in the floodplain that has a .2% probability of occurring in any given<br />
year. While unlikely, it is possible to have two 100 or even 500 year floods within years or<br />
months of each other. The primary use for these terms is for the determination of flood<br />
insurance rates in flood hazard areas. Using historic weather and hydrograph data the<br />
estimated rate of flow or discharge of a river or creek is derived. After extensive study and<br />
coordination with Federal and State agencies, this group recommended that the 1-percentannual-chance<br />
flood (also referred to as the 100-year or “Base Flood”) be used as the<br />
standard for the NFIP.<br />
The 1-percent-annual-chance flood was chosen on the basis that it provides a higher level<br />
of protection while not imposing overly stringent requirements or the burden of excessive<br />
costs on property owners. The 1-percent-annual-chance flood (or 100-year flood)<br />
represents a magnitude and frequency that has a statistical probability of being equaled or<br />
exceeded in any given year, or the 100-year flood has a 26 percent (or 1 in 4) chance of<br />
occurring over the life of a 30-year mortgage.<br />
Likely Likely Locations<br />
Locations<br />
In certain areas of <strong>Jefferson</strong> <strong>County</strong>, steep slopes can induce high velocities as the water<br />
flows downhill and downstream, in many cases producing flash flooding conditions.<br />
Because some areas in <strong>Jefferson</strong> <strong>County</strong> are located in low areas, and therefore, often in<br />
the floodplain, floodwaters have the potential to affect or even severely harm portions of<br />
the community, especially if the floodwalls or levees fail.<br />
There is a 3.2 mile 500-year federal levee in the Festus-Crystal City area on the Missouri side<br />
of the Mississippi River in <strong>Jefferson</strong> <strong>County</strong>; however there are federal levees on the Illinois<br />
side that extend as far south as Ste. Genevieve <strong>County</strong>, Missouri. During floods, these<br />
levees would force higher floodwaters to inundate the Missouri side of the river. The<br />
failure of the federal levees would lower the floodwaters and reduce the flooding impact<br />
on the Missouri side. These conditions that exist in areas where flash floods are a problem<br />
make response operations and evacuation very difficult, adversely affecting the safety of<br />
the residents.<br />
Type Type of of of Damage<br />
Damage<br />
Damage incurred as a result of flooding includes the inundation of residences,<br />
outbuildings, businesses, churches stormwater, mud, rock, trees, debris, trash, and<br />
chemical pollutants. Depending upon the severity of the flood and the volume and rate of<br />
flow of the water, floodwaters may be capable of carrying vehicles, whole or parts of<br />
buildings, etc.<br />
During spring and summer 1993, record flooding inundated much of the upper Mississippi<br />
River Basin. The magnitude of the damages -- in terms of property, disrupted business, and<br />
personal trauma -- was unmatched by any other flood disaster in United States history .<br />
Property damage alone was over $20 billion. Damaged highways and submerged roads
6<br />
<strong>Jefferson</strong> <strong>County</strong> – Section 2<br />
disrupted overland transportation throughout the flooded region. The Mississippi and the<br />
Missouri Rivers were closed to navigation before, during, and after the flooding. Millions of<br />
acres of productive farmland remained under water for weeks during the growing season.<br />
and severe erosion occurred. The banks and channels of many rivers were severely eroded,<br />
and sediment was deposited over large areas of the basin's flood plain. Record flows<br />
submerged many areas that had not been affected by previous floods. Industrial and<br />
agricultural areas were inundated, which caused concern about the transport and fate of<br />
industrial chemicals and sewage effluent in the floodwaters . The extent and duration of<br />
the flooding caused numerous levees to fail.<br />
Hazard Hazard Event Event History<br />
History<br />
The largest disaster to impact <strong>Jefferson</strong> <strong>County</strong> in recent years was the flood of 1993. Its<br />
size and impact was unprecedented and has been considered the most costly and<br />
devastating flood to ravage the U.S. in modern history. The number of record river levels,<br />
its aerial extent, the number of persons displaced, amount of property damage and the<br />
flood’s duration surpassed all earlier U.S. floods in modern times.<br />
The following gives an account of locations and areas that were affected by the inundation<br />
of water during the 1993 flood. Based on a workshop meeting held on October 17, 2003<br />
with <strong>Jefferson</strong> <strong>County</strong> officials and other community emergency management agencies, the<br />
following locations were specifically identified as locations that become flooded during<br />
various rainfall events in 1993. In DeSoto, Joachim Creek and North Main along Cedar<br />
Street became inundated from floodwaters and flash flooding occurred near the high<br />
school. In Festus, the community flooded in 1993 and has experienced problems with<br />
storm drainage and creeks. Also in 1993, Rock Creek in Kimmswick flooded Highway K<br />
and Highway K Bridge. Other areas of <strong>Jefferson</strong> <strong>County</strong> experienced significant flooding at<br />
the confluence of the Big River and Meramec River, including Highway BB, <strong>West</strong> Old<br />
Highway 21, Highway 61/67 and Highway 55. Several areas in community of Arnold<br />
experienced significant flooding impacts, including Twin River Road, Big Bend Road,<br />
Meadow Drive, Riffle Island, State Road BB, and River Bend Acres. <strong>West</strong> of Pevely on<br />
Highway Z between Sandy Creek and Cherry Lane, 1993 floodwaters inundated the bridge;<br />
mitigation for this stretch entailed the raising of the road and replacement of the bridge.<br />
Refer to Figure J16 below.
A Regional Overview All-Hazard Mitigation Plan 7<br />
FIGURE IGURE J16 1993 MIDWEST FLOOD<br />
Source: U.S. Army Corps of Engineers
8<br />
<strong>Jefferson</strong> <strong>County</strong> – Section 2<br />
Areas hardest hit by the 1993 flooding were along the Mississippi and Meramec Rivers in<br />
the eastern and northern portions of <strong>Jefferson</strong> <strong>County</strong>. The existing levee system (federal<br />
levees along the Illinois side of the Mississippi River) intended to aid in protecting the<br />
Illinois side from the potential of flooding endured extreme pressures from extended<br />
duration of the high river levels. The presence of the Illinois federal levees resulted in the<br />
inundation of floodwaters on the Missouri side of the Mississippi River. Illinois levee<br />
failures resulted in the relief from floodwaters on the Missouri side of the Mississippi River.<br />
During the 1993 flood, commuting was interrupted when various bridges north of the<br />
<strong>Jefferson</strong> <strong>County</strong> area over the Mississippi River were closed due to flooding. Commuting<br />
was also heavily interrupted when Highway 40-64 was closed due to the overtopping of<br />
the Monarch Levee in Chesterfield, Missouri. Prolonged flooding on the Highway 40-61<br />
created economic loss and hardship impacts on the St. Louis metropolitan region. They<br />
provided critical access to employment, healthcare, emergency services, education, retail<br />
and commerce activities and transportation of goods and services. They provide critical<br />
access to employment, healthcare, emergency services, education, retail and commerce<br />
activities and transportation of goods and services.<br />
Approximately 138 homes were bought out as a result of flooding in <strong>Jefferson</strong> <strong>County</strong>.<br />
FEMA estimated the total dollar loss for housing units alone was $3,483,868 for <strong>Jefferson</strong><br />
<strong>County</strong> as of January 9, 2001. While some households carried adequate flood insurance<br />
on their dwellings, about 82 percent of the dwellings in the affected areas were either<br />
underinsured or not insured for flood. Unfortunately this left a portion of the county’s<br />
labor force homeless for a period of time, adding to the economic loss. From the Disaster<br />
Declaration of 1993 (DR-0995), <strong>Jefferson</strong> <strong>County</strong> received $1,527,199 in public assistance.<br />
From the 1995 disaster (DR-1054), <strong>Jefferson</strong> <strong>County</strong> received $89,928 in public assistance.<br />
From the 2000 disaster (DR-1328), <strong>Jefferson</strong> <strong>County</strong> received $483,511.22 in individual<br />
assistance, $473,000 in SBA assistance and $574,002.26 in public assistance. From the<br />
2002 disaster (R-1412), <strong>Jefferson</strong> <strong>County</strong> received $31,192.35 in individual assistance and<br />
$20,000 in SBA assistance. In the 2003 disaster (DR-1463), <strong>Jefferson</strong> <strong>County</strong> received<br />
$2,082,045.99 in individual assistance, $3,411,600 in SBA assistance and $353,632.20 in<br />
public.<br />
The U.S. Army Corps of Engineers (USACE) produced a set of maps showing damage<br />
estimates for the 1993 flood. According to the maps, <strong>Jefferson</strong> <strong>County</strong> damages included:<br />
Greater than $10 million in commercial properties damages<br />
Between $1 and $5 million in public facilities damages<br />
Between $1 and $5 million in residential damages<br />
Greater than $10 million in transportation system damage<br />
Between $500,000 and $10 million in utilities damages<br />
Greater than $1 million is emergency expenses<br />
Statewide data was collected by USACE for seven specific areas of damages and costs and<br />
for one general area. Information was collected for residential, commercial/industrial,
A Regional Overview All-Hazard Mitigation Plan 9<br />
public facilities, transportation, utilities, agriculture and emergency services. The general<br />
area was an attempt to cover what might be thought of as secondary costs of the<br />
flooding. These were the costs of buyout, mitigation, mission, unemployment assistance<br />
and crisis counseling.<br />
Buyout and relocation costs were typically received from local officials. These costs are<br />
typically included in the mitigation costs rather than presented separately. USACE derived<br />
mitigation costs from the FEMA DSRs, from SBA reports and from Housing and Urban<br />
Development (HUD) officials. In most cases, the mitigation costs were well reported and<br />
include monies that went for buyouts. Unemployment costs, including both<br />
unemployment and food aid assistance costs, were derived from FEMA and USDA reports.<br />
The commercial variable included all commercial and industrial damages for the Missouri<br />
area. The figures for all parts of the commercial/industrial damages were derived from<br />
FEMA, SBA, and state and local sources. Refer to Figure J17 below. The equipment<br />
damages for both commercial and industrial are found in the commercial equipment<br />
damages variable. These estimates come from FEMA, SBA and local sources. Commercial<br />
and industrial revenues lost under the commercial variable. These estimates come from SBA<br />
and local sources.
10<br />
FIGURE FIGURE J17 J17 COMMERCIAL COMMERCIAL AND AND INDUSTRIAL INDUSTRIAL (1993)<br />
(1993)<br />
<strong>Jefferson</strong> <strong>County</strong> – Section 2
A Regional Overview All-Hazard Mitigation Plan 11<br />
Source: U.S. Army Corps of Engineers<br />
FEMA Damage Survey Reports (DSRs) and local sources were used for the various<br />
categories of damage to public facilities. The variables included under this category were<br />
number of and damages to public structures, public equipment damage, costs of public<br />
restoration and debris clearance, damages to parks and recreation facilities, and damages<br />
to water control facilities. The latter variable was drawn from U.S. Department of<br />
Agriculture and USACE sources as well as those sources used for the other public variables.<br />
Refer to Figure J18 below.
12<br />
FIGURE FIGURE J18 J18 PUBLIC PUBLIC FACILITIES FACILITIES FACILITIES (1993)<br />
(1993)<br />
<strong>Jefferson</strong> <strong>County</strong> – Section 2
A Regional Overview All-Hazard Mitigation Plan 13<br />
Source: U.S. Army Corps of Engineers<br />
USACE gathered residential data on the numbers of residences damaged, structure<br />
damage and content damage. This category included residential damage figures for both<br />
structure and content unseparated in Missouri. Refer to Figure J19 below.
14<br />
FIGURE FIGURE J19 J19 RESIDENTIAL RESIDENTIAL PROPERTIES PROPERTIES (1993)<br />
(1993)<br />
<strong>Jefferson</strong> <strong>County</strong> – Section 2
A Regional Overview All-Hazard Mitigation Plan 15<br />
Source: U.S. Army Corps of Engineers<br />
Variables for railroad damages were miles of lines flooded, amount of damages, and<br />
revenues lost. These were determined by contacting the private railroad companies, local<br />
officials, and the Federal Railroad Administration. Refer to Figure J20 below. Variables for<br />
trucking damages were the number of trucking companies experiencing damage, the<br />
amount of damages, and revenues lost. Only in Kansas City and St. Louis USACE Districts<br />
were damages in this category reported. Damages to airports included numbers of airports<br />
damaged, amounts of that damage, and revenues lost by airports. Transportation damages<br />
were also acquired on miles of roads flooded; traffic rerouting costs, and damages to roads<br />
and bridges.
16<br />
FIGURE FIGURE J20 J20 TRANSPORTATION TRANSPORTATION (1993)<br />
(1993)<br />
<strong>Jefferson</strong> <strong>County</strong> – Section 2
A Regional Overview All-Hazard Mitigation Plan 17<br />
Source: U.S. Army Corps of Engineers<br />
The utilities damages covered water, sewer, electric and general utilities in Missouri. Data<br />
regarding utilities damage was sought from state departments of natural resources or<br />
environmental protection, the FEMA DSRs and local officials. Names of some water<br />
facilities, evidently those that suffered some damage, are included in the records. Numbers<br />
of water customers affected and dollar amounts of water facilities damage were more<br />
frequently reported. Very few areas reported lost water revenues. Refer to Figure J21<br />
below. More information is available on sewerage systems as both the numbers damaged<br />
and the dollar amounts of that damage are available.<br />
Flood damages to the electrical power distribution system were collected through<br />
discussions with local, regional and state officials, the FEMA DSRs and officials of the<br />
involved electric companies. Variables are presented for number of companies affected,<br />
number of customers affected, dollar damages to the companies and revenues lost. The<br />
final utilities variable, utility systems - general, was specifically used in the USACE St. Louis<br />
District counties to report gas utility company damages. That information was obtained<br />
from gas company officials. Otherwise, the FEMA DSRs were the primary sources for utility<br />
damages not specifically assignable.
18<br />
FIGURE FIGURE J21A J21A UTILITIES UTILITIES DAMAGES DAMAGES (1993)<br />
<strong>Jefferson</strong> <strong>County</strong> – Section 2
A Regional Overview All-Hazard Mitigation Plan 19<br />
Source: U.S. Army Corps of Engineers<br />
The two emergency cost variables are the emergency preparedness and response costs and<br />
the evacuation costs. The former was primarily derived from the FEMA DSRs, with<br />
supplemental data coming from some local and regional officials. The latter variable came<br />
from these same sources, as well as the Red Cross and FEMA Disaster Field Offices. The<br />
final variable, crisis counseling, was derived from FEMA reports and state sources. Refer to<br />
Figure J22 below.<br />
According to the Department of Economic Development and Department of Labor and<br />
Industrial Relations, employment impact and the occurrence of the 1993 floods did not<br />
show a direct correlation in the <strong>Jefferson</strong> <strong>County</strong> area. July, August, September, October<br />
and November’s unemployment rate are as follows: 6.6, 6.4, 5.4, 5.2, and 5.1,<br />
respectively. The region was just recovering from a recession and the rates reflect a higher<br />
than normal unemployment rate due to the recession. The decrease in the unemployment<br />
rate from August to September was the result of the student population going back to<br />
school. In addition, manufacturing industries were closed for up to two weeks and<br />
incurred damages.<br />
Infrastructure problems included contaminated wells, collapsed wells, destroyed pumping<br />
equipment, failed sewage treatment facilities or private septic systems, contaminated<br />
ground and drinking water, sewage backups and treatment facilities seriously purged by<br />
the floodwaters.
20<br />
FIGURE FIGURE J21B J21B EMERGENCY EMERGENCY EXPENSES EXPENSES (1993)<br />
(1993)<br />
Source: U.S. Army Corps of Engineers<br />
<strong>Jefferson</strong> <strong>County</strong> – Section 2
A Regional Overview All-Hazard Mitigation Plan 21<br />
Frequency Frequency of of of Occurrence Occurrence<br />
Occurrence<br />
The <strong>East</strong>-<strong>West</strong> <strong>Gateway</strong> <strong>Council</strong> of Governments planning region has many river and small<br />
tributaries in both the unincorporated and incorporated areas that are susceptible to<br />
flooding. Major floods have affected the citizens of the planning region as early as 1785.<br />
Table J28 below illustrates major flood events on the Mississippi and Meramec Rivers. In<br />
1993, 1994 and 2001, major flood events occurred in the planning region and<br />
surrounding areas. There have been 14 major flood events since 1785. The history of river<br />
crest levels along the Mississippi River north of <strong>Jefferson</strong> <strong>County</strong> at St. Louis helps to<br />
illustrate the risk, severity and repetitiveness and along the Meramec River.<br />
TABLE TABLE TABLE J27B J27B J27B MISSISSIPPI MISSISSIPPI MISSISSIPPI AND AND AND MERAMEC MERAMEC MERAMEC RIVER RIVER RIVER FLOOD FLOOD FLOOD STAGES STAGES STAGES NEAR NEAR NEAR JEFFERSON JEFFERSON<br />
JEFFERSON<br />
COUNTY<br />
COUNTY<br />
Station Station<br />
Stage (Flood Stage 30 ft) Date<br />
Mississippi River at St. Louis 42.0 4/1/1785<br />
Mississippi River at St. Louis 40.3 7/2/1947<br />
Mississippi River at St. Louis 40.2 7/22/1951<br />
Mississippi River at St. Louis 43.23 4/28/1973<br />
Mississippi River at St. Louis 39.27 12/7/1982<br />
Mississippi River at St. Louis 39.0 5/4/1983<br />
Mississippi River at St. Louis 33.8 4/24/1984<br />
Mississippi River at St. Louis 33.5 4/8/1985<br />
Mississippi River at St. Louis 39.13 10/9/1986<br />
Mississippi River at St. Louis 49.58 8/1/1993<br />
Mississippi River at St. Louis 36.6 4/15/1994<br />
Mississippi River at St. Louis 41.89 5/221995<br />
Mississippi River at St. Louis 35.35 6/2/1996<br />
Mississippi River at St. Louis 34.79 6/10/2001<br />
Station Station<br />
Stage (Flood Stage 18 ft) Date Date<br />
Meramec River at Eureka 33.4 4/14/1979<br />
Meramec River at Eureka 42.9 12/6/1982<br />
Meramec River at Eureka 36.6 5/3/1983<br />
Meramec River at Eureka 31.3 2/26/1985<br />
Meramec River at Eureka 26.8 4/2/1985<br />
Meramec River at Eureka 29.2 6/21/1985<br />
Meramec River at Eureka 34.6 11/22/1985<br />
Meramec River at Eureka 25.1 12/29/1987<br />
Meramec River at Eureka 25.2 5/28/1990<br />
Meramec River at Eureka 35.9 9/26/1993<br />
Meramec River at Eureka 35.6 11/17/1993<br />
Meramec River at Eureka 30.4 5/20/1995<br />
Meramec River at Eureka 29.9 4/30/1996<br />
Meramec River at Eureka 26.33 5/11/2002<br />
Station Station<br />
Stage (Flood (Flood Stage 16 16 ft) ft) Date<br />
Meramec River at Valley Park 34.4 2/1/1916<br />
Meramec River at Valley Park 39.73 12/6/1982
22<br />
<strong>Jefferson</strong> <strong>County</strong> – Section 2<br />
TABLE TABLE TABLE J27B J27B MISSISSIPPI MISSISSIPPI AND AND MERAMEC MERAMEC RIVER RIVER FLOOD FLOOD FLOOD STAGES STAGES NEAR NEAR JEFFERSON<br />
JEFFERSON<br />
COUNTY<br />
COUNTY<br />
Meramec River at Valley Park 33 5/3/1983<br />
Meramec River at Valley Park 28.5 2/26/1985<br />
Meramec River at Valley Park 24.3 4/1/1985<br />
Meramec River at Valley Park 26 6/21/1985<br />
Meramec River at Valley Park 31.7 11/22/1985<br />
Meramec River at Valley Park 22.2 10/5/1986<br />
Meramec River at Valley Park 22.8 12/29/1987<br />
Meramec River at Valley Park 22.5 5/29/1990<br />
Meramec River at Valley Park 32.4 9/26/1993<br />
Meramec River at Valley Park 37.4 4/14/1994<br />
Meramec River at Valley Park 29.3 5/21/1995<br />
Meramec River at Valley Park 24 5/8/2000<br />
Meramec River at Valley Park 24.2 5/11/2002<br />
Station Station<br />
Stage (Flood Stage at 24 ft) Date<br />
Meramec River at Arnold 38.9 4/28/1973<br />
Meramec River at Arnold 38 4/16/1979<br />
Meramec River at Arnold 43.9 12/6/1982<br />
Meramec River at Arnold 39.8 5/4/1983<br />
Meramec River at Arnold 35.7 2/27/1985<br />
Meramec River at Arnold 36.2 11/22/1985<br />
Meramec River at Arnold 36.4 10/9/1986<br />
Meramec River at Arnold 32.9 5/20/1990<br />
Meramec River at Arnold 34.3 4/18/1993<br />
Meramec River at Arnold 45.3 8/1/1993<br />
Meramec River at Arnold 33.9 11/18/1993<br />
Meramec River at Arnold 41.7 4/14/1994<br />
Meramec River at Arnold 41.1 5/21/1994<br />
Meramec River at Arnold 36.7 5/18/2002<br />
Station Station<br />
Stage (Flood Stage 16 ft) Date Date<br />
Big River at Byrnes Mill 30.2 8/21/1915<br />
Big River at Byrnes Mill 24.37 5/27/1990<br />
Big River at Byrnes Mill 29.37 9/25/1993<br />
Big River at Byrnes Mill 27.61 11/16/1993<br />
Big River at Byrnes Mill 21.55 4/30/1994<br />
Big River at Byrnes Mill 20.08 4/24/1996<br />
Big River at Byrnes Mill 15.31 5/15/1996<br />
Big River at Byrnes Mill 17.72 11/27/1996<br />
Big River at Byrnes Mill 16.08 1/29/1997<br />
Big River at Byrnes Mill 19.99 2/28/1997<br />
Big River at Byrnes Mill 20.65 6/23/1997<br />
Big River at Byrnes Mill 22.44 5/7/2000<br />
Big River at Byrnes Mill 17.9 12/19/2001<br />
Big River at Byrnes Mill<br />
Source: NOAA<br />
22.5 5/10/2002<br />
Since 1979 there have been 14 major flood events on the Meramec River at Eureka. Since<br />
1916, there have been 14 major flood events on the Meramec River at Valley Park. Since<br />
1973, there have been 14 major floods on the Meramec River at Arnold and 14 major
A Regional Overview All-Hazard Mitigation Plan 23<br />
floods on the Meramec at Byrnes Mill. The properties in and near the floodplains of the<br />
planning region <strong>Jefferson</strong> <strong>County</strong> are subject to flooding events almost annually. Since<br />
flooding is such a pervasive problem throughout the county, many residents have<br />
purchased flood insurance to help recover form losses incurred from flooding events, have<br />
sold property, or have rebuilt structures to reflect construction standards. Flood insurance<br />
covers only the improved land, or the actual building structures. Although flood insurance<br />
assists in recovery, it can provide an inappropriate sense of protection from flooding.<br />
Many residents and businesses that have flood damage rebuilt in the same vulnerable<br />
areas, only to be flooded again. These properties are termed repetitive loss properties and<br />
continue to expose lives and property to flooding hazards. Local governments, as well as<br />
federal agencies such as FEMA, recognize this problem of floodplain insurance and attempt<br />
to remove the risk from repetitive loss properties though projects such as acquiring land<br />
and relocating homes or by elevating the structures.<br />
Continued repetitive loss claims from flood events lead to an increased amount of damage<br />
caused by floods, higher insurance rates, and contribute to the rising cost of taxpayerfunded<br />
disaster relief for flood victims.<br />
Intensity Intensity or or Strength<br />
Strength<br />
The largest disaster to impact <strong>Jefferson</strong> <strong>County</strong> in recent years was the flood in 1993. Its<br />
size and impact was unprecedented and has been considered the most costly and<br />
devastating flood to ravage the U.S. in modern history, as evidenced by Table J28 above.<br />
The number of record river levels, its aerial extent, the number of persons displaced,<br />
amount of property damage and its duration surpassed all earlier U.S. floods in modern<br />
times. In the 2001 flood, a total of $1.9 billion dollars in damage and costs and at least<br />
three deaths over a 14-state area including Missouri occurred. In the 1993 flood<br />
approximately $21 billion dollars in damage and costs and 50 deaths resulted (NOAA). In<br />
the 1997 flooding, 9 states including Missouri were impacted and an estimated $1 billion<br />
dollars in damage and costs and 11 deaths resulted. The report also stated that floods at<br />
the second most likely type of weather event to occur (based on 46 weather events from<br />
1980 to 1999).<br />
Lives Lives Lives Lost, Injuries, Injuries, Property Damage, Damage, Economic Losses/Other Losses Losses<br />
Losses<br />
Due to flooding of many of the major roadways and interstates in 1993, 'commuting'<br />
distances grew from several miles to over 200 miles in some instances. From July 16-20,<br />
there were no bridge crossings over a 212-mile span between Burlington, Iowa and St.<br />
Louis, Missouri. Also, there was no Mississippi River traffic over a 585-mile span from<br />
Cairo, Illinois through St. Louis, Missouri to St. Paul, Minnesota from late June through<br />
early August, resulting in over 5,000 loaded barges being halted, and an estimated $3<br />
million per day in lost revenue. Similarly, the Missouri River was closed from late June<br />
through early August over a 535-mile span stretching from its confluence with the<br />
Mississippi River to near Sioux City, Iowa. Eleven commercial airports were closed at one
24<br />
<strong>Jefferson</strong> <strong>County</strong> – Section 2<br />
time or another due to the flooding. Over 4000 miles of railroad track was either flooded<br />
or idled, and over $200 million in estimated losses.<br />
In 1993 well over 20 million acres were flooded, covering parts of nine states. More than<br />
50,000 homes were damaged or destroyed, and over 85,000 residents had to evacuate<br />
their homes. More than 75 small towns near the rivers were completely flooded and had<br />
to be abandoned or relocated. Some of the flooding occurred as levees collapsed after<br />
being weakened by constant pressure from rising water levels. However, some levees, such<br />
as the 52-foot floodwall protecting St. Louis, held back the rising waters. It is interesting<br />
to note that the St. Louis levee was built to a level 9 feet higher than the previous record<br />
crest for the Mississippi River, but less than 3 feet higher than the 49.6-foot crest recorded<br />
on August 1. Over 6,500 National Guard members were called in to assist in levee work.<br />
A recent report on the various levees on the Mississippi and Missouri Rivers indicates the<br />
following: In 1993 over 16,000 square miles of farmland were flooded, and crop losses<br />
exceeded $5 billion. Many farm animals perished in the rising waters. Total crop losses due<br />
to flooding or saturated fields exceeded 35 million acres. The national soybean yield was<br />
forecast to be 13 percent below 1992’s level, while the national corn yield was down by 22<br />
percent. Soybean prices moved to 4- year highs on July 10, 1993 due to the damage<br />
assessments.<br />
Overall damage estimates exceeded $12 billion. Local power plants were damaged in<br />
many cities, with electrical service lost as a result. Business districts were flooded in<br />
Davenport, Dubuque, Burlington, and many other smaller towns.<br />
The Missouri River, normally no more than a half-mile wide, expanded to 5-6 miles wide<br />
north of St. Joseph, Missouri, and 8-10 miles wide east of Kansas City. Just north of St.<br />
Louis, it reached 20 miles wide near its confluence with the Mississippi, as the merging of<br />
the 2 rivers occurred 20 miles north of their normal point of confluence. As a result,<br />
almost half of the 620 square miles of St. Charles <strong>County</strong>, Missouri were underwater.<br />
Four hundred and four counties in the Midwest were declared federal disaster areas<br />
including 62 percent of Missouri counties. The waters in some areas remained above flood<br />
stage for many weeks, and receded rather slowly. Many locations experienced not one,<br />
but two record crests during the flooding. Mississippi River watershed 1993 precipitation<br />
was the greatest since 1895 for the following periods: July, June-July, May-July, and April-<br />
July.<br />
Over 1,000 flood warnings and statements, five times the normal, were issued to notify the<br />
public and need-to-know officials about river levels. In St. Louis, river levels were nearly 20<br />
feet above flood stage, the highest in the city’s 150-year history. The 52-foot St. Louis<br />
Flood wall, built to handle the volume of the 1844 flood, was able to keep the 1993 flood<br />
out with just over two feet to spare. On the Missouri River it was estimated that nearly all<br />
of the 700 privately built agricultural levees were overtopped or destroyed.
A Regional Overview All-Hazard Mitigation Plan 25<br />
The Mississippi River at St. Louis crested at 49.6 feet on August 1, nearly 20 feet above<br />
flood stage and had a peak flow rate of 1.08 million cubic feet per second. The old record<br />
was 43.2 feet in 1973. Some locations on the Mississippi River were in flood for almost<br />
200 days while locations on the Missouri neared 100 days of flooding. On October 7, 103<br />
days after it began, the Mississippi River at St. Louis finally dropped below flood stage.<br />
According to the U.S. Army Corps of Engineers (as noted in the NOAA National Weather<br />
Service disaster survey report) 40 of 229 federal levees and 1,043 of 1,347 non-federal<br />
levees were over-topped or damaged. Every breeched levee contributed to the amount of<br />
floodwater flowing outside the main drainages. The flood eroded more than 600 billion<br />
tons of topsoil and deposited great amounts of sand and silt on valuable farmland. In large<br />
areas inundated by the flood, the harvest of 1993 was a total loss and some farmers lost<br />
any chance for a 1994 harvest.<br />
National National Flood Flood Insurance Insurance (NFIP) (NFIP) (NFIP) Participation<br />
Participation<br />
The National Flood Insurance Policy member number for <strong>Jefferson</strong> <strong>County</strong> is 290808.<br />
TABLE TABLE J27C J27C J27C NATIONAL NATIONAL FLOOD FLOOD INSURANCE INSURANCE INSURANCE PROGRAM PROGRAM- PROGRAM MMUNICI<br />
M<br />
UNICI PARTICIPATING<br />
COMMUNITY COMMUNITY NAME NAME INIT INIT FHBM FHBM INIT INIT FIRM FIRM FIRM CURR CURR EFF EFF EMERGENCY<br />
EMERGENCY<br />
DATE DATE<br />
DATE<br />
ARNOLD, CITY OF 06/28 01/16 04/05 01/16<br />
BYRNES MILL, CITY OF 07/29 05/16 04/05 05/16<br />
CRYSTAL CITY,CITY OF 03/15 09/01 04/05 09/01<br />
DE SOTO, CITY OF 05/26 04/05 05/26<br />
FESTUS,CITY OF 10/18 02/14 04/05 02/14<br />
HERCULANEUM, CITY OF 05/17 05/15 04/05 05/15<br />
HILLSBORO, CITY OF 10/22 04/01 04/05 04/01<br />
JEFFERSON COUNTY* 07/29 05/16 04/05 05/16<br />
KIMMSWICK, CITY OF 11/01 01/06 04/05 01/06<br />
PEVELY, CITY OF 10/29 09/18 04/05/06 09/18<br />
SCOTSDALE, TOWN OF 05/16 04/05 10/21<br />
CEDAR HILL LAKES, VILLAGE OF 04/05 04/05 04/05<br />
MUNICIPALITIES MUNICIPALITIES NOT NOT PARTICIPATING<br />
PARTICIPATING<br />
PARTICIPATING<br />
Cedar Hills Lake – sanction date April 5, 2007<br />
* REPRESENTS COUNTY<br />
Locations/Areas Locations/Areas Affected<br />
Affected<br />
Owners of repetitive loss properties clearly have knowledge that there is a highly likely<br />
chance of being flooded in future rain events. The largest single drain on flood insurance<br />
reserve funds is repetitive claims from repetitive loss properties (Galloway report). Missouri<br />
ranks first among non-coastal states in repetitive losses. Missouri has 3,268 repetitive loss<br />
buildings that have resulted in 10,038 loss claims.
26<br />
<strong>Jefferson</strong> <strong>County</strong> – Section 2<br />
During the 1993 flood the following gives an account of <strong>Jefferson</strong> <strong>County</strong> areas that were<br />
affected by the inundation. Based on a workshop meeting with <strong>Jefferson</strong> <strong>County</strong> and<br />
other community emergency management agencies held on October 17, 2003, the<br />
following locations were specifically identified as locations that become flooded during<br />
various rainfall events. In DeSoto, Joachim Creek and North Main along Cedar Street<br />
became inundated from floodwaters in 1993 and there was flash flooding near the high<br />
school. During the 1993 floods, Festus experienced problems with storm drainage and<br />
creeks. In Kimmswick, Rock Creek flooded Highway K. Other areas of <strong>Jefferson</strong> <strong>County</strong><br />
experienced significant flooding at the confluence of the Big River and Meramec River,<br />
Highway BB, <strong>West</strong> Old Highway 21, Highway 61/67 and Highway 55. The community of<br />
Arnold experienced significant flooding impacts from the 1993 flood. Areas flooded<br />
included Twin River Road, Big Bend Road, Meadow Drive, Riffle Island, State Road BB, and<br />
River Bend Acres. <strong>West</strong> of Pevely on Highway Z between Sandy Creek and Cherry Lane<br />
floodwaters inundated the bridge; mitigation for this stretch entailed the raising of the<br />
road, property buyouts and replacement of the bridge.<br />
In Festus, all but one of the north-south roads and most of the major streets in the<br />
community were closed due to the 1993 floodwaters including 61/67 and Highway A. The<br />
community was inundated by floodwaters for approximately 5 months during this major<br />
flood event.<br />
Pevely was impacted only slightly during the 1993 flood. Ancient Oaks subdivision, located<br />
in the southwest portion of the community was affected when floodwaters from nearby<br />
Sandy Creek inundated the sewage treatment system (lagoon) for the subdivision. Further,<br />
in 1993 west of Pevely along Highway Z, Sandy Creek flooded the roadway. The Missouri<br />
Department of Transportation subsequent to the flooding event raised the roadbed and<br />
replaced the bridge above the 100-year event. As a result of the 1993 flood, Pevely placed<br />
one of their lift stations at a higher elevation to prevent impacts from flooding. There were<br />
no buyouts from the 1993 or subsequent flooding events.<br />
TABLE J27D Unmitigated Properties<br />
– Repetitive Losses<br />
Community Name Occupancy Date of Loss Date Date Date Date Date Date Date Date<br />
ARNOLD, CITY OF Single-Family 06/08/2001 M-95<br />
ARNOLD, CITY OF Single-Family 05/13/2002 M-95<br />
ARNOLD, CITY OF Single-Family 03/21/2008 M-02 J-93 D-82<br />
ARNOLD, CITY OF Single-Family 07/15/1993 D-82<br />
ARNOLD, CITY OF Single-Family 06/25/1993 O-86 D-82 A-79<br />
ARNOLD, CITY OF Single-Family 05/19/1995 J-93 M-83 D-82 A-79<br />
ARNOLD, CITY OF Single-Family 04/13/1994 J-93 M-83 D-82<br />
ARNOLD, CITY OF Single-Family 04/14/1994 J-93 D-82 A-79<br />
ARNOLD, CITY OF Single-Family 05/03/1983 D-82 A-79<br />
ARNOLD, CITY OF Single-Family 08/01/1993 A-81<br />
ARNOLD, CITY OF Single-Family 06/08/1982 A-81<br />
ARNOLD, CITY OF Single-Family 02/25/1985 M-83 D-82
A Regional Overview All-Hazard Mitigation Plan 27<br />
TABLE J27D Unmitigated Properties<br />
– Repetitive Losses<br />
Community Name Occupancy Date of Loss Date Date Date Date Date Date Date Date<br />
ARNOLD, CITY OF Single-Family 11/19/1985 D-82<br />
ARNOLD, CITY OF Single-Family 04/12/1983 D-82<br />
ARNOLD, CITY OF Single-Family 07/10/1993 M-83<br />
ARNOLD, CITY OF Single-Family 06/17/2008 M-02 J-96 M-95 J-93 A-93 O-86 D-85<br />
ARNOLD, CITY OF Single-Family 07/31/1993 J-93<br />
ARNOLD, CITY OF Single-Family 04/13/1994 S-93 A-93<br />
ARNOLD, CITY OF Single-Family 07/31/1993 J-93<br />
ARNOLD, CITY OF Single-Family 05/20/1995 A-94<br />
ARNOLD, CITY OF Single-Family 05/20/1995 A-94<br />
ARNOLD, CITY OF Single-Family 05/19/1995 A-94<br />
ARNOLD, CITY OF Single-Family 04/13/1994 S-93 J-90<br />
ARNOLD, CITY OF Single-Family 05/16/2002 J-01 M-97 J-96 J-93 M-90<br />
ARNOLD, CITY OF Count 24<br />
CRYSTAL CITY,CITY OF Nonresidential 05/12/2002 M-95 M-95 A-94 S-93 J-93 O-86 M-83 D-82<br />
CRYSTAL CITY,CITY OF Nonresidential 06/10/2003 M-03 A-96<br />
CRYSTAL CITY,CITY OF Single-Family 10/06/1986 F-85 M-83 A-83 D-82 A-79 A-79<br />
CRYSTAL CITY,CITY OF Nonresidential 05/04/1983 D-82 A-79<br />
CRYSTAL CITY,CITY OF Nonresidential 05/04/1983 D-82 A-79<br />
CRYSTAL CITY,CITY OF Single-Family 04/11/1984 A-83 D-82 A-79<br />
CRYSTAL CITY,CITY OF Nonresidential 05/04/1983 D-82 A-79<br />
CRYSTAL CITY,CITY OF Single-Family 05/04/1983 A-83 D-82 A-79<br />
CRYSTAL CITY,CITY OF Single-Family 05/01/1983 A-83 A-79<br />
CRYSTAL CITY,CITY OF ASSMD CONDO 10/04/1986 M-83 A-79<br />
CRYSTAL CITY,CITY OF Nonresidential 04/30/1983 D-82 A-79<br />
CRYSTAL CITY,CITY OF Single-Family 04/09/1983 D-82 A-79<br />
CRYSTAL CITY,CITY OF Nonresidential 05/01/1983 A-83 D-82 A-79<br />
CRYSTAL CITY,CITY OF Nonresidential 05/19/1995 J-93 O-86 M-83 D-82<br />
CRYSTAL CITY,CITY OF Nonresidential 05/21/1995 J-93 M-83 D-82 A-79<br />
CRYSTAL CITY,CITY OF Nonresidential 05/03/1983 D-82<br />
CRYSTAL CITY,CITY OF Single-Family 05/24/1983 D-82 A-78<br />
CRYSTAL CITY,CITY OF Nonresidential 08/22/1983 M-83 D-82<br />
CRYSTAL CITY,CITY OF Nonresidential 04/30/1983 D-82<br />
CRYSTAL CITY,CITY OF Nonresidential 10/04/1986 M-83 D-82<br />
CRYSTAL CITY,CITY OF Nonresidential 04/30/1983 D-82<br />
CRYSTAL CITY,CITY OF Single-Family 04/09/1983 D-82<br />
CRYSTAL CITY,CITY OF Nonresidential 10/04/1986 M-83 D-82<br />
CRYSTAL CITY,CITY OF Nonresidential 07/10/1993 O-86 A-79<br />
CRYSTAL CITY,CITY OF Single-Family 05/17/1995 J-93 O-86<br />
CRYSTAL CITY,CITY OF Nonresidential 05/18/1995 J-93<br />
CRYSTAL CITY,CITY OF Single-Family 06/01/1995 A-93<br />
CRYSTAL CITY,CITY OF Nonresidential 05/19/1995 J-93<br />
CRYSTAL CITY,CITY OF Nonresidential 05/23/1995 J-93<br />
CRYSTAL CITY,CITY OF Single-Family 07/06/1993 A-93<br />
CRYSTAL CITY,CITY OF Nonresidential 05/21/2002 M-95 S-93 J-93
28<br />
<strong>Jefferson</strong> <strong>County</strong> – Section 2<br />
TABLE J27D Unmitigated Properties<br />
– Repetitive Losses<br />
Community Name Occupancy Date of Loss Date Date Date Date Date Date Date Date<br />
CRYSTAL CITY,CITY OF Single-Family 05/18/1995 J-93<br />
CRYSTAL CITY,CITY OF Nonresidential 05/20/2002 M-95 D-82<br />
CRYSTAL CITY,CITY OF Nonresidential 05/16/2002 M-95 S-93 J-93<br />
CRYSTAL CITY,CITY OF 34<br />
FESTUS,CITY OF Single-Family 06/28/1993 O-86<br />
FESTUS,CITY OF Nonresidential 05/06/2003 M-95<br />
FESTUS,CITY OF Nonresidential 05/06/2003 M-95<br />
FESTUS,CITY OF Single-Family 05/02/1983 D-82<br />
FESTUS,CITY OF ASSMD CONDO 05/06/2003 M-95 A-93 A-93<br />
FESTUS,CITY OF Nonresidential 05/06/2003 M-95 J-93<br />
FESTUS,CITY OF Nonresidential 05/16/1995 A-93<br />
FESTUS,CITY OF Nonresidential 06/18/2004 M-03 M-95 A-93<br />
FESTUS,CITY OF Nonresidential 06/18/2004 M-03 M-95 A-93<br />
FESTUS,CITY OF Nonresidential 05/06/2003 A-96 J-93 S-86<br />
FESTUS,CITY OF Count 10<br />
HERCULANEUM, CITY OF Nonresidential 04/07/1983 D-82 D-82 A-79 A-79<br />
HERCULANEUM, CITY OF Single-Family 07/04/1993 A-93 O-86<br />
HERCULANEUM, CITY OF Nonresidential 04/06/1983 D-82<br />
HERCULANEUM, CITY OF Single-Family 04/06/1983 D-82<br />
HERCULANEUM, CITY OF Nonresidential 03/28/1979 M-79<br />
HERCULANEUM, CITY OF Nonresidential 05/22/1995 J-93<br />
HERCULANEUM, CITY OF Single-Family 05/18/1995 J-93<br />
HERCULANEUM, CITY OF Single-Family 05/19/1995 J-93<br />
HERCULANEUM, CITY OF 8<br />
JEFFERSON COUNTY* Single-Family 04/12/1994 N-93 S-93<br />
JEFFERSON COUNTY* Single-Family 04/12/1994 S-93 N-85<br />
JEFFERSON COUNTY* Single-Family 04/12/1994 N-93 S-93<br />
JEFFERSON COUNTY* Single-Family 04/11/1994 N-93 S-93<br />
JEFFERSON COUNTY* Single-Family 04/12/1994 N-93 S-93<br />
JEFFERSON COUNTY* Single-Family 04/11/1994 N-93<br />
JEFFERSON COUNTY* Single-Family 11/17/1993 S-93<br />
JEFFERSON COUNTY* Single-Family 05/07/2000 A-96<br />
JEFFERSON COUNTY* Other Residential 05/07/2000 A-98<br />
JEFFERSON COUNTY* Single-Family 07/19/2006 M-00 S-93<br />
JEFFERSON COUNTY* Single-Family 07/02/2000 A-96<br />
JEFFERSON COUNTY* Single-Family 07/01/2000 A-96<br />
JEFFERSON COUNTY* Single-Family 05/05/2000 M-98<br />
JEFFERSON COUNTY* Nonresidential 07/05/2000 A-96<br />
JEFFERSON COUNTY* Single-Family 11/15/1993 S-93<br />
JEFFERSON COUNTY* Single-Family 09/22/1993 M-90<br />
JEFFERSON COUNTY* Single-Family 03/19/2008 A-96 A-94 N-93 S-93<br />
JEFFERSON COUNTY* Single-Family 11/14/1993 S-93
A Regional Overview All-Hazard Mitigation Plan 29<br />
TABLE J27D Unmitigated Properties<br />
– Repetitive Losses<br />
Community Name Occupancy Date of Loss Date Date Date Date Date Date Date Date<br />
JEFFERSON COUNTY* Single-Family 09/22/1993 M-90<br />
JEFFERSON COUNTY* Single-Family 03/19/2008 A-94 N-93 S-93 N-85 M-83 D-82 A-79<br />
JEFFERSON COUNTY* Single-Family 05/07/2000 M-95 A-94 N-93 S-93 M-90<br />
JEFFERSON COUNTY* Single-Family 03/19/2008 A-94 N-93 S-93 N-85<br />
JEFFERSON COUNTY* Single-Family 04/22/2005 J-01 J-97<br />
JEFFERSON COUNTY* Single-Family 03/18/2008 M-06 M-02 M-00<br />
JEFFERSON COUNTY* Single-Family 03/20/2008 M-02 M-00<br />
JEFFERSON COUNTY* Single-Family 05/13/2002 J-01<br />
JEFFERSON COUNTY* Single-Family 03/19/2008 M-02 M-00 F-99 D-90 M-90 M-90<br />
JEFFERSON COUNTY* Nonresidential 04/28/1996 M-95 A-94 S-93 J-93 J-93 M-90<br />
JEFFERSON COUNTY* Single-Family 04/21/2005 M-03 M-00<br />
JEFFERSON COUNTY* Single-Family 11/17/2003 M-02<br />
JEFFERSON COUNTY* Single-Family 04/21/2005 M-00<br />
JEFFERSON COUNTY* Single-Family 04/20/2005 M-00<br />
JEFFERSON COUNTY* Single-Family 04/21/2005 M-95<br />
JEFFERSON COUNTY* Single-Family 04/21/2005 M-00<br />
JEFFERSON COUNTY* Single-Family 04/21/2005 M-00<br />
JEFFERSON COUNTY* Single-Family 04/11/1994 N-93 S-93<br />
JEFFERSON COUNTY* Single-Family 03/20/2008 M-06 J-05 M-02 M-00 A-96 A-96 M-95 A-94<br />
JEFFERSON COUNTY* Single-Family 04/09/1994 N-93 S-93<br />
JEFFERSON COUNTY* Single-Family 02/25/1985 M-83 D-82 A-79<br />
JEFFERSON COUNTY* Single-Family 12/04/1982 A-79<br />
JEFFERSON COUNTY* Single-Family 05/05/1983 M-79<br />
JEFFERSON COUNTY* Single-Family 03/19/2008 M-06 M-02<br />
JEFFERSON COUNTY* Single-Family 05/01/1983 D-82<br />
JEFFERSON COUNTY* Single-Family 03/21/2008 S-93 N-85 D-82 A-79<br />
JEFFERSON COUNTY* Nonresidential 04/12/1994 N-93 S-93 M-90 N-85 A-85 F-85 N-84<br />
JEFFERSON COUNTY* Single-Family 09/28/1993 N-85<br />
JEFFERSON COUNTY* Nonresidential 09/23/1993 J-93 J-93<br />
JEFFERSON COUNTY* Single-Family 05/01/1983 D-82<br />
JEFFERSON COUNTY* Single-Family 02/23/1985 D-82 A-79<br />
JEFFERSON COUNTY* Single-Family 10/07/1986 N-85 M-85 M-83 D-82 A-79<br />
JEFFERSON COUNTY* Single-Family 06/24/2003 M-03 J-98 A-93 O-86 M-83 D-82 A-79 A-79<br />
JEFFERSON COUNTY* Two to Four-Family 12/03/1982 A-79<br />
JEFFERSON COUNTY* Single-Family 05/01/1983 D-82 A-79<br />
JEFFERSON COUNTY* Single-Family 09/25/1993 N-85 F-85 M-83 D-82 A-79<br />
JEFFERSON COUNTY* Single-Family 09/23/1993 N-85 M-83 D-82 A-79<br />
JEFFERSON COUNTY* Single-Family 11/21/1985 M-83 D-82 A-79<br />
JEFFERSON COUNTY* Single-Family 12/03/1982 A-81 A-79<br />
JEFFERSON COUNTY* Single-Family 05/01/1983 D-82 A-79<br />
JEFFERSON COUNTY* Single-Family 09/25/1993 N-85 M-83 D-82 A-79<br />
JEFFERSON COUNTY* Single-Family 12/03/1982 A-79<br />
JEFFERSON COUNTY* Single-Family 05/01/1983 D-82 A-79<br />
JEFFERSON COUNTY* Single-Family 05/02/1983 D-82<br />
JEFFERSON COUNTY* Single-Family 11/21/1985 D-82
30<br />
<strong>Jefferson</strong> <strong>County</strong> – Section 2<br />
TABLE J27D Unmitigated Properties<br />
– Repetitive Losses<br />
Community Name Occupancy Date of Loss Date Date Date Date Date Date Date Date<br />
JEFFERSON COUNTY* Single-Family 11/22/1985 D-82 A-79<br />
JEFFERSON COUNTY* Single-Family 11/21/1985 M-83 D-82 A-79<br />
JEFFERSON COUNTY* Single-Family 11/22/1985 M-83 D-82 A-79<br />
JEFFERSON COUNTY* Single-Family 12/03/1982 A-79<br />
JEFFERSON COUNTY* Single-Family 05/02/1983 D-82<br />
JEFFERSON COUNTY* Single-Family 04/14/1994 N-93 S-93 M-90<br />
JEFFERSON COUNTY* Single-Family 11/20/1985 D-82 A-79<br />
JEFFERSON COUNTY* Single-Family 04/14/1994 N-93 S-93<br />
JEFFERSON COUNTY* Single-Family 09/24/1993 M-90 N-84 M-83 D-82 A-79<br />
JEFFERSON COUNTY* Single-Family 07/04/1993 A-93 O-86 N-85 F-85 M-83 D-82 A-79<br />
JEFFERSON COUNTY* Other Residential 11/20/1985 F-85 M-83 D-82 A-79<br />
JEFFERSON COUNTY* Single-Family 11/23/1985 M-83 D-82 A-79<br />
JEFFERSON COUNTY* Nonresidential 04/15/1978 M-78<br />
JEFFERSON COUNTY* Single-Family 12/03/1982 A-79<br />
JEFFERSON COUNTY* Single-Family 05/04/1983 D-82 A-79<br />
JEFFERSON COUNTY* Single-Family 11/18/1993 S-93 N-85 F-85 D-82<br />
JEFFERSON COUNTY* Single-Family 02/27/1985 M-83 D-82 A-79<br />
JEFFERSON COUNTY* Single-Family 05/01/1983 A-79<br />
JEFFERSON COUNTY* Nonresidential 12/03/1982 A-79<br />
JEFFERSON COUNTY* Single-Family 11/22/1985 F-85 D-82 A-79<br />
JEFFERSON COUNTY* Single-Family 05/03/1983 D-82 A-79<br />
JEFFERSON COUNTY* Single-Family 12/03/1982 A-79<br />
JEFFERSON COUNTY* Single-Family 11/21/1985 M-83 A-79<br />
JEFFERSON COUNTY* Single-Family 09/25/1993 J-90 N-85<br />
JEFFERSON COUNTY* Single-Family 04/14/1994 N-93 S-93 N-85 N-84<br />
JEFFERSON COUNTY* ASSMD CONDO 05/27/1990 N-85 F-85 N-84<br />
JEFFERSON COUNTY* Single-Family 04/14/1994 N-93 S-93 M-90 N-85<br />
JEFFERSON COUNTY* Nonresidential 05/02/1983 A-83 D-82 M-81 A-79<br />
JEFFERSON COUNTY* Single-Family 03/21/2008 S-93 F-85<br />
JEFFERSON COUNTY* Single-Family 05/04/1983 D-82 A-79<br />
JEFFERSON COUNTY* Single-Family 05/02/1983 A-79<br />
JEFFERSON COUNTY* Single-Family 11/18/1985 F-85 M-83 D-82 D-82 F-82 A-79<br />
JEFFERSON COUNTY* Single-Family 09/23/1993 M-90 N-85 F-85 M-83 D-82<br />
JEFFERSON COUNTY* Single-Family 02/25/1985 M-83 D-82<br />
JEFFERSON COUNTY* Nonresidential 05/02/1983 D-82<br />
JEFFERSON COUNTY* Single-Family 04/08/1983 D-82<br />
JEFFERSON COUNTY* Single-Family 05/02/1983 D-82<br />
JEFFERSON COUNTY* Single-Family 04/12/1994 N-93 S-93 D-82<br />
JEFFERSON COUNTY* Single-Family 11/22/1985 M-83 D-82<br />
JEFFERSON COUNTY* Other Residential 03/20/2008 A-94 S-93 N-85 M-83<br />
JEFFERSON COUNTY* Single-Family 03/19/2008 A-94 S-93 M-83<br />
JEFFERSON COUNTY* Single-Family 11/21/1985 M-83 D-82<br />
JEFFERSON COUNTY* ASSMD CONDO 03/22/2008 M-95 M-95 A-94 J-93 N-85 M-83 D-82<br />
JEFFERSON COUNTY* Single-Family 03/21/2008 A-94 S-93 D-82<br />
JEFFERSON COUNTY* Single-Family 04/30/1983 D-82
A Regional Overview All-Hazard Mitigation Plan 31<br />
TABLE J27D Unmitigated Properties<br />
– Repetitive Losses<br />
Community Name Occupancy Date of Loss Date Date Date Date Date Date Date Date<br />
JEFFERSON COUNTY* Single-Family 03/21/2008 A-96 M-95 A-94 J-93 M-83 D-82<br />
JEFFERSON COUNTY* Single-Family 09/25/1993 J-90 A-83 D-82<br />
JEFFERSON COUNTY* Single-Family 07/08/1993 O-86 F-85 D-82<br />
JEFFERSON COUNTY* Single-Family 07/08/1993 N-85 F-85 M-83 D-82<br />
JEFFERSON COUNTY* Single-Family 04/30/1983 D-82<br />
JEFFERSON COUNTY* Single-Family 05/02/1983 D-82<br />
JEFFERSON COUNTY* Single-Family 04/14/1994 N-93 S-93 N-85 M-83 D-82<br />
JEFFERSON COUNTY* Single-Family 04/14/1994 N-93 S-93 N-85 M-83 D-82<br />
JEFFERSON COUNTY* Single-Family 04/13/1994 S-93 N-85 M-83 D-82<br />
JEFFERSON COUNTY* Single-Family 09/24/1993 M-90 N-85 F-85 D-82<br />
JEFFERSON COUNTY* Nonresidential 08/30/1981 J-81 J-80<br />
JEFFERSON COUNTY* Single-Family 05/02/1983 D-82<br />
JEFFERSON COUNTY* Single-Family 12/03/1982 A-81<br />
JEFFERSON COUNTY* Single-Family 05/02/1983 D-82<br />
JEFFERSON COUNTY* Single-Family 05/03/1983 D-82<br />
JEFFERSON COUNTY* Single-Family 11/22/1985 D-82<br />
JEFFERSON COUNTY* Single-Family 11/19/1985 D-82<br />
JEFFERSON COUNTY* Single-Family 05/02/1983 D-82<br />
JEFFERSON COUNTY* Single-Family 11/25/1985 M-83<br />
JEFFERSON COUNTY* Single-Family 11/19/1985 M-83 D-82<br />
JEFFERSON COUNTY* Single-Family 11/22/1985 M-83<br />
JEFFERSON COUNTY* Single-Family 11/28/1985 M-83<br />
JEFFERSON COUNTY* Single-Family 05/01/1983 D-82<br />
JEFFERSON COUNTY* Single-Family 05/02/1983 D-82<br />
JEFFERSON COUNTY* Single-Family 05/02/1983 D-82<br />
JEFFERSON COUNTY* Single-Family 11/15/1993 S-93 N-85 M-83<br />
JEFFERSON COUNTY* Single-Family 02/26/1985 D-82<br />
JEFFERSON COUNTY* Single-Family 05/04/1983 D-82<br />
JEFFERSON COUNTY* Single-Family 11/21/1985 F-85 D-82<br />
JEFFERSON COUNTY* Single-Family 11/21/1985 F-85 M-83 D-82<br />
JEFFERSON COUNTY* Single-Family 05/15/1990 S-86 J-82<br />
JEFFERSON COUNTY* Single-Family 05/03/1983 D-82<br />
JEFFERSON COUNTY* Single-Family 04/14/1994 S-93 J-93<br />
JEFFERSON COUNTY* Single-Family 05/02/1983 D-82<br />
JEFFERSON COUNTY* Single-Family 11/21/1985 M-83 D-82<br />
JEFFERSON COUNTY* ASSMD CONDO 03/19/2008 A-94 A-94 N-93 N-93 S-93 S-93 N-85 N-85<br />
JEFFERSON COUNTY* Single-Family 06/24/1985 S-81<br />
JEFFERSON COUNTY* Single-Family 11/20/1985 M-83 D-82<br />
JEFFERSON COUNTY* Single-Family 02/25/1985 D-82<br />
JEFFERSON COUNTY* Single-Family 11/18/1985 A-83<br />
JEFFERSON COUNTY* Single-Family 11/19/1985 M-83 D-82<br />
JEFFERSON COUNTY* Nonresidential 05/02/1983 D-82<br />
JEFFERSON COUNTY* ASSMD CONDO 09/04/1991 J-89 J-85 S-84<br />
JEFFERSON COUNTY* Single-Family 11/27/1983 D-82 F-82<br />
JEFFERSON COUNTY* ASSMD CONDO 05/01/1983 D-82
32<br />
<strong>Jefferson</strong> <strong>County</strong> – Section 2<br />
TABLE J27D Unmitigated Properties<br />
– Repetitive Losses<br />
Community Name Occupancy Date of Loss Date Date Date Date Date Date Date Date<br />
JEFFERSON COUNTY* Single-Family 09/24/1993 D-82<br />
JEFFERSON COUNTY* Single-Family 11/19/1985 M-83 D-82<br />
JEFFERSON COUNTY* Single-Family 11/19/1985 M-85 M-83 D-82<br />
JEFFERSON COUNTY* Single-Family 11/23/1985 M-85 D-82<br />
JEFFERSON COUNTY* Single-Family 11/14/1985 M-83 D-82<br />
JEFFERSON COUNTY* Single-Family 04/20/1984 D-82<br />
JEFFERSON COUNTY* Single-Family 11/20/1985 M-83<br />
JEFFERSON COUNTY* Single-Family 05/01/1983 D-82<br />
JEFFERSON COUNTY* Single-Family 05/02/1983 D-82<br />
JEFFERSON COUNTY* Single-Family 05/02/1983 D-82<br />
JEFFERSON COUNTY* Single-Family 11/22/1985 M-83<br />
JEFFERSON COUNTY* Single-Family 11/22/1985 M-83<br />
JEFFERSON COUNTY* Two to Four-Family 03/23/2008 A-94 J-93 M-83<br />
JEFFERSON COUNTY* Single-Family 11/21/1985 M-83<br />
JEFFERSON COUNTY* Single-Family 11/20/1985 M-83<br />
JEFFERSON COUNTY* Single-Family 11/21/1985 M-83<br />
JEFFERSON COUNTY* Single-Family 11/23/1985 M-83<br />
JEFFERSON COUNTY* Single-Family 03/19/2008 A-94 S-93 N-85 M-83<br />
JEFFERSON COUNTY* Single-Family 11/02/1985 A-83<br />
JEFFERSON COUNTY* Single-Family 04/12/1994 S-93 N-85 M-83<br />
JEFFERSON COUNTY* Single-Family 04/13/1994 S-93 N-85 M-83<br />
JEFFERSON COUNTY* Single-Family 09/24/1993 M-90 N-85 M-83<br />
JEFFERSON COUNTY* Two to Four-Family 04/13/1994 A-93 M-90 M-83<br />
JEFFERSON COUNTY* Single-Family 09/25/1993 N-85<br />
JEFFERSON COUNTY* Single-Family 07/08/1993 N-85<br />
JEFFERSON COUNTY* Single-Family 11/23/1985 F-85<br />
JEFFERSON COUNTY* Single-Family 11/21/1985 F-85<br />
JEFFERSON COUNTY* Single-Family 09/28/1993 N-85<br />
JEFFERSON COUNTY* Single-Family 05/04/1988 N-85 F-85<br />
JEFFERSON COUNTY* Single-Family 04/12/1994 N-93 S-93 N-85<br />
JEFFERSON COUNTY* Single-Family 07/10/1993 O-86<br />
JEFFERSON COUNTY* Single-Family 06/21/1985 J-85<br />
JEFFERSON COUNTY* Single-Family 03/20/2008 A-94 N-93 S-93<br />
JEFFERSON COUNTY* Single-Family 04/12/1994 N-93 S-93<br />
JEFFERSON COUNTY* Nonresidential 11/21/1985 J-85 A-85<br />
JEFFERSON COUNTY* Single-Family 06/06/1997 A-96 M-95 A-94 N-93 S-93 J-93<br />
JEFFERSON COUNTY* Single-Family 11/14/1993 S-93<br />
JEFFERSON COUNTY* Single-Family 03/20/2008 A-94 S-93 N-85<br />
JEFFERSON COUNTY* Single-Family 04/13/1994 N-93 S-93<br />
JEFFERSON COUNTY* Nonresidential 03/21/2008 M-02 M-95 A-94 S-93 J-93<br />
JEFFERSON COUNTY* Single-Family 04/12/1994 N-93 S-93<br />
JEFFERSON COUNTY* Two to Four-Family 03/22/2008 A-94 S-93 J-93 D-82<br />
JEFFERSON COUNTY* Single-Family 03/21/2008 A-94 N-93 S-93<br />
JEFFERSON COUNTY* Two to Four-Family 05/20/1995 A-94 S-93 A-93<br />
JEFFERSON COUNTY* Single-Family 03/21/2008 A-96 M-95 A-94 J-93 M-83 D-82
A Regional Overview All-Hazard Mitigation Plan 33<br />
TABLE J27D Unmitigated Properties<br />
– Repetitive Losses<br />
Community Name Occupancy Date of Loss Date Date Date Date Date Date Date Date<br />
JEFFERSON COUNTY* Single-Family 09/25/1993 M-90 N-85<br />
JEFFERSON COUNTY* Single-Family 05/19/1995 J-93 J-93 J-93<br />
JEFFERSON COUNTY* Single-Family 03/20/2008 A-94 S-93 M-83<br />
JEFFERSON COUNTY* Single-Family 03/19/2008 A-94 N-93<br />
JEFFERSON COUNTY* Single-Family 03/19/2008 A-96 M-95 A-94 J-93<br />
JEFFERSON COUNTY* Single-Family 03/22/2008 M-95 A-94 J-93<br />
JEFFERSON COUNTY* Single-Family 03/19/2008 A-94 S-93<br />
JEFFERSON COUNTY* Single-Family 04/14/1994 A-93<br />
JEFFERSON COUNTY* Single-Family 04/13/1994 J-93<br />
JEFFERSON COUNTY* Single-Family 04/09/1994 S-93<br />
JEFFERSON COUNTY* Single-Family 04/13/2008 M-95 A-94 J-93<br />
JEFFERSON COUNTY* Single-Family 04/14/1994 S-93<br />
JEFFERSON COUNTY* Nonresidential 03/20/2008 A-94 S-93<br />
JEFFERSON COUNTY* Single-Family 04/12/1994 N-93<br />
JEFFERSON COUNTY* Single-Family 04/14/1994 S-93<br />
JEFFERSON COUNTY* Single-Family 04/11/1994 S-93<br />
JEFFERSON COUNTY* Two to Four-Family 04/14/1994 J-93<br />
JEFFERSON COUNTY* Single-Family 04/11/1994 S-93<br />
JEFFERSON COUNTY* Single-Family 04/13/1994 S-93<br />
JEFFERSON COUNTY* Single-Family 04/13/1994 J-93<br />
JEFFERSON COUNTY* Single-Family 04/14/1994 S-93<br />
JEFFERSON COUNTY* Single-Family 04/12/1994 S-93<br />
JEFFERSON COUNTY* Single-Family 04/11/1994 S-93<br />
JEFFERSON COUNTY* Single-Family 04/12/1994 S-93<br />
JEFFERSON COUNTY* Single-Family 05/18/1995 A-94 N-93<br />
JEFFERSON COUNTY* Single-Family 03/20/2008 M-08 M-00 A-94 N-93<br />
JEFFERSON COUNTY* Single-Family 04/11/1994 N-93<br />
JEFFERSON COUNTY* Single-Family 04/12/1994 N-93<br />
JEFFERSON COUNTY* Single-Family 03/20/2008 A-94 A-94<br />
JEFFERSON COUNTY* Single-Family 04/12/1994 S-93<br />
JEFFERSON COUNTY* Nonresidential 04/18/1994 S-93<br />
JEFFERSON COUNTY* Single-Family 04/18/1994 N-93<br />
JEFFERSON COUNTY* Two to Four-Family 04/09/1994 J-93<br />
JEFFERSON COUNTY* Single-Family 03/21/2008 A-94 S-93<br />
JEFFERSON COUNTY* Two to Four-Family 04/15/1994 J-93<br />
JEFFERSON COUNTY* Single-Family 04/09/1994 N-93<br />
JEFFERSON COUNTY* Single-Family 04/09/1994 S-93<br />
JEFFERSON COUNTY* Single-Family 03/20/2008 A-94 S-93 N-85<br />
JEFFERSON COUNTY* Other Residential 04/11/1994 S-93<br />
JEFFERSON COUNTY* Single-Family 03/17/2008 A-94 N-93<br />
JEFFERSON COUNTY* Single-Family 04/11/1994 S-93<br />
JEFFERSON COUNTY* Single-Family 04/14/1994 S-93<br />
JEFFERSON COUNTY* Single-Family 03/23/2008 A-94 S-93<br />
JEFFERSON COUNTY* Single-Family 04/29/1996 M-95 A-94 S-93<br />
JEFFERSON COUNTY* Single-Family 04/13/1994 S-93
34<br />
<strong>Jefferson</strong> <strong>County</strong> – Section 2<br />
TABLE J27D Unmitigated Properties<br />
– Repetitive Losses<br />
Community Name Occupancy Date of Loss Date Date Date Date Date Date Date Date<br />
JEFFERSON COUNTY* Single-Family 04/11/1994 S-93<br />
JEFFERSON COUNTY* Single-Family 04/13/1994 S-93 J-93<br />
JEFFERSON COUNTY* Single-Family 04/12/1994 S-93<br />
JEFFERSON COUNTY* Single-Family 04/29/1996 A-94 S-93<br />
JEFFERSON COUNTY* Single-Family 04/12/1994 S-93<br />
JEFFERSON COUNTY* Single-Family 04/19/1994 S-93<br />
JEFFERSON COUNTY* Single-Family 03/20/2008 A-94 S-93<br />
JEFFERSON COUNTY* Single-Family 03/20/2008 A-94 N-93 S-93<br />
JEFFERSON COUNTY* Single-Family 04/12/1994 A-93<br />
JEFFERSON COUNTY* Two to Four-Family 03/22/2008 M-95 A-94 J-93<br />
JEFFERSON COUNTY* Single-Family 04/13/1994 M-90<br />
JEFFERSON COUNTY* Single-Family 04/14/1994 J-93<br />
JEFFERSON COUNTY* Nonresidential 05/17/1995 J-93<br />
JEFFERSON COUNTY* Single-Family 05/20/1995 A-94<br />
JEFFERSON COUNTY* Nonresidential 05/20/1995 J-93<br />
JEFFERSON COUNTY* Single-Family 05/19/1995 A-94<br />
JEFFERSON COUNTY* Single-Family 05/07/2000 F-99 J-97 A-96 M-95 A-94<br />
JEFFERSON COUNTY* Nonresidential 03/22/2008 M-95 A-94<br />
JEFFERSON COUNTY* Single-Family 05/07/1995 A-94<br />
JEFFERSON COUNTY* Two to Four-Family 04/15/1998 A-96 M-95 S-81<br />
JEFFERSON COUNTY* Nonresidential 04/28/1996 M-95 J-93<br />
JEFFERSON COUNTY* Single-Family 04/24/1996 M-95 A-94<br />
JEFFERSON COUNTY* Single-Family 07/01/1995 A-94<br />
JEFFERSON COUNTY* Other Residential 04/28/1996 J-95 J-94 N-93 S-93<br />
JEFFERSON COUNTY* Single-Family 09/14/2008 A-94 S-93 J-93<br />
JEFFERSON COUNTY* Single-Family 05/02/1996 M-95<br />
JEFFERSON COUNTY* Single-Family 04/29/1996 A-94<br />
JEFFERSON COUNTY* ASSMD CONDO 05/07/2000 A-98 A-96 M-95 M-95<br />
JEFFERSON COUNTY* Single-Family 03/19/2008 M-06 M-02 M-00 F-99 M-98 J-97 A-96 M-95<br />
JEFFERSON COUNTY* ASSMD CONDO 04/28/1996 M-95<br />
JEFFERSON COUNTY* Single-Family 04/28/1996 M-95<br />
JEFFERSON COUNTY* Single-Family 04/28/1996 J-93<br />
JEFFERSON COUNTY* Single-Family 04/28/1996 S-93<br />
JEFFERSON COUNTY* Single-Family 03/25/2008 A-94 A-94 A-94 N-93 S-93 S-93 S-93 N-85<br />
JEFFERSON COUNTY* Single-Family 05/03/2000 S-93 J-90<br />
JEFFERSON COUNTY* Single-Family 04/12/1994 N-93 S-93<br />
JEFFERSON COUNTY* Nonresidential 07/02/2000 A-96 J-93<br />
JEFFERSON COUNTY* Single-Family 04/30/1996 M-95<br />
JEFFERSON COUNTY* Single-Family 03/20/2008 M-00 S-93 M-90 N-85 A-83 D-82<br />
JEFFERSON COUNTY* Single-Family 04/11/1994 N-93 S-93<br />
JEFFERSON COUNTY* Single-Family 11/15/1993 S-93<br />
JEFFERSON COUNTY* Single-Family 06/22/1997 A-94<br />
JEFFERSON COUNTY* Single-Family 03/19/2008 M-00 A-96 M-95 A-94 N-93 S-93 M-90 N-85<br />
JEFFERSON COUNTY* Single-Family 04/11/1994 N-93 S-93<br />
JEFFERSON COUNTY* Single-Family 04/12/1994 N-93 S-93
A Regional Overview All-Hazard Mitigation Plan 35<br />
TABLE J27D Unmitigated Properties<br />
– Repetitive Losses<br />
Community Name Occupancy Date of Loss Date Date Date Date Date Date Date Date<br />
JEFFERSON COUNTY* Single-Family 05/18/1995 A-94 N-93 S-93<br />
JEFFERSON COUNTY* Single-Family 05/18/1995 A-94 N-93 S-93<br />
JEFFERSON COUNTY* Single-Family 04/28/1996 A-94 N-93 S-93<br />
JEFFERSON COUNTY* Single-Family 06/22/1997 F-97 A-96 M-95 M-95 A-94 N-93 S-93 J-93<br />
JEFFERSON COUNTY* Single-Family 03/20/1998 J-97 N-93 S-93 J-93<br />
JEFFERSON COUNTY* Single-Family 04/12/1994 N-93 S-93<br />
JEFFERSON COUNTY* Single-Family 04/12/1994 N-93 S-93<br />
JEFFERSON COUNTY* Single-Family 04/12/1994 N-93 S-93<br />
JEFFERSON COUNTY* Single-Family 05/07/2000 A-96 M-95 A-94 N-93 S-93<br />
JEFFERSON COUNTY* Nonresidential 04/28/1996 J-93<br />
JEFFERSON COUNTY* Two to Four-Family 06/27/1998 S-93<br />
JEFFERSON COUNTY* Single-Family 05/07/2000 A-98 A-96<br />
JEFFERSON COUNTY* Single-Family 05/07/2000 A-98 A-96<br />
JEFFERSON COUNTY* Single-Family 04/12/1994 N-93 S-93<br />
JEFFERSON COUNTY* 302<br />
DE SOTO, CITY OF Single-Family 05/06/2003 M-00<br />
DE SOTO, CITY OF Count 1<br />
Grand Count 379<br />
* REPRESENTS COUNTY<br />
Source: SEMA<br />
Other areas that are in the 100 and 500-year floodplain that are susceptible to flooding<br />
include the following areas within <strong>Jefferson</strong> <strong>County</strong>:<br />
DeSoto<br />
Joachim Creek flash flooding along Cedar St. & near high school<br />
Valley St. Culvert flooding<br />
N. Main St. Artery<br />
Festus<br />
Flooding on Highway BB<br />
Flooding on Highway W. Old 21<br />
Flooding on Highway 61/67<br />
Flooding on Highway 55<br />
Kimmswick<br />
Rock Creek floods Hwy K under 33 feet of water.
36<br />
Seasonal Seasonal Pattern<br />
Pattern<br />
<strong>Jefferson</strong> <strong>County</strong> – Section 2<br />
The <strong>East</strong>-<strong>West</strong> <strong>Gateway</strong> <strong>Council</strong> of Governments planning region (namely, <strong>Jefferson</strong><br />
<strong>County</strong>) typically obtains most of its wet weather in the spring months (April, May, June<br />
and July). Seasonal patterns are depicted on the Table J28 below.<br />
TABLE TABLE J28 J28 J28 SEASONAL SEASONAL FLOODING FLOODING PATTERNS PATTERNS IN/NEAR<br />
IN/NEAR<br />
JEFFERSON JEFFERSON COUNTY COUNTY ALONG ALONG ALONG MISSISIPPI MISSISIPPI RIVER RIVER<br />
RIVER<br />
Month Month<br />
Number Number of of Events<br />
Events<br />
January 0<br />
February 0<br />
March 0<br />
April 5<br />
May 2<br />
June 2<br />
July 2<br />
August 1<br />
September 0<br />
October 1<br />
November 0<br />
December 1<br />
Therefore, the floodplain areas are highly likely to experience one or more flood events<br />
during the months of April through July.<br />
What What are are Levees?<br />
Levees?<br />
Man-made levee systems usually consist of earthen embankments and wall structures<br />
which are designed and constructed to contain, control, or divert the rising flow of water<br />
so as to protect low lying areas from periodic flooding. For stability, an earthen levee is<br />
constructed in pyramid fashion so that its bottom width is several times its height.<br />
Therefore, constructed levees have a large footprint requiring considerable land area. In<br />
urban areas where land is limited, concrete and masonry floodwalls are often used. A long<br />
levee system, such as those of Southwestern Illinois, may include a combination of earthen<br />
levees and floodwalls. Also, earthen levees are generally constructed with compacted clay<br />
materials and an impervious clay base to prevent water infiltration (see Figure J22A).
A Regional Overview All-Hazard Mitigation Plan 37<br />
FIGURE FIGURE J22A J22A J22A LEVEE LEVEE DESIGN<br />
DESIGN<br />
Figure Figure 4: 4: Cross Cross-Sectional Cross Sectional View of of an Earthen Levee<br />
Generally, levees are specifically designed and constructed to withstand a certain flood<br />
frequency. A ten to a fifty-year levee is usually considered to be an agricultural levee<br />
designed to protect floodplain in agricultural areas from floods that may occur once every<br />
ten or fifty years. These areas will experience flooding during major flood events (e.g.,<br />
100-year flood events). Urban levees protect floodplains from 100-year floods or higher.<br />
Other levee structures in the system include tie back or lateral levees, which extend from<br />
the main stem levee to bluff lines (high ground) and are part of the line of protection<br />
against backflow during periods of high water (FIGURE J30C). Other key components of a<br />
levee system include pumping stations, gravity drains or outlets, street closure gates and<br />
relief wells. Gravity drains or outlets are openings built through the base of the levees and<br />
are designed to drain and convey floodwaters. These gravity structures permit the<br />
outflow of stormwater that comes off the bluffs to the east when the river stage is low.<br />
Gravity drains are equipped with closure gates to prevent the river flows from entering the<br />
protected area during time of high river stages. Pump stations may be also operated to<br />
drain the protected area from interior flooding (FIGURE J30C).<br />
Figure Figure 5: 5: Schematic Schematic of of of Standard Standard Levee Levee Levee System System Source: FEMA<br />
The four general ways a levee may fail include: overtopping; piping; saturation; and<br />
underseepage (FIGURE J22B). During an extreme flood situation, floodwaters may actually<br />
exceed the designed water level of the levee and overtop it. For example, the Metro <strong>East</strong><br />
levees have a design water level of 52.0 feet. In 1993 floodwaters reached a level of 49.6<br />
feet, which approached but did not reach overtop conditions. Piping, or internal levee<br />
erosion, occurs when floodwaters enter the levee through animal burrows and/or plant and<br />
tree root channels. Saturation failure is attributable to a levee that is saturated with<br />
floodwaters for an extended period of time. Floodwater permeates and weakens the core<br />
of the levee, making it unstable. Underseepage refers to floodwater that travels under the
38<br />
<strong>Jefferson</strong> <strong>County</strong> – Section 2<br />
base of the levee via an unstable layer of sand and gravel and weakens the base foundation<br />
of the levee from below (FIGURE J22B).<br />
To control for underseepage, relief wells are drilled on the interior side of the levee, and<br />
operated during flood events to depress and eliminate seepage under the levee. Another<br />
method for eliminating or controlling levee seepage is the construction of pressure berms.<br />
These berms are designed as horizontal strips of materials built contiguous to the levee<br />
base on the interior sides of the levee for the purpose of providing protection from seepage<br />
and resulting levee erosion.<br />
FIGURE FIGURE J22B J22B UNDE UNDERSEEPAGE<br />
UNDE UNDE RSEEPAGE<br />
Source: FEMA<br />
The size and height of the St. Louis urban levee system has grown over the years to its<br />
current configuration to protect from the 500-year flood, a flood that has 0.2 percent<br />
chance of occurring in any given year. Major levee improvements were completed with the<br />
passage of the Flood Control Act of 1938. Today’s urban levee system consists of riverside<br />
levees and tie back or wing-levees, canals, conduits, pumping stations, gravity drains and<br />
seepage relief wells. The urban levee system has proven effective in protecting the<br />
American Bottoms from major flooding events, including the flood of record in 1993 (a<br />
300-year flood) and a 200-year flood in 1995.<br />
Below is a brief description of each the levee districts of concern in this report. The maps<br />
show the location of the levees and protected areas.
A Regional Overview All-Hazard Mitigation Plan 39<br />
FIGURE FIGURE J22C J22C LEVEE LEVEE DISTRICT DISTRICT CONCERN CONCERN EXAMPLE<br />
EXAMPLE
40<br />
Public Public Law Law 84 84-99 84 84 99 99<br />
<strong>Jefferson</strong> <strong>County</strong> – Section 2<br />
Public Law 84-99 is the authority by which the Army Corps of Engineers responds to<br />
emergencies within the District boundary. Under PL 84-99 authorities are delegated to<br />
the Corps Districts for disaster preparedness, emergency operations, rehabilitations,<br />
emergency water supplies and drought assistance, advance measures and hazard<br />
mitigation. The St. Louis District encompasses approximately 28,000 square miles, almost<br />
equally divided between Illinois and Missouri, and ten riverine watersheds.<br />
Eighty-nine levees in the St. Louis District participate in the PL 84-99 program.<br />
Inclusion in the program requires submittal of as-built drawings and current geotechnical<br />
and survey information, as well as an onsite inspection by Army Corps engineers and<br />
specialists.<br />
Once accepted into the program, levee districts must pass annual operation and<br />
maintenance inspections with an acceptable or minimum acceptable rating. If the levee<br />
district maintains its eligibility, the levee district qualifies for federal funds to repair<br />
damages that occur to the levee during a declared federal emergency.<br />
St. St. Louis<br />
Louis<br />
Flood Flood Risk Risk Manage Management<br />
Manage ment<br />
The 1993 Midwest flood was one of the most damaging natural disasters ever to affect the<br />
United States up to that time. Total impact of damages approximated $15 billion,<br />
thousands of people were evacuated, fifty people died and hundreds of levees failed. The<br />
flood and its path of devastation lasted for several months. The magnitude of this flood<br />
event seemed overwhelming. Just twelve years later Hurricane Katrina and storm surges<br />
that followed caused more than fifty levee breaches, resulting in catastrophic flooding<br />
damage over large portions of southern Mississippi and Louisiana. More than fourteen<br />
hundred people died and over 80% of New Orleans was flooded. The losses devastated an<br />
entire multistate region and, for a time, adversely affected the whole United States<br />
economy.<br />
Katrina has focused great attention on the flood protection systems across the United<br />
States. Under the current circumstances, competition for limited federal funding, limited<br />
financial capacity of local sponsors and delays in appropriations conspire to compromise<br />
public safety and welfare.<br />
The St. Louis District’s flood risk management system is comprised of three major<br />
components: urban levees or floodwalls, agricultural levees and multi-purpose<br />
reservoirs.<br />
Urban levees are built high to protect cities and towns against floods of great magnitude.
A Regional Overview All-Hazard Mitigation Plan 41<br />
Agricultural levees are smaller levees that provide relatively lower levels of protection to<br />
thousands of acres of cropland against more frequent, less severe floods. There are over<br />
700 miles of levee structures within the St. Louis District, protecting approximately 578,365<br />
acres.<br />
Multi-purpose reservoirs are an important part of the flood risk management system. They<br />
provide flood storage capacity and support other Corps’ missions, such as water supply,<br />
hydropower, environmental stewardship and recreation. During the Great Flood of 1993,<br />
the water held back by Army Corps reservoirs decreased the crest in St. Louis by four feet.<br />
When performance of a flood damage reduction system is evaluated, all components<br />
must be considered and evaluated as a whole system and not as separate features. Since<br />
1960 the overall system has prevented more than $11 billion in damages within the St.<br />
Louis District.<br />
Located below is a list of levees based upon ratings by the US Army Corp of Engineers.<br />
There are also figures depicting levee location. Volume 2 contains additional maps of levee<br />
systems in the St. Louis area which were developed by the US Army Corps of Engineers.<br />
TABLE TABLE J29A J29A LIST LIST LIST OF OF LEV LEVEES LEV EES<br />
Levee Levee<br />
Acceptable:<br />
Acceptable:<br />
Federal/Non<br />
Federal/Non-Fed<br />
Federal/Non Fed St. St. Charles<br />
Charles<br />
Protection Protection Protection Miles Miles Miles Acres Acres Protected Protected<br />
Protected<br />
St. Peters No. 1 Non-Federal Levee 10 Year Protection .5 Miles 300 Acres<br />
Dutzow Bottom Levee Association Non-Federal Levee 25 Year Protection 14.1 Miles 6,700 Acres<br />
Augusta Bottom Levee Association Non-Federal Levee 25 Year Protection 14.1 Miles 6,700 Acres<br />
St. Louis Flood Protection Project<br />
City City of of St. St. Louis<br />
Louis<br />
Federal Levee 500 Year Protection 10.67 Miles 3,160 Acres<br />
Valley Park D&L District<br />
St. St. Louis Louis <strong>County</strong><br />
<strong>County</strong><br />
Federal Levee 100 Year Protection 3.2 Miles 365 Acres<br />
Riverport Levee District Non-Federal Levee 500 Year Levee 1.1 Miles 440 Acres<br />
Earth City Levee District Non-Federal Levee 500 Year Levee 2.6 Miles 1,900 Acres<br />
Festus/Crystal City<br />
<strong>Jefferson</strong> <strong>Jefferson</strong> <strong>County</strong><br />
<strong>County</strong><br />
Federal Levee 500 Year Protection 3.2 Miles 365 Acres<br />
Minimum Minimum Acceptable:<br />
Acceptable:<br />
Acceptable:<br />
Darst Bottom L.D. (Sec. 2)<br />
St. St. Charles<br />
Charles<br />
Non-Federal Levee 100 Year Protection 8.2 Miles 3,500 Acres<br />
Missouri University Levee Non-Federal Levee 10 Year Protection 2.8 Miles 450 Acres<br />
Greens Bottom L.D. (Sec. 1&2) Non-Federal Levee 5 Year Protection 8.5 Miles 3,100 Acres<br />
Monarch/Chesterfield*<br />
St. St. Louis Louis <strong>County</strong><br />
<strong>County</strong><br />
Federal Levee 500 Year Protection 11.5 Miles 4,240 Acres
42<br />
TABLE TABLE J29A J29A J29A LIST LIST OF OF LEV LEVEES LEV LEV EES<br />
<strong>Jefferson</strong> <strong>County</strong> – Section 2<br />
Levee Levee<br />
Federal/Non<br />
Federal/Non-Fed<br />
Federal/Non Fed Protection Protection Miles Miles Acres Acres Protected<br />
Protected<br />
Missouri Bottoms Levee District Non-Federal Levee 10 Year Protection 7.1 Miles 2,530 Acres<br />
Columbia Bottoms Levee District Non-Federal Levee 5 Year Protection 8 Miles 4,000 Acres<br />
Howard Bend Levee Dist. Non-Federal Levee 500 Year Protection 6.1 Miles 6,000 Acres<br />
Old Town St. Peters Levee<br />
St. St. Charles<br />
Charles<br />
Federal Levee 100 Year Protection .9 Miles 644 Acres<br />
Elm Point Levee Non-Federal Levee 25 Year Protection 2.7 Miles 390 Acres<br />
Consolidated North <strong>County</strong> L.D. Federal Levee 20 Year Protection 42 Miles 30,000 Acres<br />
Kuhs Levee District Non-Federal Levee 10 Year Protection 7 Miles 1,980 Acres<br />
Cora Island Levee<br />
*Design *Design Deficiency<br />
Deficiency<br />
Non-Federal Levee 25 Year Protection 6.2 Miles 1,000 Acres<br />
FIGURE FIGURE J22D J22D St. St. Albans Albans & & Augusta Augusta Bottoms Bottoms Levee Levee System<br />
System
A Regional Overview All-Hazard Mitigation Plan 43<br />
FIGURE FIGURE J22E J22E St. St. Peters Peters & & Chesterfield Chesterfield Valley Valley Levee Levee Systems<br />
Systems
44<br />
FIGURE FIGURE J22F J22F Confluence Confluence Levee Levee System<br />
System<br />
<strong>Jefferson</strong> <strong>County</strong> – Section 2
A Regional Overview All-Hazard Mitigation Plan 45<br />
FIGURE FIGURE J22G J22G St. St. Louis Louis Regiona Regional Regiona l Map of Levees
46<br />
FIGURE FIGURE J22H J22H St. St. Louis Louis and and St. St. Charles Charles <strong>County</strong> <strong>County</strong> Levee Levee Map<br />
Map<br />
US Army Corps of Engineers<br />
<strong>Jefferson</strong> <strong>County</strong> – Section 2<br />
TABLE TABLE J29B J29B DAMAGE DAMAGE ASSESSMENT ASSESSMENT OF OF TOTAL TOTAL LEVEE LEVEE FAILURE FAILURE- FAILURE ST. LOUIS REGION<br />
ST. ST. LOUIS LOUIS COUNTY<br />
COUNTY<br />
Land Use Parcel Improve- Tax Value Total Assessment % Improved Assessment Total Value Land<br />
Commercial 240,594,370 293,651,610 32% 753,715,637.31 919,929,300.00 166,213,662.69<br />
Common Ground 2,720 26,140 31% 8,917.52 85,700.00 76,782.48<br />
Duplex/Townhome 110,770 121,780 19% 583,502.67 641,500.00 57,997.33<br />
Industrial/Utility 241,072,170 326,184,830 32% 754,152,200.93 1,020,412,300.00 266,260,099.07<br />
Institution 7,220,560 8,195,570 31% 23,215,018.83 26,349,800.00 3,134,781.17<br />
Multi-Family 19,860 23,430 19% 104,512.93 123,300.00 18,787.07<br />
Park 945,250 3,862,750 25% 3,842,128.33 15,700,800.00 11,858,671.67<br />
Recreation 11,753,470 20,832,080 30% 38,810,957.61 68,789,300.00 29,978,342.39<br />
Single Family 1,950,880 2,201,010 19% 10,544,897.24 11,896,900.00 1,352,002.76<br />
Vacant/Agriculture 1,733,590 17,841,190 30% 5,859,094.79 60,298,700.00 54,439,605.21<br />
Total: Total:<br />
505,403,640 505,403,640 672,940,390 672,940,390 1,590,836,868.16<br />
1,590,836,868.16 1,590,836,868.16 2,124,227,600.00 2,124,227,600.00 533,390,731.84<br />
533,390,731.84
A Regional Overview All-Hazard Mitigation Plan 47<br />
CITY CITY CITY OF OF ST. ST. LOUIS LOUIS<br />
LOUIS<br />
Land Use Parcel Improve- Tax Value Total Assessment % Improved Assessment Total Value Land<br />
Commercial 616 60,499,110 86,503,490 32% 189,059,718.75 270,323,406.25 81,263,687.50<br />
Industrial 660 52,425,020 78,589,100 32% 163,828,187.50 245,590,937.50 81,762,750.00<br />
Institutional 21 1,911,720 6,048,770 32% 5,974,125.00 18,902,406.25 12,928,281.25<br />
Multi-Family 290 1,440,580 1,688,810 19% 7,582,000.00 8,888,473.68 1,306,473.68<br />
R.O.W. 41 42,400 1,471,800 12% 353,333.33 12,265,000.00 11,911,666.67<br />
Recreation 14 28,000 4,112,590 12% 233,333.33 34,271,583.33 34,038,250.00<br />
Single Family 343 1,636,000 2,248,950 19% 8,610,526.32 11,836,578.95 3,226,052.63<br />
Vacant Undeveloped 76 3,601,700 7,271,880 12% 30,014,166.67 60,599,000.00 30,584,833.33<br />
Vacant Residential 321 1,090,920 1,411,490 19% 5,741,684.21 7,428,894.74 1,687,210.53<br />
Total: Total:<br />
2,382 2,382 122,675,450 122,675,450 189,346,880<br />
189,346,880 189,346,880<br />
411,397,075.11<br />
411,397,075.11 411,397,075.11 670,106,280.70 670,106,280.70 258,709,205.59<br />
258,709,205.59<br />
ST. ST. CHARLES CHARLES CO<br />
CO<br />
Land Use Parcel Improve- Tax Value Total Assessment % Improved Assessment Total Value Land<br />
Agriculture 958 10,485,680 15,385,977.20 12% 87,380,667 128,216,477 40,835,810<br />
Commercial 103 8,419,900 11,868,229.60 32% 26,312,188 37,088,218 10,776,030<br />
Government 352 2,619,450 16,629,635.60 32% 8,185,781 51,967,611 43,781,830<br />
Industrial 44 34,027,040 39,292,982.40 32% 106,334,500 122,790,570 16,456,070<br />
Multi-Family 64 2,586,770 2,590,248.90 19% 13,614,579 13,632,889 18,310<br />
Recreational 7 443,780 604,901.60 12% 3,698,167 5,040,847 1,342,680<br />
Single Family 566 9,210,040 13,397,961.10 19% 48,473,895 70,515,585 22,041,690<br />
Utility 7 64,710 69,612.00 12% 539,250 580,100 40,850<br />
Total: Total: Total:<br />
2,101 2,101 67,857,370<br />
67,857,370 67,857,370 99,839,548.40<br />
99,839,548.40 99,839,548.40<br />
294,539,025.77<br />
294,539,025.77 294,539,025.77 429,832,295.77 429,832,295.77 135,293,270.00<br />
135,293,270.00<br />
Flood Flood Fight Fight Teams<br />
Teams<br />
The St. Louis District has seven flood fight teams assigned to watershed sectors within the<br />
District’s area of responsibility. Flood fight teams are activated once river stages reach a<br />
pre-determined level. They provide technical assistance to effected levee districts and act as<br />
a liaison between the District’s emergency operations center and impacted communities.<br />
The District’s Readiness Branch ensures that the teams remain properly staffed and ready<br />
for emergency response.<br />
FEMA FEMA Floodplain Floodplain maps<br />
maps<br />
The Federal Emergency Management Agency is responsible for administering the<br />
National Flood Insurance Program. The NFIP is an agreement between the Federal<br />
government and local communities and has three components: flood risk mapping,<br />
floodplain management and flood insurance availability.<br />
Flood Insurance Risk Maps are used to manage development with the goal of reducing risk.<br />
Many FIRMS across the country were published in the late 1970s and early 1980s. FEMA is<br />
in the midst of a multi-year, $1 billion map modernization effort to update all floodplain
48<br />
maps across the country.<br />
<strong>Jefferson</strong> <strong>County</strong> – Section 2<br />
The goal is to provide up-to-date, accurate flood risk info to the public, provide data so<br />
individuals and communities can make informed risk management decisions and promote<br />
and enhance public safety.<br />
B. B. Restoration Restoration Zone Zone (AR (AR Zone) Zone) Zone) Designation<br />
Designation<br />
The National Flood Insurance Program requires FEMA to map areas that are not certified to<br />
protect against a 100-year flood as Special Flood Hazard Areas, but it also allows FEMA to<br />
map areas previously shown as protected by a levee as a “Restoration Zone” (AR Zone).<br />
Because the American Bottoms has historically been protected by levees and work has<br />
begun to continue to provide that protection, FEMA suggests that an AR designation<br />
would provide many short-term benefits. In a letter sent to all affected communities, dated<br />
October 5, 2007, FEMA suggested that the levees might meet requirements for AR Zone<br />
designation (Appendix B). AR Zone indicates that the increased flood hazard is considered<br />
temporary and that restoration of protection is underway. An application to FEMA that is<br />
submitted before January 30, 2008 would allow sufficient time for FEMA to make a<br />
determination and incorporate the designation in FEMA’s preliminary maps.<br />
The application process requires that communities currently designated as protected make<br />
a written request to be considered for AR Zone. According to FEMA, “communities”<br />
means all of the communities participating in the National Flood Insurance Program. The<br />
communities include cities, villages and counties representing the unincorporated areas. In<br />
an area such as the American Bottoms where there are many communities, FEMA will<br />
accept a joint application as long as it includes a request letter signed by the chief elected<br />
official from each of the cities, villages and counties. 9<br />
The request will need to include<br />
technical information about how the plan to correct design deficiencies will be<br />
implemented over a period not to exceed ten years, if being done in cooperation with a<br />
federal agency (or five years if a non-federal project). Each community will also be<br />
responsible for adopting a resolution passed by the city or county legislative body – saying<br />
they want to apply for the AR Zone designation, that they have not applied before, that<br />
they are not in litigation over levees, and that they have a plan to meet requirements for<br />
federally supported restoration. The communities must also be certified by the Corps that<br />
they are protected against a 33- year flood, a requirement that the Corps has indicated will<br />
likely be met, based on a survey currently underway.<br />
For the purpose of determining future development restrictions, the law makes a<br />
distinction between “developed” and “undeveloped” areas. A community must adopt a<br />
map or legal description designating the developed area, to be submitted with the AR<br />
Zone request. As defined in the rule at 44 CFR 59.1(a)-(c) the developed area encompasses<br />
the larger urbanized area as well as isolated developed subdivisions beyond the urbanized<br />
area. Developed area also recognizes vested land development interests by identifying land<br />
that is planned and permitted and where construction is underway. FEMA indicates that
A Regional Overview All-Hazard Mitigation Plan 49<br />
while the communities will need to include a map of developed areas in the initial<br />
application, the map may be later amended to include any additional areas that are<br />
developed (or where construction has begun) during the time before the map becomes<br />
official. After FEMA sends the letter of final determination on the AR Zone, the<br />
communities will then have time to legally adopt their official map.<br />
C. C. Benefits Benefits of of AR AR Zone<br />
Zone<br />
The AR Zone designation helps eligible communities establish levee restoration plans that,<br />
when implemented properly, will allow the communities to remove the SFHA designation<br />
from the previously protected areas as soon as the levee system is restored. With this AR<br />
Zone designation indicating that a restoration plan is in place, developers will be more<br />
confident in the long-term success of their investments.<br />
There are other significant benefits. The flood insurance premium rates are lower in<br />
SFHAs designated AR Zone than the rates in SFHAs with other flood insurance risk zone<br />
designations. Rates in the AR Zone are similar to the rates available to people who have<br />
purchased insurance while the area is recognized as protected and grandfathered into<br />
the required program. The structure elevation requirements in AR Zone areas are more<br />
relaxed than the elevation requirements in other SFHAs 10<br />
. The designation of AR Zone<br />
areas also provides a strong incentive for communities to expeditiously restore base flood<br />
protection in at-risk areas.<br />
In areas designated as AR Zone, the minimum elevation required for all new construction in areas identified<br />
as developed is 3 feet above the highest adjacent grade or the AR Zone Base Flood Elevation, whichever is<br />
lower. For new construction in AR Zone that is outside areas already designated as developed, the<br />
requirement is 3 feet in areas where base flood depth are projected to be less than five feet or the AR Zone<br />
Base Flood Elevation for any areas where the projected flood depths exceed 5 feet.<br />
D. D. Zone Zone A99<br />
A99<br />
As adequate progress is made on any levee reconstruction project, a community may<br />
request FEMA to revise the AR Zone designation to A99. Zone A99 designation indicates<br />
that for insurance rating purposes, the levee is considered complete. However, NFIP<br />
insurance requirements still apply. 11<br />
Adequate progress includes: 100% project funding<br />
authorized; 60% appropriated; 50% project cost expended and all critical features as<br />
determined by FEMA are under construction and at least 50% completed. The Zone A99<br />
designation is based on the protection from base flood (100-year flood). As soon as FEMA<br />
is notified that the project is complete, FEMA can remap the area to delineate a floodprotection<br />
zone.
50<br />
Recent Recent Levee Levee Projects<br />
Projects<br />
<strong>Jefferson</strong> <strong>County</strong> – Section 2<br />
St. t. Louis Louis Flood Flood Protection Protection Project<br />
Project<br />
Authorized level of protection: 500 year Length: 10.67 miles Protects: 3,160 acres of<br />
industrial and commercial development, and residential areas Concern: Inadequate<br />
seepage controls and deteriorated metal closure gates Solution:<br />
• Replace swing gates at 20 closure structures and permanently close openings at 13<br />
closure structures<br />
• Install 70 new relief wells, replace 103 existing relief wells<br />
Status: Nearing completion of preconstruction engineering<br />
and design City of St. Louis has its cost share. Require<br />
Construction General funds to begin relief wells and closure<br />
structures construction<br />
Monarch Monarch Chesterfield Chesterfield Levee Levee District<br />
District<br />
Authorized level of protection: 500 year Length: 11.5 miles Protects: 4,240 acres; $660<br />
million in economic value Concern: Ensure levee provides 500 year level of protection<br />
Project:<br />
Levee raise, installation of relief wells and sheet pile cutoff, and construction of berms<br />
Status:<br />
Project Cooperation Agreement being executed between Corps and sponsor.<br />
Army Corps initial construction contract expected to be Baxter Road closure structure.<br />
Sponsor-constructed levee raise completed. Sponsor constructing berm to address<br />
underseepage issue along 7,500 feet of levee.<br />
Flood Flood and and Decertification Decertification of of Levee Risks<br />
When the FEMA maps are finalized (currently predicted to occur in March 2009), property<br />
in flood risk areas will be required to have federal flood insurance to qualify for a mortgage<br />
from a federally regulated institution. Flood insurance purchased now (and over the next<br />
year before the new maps are officially adopted by FEMA) is significantly less expensive<br />
than it will be once the maps are finalized, because the property is still officially behind a<br />
protected levee.<br />
Potential levee decertification will cause massive costs to individuals and businesses and<br />
potentially cripple economic growth and investment in the region. Federally regulated<br />
financial institutions will not be able to issue loans to homeowners or businesses that<br />
do not carry adequate flood insurance, and communities will need to adopt<br />
development ordinances that include strict requirements for building in flood zones.
A Regional Overview All-Hazard Mitigation Plan 51<br />
Many homeowners will not be able to afford flood insurance, even at the current<br />
favorable rate, putting them at future financial risk. A secondary impact to<br />
homeowners and small businesses is a potential decline in property values, since sales<br />
of property that require bank financing will be conditioned on the purchase of costly<br />
flood insurance.<br />
This potential action will directly affect almost a third of the population of the Illinois<br />
portion of the St. Louis area and many critical businesses that are the foundation of the<br />
local economy. Inadequate levees threaten to disrupt all who travel on interstate highways<br />
55, 64 and 70. The consequences will be felt not only by areas that could be in jeopardy<br />
of flooding, but also by all communities that have a stake in the economic vitality of the<br />
region.<br />
Speed Speed Of Of Onset Onset And And /Or /Or Existing Existing Warning Warning Systems<br />
Systems<br />
Depending upon the weather forecasts, the speed of onset of flash floods can be almost<br />
instantaneous. Existing warning systems are issued by the National Weather Service and<br />
the local media (television stations, the Weather Channel and local radio stations); USACE,<br />
USGS river stages warnings are given that enable communities to plan for flood events.<br />
The National Weather Service prepares its forecasts and other services in collaboration with<br />
agencies like the U.S. Geological Survey, U.S. Bureau of Reclamation, U.S. Army Corps of<br />
Engineers, Natural Resource Conservation Service, National Park Service, ALERT Users<br />
Group, Bureau of Indian Affairs, and many state and local emergency managers across the<br />
country.<br />
Hazard Hazard Map Map for for for Flood Flood Events<br />
Events<br />
Refer to Figures J23 and J24 (located in the Technical Appendix) that depict the areas of<br />
the county susceptible to the 100 and 500-year floods.<br />
Statement Statement Statement of of Probable Probable Future Future Severity<br />
Severity<br />
According to SEMA’s Severity Ratings Table, the 1993 floods would qualify as critical.<br />
During the 1993 floods, some facilities were closed for more than 24 hours. Other flood<br />
events had minimal impact on quality of life, no critical facilities or services were shut down<br />
for more than 24 hours, and property damage for the county was about 11percent.<br />
Therefore, the probable severity of future floods could range from critical in the floodplain<br />
areas to negligible in the areas outside of the floodplains.<br />
Statement Statement of of Probable Probable Risk<br />
Risk<br />
Flooding in <strong>Jefferson</strong> <strong>County</strong> is likely to occur in the future. <strong>Jefferson</strong> <strong>County</strong> faces two<br />
major factors for flooding. First, the land that forms <strong>Jefferson</strong> <strong>County</strong> is included the area
52<br />
<strong>Jefferson</strong> <strong>County</strong> – Section 2<br />
that drains to the Mississippi and Meramec River. Secondly, according to the FIRM, 11<br />
percent of the land for the <strong>Jefferson</strong> <strong>County</strong> lies within the 100-year floodplain. The<br />
majority of that land lies adjacent to the Mississippi River levees and the Meramec River.<br />
The Mississippi River has experienced 14 major flood events since 1785. The Meramec<br />
River has experienced 15 flood events in the last 22 years.<br />
Statement Statement Statement of of of Next Next Next Disaster’s Disaster’s Disaster’s Likely Likely Likely Adverse Adverse Adverse Impact Impact Impact on on the the the Community Community<br />
Community<br />
The next flood to invade <strong>Jefferson</strong> <strong>County</strong> would follow the pattern of the 1993 floods.<br />
However, post-1993 mitigation measures already have been tested in the 1995 and 2001<br />
flooding along the Mississippi and Meramec River. Despite high river levels, damages were<br />
relatively minimal due to relocation of many homes and businesses. Adverse impacts of<br />
future Mississippi and Meramec River floods are discussed below.<br />
Without Without Mitigation Mitigation Measures:<br />
Measures:<br />
Life: Limited<br />
Property: Limited<br />
Emotional: Limited<br />
Financial: Limited<br />
Comments: The above impacts assume conditions at the time of the 1993 floods over<br />
the entire county. Impacts within the floodplain would be catastrophic; impacts outside of<br />
the floodplain would be negligible.<br />
With With Mitigation Mitigation Measures: Measures:<br />
Measures:<br />
Life: Negligible<br />
Property: Negligible<br />
Emotional: Negligible<br />
Financial: Negligible<br />
Comments: Mitigation measures have already begun in the wake of the 1990s floods.<br />
Further mitigation measures should be directed at improving land use practices and<br />
redesigning vulnerable highways.<br />
Recommendation<br />
Recommendation<br />
In 1996, MDNR/DGLS, Dick Gaffney prepared a Flood Analysis Report, based on four<br />
documents: The Report and Recommendations of the Governor’s Task Force on Flood Plain<br />
Management on behalf of Governor Carnahan, July, 1994; The Floods of ’93, State of<br />
Missouri -- The Federal Interagency Hazard Mitigation Team, Report For the Three<br />
Presidential Disaster Declarations in Missouri, April, 1994, as set up by FEMA under 1988<br />
Stafford Act; Sharing the Challenge: Floodplain Management into 21 st Century -- The<br />
Report of the Interagency Floodplain Management Review Committee to the<br />
Administration (Whitehouse) Floodplain Management Task Force; A Blueprint for Change,<br />
June, 1994 and National Flood Policy in Review-1994 by Association of State Floodplain<br />
Managers (ASFPM). Recommendations made by these documents are summarized below:
A Regional Overview All-Hazard Mitigation Plan 53<br />
All four post-flood reports recommend that the state should take an active role in<br />
flood plain management, determine state flood plain management, determine state<br />
flood plain management policy and implement it.<br />
The reports generally agreed that the hydrology of the Missouri and the Mississippi<br />
rivers should be reviewed, with the possible result that base flood elevations should<br />
be recalculated and new flood maps issued.<br />
The encouragement of participation in the National Flood Insurance Program, both<br />
by communities and individual property owners was stressed to the point that<br />
recommendations stated that post-flood disaster assistance to those not insured<br />
should be limited, reduced or withheld. The problems of mortgage lenders and<br />
borrowers were addressed and escrow of premiums for flood insurance was<br />
emphasized.<br />
Maintaining flood insurance purchase requirements behind levee protection works<br />
was recommended. Further, it was recommended that the state develop a<br />
definition of market value to assure compliance with flood insurance regulations,<br />
dealing with substantial damages.<br />
Levees, levee districts, levee protection systems, state levee permits, levee<br />
construction criteria, levee repairs and levee heights were addressed by the four<br />
reports as a result of the levee failures in the 1993 flooding. More state<br />
involvement in this topic was universally recommended, especially with regard to<br />
oversight and permits. These recommendations imply that it is critical with respect<br />
to property owners and their lives that the flood stages remain stable (does not<br />
fluctuate as a result of levees built upstream). The aggregate result will be to<br />
increase the flood danger by increasing the height and velocity of river flow during<br />
floods.<br />
Greater environmental sensitivity and increased state government involvement in<br />
flood plain matters was stressed in the post-flood reports. Public health and safety<br />
during flood events was also stressed, especially in regard to hazardous materials.<br />
Government agencies should inventory their property to determine their<br />
vulnerability to future flooding.<br />
Federal agencies should collaborate on an assessment of effectiveness of stream<br />
gauging network and flood forecasting/models.<br />
Insurance should be purchased behind levees to protect citizens against future flood<br />
losses.<br />
Need of a state definition of market value due to 1) NFIP rules not providing a<br />
definition and 2). FEMA not abiding by its definition of market value.<br />
Remove substantially and repetitively damaged structures from flood plains.<br />
Acquire easements on lands through Emergency Wetlands Reserve program,<br />
Conservation Reserve program, USFW.<br />
Ensure that placement/security of hazardous materials on floodplains is done.
54<br />
Earthquake Earthquake Earthquake Hazard Hazard Profile<br />
Profile<br />
Background<br />
Background<br />
<strong>Jefferson</strong> <strong>County</strong> – Section 2<br />
The State of Missouri established the Missouri Seismic Safety Commission (MSSC) through<br />
the authority of the Seismic Safety Commission Act also known as (RSMo) Sections 44.225<br />
through 44.237, the main office being within SEMA. The purpose of MSSC is to review<br />
Missouri’s current preparedness for major earthquakes and to make recommendations to<br />
mitigate their impact. In 1997 MSSC developed a plan A Strategic Plan for Earthquake<br />
Safety that documented successes, opportunities and concerns including<br />
recommendations: 1) that educational efforts continue to be developed and expanded and<br />
that the MSSC take the lead; 2) that continued and increased cooperation of State agencies<br />
with nationally funded programs (National Science Foundation funding the Mid-America<br />
Earthquake Center); 3) that stable State funding be provided for the Missouri earthquake<br />
mitigation and preparedness program; 4) that SEMA review and recommend hiring a<br />
person to train and tract the Community Emergency Response Teams [CERT]; and 5) to<br />
assess the impact of National Hazard Earthquake Reduction Program maps on the state<br />
and that scientific investigations be conducted to evaluate assumptions upon which maps<br />
are based.<br />
The MSSC prepared the A Strategic Plan for Earthquake Safety as the result of a legislative<br />
mandate, Senate Bill No. 142 in 1993. The MSCC notes that preparation following the<br />
Strategic Plan will yield significant reduction in fatalities, casualties, damaged structures,<br />
business failures and state infrastructure losses from earthquakes and will reduce the<br />
impact from other hazards. Key issues identified by MSSC are: 1) Earthquake threat is real<br />
and addressing the problem now will yield significant long-term benefits; 2) Reduction of<br />
earthquake risk required combined efforts of individuals, businesses, industry, professional<br />
and volunteer organizations and all levels of government [promote adoption and<br />
enforcement of appropriate building codes]; 3) Strategies identified in the report for<br />
reducing earthquake risk can be implemented through proactive, voluntary community<br />
participation; others will require legislation or funding, [promote community emergency<br />
response teams-CERTs; 4) MSSC accepts responsibilities to advance earthquake planning<br />
and mitigation in state at outlined in plan. Objectives include: 1) increase earthquake<br />
awareness and education; 2) reduce earthquake hazard through mitigation, 3) create<br />
response efforts that are well-coordinated, fast, efficient to reduce injury, loss of life and<br />
property destruction; 4) improve recovery from seismic event [identify earthquake resistant<br />
shelters]; 5) assess earthquake hazard [develop response team to evaluate post-earthquake<br />
effects].
A Regional Overview All-Hazard Mitigation Plan 55<br />
Description<br />
Description<br />
Earthquake is a term used to describe both sudden slip on a fault (the resulting ground<br />
shaking and radiated seismic energy caused by the slip). Result of volcanic or magmatic<br />
activity, or other sudden stress changes in the earth. The Earth’s crust is made up of large<br />
plates, also known as tectonic plates. These plates are the large, thin, relatively rigid plates<br />
that move relative to one another on the outer surface of the Earth. The lithosphere is the<br />
outer solid part of the earth, including the crust and uppermost mantle. The lithosphere is<br />
about 100 km thick. The lithosphere below the crust is brittle enough at some locations to<br />
produce earthquakes by faulting, such as within a subducted oceanic plate. Much of<br />
Earth's internal heat is relieved through a movement of plates and many of Earth's large<br />
structural and topographic features are consequently formed. Continental rift valleys (the<br />
nearby New Madrid Fault Zone is considered a buried rift valley) and vast plateaus of basalt<br />
are created at plate break up. Plates collide and are destroyed as they descend at<br />
subduction zones to produce deep ocean trenches, strings of volcanoes, extensive<br />
transform faults, broad linear rises, and folded mountain belts. Earth's lithosphere<br />
presently is divided into eight large plates with about two dozen smaller ones that are<br />
drifting above the mantle at the rate of 5 to 10 centimeters (2 to 4 inches) per year. There<br />
are eight large plates; the New Madrid Fault Zone is located in the North American Plate.<br />
Earthquakes include landslides and dam failure/levee failure. Secondary earthquake<br />
hazards that occur from ground shaking. Damage resulting from landslides is similar to<br />
that from earthquakes. Damage resulting from dam failure/levee failure is similar to that<br />
with flash flooding. Landslides and other types of earth movements, including sinkhole<br />
and mine shaft collapse, have occurred in the St. Louis metropolitan area. Landslides result<br />
from a disturbance in the natural stability of a slope. It is another form of earth<br />
movement. They can be small or large in extent, slow or rapid to occur. Triggering events<br />
can be sinkhole collapses or earthquakes.
56<br />
FIGURE FIGURE J25 J25 LANDSLIDE LANDSLIDE POTENTIAL<br />
POTENTIAL<br />
Source: United States Geological Survey<br />
<strong>Jefferson</strong> <strong>County</strong> – Section 2<br />
Landslides constitute a major geologic hazard because they are widespread, occurring in all<br />
50 states, and cause $1-2 billion in damages and more than 25 fatalities on average each<br />
year. Landslides pose serious threats to highways and structures that support fisheries,<br />
tourism, timber harvesting, mining, and energy production as well as general<br />
transportation. Landslides commonly occur with other major disasters such as earthquakes<br />
and floods that exacerbate relief and reconstruction efforts and expanded development<br />
and other land use has increased the incidence of landslide disasters. Refer to Figure J25<br />
above and J26 (located in the back of the Technical Appendix).<br />
Landslides and other types of earth movements including sinkhole and mine shaft collapse<br />
have occurred in the St. Louis metropolitan. The Shaley Warsaw Formation and the<br />
Maquoketa Shale are the two geologic strata present in the region in which landslides
A Regional Overview All-Hazard Mitigation Plan 57<br />
occur. Unstable shales are subject to lateral movement, especially if the natural slope is<br />
disturbed by construction. A foreseeable consequence of construction in this geologic<br />
setting would be disturbance of natural moisture drainage on the slope that could<br />
lubricate the shales interlayered with limestone. The resultant loss of resistance to lateral<br />
movement in the shale beds would have a tendency to accelerate the downhill creep of<br />
associated limestone beds that could be followed by a landslide. Table J30D below<br />
summarizes landslide, sinkhole and underground mine shaft earth movements in the St.<br />
Louis metropolitan region, including <strong>Jefferson</strong> <strong>County</strong>. In its early history, areas in <strong>Jefferson</strong><br />
<strong>County</strong> had been mined for silica and limestone, and has a lead smelter located in<br />
Herculaneum.<br />
The term landslide includes a wide range of ground movement, such as rock falls, deep<br />
failure of slopes, and shallow debris flows. Although gravity acting on an over steepened<br />
slope is the primary reason for a landslide, there are other contributing factors include:<br />
erosion; soil saturation; earthquakes; volcanic activity; and excessive weights on steep<br />
slopes.<br />
Slope materials that become saturated with water may develop a debris flow or mud flow.<br />
The resulting slurry of rock and mud may pick up trees, houses, and cars, thus blocking<br />
bridges and tributaries causing flooding along its path. Features that might be noticed<br />
prior to major landsliding:<br />
• Springs, seeps, or saturated ground in areas that have not typically been wet before.<br />
• New cracks or unusual bulges in the ground, street pavements or sidewalks.<br />
• Soil moving away from foundations.<br />
• Ancillary structures such as decks and patios tilting and/or moving relative to the<br />
main house.<br />
• Tilting or cracking of concrete floors and foundations.<br />
• Broken water lines and other underground utilities.<br />
• Leaning telephone poles, trees, retaining walls or fences<br />
• Offset fence lines.<br />
• Sunken or down-dropped road beds.<br />
• Rapid increase in creek water levels, possibly accompanied by increased turbidity<br />
(soil content).<br />
• Sudden decrease in creek water levels though rain is still falling or just recently<br />
stopped.<br />
• Sticking doors and windows, and visible open spaces indicating jambs and frames<br />
out of plumb.<br />
Characteristics<br />
Characteristics<br />
The characteristics of earthquakes include the rolling or shaking of the surface of the<br />
ground, landslides, liquefaction and amplification. The severity of these hazards depends<br />
on several factors, including soil and slope conditions, proximity to the fault, earthquake<br />
magnitude and type of earthquake.
58<br />
Likely Likely Locations<br />
Locations<br />
<strong>Jefferson</strong> <strong>County</strong> – Section 2<br />
Earthquakes occur all the time all over the world, both along plate edges and along faults.<br />
Most earthquakes occur along the edge of the oceanic and continental plates. Likely<br />
locations of earthquakes that would affect <strong>Jefferson</strong> <strong>County</strong> would come from the New<br />
Madrid Fault Zone, the Wabash Valley Fault and the fault zones in the vicinity of<br />
Farmington (including Big River Fault and the St. Genevieve Fault Zone) because of their<br />
close proximity and the geologic setting of <strong>Jefferson</strong> <strong>County</strong>.<br />
Type Type of of Damage<br />
Damage<br />
Buildings on poorly consolidated and thick soils will typically have more damage than<br />
buildings located on consolidated soils and bedrock. Soils and soft sedimentary rocks near<br />
the earth’s surface and landfills can modify ground shaking caused by earthquakes. One of<br />
these modifications is amplification. Amplification increases the magnitude of the seismic<br />
waves generated by the earthquake. The amount of amplification is influenced by the<br />
thickness of geologic materials and their physical properties. Buildings and structures built<br />
on soft and unconsolidated soils can face greater risk. Damage on buildings can range<br />
from minor foundation cracks to complete leveling of the structure. Refer to Figures J27<br />
and J28 below. Building contents can be broken from being knocked onto the floor or<br />
being crushed by the ceiling, walls and floor failing. Dams and levees have the potential to<br />
fail, resulting in the flooding of downstream regions including residentially populated<br />
areas.<br />
Liquefaction occurs when ground shaking causes wet granular soils to change from a solid<br />
state to a liquid state. This results in the loss of soil strength and the soil’s ability to<br />
support weight. Buildings and their occupants are at risk when the ground can no longer<br />
support these structures. Damage from liquefaction can destroy the buildings and the<br />
foundations the buildings rest on. Liquefaction has been documented from the New<br />
Madrid Fault Zone earthquake activity.<br />
The St. Louis Metropolitan region is 150 miles or so from the New Madrid Fault Zone. If<br />
there was an earthquake of magnitude 6.6 or so, <strong>Jefferson</strong> <strong>County</strong> would feel it; a lot of<br />
the damage would be minor, and not many collapses. If there was an earthquake of<br />
magnitude 8, there would be a good bit of damage, but the region would not be leveled.<br />
Earthquakes and landslides have the potential to destroy roads, bridges, buildings<br />
(especially older buildings constructed of masonry or those buildings that are not designed<br />
to seismic standards), utilities (including those that are not designed to seismic standards)<br />
and other critical facilities (including those that are not designed to seismic standards).<br />
Earthquake induced landslides are secondary earthquake hazards that occur from ground<br />
shaking. Damage resulting from landslides is similar to that from earthquakes.
A Regional Overview All-Hazard Mitigation Plan 59<br />
FIGURE FIGURE J27 J27 INTERIOR INTERIOR DAMAGE DAMAGE FIGURE J28 EXTERIOR EXTERIOR DAMAGE<br />
DAMAGE<br />
Hazard Hazard Event Event History History<br />
History<br />
Source for both photographs: United States Geological Survey website<br />
The central Mississippi Valley has more earthquakes than any other part of the United<br />
States east of the Rocky Mountains. Between 1811 and 1812, four catastrophic<br />
earthquakes, with magnitude estimates greater than 7.0, occurred during a three month<br />
period. Hundreds of aftershocks followed over a period of several years. These magnitude<br />
8 quakes, centered near the town of New Madrid (Missouri), devastated the surrounding<br />
region and rang church bells 1,000 miles away in Boston. The quakes locally changed the<br />
course of the Mississippi River and created Reelfoot Lake. In recent decades, earth<br />
scientists have collected evidence that strong earthquakes in the central Mississippi Valley<br />
have occurred repeatedly in the geologic past. Small earthquakes occur in the region<br />
frequently. Scientists refer to the area in which most of these quakes occur as the New<br />
Madrid seismic zone (NMSZ). It lies within the central Mississippi Valley, extending from<br />
northeast Arkansas, through southeast Missouri, western Tennessee, and western Kentucky<br />
to southern Illinois. Historically, this area has been the site of some of the largest<br />
earthquakes in North America. The largest earthquakes to have occurred since then were<br />
on January 4, 1843 and October 31, 1895 with magnitude estimates of 6.0 and 6.2<br />
respectively. In addition to these events, seven events of magnitude 5.0 and greater have<br />
occurred in the area. In 1974 instruments were installed in and around this area to closely<br />
monitor seismic activity. Since then, more than 4000 earthquakes have been located, most<br />
of which are too small to be felt. On average one earthquake per year will be large enough<br />
to be felt in the area.<br />
The most recent earthquake event affecting the <strong>East</strong>-<strong>West</strong> <strong>Gateway</strong> planning region was<br />
on June 6, 2003. The epicenter of the 4.0 magnitude earthquake was 4 miles southeast of<br />
Blandville, Kentucky and residents in the surrounding area felt the tremor. While impacts<br />
of this quake were inconsequential, Missouri has had three of the largest earthquakes in<br />
the contiguous United States; the three ranking #1, #2 and #4 in magnitude ranging<br />
from 7.9 to 8.1. Projected losses, based on losses from recent earthquake activity in Loma<br />
Prieta, California, losses exceeded $6 billion dollars with over 28,000 homes and businesses<br />
destroyed and 63 lives lost and 3800 injuries in the event of a magnitude 6 earthquake.<br />
Earthquakes pose a serious threat to many Missouri communities. Local governments,
60<br />
<strong>Jefferson</strong> <strong>County</strong> – Section 2<br />
planners, and engineers must consider the threat as they seek to balance development and<br />
risk. Identifying locations susceptible to seismic activity generated by nearby faults,<br />
adopting strong policies and implementing measures and using other mitigation<br />
techniques are essential to reducing risk from seismic hazards in the <strong>East</strong>-<strong>West</strong> <strong>Gateway</strong><br />
planning region. Table J30A below depicts the history of the large earthquakes in the<br />
region.<br />
TABLE TABLE J30A J30A THE THE LARGEST LARGEST EARTHQUAKES EARTHQUAKES IN IN CONTIGUOUS CONTIGUOUS U.S.<br />
U.S.<br />
Location Location<br />
Date Time UTC Magnit Magnitude Magnit<br />
ude ude<br />
1. New Madrid, Missouri 1811 12 16 08:15 UTC 8.1<br />
2. New Madrid, Missouri 1812 02 07 09:45 UTC 8<br />
3. Fort Tejon, California 1857 01 09 16:24 UTC 7.9<br />
4. New Madrid, Missouri 1812 01 23 15:00 UTC 7.8<br />
5. Imperial Valley, California 1892 02 24 07:20 UTC 7.8<br />
6. San Francisco, California 1906 04 18 13:12 UTC 7.8<br />
7. Owens Valley, California 1872 03 26 10:30 UTC 7.6<br />
8. Gorda Plate, California 1980 11 08 10:27 UTC 7.4<br />
9. N Cascades, Washington 1872 12 15 05:40 UTC 7.3<br />
10. California - Oregon Coast 1873 11 23 05:00 UTC 7.3<br />
11. Charleston, South Carolina 1886 09 01 02:51 UTC 7.3<br />
12. <strong>West</strong> of Eureka, California 1922 01 31 13:17 UTC 7.3<br />
13. Kern <strong>County</strong>, California 1952 07 21 11:52 UTC 7.3<br />
14. Hebgen Lake, Montana 1959 08 18 06:37 UTC 7.3<br />
Table J30B below illustrates seismic events from various eastern Missouri seismic sampling<br />
facilities that have been documented by St. Louis University and Southeast Missouri State<br />
University, CERI and CUSEC. To better understand the earthquake hazard, the scientific<br />
community has looked at historical records. Historical earthquake records can be divided<br />
into pre-instrumental and the instrumental period. In the absence of instruments, the<br />
detection of earthquakes is based on observations and felt reports, and is dependent upon<br />
population density and distribution. Newspapers and books from various cities around the<br />
nation (list) provide a good source of historical documentation of the 1811-1812<br />
earthquake. The seismic risk is more severe today than in the past because population is<br />
increasing.<br />
TABLE TABLE J30B J30B RECENT RECENT EARTHQUAKE EVENTS 1.0 1.0 OR GREATER<br />
mb mb Date Date time time UTC UTC Lat. Lat. Lon. Lon. Lon. Depth Depth Depth<br />
km/Location<br />
km/Location<br />
1.5 06/28/2008 10:22 36.48 -89.54 8.2 8 km ( 5 mi) ESE of Marston, MO<br />
1.9 06/27/2008 9:27 36.6 -89.56 5.4 3 km ( 2 mi) WNW of New Madrid, MO<br />
1.2 06/26/2008 11:03 35.49 -85.12 17.2 6 km ( 4 mi) NW of Graysville, TN<br />
1.8 06/26/2008 10:02 36.6 -89.56 5.7 3 km ( 2 mi) WNW of New Madrid, MO<br />
1.4 06/26/2008 4:27 36.45 -89.53 6.1 9 km ( 6 mi) NNW of Tiptonville, TN<br />
2.3 06/24/2008 22:40 36.46 -89.76 3.5 6 km ( 4 mi) WNW of Portageville, MO<br />
2.9 06/24/2008 22:20 38.45 -87.86 14.7 8 km ( 5 mi) NNE of Bellmont, IL<br />
1.8 06/23/2008 4:53 36.54 -89.62 8.6 3 km ( 2 mi) NNW of Marston, MO<br />
1.5 06/19/2008 6:44 36.6 -89.57 15.1 3 km ( 2 mi) WNW of New Madrid, MO
A Regional Overview All-Hazard Mitigation Plan 61<br />
TABLE TABLE J30B J30B RECENT RECENT EARTHQUAKE EVENTS 1.0 OR OR GREATER<br />
1.8 06/17/2008 21:45 35.84 -90.16 4.1 5 km ( 3 mi) S of Manila, AR<br />
1.5 06/16/2008 18:57 36.53 -89.59 8.9 2 km ( 1 mi) NE of Marston, MO<br />
1.5 06/15/2008 3:21 36.49 -89.56 8.9 5 km ( 3 mi) SE of Marston, MO<br />
2.1 06/11/2008 20:31 36.33 -89.44 5 6 km ( 4 mi) SSE of Tiptonville, TN<br />
1.3 06/11/2008 20:31 36.33 -89.45 3.1 6 km ( 4 mi) SSE of Tiptonville, TN<br />
3.6 06/05/2008 7:13 38.444 -87.839 5 7 km ( 4 mi) WNW of Mount Carmel, IL<br />
1.9 06/05/2008 6:34 36.9 -89.41 3.8 4 km ( 2 mi) ESE of Bertrand, MO<br />
1.5 06/03/2008 1:03 36.51 -89.56 7.6 5 km ( 3 mi) E of Marston, MO<br />
1.3 06/01/2008 22:39 36.5 -89.57 9.2 4 km ( 3 mi) ESE of Marston, MO<br />
1.6 06/01/2008 14:56 38.45 -87.85 14.2 8 km ( 5 mi) WNW of Mount Carmel, IL<br />
2 05/29/2008 10:49 38.44 -87.86 14.1 7 km ( 5 mi) NE of Bellmont, IL<br />
1.6 05/12/2008 13:19 36.5 -89.53 6.7 7 km ( 5 mi) ESE of Marston, MO<br />
2.8 05/09/2008 8:40 35.88 -89.99 11.2 5 km ( 3 mi) ENE of Dell, AR<br />
2.7 05/05/2008 11:25 38.486 -90.408 22.9 6 km ( 3 mi) S of Sunset Hills, MO<br />
1.6 05/03/2008 14:54 36.14 -89.41 8.4 11 km ( 7 mi) NNW of Dyersburg, TN<br />
1.6 05/03/2008 4:27 36.54 -89.6 6.5 3 km ( 2 mi) NNE of Marston, MO<br />
1.4 05/03/2008 0:34 38.45 -87.86 16.2 8 km ( 5 mi) NNE of Bellmont, IL<br />
3.3 05/01/2008 5:30 38.459 -87.831 5 7 km ( 5 mi) NW of Mount Carmel, IL<br />
2.6 04/30/2008 19:29 38.45 -87.87 15.4 8 km ( 5 mi) NNE of Bellmont, IL<br />
2.3 04/29/2008 22:56 36.09 -89.77 7.4 5 km ( 3 mi) E of Steele, MO<br />
1.7 04/28/2008 21:46 38.45 -87.85 14.2 8 km ( 5 mi) WNW of Mount Carmel, IL<br />
1.8 04/26/2008 13:09 36.5 -89.53 7.2 7 km ( 5 mi) ESE of Marston, MO<br />
1.7 04/26/2008 12:17 36.5 -89.53 7.2 7 km ( 5 mi) ESE of Marston, MO<br />
3.7 04/25/2008 17:31 38.45 -87.87 13.2 8 km ( 5 mi) NNE of Bellmont, IL<br />
1.9 04/25/2008 1:17 35.77 -90.15 0.4 9 km ( 5 mi) W of Victoria, AR<br />
2.5 04/25/2008 0:45 35.91 -89.95 12.2 4 km ( 2 mi) SW of Blytheville, AR<br />
2.6 04/24/2008 11:44 38.45 -87.9 18.3 7 km ( 5 mi) N of Bellmont, IL<br />
1.8 04/23/2008 22:54 36.52 -89.58 7.1 3 km ( 2 mi) E of Marston, MO<br />
2 04/23/2008 7:21 36.27 -89.5 7.2 2 km ( 1 mi) WNW of Ridgely, TN<br />
2.4 04/23/2008 7:11 36.27 -89.5 7.1 2 km ( 1 mi) WNW of Ridgely, TN<br />
2.1 04/23/2008 1:32 38.46 -87.86 14.4 9 km ( 6 mi) NNE of Bellmont, IL<br />
2.4 04/22/2008 23:24 36.11 -89.75 8.2 8 km( 5 mi) ENE of Steele, MO<br />
2 04/22/2008 10:49 36.48 -89.55 8.7 7 km ( 4 mi) SE of Marston, MO<br />
1.6 04/22/2008 8:01 38.46 -87.9 13.7 8 km ( 5 mi) N of Bellmont, IL<br />
2.2 04/21/2008 7:58 38.45 -87.88 17.3 8 km ( 5 mi) NNE of Bellmont, IL<br />
4 04/21/2008 5:38 38.473 -87.823 10 8 km ( 5 mi) NW of Mount Carmel, IL<br />
2.3 04/20/2008 10:34 38.44 -87.9 16.9 6 km ( 4 mi) N of Bellmont, IL<br />
1.3 04/20/2008 9:59 38.46 -87.84 13.7 8 km ( 5 mi) NW of Mount Carmel, IL<br />
1 04/20/2008 6:32 38.44 -87.85 17.1 8 km ( 5 mi) WNW of Mount Carmel, IL<br />
1.7 04/20/2008 5:31 38.45 -87.88 14.2 8 km ( 5 mi) NNE of Bellmont, IL<br />
2.8 04/20/2008 5:02 38.44 -87.85 16.3 8 km ( 5 mi) WNW of Mount Carmel, IL<br />
1.7 04/19/2008 23:19 36.55 -89.65 7.6 5 km ( 3 mi) WSW of Howardville, MO<br />
2.8 04/19/2008 16:55 38.44 -87.9 14.9 6 km ( 4 mi) N of Bellmont, IL<br />
1.7 04/19/2008 12:45 38.45 -87.91 15.4 7 km ( 5 mi) N of Bellmont, IL<br />
1.3 04/19/2008 9:46 38.44 -87.85 14.4 8 km ( 5 mi) WNW of Mount Carmel, IL
62<br />
<strong>Jefferson</strong> <strong>County</strong> – Section 2<br />
TABLE TABLE J30B J30B RECENT RECENT EARTHQUAKE EVENTS 1.0 OR OR GREATER<br />
2.7 04/19/2008 3:05 38.474 -87.795 2.9 7 km ( 4 mi) NNW of Mount Carmel, IL<br />
4.6 04/18/2008 15:14 38.478 -87.869 10 11 km ( 7 mi) NNE of Bellmont, IL<br />
2.6 04/18/2008 11:55 38.465 -87.854 10 9 km ( 6 mi) NW of Mount Carmel, IL<br />
1.2 04/18/2008 11:25 38.45 -87.88 15.4 8 km ( 5 mi) NNE of Bellmont, IL<br />
1.5 04/18/2008 10:57 38.43 -87.92 17.3 5 km ( 3 mi) N of Bellmont, IL<br />
2.2 04/18/2008 10:46 38.44 -87.88 17.8 7 km ( 4 mi) NNE of Bellmont, IL<br />
1.6 04/18/2008 10:44 38.45 -87.85 15.9 8 km ( 5 mi) WNW of Mount Carmel, IL<br />
2.1 04/18/2008 10:37 38.48 -87.85 14.2 10 km ( 6 mi) NW of Mount Carmel, IL<br />
3.4 04/18/2008 10:36 38.46 -87.86 17.8 9 km ( 6 mi) NNE of Bellmont, IL<br />
2.5 04/18/2008 10:15 38.464 -87.846 10 9 km ( 5 mi) NW of Mount Carmel, IL<br />
1.9 04/18/2008 10:06 38.44 -87.88 19.2 7 km ( 4 mi) NNE of Bellmont, IL<br />
2.2 04/18/2008 10:04 38.45 -87.86 13.2 8 km ( 5 mi) NNE of Bellmont, IL<br />
2.6 04/18/2008 9:59 38.469 -87.795 10 6 km ( 4 mi) NNW of Mount Carmel, IL<br />
5.2 04/18/2008 9:37 38.45 -87.89 11.6 7 km ( 5 mi) NNE of Bellmont, IL<br />
TABLE TABLE J30C J30C J30C HISTORICAL HISTORICAL EARTHQUAKE EARTHQUAKE EVENTS<br />
EVENTS<br />
DATE DATE OF OF SEISMIC<br />
SEISMIC<br />
SEISMIC SEISMIC EVENT EVENT<br />
MAGNITUDE MAGNITUDE OF OF<br />
OF FREQUENCY<br />
FREQUENCY<br />
EVENT EVENT<br />
EVENT<br />
SEI SEISMIC SEI SMIC EVENT EVENT<br />
December 16, 1811 Earthquake occurred 195 miles south of<br />
EWG region<br />
8.0 -<br />
February 7, 1812 Earthquake occurred 165 miles south of<br />
EWG region<br />
8.2 1<br />
June 9, 1838 Earthquake occurred 60 miles south of<br />
EWG region*<br />
5.7 26<br />
January 4, 1843 Earthquake occurred 231 miles south of<br />
EWG region*<br />
6.0 7<br />
October 8, 1857 Earthquake occurred 51 miles south of<br />
EWG region*<br />
5.3 14<br />
October 31, 1895 Earthquake occurred 135 miles south of<br />
EWG region*<br />
6.2 38<br />
August 21, 1905 Earthquake occurred 138 miles south of<br />
EWG region*<br />
4.8 10<br />
April 9, 1917 Earthquake occurred 51 miles south of<br />
EWG region*<br />
5.0 12<br />
June 29, 1947 Earthquake occurred 33 miles south of<br />
EWG region*<br />
4.2 30<br />
April 9, 1955 Earthquake occurred 42 miles south of<br />
EWG region*<br />
4.5 8<br />
November 25, 1956 Earthquake occurred 120 miles south of<br />
EWG region*<br />
4.4 1<br />
October 20, 1965 Earthquake occurred 71 miles south of<br />
EWG region*<br />
4.8 9<br />
November 9, 1968 Earthquake occurred 100 miles south of<br />
EWG region*<br />
5.5 3<br />
September 20, 1978 Earthquake occurred 4.7 miles south of<br />
EWG region**<br />
3.1 10<br />
February 5, 1994 Earthquake occurred 101 miles south** 4.2 16<br />
January 15, 1998 Earthquake occurred 13 miles south of 2.4 4<br />
FREQUENCY 1
A Regional Overview All-Hazard Mitigation Plan 63<br />
TABLE TABLE TABLE J30C J30C HISTORICAL HISTORICAL EARTHQUAKE EARTHQUAKE EVENTS<br />
EVENTS<br />
DATE DATE OF OF SEISMIC<br />
SEISMIC<br />
SEISMIC SEISMIC EVENT EVENT<br />
MAGNITUDE MAGNITUDE OF OF<br />
OF FREQUENCY<br />
FREQUENCY<br />
EVENT EVENT<br />
EVENT<br />
EWG region**<br />
SEI SEISMIC SEI SMIC EVENT<br />
June 6, 2003 Earthquake occurred 10 miles southeast<br />
of Cairo, Ill; felt here<br />
4.0 5<br />
Source:* Earthquake History of the United States;<br />
** Cooperative New Madrid Seismic Network Earthquake Bulletin, St. Louis<br />
University (Compiled by M. Whittington, Earthquake Center, St. Louis<br />
University)<br />
*** USGS Earthquake Hazard Program<br />
1 Number of years between seismic events<br />
FREQUENCY 1<br />
TABLE TABLE J30D J30D LANDSLIDE, LANDSLIDE, SINKHOLE SINKHOLE AND AND UNDERGROUND UNDERGROUND MINE MINE SHAFT SHAFT EARTH<br />
EARTH<br />
MOVEMENTS MOVEMENTS IN IN ST. ST. LOUIS LOUIS METROPOLITAN METROPOLITAN REGION<br />
REGION<br />
LOCATION LOCATION<br />
TYPE INSPECTION INSPECTION DATE DATE<br />
Grubville Sinkhole collapse 08/08/1967<br />
<strong>Jefferson</strong> <strong>County</strong> Landslide 07/09/1968<br />
Fenton Landslide 06/14/1971<br />
High Ridge Sinkhole collapse 10/03/1974<br />
Franklin <strong>County</strong> Sinkhole collapse 05/06/1976<br />
St. Charles <strong>County</strong> Sinkhole collapse 06/29/1977<br />
St. Charles <strong>County</strong> Sinkhole collapse 12/14/1977<br />
House Springs Sinkhole collapse 04/06/1978<br />
Franklin <strong>County</strong> Sinkhole collapse 03/05/1982<br />
Imperial Landslide 05/19/1983<br />
Herculaneum Sinkhole collapse 11/23/1983<br />
Herculaneum Landslide 02/25/1985<br />
Green Jade Estates, <strong>Jefferson</strong> <strong>County</strong> Landslide 05/27/1990<br />
Imperial Landslide 06/12/1990<br />
Franklin <strong>County</strong> Sinkhole collapse 07/31/1990<br />
Mehville Sinkhole collapse 03/17/1991<br />
Hillsboro Underground mine shaft 03/27/1991<br />
Franklin <strong>County</strong> Sinkhole collapse 01/02/1992<br />
Franklin <strong>County</strong> Sinkhole collapse 03/23/1993<br />
Stanton Sinkhole collapse 02/08/1994<br />
Arnold Landslide 12/16/1994<br />
Sulfur Springs Landslide 04/18/1997<br />
Sullivan Sinkhole collapse 12/23/1997<br />
Imperial Landslide 07/14/1998<br />
House Springs Rock Collapse 12/19/2002<br />
<strong>Jefferson</strong> <strong>County</strong> Landslide N.A.<br />
Washington Underground mine shaft N.A.<br />
Source: Missouri Department of Natural Resources
64<br />
Frequency Frequency of of Occurrence<br />
Occurrence<br />
<strong>Jefferson</strong> <strong>County</strong> – Section 2<br />
Seismic scientists cannot predict the frequency of occurrence of earthquakes, although<br />
some have tried. Iben Browning predicted the onset of large-scale seismic events would<br />
take place on December 3, 1990 but did not. Since 1811, (182 years) there have been 16<br />
recorded earthquake events occurring in a random frequency as can be seen on Table J32<br />
above. While estimates of the recurrence intervals of the large 1811-1812 earthquakes are<br />
about 500-1000 years, smaller, but still destructive earthquakes are event more likely. The<br />
recurrence interval for a magnitude-6 earthquake is about 100 years. The last such<br />
earthquake was in 1895 near Charleston, Missouri.<br />
However, scientists estimate that there is a 9-in-10 chance of a magnitude 6 to 7 tremblor<br />
occurring in the NMSZ within the next 50 years. Because of differences in the geology east<br />
and west of the Rocky Mountains, the effects of a magnitude 7 quake in the mid-continent<br />
United States could be far worse than those of the 1989 magnitude 7 Loma Prieta,<br />
California, earthquake.<br />
In response to this threat, the USGS has been spearheading an effort to understand the<br />
causes of earthquakes in the Mississippi Valley. Initiated in the 1980's, this ongoing<br />
cooperative endeavor among universities, private agencies, state governments, and Federal<br />
agencies has two goals--to evaluate the level of the earthquake hazard and to help reduce<br />
the risk to lives and property from future quakes in the region. The USGS is currently<br />
working with the Missouri and Illinois geological surveys to study soil conditions in and<br />
around the St. Louis region. They are utilizing soil samples from borings taken from public<br />
construction projects such as highways, bridges and sewers.<br />
With respect to earth movements including landslides, sinkhole and mineshaft collapse,<br />
these incidents have occurred on a fairly frequent basis; over 27 reports were made to the<br />
Missouri Geological Survey over a period of 36 years.<br />
Intensity Intensity or or Strength<br />
Strength<br />
Recent research suggests that the New Madrid Fault Zone is capable of producing<br />
magnitude 8 earthquakes. Contemporary newspaper accounts of the 1811-1812<br />
Mississippi Valley earthquake sequence are used to construct a generalized isoseismal map<br />
of the first of three principal shocks of the sequence, that of December 16, 1811.<br />
Earthquakes can be measured by intensity or by magnitude. The Richter magnitude scale<br />
was developed in 1935 by Charles F. Richter of the California Institute of Technology as a<br />
mathematical device to compare the size of earthquakes. The magnitude of an earthquake<br />
is determined from the logarithm of the amplitude of waves recorded by seismographs.<br />
Adjustments are included for the variation in the distance between the various<br />
seismographs and the epicenter of the earthquakes. Because of the logarithmic basis of<br />
the scale, each whole number increase in magnitude represents a tenfold increase in<br />
measured amplitude; as an estimate of energy, each whole number step in the magnitude
A Regional Overview All-Hazard Mitigation Plan 65<br />
scale corresponds to the release of about 31 times more energy than the amount<br />
associated with the preceding whole number value. The Richter Scale is not used to<br />
express damage, it measures the size of an earthquake at its sources.<br />
Intensity scales, like the Modified Mercalli Scale measure the amount of shaking at a<br />
particular location. The Mercalli Scale is based on observable earthquake damage. The<br />
Richter scale is considered scientifically more objective and therefore more accurate. For<br />
example a level I-V on the Mercalli scale would represent a small amount of observable<br />
damage. At this level doors would rattle, dishes break and weak or poor plaster would<br />
crack. As the level rises toward the larger numbers, the amount of damage increases<br />
considerably. The higher number, 12, represents total damage. Refer to Figure J30.<br />
They do not depend on where the measurement was made. The intensity of earth<br />
movements including landslides, sinkhole and mineshaft collapse in the St. Louis<br />
Metropolitan area are not as intense and widespread as the landslides in the western<br />
portion of the U.S. Earth movements in the St. Louis Metropolitan area are usually<br />
localized.<br />
Lives Lives Lost, Lost, Injuries Injuries, Injuries , Property Property Damage, Damage, Economic Economic Losses/Other Losses/Other Losses<br />
Losses<br />
Another earthquake as powerful as the great quakes of 1811-12 may not occur for many<br />
years. Because of differences in the geology east and west of the Rocky Mountains, the<br />
effects of a magnitude 7 quake in the mid-continent United States could be far worse than<br />
those of the 1989 magnitude 7 Loma Prieta, California, earthquake. Property damage<br />
could range from minor cracks in structures to complete destruction. Infrastructure<br />
including roads, bridges, water and gas lines may rupture, resulting in an abrupt halt to<br />
electricity, heat/cooling source, communication, transportation, rescue and emergency<br />
response services. Ruptured gas lines and power lines could potentially cause explosions<br />
and fires. Cascading emergencies such as these will compound the initial disaster. Lives<br />
lost, injuries, property damage and economic losses could potentially be in the same range<br />
as the earthquake that struck San Francisco.<br />
Landslides constitute a major geologic hazard because they are widespread, occurring in all<br />
50 states, and cause $1-2 billion in damages and more than 25 fatalities on average each<br />
year. Landslides pose serious threats to highways and structures that support fisheries,<br />
tourism, timber harvesting, mining, and energy production as well as general<br />
transportation. Landslides commonly occur with other major disasters such as earthquakes<br />
and floods that exacerbate relief and reconstruction efforts and expanded development<br />
and other land use has increased the incidence of landslide disasters.<br />
If the New Madrid fault were to quake at a range of 6.7, such as the Northridge, CA in<br />
1994, it would cause nearly $70 to $90 billion in direct building losses. (According to<br />
Shannon Marquez, project manager with IEM). The entire infrastructure of communication
66<br />
<strong>Jefferson</strong> <strong>County</strong> – Section 2<br />
lines, electricity, bridges, and roads would be out of commission. According to Col. Mark<br />
McCaster the residents would be on their own for the first 72 to 96 hours following a<br />
major quake. According to Marquez, models have shown over 30,000 highway bridges<br />
and 86,000 miles of highways could be damaged profoundly disrupting transcontinental<br />
commerce. A 25% reduction in natural gases just “in the Chicago area alone could be<br />
disrupted” (Marquez). Refineries producing over 300,000 barrels of oil a day could also be<br />
affected. According to the Mid-America Earthquake Center at the University of Illinois at<br />
Urbana Champaign: more than 250,000 buildings would suffer severed damage, 260,000<br />
displaced, and over 60,000 casualties would result.<br />
Locations/Areas Locations/Areas Affected<br />
Affected<br />
Refer to Figure J29 below that depicts the Peak Acceleration (%g) with a 10 percent<br />
probability of exceedance within 50 years within the EWG planning region. As can be<br />
seen, <strong>Jefferson</strong> <strong>County</strong> lies in four peak acceleration zones running northeast to southwest<br />
ranging from a low of 7 in the northwestern corner to almost 15 %g of severity in the<br />
southeastern corner of the county. The term Acceleration is used because the building<br />
codes prescribe how much horizontal force a building should be able to withstand during<br />
and earthquake.<br />
Bridge Bridge Integrity/Mitigation Integrity/Mitigation Efforts<br />
Efforts<br />
An earthquake of 6.7 could affect between 230 to 700 counties in eight states.<br />
Retrofitting of bridges and buildings are one way to decrease the potential economic,<br />
socio, and lives lost. Located below is a list of bridges in <strong>Jefferson</strong> <strong>County</strong> rated by their<br />
structural integrity. According to Patrick Martens of the Missouri Department of<br />
Transportation there is currently no program to address seismic upgrades with the<br />
exception of the Popular street approach double-decker complex. “There is just no money<br />
for that type of program, and the expenses are too great to address this. It almost<br />
becomes cheaper to replace the bridge then to try and retrofit them” (Martens). MODOT<br />
assesses seismic needs in replacing bridges and in major rehab projects.<br />
TABLE TABLE J31 J31 J31 JEFFERSON<br />
JEFFERSON<br />
COUNTY COUNTY BRIDGES<br />
BRIDGES<br />
<strong>Jefferson</strong> <strong>Jefferson</strong> <strong>County</strong><br />
<strong>County</strong><br />
Bridge Bridge<br />
Status Status<br />
Latitude Latitude Longitude<br />
Longitude<br />
RT M Not Deficient 38.37167 -90.501667<br />
ANTIRE CR Structurally Deficient 38.48 -90.565<br />
TRIB OF SALINE CR Structurally Deficient 38.46 -90.451667<br />
SUGAR CR Structurally Deficient 38.46833 -90.426667<br />
TRIB MERAMEC RVR Structurally Deficient 38.44667 -90.411667<br />
SUGAR CR Structurally Deficient 38.48 -90.43<br />
TRIB MERAMEC RVR Structurally Deficient 38.455 -90.465<br />
UP RR Structurally Deficient 38.21833 -90.375<br />
TRIB OF PLATTIN CR Structurally Deficient 38.21667 -90.401667
A Regional Overview All-Hazard Mitigation Plan 67<br />
TABLE TABLE J31 J31 JEFFERSON JEFFERSON<br />
JEFFERSON<br />
COUNTY COUNTY BRIDGES BRIDGES<br />
BRIDGES<br />
<strong>Jefferson</strong> <strong>Jefferson</strong> <strong>County</strong><br />
<strong>County</strong><br />
Bridge Bridge<br />
Status Status<br />
Latitude Latitude Longitude<br />
Longitude<br />
JOACHIM CR Structurally Deficient 38.13333 -90.553333<br />
TRIB OF JOACHIM CR Structurally Deficient 38.13167 -90.551667<br />
TANYARD BR Structurally Deficient 38.12667 -90.558333<br />
JOACHIM CR Structurally Deficient 38.13833 -90.556667<br />
TRIB OF GLAIZE CR Structurally Deficient 38.35 -90.478333<br />
TRIB OF GLAIZE CR Structurally Deficient 38.33 -90.45<br />
HEADS CR Structurally Deficient 38.40333 -90.57<br />
TRIB OF BELEWS CR Structurally Deficient 38.335 -90.57<br />
TRIB OF BELEWS CR Structurally Deficient 38.32333 -90.571667<br />
TRIB OF BIG RVR Structurally Deficient 38.38333 -90.583333<br />
JOACHIM CR Structurally Deficient 38.26333 -90.385<br />
GLAIZE CR Structurally Deficient 38.36167 -90.466667<br />
TRIB OF SANDY CR Structurally Deficient 38.26167 -90.483333<br />
JOACHIM CR Structurally Deficient 38.05667 -90.515<br />
LITTLE CR Structurally Deficient 38.22667 -90.5<br />
LITTLE CR Structurally Deficient 38.23 -90.485<br />
TRIB OF COTTER CR Structurally Deficient 38.185 -90.576667<br />
TRIB OF COTTER CR Structurally Deficient 38.19 -90.58<br />
DRY CR Structurally Deficient 38.18667 -90.663333<br />
TRIB OF BIG RVR Structurally Deficient 38.12833 -90.693333<br />
TRIB OF BIG RVR Structurally Deficient 38.12333 -90.67<br />
TRIB OF BIG RVR Structurally Deficient 38.085 -90.621667<br />
FLUCOM BR Structurally Deficient 38.1 -90.443333<br />
TRIB OF FLUCOM BR Structurally Deficient 38.09167 -90.421667<br />
TRIB OF PLATTIN CR Structurally Deficient 38.09 -90.426667<br />
TRIB OF FLUCOM BR Structurally Deficient 38.115 -90.441667<br />
DRY CR Structurally Deficient 38.22333 -90.681667<br />
ROCKY BR Structurally Deficient 38.07 -90.418333<br />
PLATTIN CR Structurally Deficient 38.07 -90.416667<br />
CST SUNSHINE DR, BNSF RR Structurally Deficient 38.22667 -90.406667<br />
KOCHS CR Structurally Deficient 38.31667 -90.398333<br />
JOACHIM CR Structurally Deficient 38.265 -90.388333<br />
SANDY CR Structurally Deficient 38.29667 -90.528333<br />
DUTCH CR Structurally Deficient 38.35833 -90.673333<br />
ROCK CR Structurally Deficient 38.37333 -90.386667<br />
MAUPIN CR Structurally Deficient 38.24333 -90.756667<br />
DITCH CR Structurally Deficient 38.22 -90.756667<br />
MUDDY CR Structurally Deficient 38.14167 -90.305
68<br />
FIGURE FIGURE J29 J29 PEAK PEAK ACCELERATION<br />
ACCELERATION<br />
Source: United States Geological Survey<br />
<strong>Jefferson</strong> <strong>County</strong> – Section 2<br />
Franklin <strong>County</strong> lies in five peak acceleration zones running northeast to southwest ranging<br />
from a high of almost 9 in the southeastern corner to a low of 4%g of severity in the<br />
northwestern corner. St. Charles <strong>County</strong> lies within four peak acceleration zones running<br />
northeast to southwest ranging from a high of 8 in the easternmost portion of the county<br />
to a low of about 5%g severity in the northwestern corner of the county. St. Louis <strong>County</strong><br />
lies in four peak acceleration zones running northeast to southwest ranging from a high of<br />
15 in the southeastern portion to a low of about 7%g severity in the northern and western<br />
portions of the county. The City St. Louis lies in two peak acceleration zones ranging<br />
between 26-28%g severity.
A Regional Overview All-Hazard Mitigation Plan 69<br />
FIGURE FIGURE J30 J30 MODIFIED MODIFIED MERCALLI MERCALLI SCALE<br />
SCALE
70<br />
Seasonal Seasonal Pattern<br />
Pattern<br />
<strong>Jefferson</strong> <strong>County</strong> – Section 2<br />
There is no data that supports the relationship between the occurrence of earthquakes and<br />
seasonal weather patterns.<br />
There is data that supports the relationship between the occurrence of landslides, sinkhole<br />
and mineshaft collapse and seasonal weather patterns. Rainfall events would introduce<br />
moisture into the earth and geologic strata, thus creating the potential for earth<br />
movement.<br />
Speed Speed of of Onset Onset And/Or And/Or Existing Existing Warning Warning Systems<br />
Systems<br />
Earthquake prediction is a future possibility. Just as the Weather Bureau now predicts<br />
hurricanes, tornadoes, and other severe storms, the National Earthquake Information<br />
Center (NEIC) may one day issue forecasts on earthquakes. Earthquake research was<br />
stepped up after the Alaska shock in 1964. Today, the U.S. Geological Survey (USGS) and<br />
other federal and state agencies, as well as universities and private institutions are<br />
conducting research. Earthquake prediction may some day become a reality, but only after<br />
much more is learned about earthquake mechanisms. The speed of onset is immediate.<br />
See Table J32 below. An earthquake can can occur occur at at anytime anytime with with most most most not not receiving receiving receiving emergency<br />
emergency<br />
care care care for for the the first first 72 72 to to 96 96 hours. hours.<br />
hours.<br />
TABLE TABLE J32 J32 FREQUENCY FREQUENCY OF OF OCCURRENCES OCCURRENCES OF OF EARTHQUAKES<br />
EARTHQUAKES<br />
DESCRIPTOR DESCRIPTOR<br />
MAGNITUDE ANNUAL AVERAGE<br />
Great 8 and higher 1 ¹<br />
Major 7 - 7.9 17 ²<br />
Strong 6 - 6.9 134 ²<br />
Moderate 5 - 5.9 1319 ²<br />
Light (estimated) 4 - 4.9 13,000<br />
Minor (estimated) 3 - 3.9 130,000<br />
Very Minor (estimated) 2 - 2.9 1,300,000<br />
¹ Based on observations since 1900.<br />
² Based on observations since 1990.<br />
The USGS estimates that several million earthquakes occur in the world each year.<br />
Many go undetected because they hit remote areas or have very small magnitudes.<br />
The NEIC now locates about 50 earthquakes each day, or about 20,000 a year.<br />
Map Map of of Hazards<br />
Hazards<br />
Figure J31 below shows earthquakes that have occurred in the proximity of the St. Louis<br />
Metropolitan area. Also please refer to Figure J26 (located in the back of the Technical<br />
Appendix) that depicts areas that are susceptible to earthquakes. Areas outside of the soil<br />
liquefaction zone will most likely be impacted from an earthquake, but probably to a lesser<br />
degree. The figure also shows areas in the St. Louis region that would be predisposed to
A Regional Overview All-Hazard Mitigation Plan 71<br />
earth movements including landslides, sinkhole and mine shaft collapse. A map showing<br />
sinkholes and areas of Karst topography in the St. Louis region can be found in Volume 2.<br />
Statement Statement Statement of of Probable Probable Future Future Severity<br />
FIGURE FIGURE J31 J31 J31 EARTHQUAKES IN MISSOURI<br />
Source: United States Geological Surve<br />
The magnitudes of the historic earthquakes listed above in the New Madrid Fault Zone<br />
range from 2.4 to 8.2. These most recent earthquakes did not affect <strong>Jefferson</strong> <strong>County</strong>.<br />
The United States Geological Survey and the Center for Earthquake Research and<br />
Information at the University of Memphis (CERI) have issued a new forecast. The estimated<br />
probability of a magnitude 6.0 or greater earthquake is 25-40% through the year 2053.<br />
The January estimates show a 7-10% chance of magnitudes between 7.5 and 8.0 in a 50year<br />
period through 2053. The probability of an earthquake event is rated as moderate<br />
and the severity is rated as high.<br />
MODIFIED MODIFIED MODIFIED MERCALLI MERCALLI INTENSITY INTENSITY SCALE<br />
SCALE<br />
MMI MMI VALUE VALUE FULL FULL DESCRIPTION<br />
I People do not feel any earth movement<br />
II Felt by persons at rest, on upper floors of tall buildings<br />
III Felt by people indoors. Hanging objects swing back and forth.<br />
Vibration from the earthquake may seem like the passing of light<br />
trucks. May not be recognized as an earthquake.<br />
IV Hanging objects swing. Vibration may seem like he passing of heavy<br />
trucks or a jolt, like heavy ball striking the walls. Parked vehicles may
72<br />
<strong>Jefferson</strong> <strong>County</strong> – Section 2<br />
rock noticeably. Windows, dishes, doors may rattle and glasses clink.<br />
In the upper range of IV, walls of wood frame buildings may creak.<br />
V Almost everyone feels movement whether inside or outdoors.<br />
Sleeping people are awakened. Liquids in containers are disturbed;<br />
some are spilled. Small unstable objects are displaced or overturned.<br />
Doors swing, close or open. Shutters, pictures on the wall move.<br />
VI Felt by all; some are frightened and take cover. People have difficulty<br />
walking due to motion. Objects fall from shelves and dishes,<br />
glassware and ceramics may be broken. Pictures fall off walls.<br />
Furniture moves or is overturned. Weak plaster and masonry cracked.<br />
Damage slight in poorly constructed buildings. Trees, bushes shaken<br />
visibly or are heard rustling.<br />
VII People have difficulty standing. Drivers on the road feel their cars<br />
shaking. Furniture may be overturned and broken. Loose bricks fall<br />
from buildings a masonry walls and cracks in plaster and masonry<br />
may appear. Weak chimneys may break at the roofline. Damage is<br />
slight to moderate in well-built structures; considerable in poorly<br />
constructed buildings and facilities.<br />
VIII Drivers have trouble steering. Tall structures such as towers,<br />
monuments may twist and fall. Wood frame houses that are not<br />
bolted to their foundations may shift and sustain serious damage.<br />
Damage is slight to moderate in well-constructed buildings,<br />
considerable in poorly constructed buildings. Branches are broken<br />
and fall from trees. Changes occur in flow or temperature of springs<br />
and wells. Cracks appear in wet ground and steep slopes.<br />
IX Masonry structures and poorly constructed buildings suffer serious<br />
damage or collapse. Frame structures, if not bolted, shift off<br />
foundations. Serious damage to reservoirs. Underground pipes<br />
broken. Conspicuous cracks in the ground. In alluvial areas, sand and<br />
mud ejected and sand craters are formed.<br />
X Some well built wooden structures destroyed; most masonry and<br />
frame structures destroyed with foundations.<br />
XI Few, if any masonry structures remaining standing. Bridges<br />
destroyed. Rails bent greatly. Serious damage to dams, dikes and<br />
embankments. Large landslides occur. Water thrown on the banks of<br />
canals, rivers and lakes<br />
XII Damage total. Line of sight and level are distorted. Objects thrown<br />
in air.<br />
According to the SEMA map above, <strong>Jefferson</strong> <strong>County</strong> is at a risk for a Level VII impact on<br />
the Modified Mercalli Intensity Scale from a 7.6 earthquake. Secondary effects of such an<br />
earthquake could include fire, building collapse, utility disruption, flooding, hazardous<br />
materials release, environmental impacts and economic disruptions and losses. Based on<br />
the projected Earthquake Intensities map and the Modified Mercalli damage scale, the<br />
future probably severity for each level is shown below.
A Regional Overview All-Hazard Mitigation Plan 73<br />
Modified Mercalli Levels I-V Negligible<br />
Modified Mercalli Levels VI Limited<br />
Modified Mercalli Levels VII Critical<br />
Modified Mercalli Levels VII-XIII Catastrophic<br />
Landslides have been categorized by the USGS based on incidence and susceptibility. After<br />
discussions with Missouri Geological Survey, there are have been no categories developed<br />
for landslide, sinkhole and underground mine collapse.<br />
Statement Statement of of Probable Probable Risk/Likeliness Risk/Likeliness of of Future Future Occurrence<br />
Occurrence<br />
<strong>Jefferson</strong> <strong>County</strong>, as well as other counties in the <strong>East</strong>-<strong>West</strong> <strong>Gateway</strong> <strong>Council</strong> of<br />
Governments planning region and the Midwest, is located in proximity to the New Madrid<br />
Fault Zone. The other fault zones mentioned above including the Wabash and faults in the<br />
vicinity of Farmington are also known to produce earthquakes in recent history, with a<br />
lesser magnitude and intensity. Instruments were installed in and around this area in 1974<br />
to closely monitor seismic activity. Since then, more than 4000 earthquakes have been<br />
located, most of which are too small to be felt. On average one earthquake per year will<br />
be large enough to be felt in the area.<br />
The magnitudes of the historic earthquakes listed above in the New Madrid Fault Zone<br />
range from 2.4 to 8.2. Based on the history of the New Madrid Fault Zone, the estimated<br />
probability of a magnitude 6.0 or greater earthquake is 25-40 percent through the year<br />
2053. The January estimates show a 7-10 percent chance of magnitudes between 7.5 and<br />
8.0 in a 50-year period through 2053.<br />
Recommendation<br />
Recommendation<br />
The State of Missouri had its first earthquake exercise in 10 years last year. Allen Lehmen<br />
of the State Emergency Management Agency stated the state is “enormously prepared.”<br />
Though he does state “he does not know if we’re ever ready for anything.” A disaster of<br />
this nature needs to be addressed on a National, State, and Local level for local<br />
governments to understand “state assets are available to them.” Though most in the<br />
region such as U.S. Republican Jo Ann Emerson R-Cape Girardeau blame Congress for<br />
being slow in earmarking monies to address the potential of a major disaster.<br />
Emergency preparedness is key in all-major disasters. The retrofitting of buildings and<br />
transportation routes is a necessity but in the large part not economical. The National,<br />
State, and Local governments must work together to create a annual plan on how the area<br />
would respond to a major earthquake.<br />
Probable Probable Risk Risk Risk of of Modified Modified Modified Mercalli Mercalli Mercalli Levels<br />
Levels<br />
I-V Highly Likely
74<br />
VI Highly Likely<br />
VII Highly Likely<br />
VIII-XIII Likely<br />
<strong>Jefferson</strong> <strong>County</strong> – Section 2<br />
Landslides have been categorized by the USGS based on incidence and susceptibility.<br />
These categories are found below. The probable risk of future occurrence in the St. Louis<br />
metropolitan area would be ranked as low, less than 1.5% of the area involved, with a<br />
moderate susceptibility and low incidence.<br />
Landslide Landslide Incidence<br />
Incidence<br />
Low- less than 1.5% of area involved<br />
Moderate- 1.5% to 15% of area involved<br />
High- Greater than 15% of area involved<br />
Landslide Landslide Susceptibility/Incidence<br />
Susceptibility/Incidence<br />
Moderate susceptibility/low incidence<br />
High susceptibility/low incidence<br />
High susceptibility/moderate incidence<br />
In the USGS Map, Figure J25, susceptibility is not indicated with the same or lower<br />
incidence. Susceptibility to landsliding was defined as the probable degree of response or<br />
the rocks and soils to natural or artificial cutting or loading of slopes, or to anomalously<br />
high precipitation. High, moderate, and low susceptibility are delimited by the same<br />
percentages used in classifying the incidence of landsliding. Some generalization was<br />
necessary at the map scale and several small areas of high incidence and susceptibility were<br />
slightly exaggerated.<br />
Statement Statement of of Next Next Disaster’s Disaster’s Likely Likely Adverse Adverse Impact Impact on on Community<br />
Community<br />
The next disaster’s likely adverse impact on <strong>Jefferson</strong> <strong>County</strong> could be critical in terms of<br />
amount of damage to infrastructure (utilities, communications) buildings, deaths and other<br />
cascading disasters including fire and explosions from natural gas and oil pipeline ruptures.<br />
At the time of the New Madrid earthquake in 1811-1812, St. Louis and other major cities<br />
in the central U.S. were sparsely settled and there were few man-made structures. Today,<br />
this region is home to millions of people, including the populations of large cities, such as<br />
St. Louis, Missouri, and Memphis, Tennessee. A repeat today of the earthquakes of 1811-<br />
12 would cause widespread loss of life and billions of dollars in property damage. The<br />
potential for the recurrence of such earthquakes and their impact today on densely<br />
populated cities in and around the seismic zone has generated much research devoted to<br />
understanding earthquakes. By closely monitoring the earthquake activity, scientists can<br />
hope to understand their causes, recurrence rates, ground motion and disaster mitigation.
A Regional Overview All-Hazard Mitigation Plan 75<br />
Earthquakes pose a serious threat to many Missouri communities. Local governments,<br />
planners, and engineers must consider the threat as they seek to balance development and<br />
risk. Identifying locations susceptible to seismic activity generated by nearby faults,<br />
adopting strong policies and implementing measures and using other mitigation<br />
techniques are essential to reducing risk from seismic hazards in the <strong>East</strong>-<strong>West</strong> <strong>Gateway</strong><br />
<strong>Coordinating</strong> <strong>Council</strong> planning region.<br />
Based on the January 2003 estimates, <strong>Jefferson</strong> <strong>County</strong> is at most risk for Modified Mercalli<br />
Level VII (7.6 level) as likely adverse impacts. However, due to the geologic setting in<br />
<strong>Jefferson</strong> <strong>County</strong> in terms of alluvial soils along the Missouri River, Level VIII should be used<br />
for planning purposes. The possible effects at Level VIII are shown below.<br />
Without Without Without Mitigation Mitigation Mitigation Measures Measures<br />
Measures<br />
Life Critical<br />
Property Critical<br />
Emotional Critical<br />
Financial Critical<br />
Comments <strong>Jefferson</strong> <strong>County</strong> is considered a high-risk area for damages from an<br />
earthquake as a result of the population density, condition of existing buildings and<br />
infrastructure and the geologic setting.<br />
With With Mitigation Mitigation Measures<br />
Measures<br />
Life Limited<br />
Property Limited<br />
Emotional Critical<br />
Financial Limited<br />
Comments With mitigation measures in place, this will assist with current and future<br />
construction. Older masonry buildings will still be at risk.<br />
Landslide, Landslide, Landslide, Sinkhole Sinkhole and and Underground Underground Mine Mine Collap Collapse Collap se Mitigation Mitigation Measures<br />
Measures<br />
The next disaster’s likely adverse impact on <strong>Jefferson</strong> <strong>County</strong> could be limited to negligible<br />
in terms of amount of damage to infrastructure (utilities, communications) buildings,<br />
deaths and other cascading disasters including fire and explosions from natural gas and oil<br />
pipeline ruptures. These types of hazards occur on a much smaller scale than do<br />
earthquakes. The affected area may include one or two homes in a subdivision that have<br />
been constructed on a failing hillside, or on the side of a sinkhole or mine tunnel. Clearly,<br />
there are mitigation measures that can be taken to reduce or eliminate the risk of future<br />
impact of the destruction of homes and structures located in areas that are predisposed to<br />
these types of hazards.<br />
Wit Without Wit hout Mitigation Mitigation Measures<br />
Measures<br />
Life Limited<br />
Property Limited<br />
Emotional Limited
76<br />
Financial Limited<br />
Comments none<br />
With With Mitigation Mitigation Mitigation Measures<br />
Measures<br />
Life Negligible<br />
Property Negligible<br />
Emotional Negligible<br />
Financial Negligible<br />
Comments none<br />
Recommendation<br />
Recommendation<br />
<strong>Jefferson</strong> <strong>County</strong> – Section 2<br />
Increased education, concern and subsequent action can reduce the potential effects of<br />
earthquakes can be done in conjunction with preparations for other hazards. A program<br />
that recognizes the risk of flooding, landslides and other dangers that incorporate<br />
earthquake issues will be of most benefit to citizens. Individuals and government have<br />
roles in reducing earthquake hazards. Individuals can reduce their own vulnerability by<br />
taking actions in their own households. Local government can take action to lower the<br />
threat through the proper use of poor sites, assuring that vital or important structures<br />
(police, fire, school buildings) resist hazards and developing infrastructures in a way that<br />
decreases risk. State agencies and legislature can assist the other levels of action and<br />
provide incentives for minimizing hazards.<br />
Communities and developers coordinate with NRCS, Division of Geology and Resource<br />
Assessment regarding appropriate sitings of subdivisions and other structures.<br />
Tornado/Severe Tornado/Severe Thundersto Thunderstorm Thundersto Thunderstorm<br />
rm Hazard Profile<br />
Background<br />
Background<br />
When severe storms hit a community, they leave behind a distinctive trail. Toppled trees,<br />
damaged buildings and cars, downed power lines crossing roadways and widespread<br />
power outages are signs that a storm has struck. After such events, it can take<br />
communities weeks to return to normal. These storms result in costly structural damages,<br />
personal injury, property damage and death.<br />
Tornado intensity is determined by using the F-Scale (Fujita 1981), as listed in Storm Data.<br />
This study follows the accepted nomenclature that F2 and F3 tornadoes are strong and F4<br />
are violent. Ostby (1993) found that the occurrence of weak tornadoes (F0-F1) has shown<br />
a dramatic increase since 1980, while the number of strong and violent tornadoes have<br />
either remained steady or decreased. Reasons for this include improved verification efforts<br />
by local NWS offices and the marked increase in storm chasing. Since strong and<br />
violent tornadoes produce a more stable long-term data set, these categories were the<br />
main focus of this study.
A Regional Overview All-Hazard Mitigation Plan 77<br />
Description Description of of Hazard<br />
Hazard<br />
A tornado is a vortex of rapidly rotating air that extends from a thunderstorm to the<br />
ground. Supercell thunderstorms are often the producers of violent tornadoes. These<br />
thunderstorms can also produce other dangerous weather conditions such as large hail<br />
severe wind, lightning and flash floods. To be a tornado, the swirling winds must be at the<br />
surface, capable of doing damage. If there is debris (dust and other objects swirling in the<br />
winds), it is definitely a tornado, even if there is no visible funnel cloud. A tornado can<br />
move over a surface with few objects to be picked up and swirled about it. All funnel<br />
clouds should be treated as if they are potential tornadoes. See Figure J32 below.<br />
FIGURE FIGURE J32 J32 J32 VIEW VIEW OF OF TORNADIC TORNADIC THUNDERSTORM<br />
THUNDERSTORM<br />
Source: NOAA
78<br />
<strong>Jefferson</strong> <strong>County</strong> – Section 2<br />
When storms influence a large area, the chances for significant hazards increase. The<br />
majority of windstorms in a convective system are of marginal severity, with only isolated<br />
events reaching high intensity. The most threatening situation would be for a very intense<br />
convective wind event that also affected a large area. It appears that a few times each year<br />
in North America, extreme convective wind events of this sort do occur. To date, no such<br />
storm has struck a major city during a vulnerable time (e.g., the morning or evening rush<br />
hours). When such storms are accompanied by large hail (e.g., > 5 cm in diameter), the<br />
damage potential soars to even greater heights than when the wind occurs alone. The<br />
occurrence of hail has resulted in some of the costliest storms in United States history;<br />
joining a fall of large hail with winds approaching 50 m s -1 could produce incredible<br />
damage in a populated area. Economic losses to agriculture from such storms are already<br />
high, but do not attract much public attention, and such losses would be very difficult to<br />
mitigate with a 20-30 min warning. Nevertheless, major property losses can result when<br />
such storms cover a large area.<br />
A timely forecast may not be able to do much to mitigate the property loss, but could<br />
reduce the casualties. It appears possible to forecast these extreme events with some skill,<br />
but further research needs to be done to test the existing hypothesis about the interaction<br />
between the convective storm and its environment that produces the extensive swath of<br />
high winds.<br />
Convective winds do considerable damage and occasionally generate many casualties.<br />
Most convection produces some straight-line wind as a result of outflow generated by the<br />
convective downdraft. On rare occasions, the intensity of the wind achieves the potential<br />
for doing damage. Whether or not damage actually occurs is the dependent on whether<br />
structures are in the path of the wind that can sustain damage. Although engineered<br />
structures typically are quite resistant to wind damage, many homes and outbuildings are<br />
quite vulnerable to damage from even relatively modest windstorms. In the United States,<br />
it is assumed that the potential for wind damage begins at around 56 miles per hour.<br />
Wind damage is graded according to its character: e.g., damage to tree limbs is considered<br />
non-severe, but uprooted trees are considered to represent a severe event. Refer to Figures<br />
J33, J34, and J35 below.<br />
Various human activities place people at risk from convective winds, notably aircraft<br />
operations and recreation. Most casualties from convective windstorms in the United<br />
States arise from such situations. Given the high vulnerability of aircraft operations during<br />
takeoff and landing procedures (the aircraft are operating on the margins of their flight<br />
"envelope" during such times); it does not take a particularly intense event from a<br />
meteorological standpoint to create many casualties. Commercial aircraft are less<br />
vulnerable than private aircraft, but their high occupancy means that rare events can have<br />
a large impact on casualty figures. Recreational boating also can account for many<br />
casualties in relatively modest windstorms, whereas most commercial craft are unlikely to<br />
be affected by marginal convective wind events.
A Regional Overview All-Hazard Mitigation Plan 79<br />
SEVERE SEVERE THUNDERSTORMS<br />
THUNDERSTORMS<br />
Characteristics<br />
Characteristics<br />
FIGURE FIGURE J33 J33 FIGURE FIGURE J34<br />
J34<br />
Source: NOAA Source: NOAA<br />
Hail Flooding<br />
FIGURE FIGURE J35 J35<br />
J35<br />
Source: NOAA<br />
Lightening<br />
Severe windstorms range in type from downdrafts to tornadoes. The most frequent<br />
surface winds in Missouri originate from the west and southwest. These winds are<br />
associated with storms moving into the region from Kansas and Oklahoma. Tornadoes<br />
range in size and severity. The dimensions of the storm can be measured by the size of the<br />
damage path. The typical tornado damage path is about one or two miles, with a width of<br />
about 50 yards. The largest tornado path widths can exceed one mile, and the smallest<br />
widths can be less than 10 yards. Widths can vary considerably during a single tornado,<br />
because the size of the tornado can change considerably during its lifetime. Path lengths<br />
can vary from what is basically a single point to more than 100 miles. Tornado intensity<br />
(the peak wind speeds) is not necessarily related to the tornado size. Detailed statistics<br />
about the time a tornado is on the ground are not available. This time can range from an<br />
instant to several hours. Five minutes on the ground or so is typical. Detailed statistics
80<br />
<strong>Jefferson</strong> <strong>County</strong> – Section 2<br />
about forward speed of tornadoes are not available. Movement can range from virtually<br />
stationary to more than 60 miles per hour, typical storms move at roughly 10-20 miles per<br />
hour.<br />
Likely Likely Locations ocations<br />
Whenever and wherever conditions are right, tornadoes are possible, but they are most<br />
common in the central plains of North America, east of the Rocky Mountains and west of<br />
the Appalachian Mountains. Refer to Figure J36 for a map of the U.S. that identifies the<br />
wind speeds in various regions; the study area has a high likelihood of severe winds.<br />
Statistically, <strong>Jefferson</strong> <strong>County</strong> has had 23 tornadoes. St. Charles <strong>County</strong> with 35 tornadoes<br />
has had the most tornado outbreaks, with St. Louis <strong>County</strong> second with 28. St. Louis City<br />
has the least with nine. However, these statistics do not necessarily predict future likely<br />
locations of tornadoes since St. Louis and St. Charles Counties cover larger areas of land.<br />
FIGURE FIGURE J36 J36 WIND WIND ZONES<br />
ZONES<br />
Source: FEMA
A Regional Overview All-Hazard Mitigation Plan 81<br />
Type Type Type of of Damage amage<br />
The damage from tornadoes comes from the strong winds they contain. It is generally<br />
believed that tornadic wind speeds can be as high as 300 mph in the most violent<br />
tornadoes. Wind speeds that high can cause automobiles to become airborne, rip ordinary<br />
homes to shreds, and turn broken glass and other debris into lethal missiles. The biggest<br />
threat to living creatures (including humans) from tornadoes is from flying debris and from<br />
being tossed about in the wind. It was once thought that the low pressure in a tornado<br />
contributed to the damage by making buildings "explode" but this is no longer believed to<br />
be true. Tornadoes are classified according to the F-Scale developed by Theodore Fujita.<br />
The F-scale ranks tornadoes according to wind speed, and the severity of damage caused<br />
within the wind speed ranges. Table J33 below shows the Fujita Tornado Measurement<br />
Scale.<br />
TABLE TABLE TABLE J33 J33 J33 FUJITA FUJITA FUJITA TORNADO TORNADO MEASUSREMENT MEASUSREMENT SCALE SCALE<br />
SCALE<br />
Category F0 Gale Tornado (40-70 mph) Light damage. Some damage to chimneys;<br />
break branches off trees; push over shallow<br />
Category F1 Moderate tornado (73-112<br />
mph)<br />
Category F2 Significant tornado (113-157<br />
mph)<br />
rooted trees; damage to sign boards<br />
Moderate damage. The lower limit is the<br />
beginning of hurricane wind speed; peel<br />
surface off roofs; mobile homes pushed off<br />
foundations or overturned; moving autos<br />
pushed off roads<br />
Considerable damage. Roofs torn off frame<br />
houses; mobile homes demolished; boxcars<br />
pushed over; large trees snapped or<br />
uprooted; light-object missiles generated.<br />
Category F3 Severe tornado (158-206 mph) Severe damage. Roofs and some walls torn<br />
off well-constructed houses; trains<br />
overturned; most trees in forest uprooted;<br />
cars lifted off ground and thrown.<br />
Category F4 Devastating tornado (207-260<br />
mph)<br />
Category F5 Incredible tornado (261-318<br />
mph)<br />
Devastating damage. Well- constructed<br />
houses leveled; structure with weak<br />
foundation blown off some distance; cars<br />
thrown and large missiles generated.<br />
Incredible damage. Strong frame houses<br />
lifted off foundations and carried<br />
considerable distance to disintegrate;<br />
automobile-sized missiles fly through the air<br />
in excess of 100 yards; trees debarked;<br />
incredible phenomena will occur.<br />
Figures J37 through J41 below depict the Fujita Scale as described in Table J35 above.
82<br />
Hazard Hazard Hazard Event Event History<br />
History<br />
<strong>Jefferson</strong> <strong>County</strong> – Section 2<br />
FIGURE J37 FIGURE FIGURE J38 J38<br />
J38<br />
F1 F2<br />
FIGURE FIGURE J39 J39 FIGURE FIGURE J40<br />
J40<br />
F3 F4<br />
FIGURE FIGURE J41<br />
J41<br />
F5<br />
The May 27 th , 1896 tornado categorized as an F-4 that hit St. Louis was third on the list of<br />
10 top weather events of the century. This storm killed 255 people and injured 1,000. The<br />
estimated damage from these storms totals $1.365 million dollars. Missouri is considered<br />
to be in the top ten lists for total number of tornadoes and number of killer tornadoes<br />
(ranking number seven).
A Regional Overview All-Hazard Mitigation Plan 83<br />
Since 1950,according to the NCDC, <strong>Jefferson</strong> <strong>County</strong> has had 23 tornadoes, three of which<br />
have resulted in 48 injuries and five deaths. The estimated damage from these storms cost<br />
approximately $9.7 million dollars. The most recent tornado in May 2003 in <strong>Jefferson</strong><br />
<strong>County</strong> resulted in one death and approximately $1million dollars in damage. The<br />
tornadoes occurred between April and December. <strong>Jefferson</strong> <strong>County</strong> has had one F3<br />
tornado in 1981. Tornado occurrences are found in Table J34.<br />
Location Location or<br />
or<br />
<strong>County</strong><br />
<strong>County</strong><br />
TABL TABLE TABL E J34 TORNADO EVENTS IN IN JEFFERSON COUNTY<br />
FROM FROM 1954 1954 TO TO 2001<br />
2001<br />
Date Date Time Time Type Type Mag Mag<br />
1 Dth 2 Inj 3 PrD 4 CrD<br />
1 JEFFERSON 05/06/1961 1615 Tornado F1 0 0 25K 0<br />
2 JEFFERSON 05/07/1961 1615 Tornado F1 0 0 3K 0<br />
3 JEFFERSON 09/04/1965 1930 Tornado F1 0 0 3K 0<br />
4 JEFFERSON 05/28/1967 1650 Tornado F2 0 0 25K 0<br />
5 JEFFERSON 06/10/1967 1700 Tornado F2 0 0 25K 0<br />
6 JEFFERSON 10/24/1967 1055 Tornado F1 0 0 25K 0<br />
7 JEFFERSON 04/03/1968 1800 Tornado F1 0 0 25K 0<br />
8 JEFFERSON 05/15/1968 1940 Tornado F1 0 0 25K 0<br />
9 JEFFERSON 06/04/1973 2100 Tornado F1 0 0 0K 0<br />
10<br />
JEFFERSON<br />
07/27/1976 1330 Tornado F1 0 0 0K 0<br />
11<br />
JEFFERSON<br />
05/12/1978 1700 Tornado F 0 0 250K 0<br />
12<br />
JEFFERSON<br />
04/22/1981 1754 Tornado F3 1 0 2.5M 0<br />
13<br />
JEFFERSON<br />
07/20/1981 1448 Tornado F1 0 0 3K 0<br />
14<br />
JEFFERSON<br />
12/02/1982 12:00 AM Tornado F1 0 0 250K 0<br />
15<br />
JEFFERSON<br />
11/09/1984 12:00 AM Tornado F0 0 0 0K 0<br />
16 Cedar Hill<br />
To<br />
04/15/1994 12:00 AM Tornado F0 0 0 500K 5K<br />
17 Ottoville To 04/15/1994 12:00 AM Tornado F0 0 0 50K 1K<br />
18 Barnhart To 04/15/1994 12:00 AM Tornado F1 0 0 5.0M 5K<br />
19 Crystal City 04/26/1994 2035 Tornado F0 0 0 5K 0<br />
20 De Soto 04/16/1995 1557 Tornado F0 0 0 0K 0<br />
21 Ware 05/06/2003 6:25 PM Tornado F0 0 0 0 0<br />
22 De Soto 05/06/2003 6:30 PM Tornado F0 0 0 0 0<br />
23 Hillsboro 05/27/2004 7:10 PM Tornado F0 0 0 0 0<br />
24 Festus 03/11/2006 9:40 PM Tornado F0 0 0 0 0<br />
25 Festus 03/11/2006 9:42 PM Tornado F3 0 0 0 0<br />
CrD 5
84<br />
<strong>Jefferson</strong> <strong>County</strong> – Section 2<br />
26 Fletcher 09/22/2006 2:20 PM Tornado F1 0 0 0 0<br />
27 Fletcher 09/22/2006 4:05 PM Tornado F1 0 0 0 0<br />
1 Magnitude<br />
2 Death<br />
3 Injuries<br />
4 Property Damage<br />
5 Crop Damage<br />
Source: NCDC<br />
Additional data on significant <strong>Jefferson</strong> <strong>County</strong> thunderstorms (downbursts, lightening,<br />
hail, heavy rains and wind) indicated a total impact of $877,000 in property damages from<br />
113 storm events between 1950 and 2002. Severe thunderstorms and high winds are<br />
summarized on Table J35 below.<br />
TABLE TABLE J35 J35 SEVERE SEVERE THUNDERSTORM THUNDERSTORM EVENTS EVENTS IN<br />
IN<br />
JEFFERSON JEFFERSON COUNTY<br />
COUNTY<br />
Location Location or or <strong>County</strong> <strong>County</strong> Date Date<br />
Type Type Magnitude Magnitude Death Death Injury Injury PrD 1 CrD<br />
1 JEFFERSON 05/16/1960 02/08/1904 Tstm Wind 0 kts. 0 0 0 0<br />
2 JEFFERSON 06/24/1962 05/14/1903 Tstm Wind 0 kts. 0 0 0 0<br />
3 JEFFERSON 07/01/1966 11/30/1903 Tstm Wind 50 kts. 0 0 0 0<br />
4 JEFFERSON 06/10/1967 05/30/1904 Tstm Wind 70 kts. 0 0 0 0<br />
5 JEFFERSON 08/09/1970 04/19/1900 Tstm Wind 0 kts. 0 0 0 0<br />
6 JEFFERSON 05/26/1973 07/27/1905 Tstm Wind 0 kts. 0 0 0 0<br />
7 JEFFERSON 07/09/1973 03/09/1904 Tstm Wind 0 kts. 0 0 0 0<br />
8 JEFFERSON 08/12/1973 03/09/1904 Tstm Wind 0 kts. 0 0 0 0<br />
9 JEFFERSON 12/04/1973 11/25/1900 Tstm Wind 0 kts. 0 0 0 0<br />
10 JEFFERSON 04/03/1974 05/25/1903 Tstm Wind 0 kts. 0 0 0 0<br />
11 JEFFERSON 06/09/1974 06/03/1900 Tstm Wind 0 kts. 0 0 0 0<br />
12 JEFFERSON 06/09/1974 07/18/1900 Tstm Wind 0 kts. 0 0 0 0<br />
13 JEFFERSON 06/09/1974 07/28/1900 Tstm Wind 0 kts. 0 0 0 0<br />
14 JEFFERSON 06/09/1974 07/28/1900 Tstm Wind 0 kts. 0 0 0 0<br />
15 JEFFERSON 03/07/1975 01/15/1900 Tstm Wind 0 kts. 0 0 0 0<br />
16 JEFFERSON 03/07/1975 01/30/1900 Tstm Wind 0 kts. 0 0 0 0<br />
17 JEFFERSON 07/31/1976 11/27/1900 Tstm Wind 0 kts. 0 0 0 0<br />
18 JEFFERSON 06/21/1977 01/30/1906 Tstm Wind 0 kts. 0 0 0 0<br />
19 JEFFERSON 04/07/1980 02/02/1906 Tstm Wind 0 kts. 0 0 0 0<br />
20 JEFFERSON 07/02/1980 11/20/1903 Tstm Wind 0 kts. 0 0 0 0<br />
21 JEFFERSON 07/03/1980 09/01/1900 Tstm Wind 69 kts. 0 0 0 0<br />
22 JEFFERSON 10/17/1980 11/25/1900 Tstm Wind 0 kts. 0 0 0 0<br />
23 JEFFERSON 04/03/1981 03/04/1906 Tstm Wind 0 kts. 0 0 0 0<br />
24 JEFFERSON 04/03/1981 04/18/1906 Tstm Wind 0 kts. 0 0 0 0<br />
25 JEFFERSON 06/02/1981 09/06/1903 Tstm Wind 61 kts. 0 0 0 0<br />
26 JEFFERSON 04/16/1982 04/13/1905 Tstm Wind 0 kts. 0 0 0 0<br />
27 JEFFERSON 04/16/1982 04/13/1905 Tstm Wind 50 kts. 0 0 0 0<br />
28 JEFFERSON 04/16/1982 04/23/1905 Tstm Wind 0 kts. 0 0 0 0<br />
29 JEFFERSON 06/08/1982 04/16/1902 Tstm Wind 0 kts. 0 0 0 0<br />
CrD 2
A Regional Overview All-Hazard Mitigation Plan 85<br />
TABLE TABLE J35 J35 SEVERE SEVERE THUNDERSTORM THUNDERSTORM EVENTS EVENTS IN<br />
IN<br />
JEFFERSON JEFFERSON COUNTY<br />
COUNTY<br />
Location Location or or or <strong>County</strong> <strong>County</strong> Date Date<br />
Type Type Magnitude Magnitude Death Death Injury Injury PrD 1 CrD<br />
30 JEFFERSON 06/15/1982 09/02/1903 Tstm Wind 0 kts. 0 0 0 0<br />
31 JEFFERSON 12/02/1982 08/16/1905 Tstm Wind 0 kts. 0 0 0 0<br />
32 JEFFERSON 06/27/1983 08/31/1904 Tstm Wind 0 kts. 0 0 0 0<br />
33 JEFFERSON 07/24/1983 10/23/1904 Tstm Wind 0 kts. 0 0 0 0<br />
34 JEFFERSON 08/22/1983 02/26/1904 Tstm Wind 0 kts. 0 0 0 0<br />
35 JEFFERSON 10/04/1983 02/18/1904 Tstm Wind 0 kts. 0 0 0 0<br />
36 JEFFERSON 03/15/1984 03/17/1905 Tstm Wind 0 kts. 0 0 0 0<br />
37 JEFFERSON 05/25/1984 01/03/1905 Tstm Wind 0 kts. 0 0 0 0<br />
38 JEFFERSON 09/08/1984 09/25/1904 Tstm Wind 0 kts. 0 0 0 0<br />
39 JEFFERSON 07/31/1985 02/27/1906 Tstm Wind 52 kts. 0 0 0 0<br />
40 JEFFERSON 08/06/1985 12:00 AM Tstm Wind 52 kts. 0 0 0 0<br />
41 JEFFERSON 05/21/1987 12:00 AM Tstm Wind 0 kts. 0 0 0 0<br />
42 JEFFERSON 07/05/1987 12:00 AM Tstm Wind 0 kts. 0 0 0 0<br />
43 JEFFERSON 07/05/1987 12:00 AM Tstm Wind 52 kts. 0 0 0 0<br />
44 JEFFERSON 04/05/1988 12:00 AM Tstm Wind 61 kts. 0 0 0 0<br />
45 JEFFERSON 05/08/1988 12:00 AM Tstm Wind 52 kts. 0 0 0 0<br />
46 JEFFERSON 06/08/1988 12:00 AM Tstm Wind 0 kts. 0 0 0 0<br />
47 JEFFERSON 11/15/1988 12:00 AM Tstm Wind 52 kts. 0 0 0 0<br />
48 JEFFERSON 03/11/1990 12:00 AM Tstm Wind 61 kts. 0 0 0 0<br />
49 JEFFERSON 06/13/1991 12:00 AM Tstm Wind 0 kts. 0 0 0 0<br />
50 JEFFERSON 06/15/1991 12:00 AM Tstm Wind 0 kts. 0 0 0 0<br />
51 JEFFERSON 08/03/1991 12:00 AM Tstm Wind 0 kts. 0 0 0 0<br />
52 JEFFERSON 08/03/1991 12:00 AM Tstm Wind 0 kts. 0 0 0 0<br />
53 JEFFERSON 08/08/1991 12:00 AM Tstm Wind 0 kts. 0 0 0 0<br />
54 JEFFERSON 11/29/1991 12:00 AM Tstm Wind 0 kts. 0 0 0 0<br />
55 JEFFERSON 06/24/1992 12:00 AM Tstm Wind 0 kts. 0 0 0 0<br />
56 JEFFERSON 07/10/1992 12:00 AM Tstm Wind 0 kts. 0 0 0 0<br />
57 JEFFERSON 09/07/1992 12:00 AM Tstm Wind 52 kts. 0 0 0 0<br />
58 De Soto 04/25/1993 12:00 AM Thunderstorm 52 kts. 0 0 0 0<br />
59 De Soto 04/25/1993 12:00 AM Thunderstorm 0 kts. 0 0 50K 0<br />
60 High Ridge 08/23/1993 12:00 AM Thunderstorm 0 kts. 0 0 5K 0<br />
61 Cedar Hill 04/26/1994 12:00 AM Thunderstorm 52 kts. 0 0 5K 0<br />
62 MOZ009 - 010 - 018 -<br />
019 - 026 - 027 - 034>036<br />
- 041 - 042 - 047>052 -<br />
059>065 -<br />
04/18/1995 12:00 AM High Winds 0 kts. 0 0 700K 0<br />
63 Victoria 05/18/1995 12:00 AM Thunderstorm 52 kts. 0 0 0 0<br />
64 Otto 07/04/1995 12:00 AM Thunderstorm 0 kts. 0 0 0K 0<br />
65 St. Louis City 07/04/1995 12:00 AM Thunderstorm 0 kts. 0 0 1K 0<br />
66 Hillsboro 04/19/1996 4:30 PM Tstm Wind 55 kts. 0 0 0 0<br />
67 MOZ061>063 - 065 04/28/1996 8:00 AM High Wind 61 kts. 0 0 0 0<br />
68 Arnold 07/19/1996 7:00 PM Tstm Wind 55 kts. 0 0 0 0<br />
69 Pevely 07/19/1996 7:20 PM Tstm Wind 55 kts. 0 0 0 0<br />
70 MOZ009>010 - 04/05/1997 3:00 PM High Wind 50 kts. 0 0 0 0<br />
CrD 2
86<br />
TABLE TABLE J35 J35 SEVERE SEVERE THUNDERSTORM THUNDERSTORM EVENTS EVENTS IN<br />
IN<br />
<strong>Jefferson</strong> <strong>County</strong> – Section 2<br />
JEFFERSON JEFFERSON COUNTY<br />
COUNTY<br />
Location Location or or or <strong>County</strong> <strong>County</strong> Date Date<br />
Type Type Magnitude Magnitude Death Death Injury Injury PrD 1 CrD<br />
018>019 - 026>027 -<br />
034>036 - 052 - 060>065<br />
- 073>075<br />
71 MOZ009>010 -<br />
018>019 - 026>027 -<br />
034>036 - 052 -<br />
060>065<br />
04/30/1997 1:00 PM High Wind 45 kts. 0 0 0 0<br />
72 Byrnes Mill 05/25/1997 7:45 PM Tstm Wind 50 kts. 0 0 0 0<br />
73 De Soto 05/25/1997 8:00 PM Tstm Wind 50 kts. 0 0 0 0<br />
74 De Soto 06/21/1997 6:20 PM Tstm Wind 61 kts. 0 0 100K 0<br />
75 Hillsboro 03/27/1998 5:25 PM Tstm Wind 50 kts. 0 0 0 0<br />
76 Arnold 07/22/1998 6:30 PM Tstm Wind 61 kts. 0 0 5K 0<br />
77 Hillsboro 11/10/1998 4:00 AM Tstm Wind 56 kts. 0 0 0 0<br />
78 Dittmer 06/08/1999 2:40 PM Tstm Wind 55 kts. 0 0 0 0<br />
79 Arnold 07/09/1999 6:10 PM Tstm Wind 52 kts. 0 0 0 0<br />
80 High Ridge 06/24/2000 1:20 PM Tstm Wind 52 kts. 0 0 0 0<br />
81 Cedar Hill 09/11/2000 10:48 PM Tstm Wind 56 kts. 0 0 0 0<br />
82 House Spgs 09/11/2000 10:58 PM Tstm Wind 56 kts. 0 0 0 0<br />
83 Hillsboro 09/11/2000 11:10 PM Tstm Wind 56 kts. 0 0 0 0<br />
84 Imperial 09/11/2000 11:10 PM Tstm Wind 56 kts. 0 0 0 0<br />
85 MOZ018>019 -<br />
026>027 - 034>036 -<br />
041>042 - 047>050 -<br />
050>052 - 059>065 -<br />
072>075 - 084>085 - 099<br />
86 MOZ018>019 -<br />
026>027 - 034>036 -<br />
041>042 - 047>052 -<br />
059>065 - 072>075 -<br />
084>085 - 099<br />
87 MOZ018>019 -<br />
026>027 - 034>036 -<br />
041>042 - 047>052 -<br />
059>065 - 072>075 -<br />
084>085 - 099<br />
12/16/2000 8:00 PM Extreme<br />
Windchill<br />
CrD 2<br />
N/A 0 0 0 0<br />
02/25/2001 12:00 AM High Wind 40 kts. 0 0 0 0<br />
03/13/2001 9:00 AM High Wind 45 kts. 0 0 0 0<br />
88 Cedar Hill 07/18/2001 1:05 PM Tstm Wind 55 kts. 0 0 0 0<br />
89 Hillsboro 07/18/2001 1:15 PM Tstm Wind 55 kts. 0 0 0 0<br />
90 Imperial 09/08/2001 9:15 PM Tstm Wind 55 kts. 0 0 0 0<br />
91 Arnold 09/08/2001 9:29 PM Tstm Wind 55 kts. 0 0 0 0<br />
92 MOZ018>019 -<br />
026>027 - 034>036 -<br />
041>042 - 049>052 - 059<br />
- 061>065<br />
03/09/2002 6:00 AM High Wind 43 kts. 0 0 0 0<br />
93 Hillsboro 05/07/2002 2:55 AM Tstm Wind 55 kts. 0 0 0 0<br />
94 Festus 05/07/2002 3:00 AM Tstm Wind 55 kts. 0 0 0 0<br />
95 Hillsboro 05/07/2002 3:00 AM Tstm Wind 55 kts. 0 0 0 0
A Regional Overview All-Hazard Mitigation Plan 87<br />
TABLE TABLE J35 J35 SEVERE SEVERE THUNDERSTORM THUNDERSTORM EVENTS EVENTS IN<br />
IN<br />
JEFFERSON JEFFERSON COUNTY<br />
COUNTY<br />
Location Location or or or <strong>County</strong> <strong>County</strong> Date Date<br />
Type Type Magnitude Magnitude Death Death Injury Injury PrD 1 CrD<br />
96 De Soto 07/03/2002 2:35 PM Tstm Wind 55 kts. 0 0 10K 0<br />
97 High Ridge 07/10/2002 1:47 PM Tstm Wind 55 kts. 0 0 0 0<br />
98 Cedar Hill 07/10/2002 1:50 PM Tstm Wind 55 kts. 0 0 0 0<br />
99 Hillsboro 07/10/2002 2:00 PM Tstm Wind 55 kts. 0 0 0 0<br />
100 Festus 07/10/2002 2:10 PM Tstm Wind 55 kts. 0 0 0 0<br />
101 Cedar Hill 07/22/2002 6:45 PM Tstm Wind 55 kts. 0 0 0 0<br />
102 High Ridge 07/22/2002 6:49 PM Tstm Wind 55 kts. 0 0 0 0<br />
103 Otto 07/22/2002 6:55 PM Tstm Wind 55 kts. 0 0 0 0<br />
104 De Soto 05/06/2003 6:30 PM Tstm Wind 75 kts. 0 0 0 0<br />
105 De Soto 05/06/2003 6:47 PM Tstm Wind 87 kts. 0 0 0 0<br />
106 Crystal City 05/06/2003 7:05 PM Tstm Wind 60 kts. 0 0 0 0<br />
107 Herculaneum 05/06/2003 7:05 PM Tstm Wind 60 kts. 0 0 0 0<br />
108 Pevely 05/06/2003 7:05 PM Tstm Wind 60 kts. 0 0 0 0<br />
109 Imperial 06/10/2003 4:50 PM Tstm Wind 60 kts. 0 0 0 0<br />
110 Arnold 06/10/2003 5:00 PM Tstm Wind 55 kts. 0 0 0 0<br />
111 Barnhart 06/10/2003 5:00 PM Tstm Wind 60 kts. 0 0 0 0<br />
112 Arnold 07/18/2003 9:10 AM Tstm Wind 55 kts. 0 0 0 0<br />
113 High Ridge 07/18/2003 9:10 AM Tstm Wind 55 kts. 0 0 0 0<br />
114 House Spgs 07/18/2003 9:10 AM Tstm Wind 55 kts. 0 0 0 0<br />
115 De Soto 08/01/2003 2:35 PM Tstm Wind 55 kts. 0 0 0 0<br />
116 Pevely 09/26/2003 6:30 PM Tstm Wind 55 kts. 0 1 0 0<br />
117 Cedar Hill 05/27/2004 6:54 PM Tstm Wind 56 kts. 0 0 0 0<br />
118 Cedar Hill 05/27/2004 6:54 PM Tstm Wind 60 kts. 0 0 0 0<br />
119 High Ridge 05/27/2004 6:55 PM Tstm Wind 55 kts. 0 0 0 0<br />
120 Hillsboro 05/27/2004 7:20 PM Tstm Wind 55 kts. 0 0 0 0<br />
121 De Soto 05/27/2004 7:25 PM Tstm Wind 52 kts. 0 0 0 0<br />
122 Arnold 05/30/2004 3:52 PM Tstm Wind 55 kts. 0 0 0 0<br />
123 Festus 06/18/2004 2:00 PM Tstm Wind 55 kts. 0 0 0 0<br />
124 Hillsboro 08/24/2004 1:05 PM Tstm Wind 50 kts. 0 0 0 0<br />
125 High Ridge 08/24/2004 12:50 PM Tstm Wind 55 kts. 0 0 0 0<br />
126 House Spgs 08/24/2004 12:50 PM Tstm Wind 55 kts. 0 0 0 0<br />
127 Grubville 08/27/2004 3:30 PM Tstm Wind 52 kts. 0 0 0 0<br />
128 Crystal City 05/19/2005 11:25 PM Tstm Wind 53 kts. 0 0 0 0<br />
129 Pevely 05/19/2005 11:25 PM Tstm Wind 53 kts. 0 0 0 0<br />
130 Festus 05/19/2005 11:30 PM Tstm Wind 53 kts. 0 0 0 0<br />
131 Festus 06/06/2005 12:00 PM Tstm Wind 50 kts. 0 0 0 0<br />
132 High Ridge 06/09/2005 5:40 PM Tstm Wind 55 kts. 0 0 0 0<br />
133 House Spgs 07/04/2005 1:05 PM Tstm Wind 52 kts. 0 0 0 0<br />
134 High Ridge 08/13/2005 3:05 PM Tstm Wind 57 kts. 0 0 0 0<br />
135 De Soto 11/27/2005 10:36 PM Tstm Wind 55 kts. 0 0 0 0<br />
136 De Soto 11/27/2005 10:48 PM Tstm Wind 55 kts. 0 0 0 0<br />
137 Barnhart 04/02/2006 4:00 PM Tstm Wind 55 kts. 0 0 0 0<br />
138 Imperial 04/02/2006 4:00 PM Tstm Wind 55 kts. 0 0 0 0<br />
CrD 2
88<br />
TABLE TABLE J35 J35 SEVERE SEVERE THUNDERSTORM THUNDERSTORM EVENTS EVENTS IN<br />
IN<br />
<strong>Jefferson</strong> <strong>County</strong> – Section 2<br />
JEFFERSON JEFFERSON COUNTY<br />
COUNTY<br />
Location Location or or or <strong>County</strong> <strong>County</strong> Date Date<br />
Type Type Magnitude Magnitude Death Death Injury Injury PrD 1 CrD<br />
139 Pevely 04/02/2006 4:00 PM Tstm Wind 55 kts. 0 0 0 0<br />
140 Byrnes Mill 04/02/2006 4:01 PM Tstm Wind 55 kts. 0 0 0 0<br />
141 Arnold 07/19/2006 6:35 PM Tstm Wind 61 kts. 0 0 0 0<br />
142 Arnold 07/19/2006 7:00 PM Tstm Wind 61 kts. 0 2 0 0<br />
143 De Soto 07/19/2006 7:25 PM Tstm Wind 70 kts. 0 0 0 0<br />
144 De Soto 08/07/2006 3:05 PM Tstm Wind 50 kts. 0 0 0 0<br />
145 De Soto 08/07/2006 4:30 PM Tstm Wind 52 kts. 0 0 0 0<br />
146 Festus 08/07/2006 4:50 PM Tstm Wind 52 kts. 0 0 0 0<br />
147 Murphy 07/19/2007 16:10 PM Tstm Wind 52 kts. 0 0 0K 0K<br />
148 Hillsboro 10/18/2007 12:00 AM Tstm Wind 52 kts. 0 0 0K 0K<br />
149 High Ridge 05/25/2008 20:25 PM Tstm Wind 52 kts. 0 0 5K 0K<br />
150 Horine 06/21/2008 14:40 PM Tstm Wind 52 kts. 0 0 0K 0K<br />
151 Hematite 06/21/2008 15:17 PM Tstm Wind 52 kts. 0 0 0K 0K<br />
152 Hillsboro 07/12/2008 14:50 PM Tstm Wind 52 kts. 0 0 0K 0K<br />
153 Oakvale 08/05/2008 17:30 PM Tstm Wind 52 kts. 0 0 0K 0K<br />
TOTALS: 0 3 882K 0<br />
1 Property Damage<br />
2 Crop Damage<br />
Source: NCDC<br />
Frequency Frequency of of Occurrence ccurrence<br />
The frequency of severe windstorms and tornadoes is difficult to predict. See Figure J42<br />
below. They usually occur mostly during the spring and summer; the tornado season<br />
comes early in the south and later in the north because spring comes later in the year as<br />
one moves northward. Storms usually occur during the late afternoon and early evening,<br />
but they have been known to occur in every state in the United States, on any day of the<br />
year, and at any hour. Table J38 below depicts tornado occurrences are most commonly<br />
seen in the spring months. In the southern states, tornado frequency peaks in March<br />
through May; while in the northern states, peak frequency is during the summer months.<br />
Along the gulf coast, a secondary tornado maximum occurs during the fall. In the western<br />
states, the total number of tornadoes is higher than indicated. Sparse population reduces<br />
the number reported. The map illustrates months of peak tornado activity by state (1950-<br />
1991). (NOAA/NWS)<br />
CrD 2
A Regional Overview All-Hazard Mitigation Plan 89<br />
FIGURE FIGURE J42 J42 TORNADO TORNADO OCCURRENCES<br />
OCCURRENCES<br />
Source: NOAA
90<br />
January<br />
January<br />
<strong>Jefferson</strong> <strong>County</strong> – Section 2<br />
TABLE TABLE J36 J36 OCCURRENCES OCCURRENCES OF OF TORNADOES TORNADOES TORNADOES IN IN JEFFERSON JEFFERSON COUNTY<br />
COUNTY<br />
FROM FROM 1950 1950 TO TO 1998<br />
1998<br />
February<br />
February<br />
Intensity Intensity or r r Strength<br />
Strength<br />
March<br />
March<br />
April<br />
April<br />
May<br />
May<br />
June<br />
June<br />
0 0 0 8 7 2 2 0 1 1 1 1<br />
Storms in <strong>Jefferson</strong> <strong>County</strong> range from F0 to F4. There have been no recorded F5 storms.<br />
Refer to Table J37 and Figure J43 below.<br />
TABLE TABLE J37 J37 J37 STORM STORM INTENSITIES INTENSITIES FOR FOR JEFFERSON JEFFERSON COUNTY<br />
COUNTY<br />
JURISDICTIONS JURISDICTIONS<br />
F0 F1 F2 F3 F4 Total<br />
St. Louis City 0 2 3 2 2 9<br />
St. Louis <strong>County</strong> 2 8 11 5 2 28<br />
St. Charles <strong>County</strong> 6 10 11 7 1 35<br />
<strong>Jefferson</strong> <strong>County</strong> 5 11 4 2 1 23<br />
Franklin <strong>County</strong> 6 6 8 0 0 20<br />
Total Total<br />
19 37 37 16 6 115<br />
Lives Lives Lost, Lost, Injuries, Injuries, Property Property Damage, Damage, Economic Economic Loss Losses/Other Loss Losses/Other<br />
es/Other Losses<br />
Losses<br />
Even though only about 10 percent of tornadoes are significant, these tornadoes are<br />
responsible for the majority of deaths caused by tornadoes in the country, with violent<br />
tornadoes claiming 67 percent of the total casualties. Furthermore, the US suffers millions<br />
of dollars in damage costs in the aftermath of such events- an important consideration for<br />
the insurance industry.<br />
<strong>Jefferson</strong> <strong>County</strong> has had 23 tornadoes, three of which have resulted in 48 injuries and<br />
five deaths. The estimated damage from these storms cost approximately $9.7 million<br />
dollars. The most recent tornado in May 2003 located in Desoto, <strong>Jefferson</strong> <strong>County</strong> resulted<br />
in one death and approximately $1million dollars in damage. Missouri is considered to be<br />
in the top ten lists for total number of tornadoes and number of killer tornadoes (ranking<br />
number seven).<br />
July<br />
July<br />
August<br />
August<br />
September<br />
September<br />
October<br />
October<br />
November November<br />
Dec<br />
December ember
A Regional Overview All-Hazard Mitigation Plan 91<br />
Locations/Areas Locations/Areas Affected<br />
Affected<br />
FIGURE FIGURE J43 J43 BREAKDOWN BREAKDOWN OF OF CATEGORY CATEGORY TORNADOES<br />
TORNADOES<br />
Source: NOAA; U.S. data<br />
Based on available data, there is no predictable pathway that tornadoes and windstorms<br />
follow. In general, however, these storms run in a southwest to northeast direction.<br />
Figure J44 below depicts the distribution of storms across the planning region. Based upon<br />
Table J39 above, one can see that each jurisdiction has had multiple tornadoes. <strong>Jefferson</strong><br />
<strong>County</strong> has had the third largest number of storms in the EWG planning region.<br />
FIGURE FIGURE J44 J44 REGIONAL REGIONAL TORNADO STORM TRACKS<br />
Source: NOAA
92<br />
Seasonal Seasonal Pattern<br />
Pattern<br />
<strong>Jefferson</strong> <strong>County</strong> – Section 2<br />
Tornadoes occur mostly during the spring and summer; the tornado season comes early in<br />
the south and later in the north because spring comes later in the year as one moves<br />
northward. Tornadoes and storms usually occur during the late afternoon and early<br />
evening, but they have been known to occur in every state in the United States, on any day<br />
of the year, and at any hour.<br />
Based on Table J38, in <strong>Jefferson</strong> <strong>County</strong>, most of the storms occurred in the month of April<br />
with 8 tornadoes. May had a total of 7 tornadoes, both June and July had 2, and<br />
September, October, November and December had 1 each per month.<br />
Speed Speed of f Onset Onset Onset And/Or And/Or And/Or Existing Existing Existing Warning Warning Systems<br />
Systems<br />
Tornadoes and other severe windstorms can occur instantly. The National Oceanic and<br />
Atmospheric Agency and other agencies (National Weather Service) have prioritized the<br />
research and understanding of the development of these types of storms in order to<br />
protect citizens and their property. Doppler Radar could help the National Weather Service<br />
provide a much-improved severe thunderstorm and tornado warnings.The new Radar, or<br />
NEXRAD for Next Generation Radar (officially WSR-88D), provides forecasters with a<br />
detailed look at storms through reflectivity and velocity displays. Reflectivity indicates<br />
rainfall or precipitation intensity and velocity displays the speed and direction of the winds<br />
within the storm. Tornado warning lead times has increased in the last 10 years from less<br />
than 5 minutes to nearly 12 minutes (NWS).<br />
Phased Array Radar - NSSL will soon begin adapting SPY-1 radar technology for use in<br />
spotting severe weather.<br />
The mission of the Severe Weather Warning Applications and Technology Transfer (SWAT)<br />
team is to develop severe weather warning applications and transfer them to users to<br />
enhance their capability to warn of severe weather. There are two focus groups within<br />
SWAT:<br />
• National Weather Service Focus Group Staff Listing (SWAT-NWS)<br />
• Federal Aviation Administration Focus Group Staff Listing (SWAT-FAA)<br />
Map Map of of Hazards<br />
Hazards<br />
Refer to Figure J45 (located in the back of the Technical Appendix) that depicts those areas<br />
in <strong>Jefferson</strong> <strong>County</strong> that are susceptible to severe windstorms.
A Regional Overview All-Hazard Mitigation Plan 93<br />
Statement Statement of of Probable Probable Future Future Future Severity<br />
Severity<br />
Based on the previous twenty-three events in the <strong>Jefferson</strong> <strong>County</strong>, the future probable<br />
severity is shown below.<br />
Future Probable Severity By FF-Scale<br />
F<br />
Scale<br />
F0 Negligible<br />
F1 Limited<br />
F2 Limited<br />
F3 Critical<br />
F4 Catastrophic<br />
F5 Catastrophic<br />
Statement Statement Statement of of of Probable Probable Probable Risk<br />
Risk<br />
The risk of tornadoes in <strong>Jefferson</strong> <strong>County</strong> is moderate with twenty-three tornadoes.<br />
Surrounding counties such as St. Louis <strong>County</strong> and St. Charles <strong>County</strong> have greater<br />
numbers: 28 and 35. By nature, tornadoes strike randomly. Based in information from the<br />
National Oceanic and Atmospheric Administration, tornadoes occur between five to seven<br />
times per 10,000 square miles per year and downbursts occur between 14 to 17 times per<br />
10,000 square miles per year within the EWG planning region. There are between 40 to<br />
60 thunderstorm days per year and approximately five to eight annual events of hail per<br />
10,000 square miles within the EWG planning region. These figures are different from the<br />
Federal Emergency Management agency (FEMA) data. FEMA indicates that there are<br />
between six to ten tornadoes per 1,000 square miles in the EWG planning region. Refer to<br />
Table J38 below for risk.<br />
TABLE TABLE J38 J38 TORNADO TORNADO RISK<br />
RISK<br />
F# F#<br />
Events Risk Risk Probable Probable Risk of of<br />
Occurrence<br />
Occurrence<br />
By By FF-Scale<br />
F Scale Scale<br />
F0 22% F0 Likely<br />
F1 48% F1 Likely<br />
F2 17% F2 Likely<br />
F3 9% F3 Possible<br />
F4 4% F4 Possible<br />
F5 0 F5 Unlikely<br />
Statement Statement of of Next Next Disaster’s Disaster’s Likely Likely Adverse Adverse Impact Impact on on the the Community<br />
Community<br />
Tornadoes have enormous power and destructive ability. Injuries, property damage and<br />
risk of death remain high. Technological advances that facilitate earlier warning, combined<br />
with public education and improved construction techniques, provide the opportunity for<br />
reductions in the number of injuries, reduction in property damage and loss of life. Based<br />
on history from 198 years, the likely adverse impact of future <strong>Jefferson</strong> <strong>County</strong> tornado and<br />
thunderstorm events is shown below. The next tornado or severe windstorm will most
94<br />
<strong>Jefferson</strong> <strong>County</strong> – Section 2<br />
likely have a detrimental impact on the community in terms of injuries, property damage<br />
(up to millions dollars in damages from property damage) and death, based upon the past<br />
historic storm events. This is due to the dense population of residents and workers who<br />
live and work in the planning region, as well as the construction methods and standards<br />
used.<br />
Without Without Without Mitigation Mitigation Mitigation Measures Measures<br />
Measures<br />
Life Catastrophic<br />
Property Catastrophic<br />
Emotional Catastrophic<br />
Financial Catastrophic<br />
Comments: None<br />
With With Mitigation Mitigation Measures<br />
Measures<br />
Life Limited<br />
Property Limited<br />
Emotional Limited<br />
Financial Limited<br />
Comments: None<br />
Recommendations<br />
Recommendations<br />
That the <strong>County</strong> Hazard Mitigation Planning Committee initiate a mitigation activity to<br />
convince county residents to construct Tornado Saferooms to help reduce the loss of life<br />
caused by tornadoes.<br />
Severe Severe Wi Winter Wi Winter<br />
nter Weather Weather Hazard Hazard (Snow, (Snow, Ice Ice and and Extreme Extreme Cold) Cold) Profile<br />
Profile<br />
Description<br />
Description<br />
Winter weather is different than other hazards in that the hazard tends to occur over a<br />
much larger area, often times affecting areas from several counties to multiple states.<br />
Winter weather includes heavy snow, ice, freezing rain/sleet and extreme cold<br />
temperatures.<br />
Characteristics<br />
Characteristics<br />
Snow can range from blizzard conditions to snow flurries and can accumulate to several<br />
inches, resulting in dangerous driving conditions. Ice conditions including sleet and<br />
freezing rain can result in roadways being covered in sheets of ice and ice jams resulting in<br />
flooding. Sleet can accumulate like snow and cause a hazard to motorists. Freezing rain is<br />
rain that falls onto a surface with a temperature below freezing. It then freezes to surfaces,<br />
such as trees, cars, and roads, forming a glaze of ice. Even small accumulations of ice can<br />
cause a significant hazard. An ice storm occurs when freezing rain falls and freezes
A Regional Overview All-Hazard Mitigation Plan 95<br />
immediately on impact. Heavy accumulations of ice can bring down trees, electrical wires,<br />
telephone poles and lines, and communication towers. Communications and power can be<br />
disrupted for days while utility companies work to repair the extensive damage.<br />
Sometimes winter storms are accompanied by strong winds creating blizzard conditions<br />
with blinding wind-driven snow, severe drifting and dangerous wind chill. Strong winds<br />
with these intense storms and cold fronts can knock down trees, utility poles and power<br />
lines. Extreme cold often accompanies a winter storm or is left in its wake. Prolonged<br />
exposure to the cold can cause frostbite or hypothermia and become life-threatening.<br />
Infants and elderly people are most susceptible to extremely cold weather conditions. What<br />
constitutes extreme cold and its effect varies across different areas of the United States. In<br />
areas unaccustomed to winter weather, near freezing temperatures are considered<br />
"extreme cold." Freezing temperatures can cause severe damage to citrus fruit crops and<br />
other vegetation. Pipes may freeze and burst in homes that are poorly insulated or without<br />
heat. In the north, below zero temperatures may be considered as "extreme cold." Long<br />
cold spells can cause rivers to freeze, disrupting shipping, and Ice jams may form and lead<br />
to flooding.<br />
Extreme cold temperatures are ranked based upon a wind chill chart that figures the<br />
temperature on how the wind and cold feel on exposed skin. As the wind increases, heat is<br />
carried away from the body at a faster rate, driving down the body temperature. Frostbite,<br />
hypothermia and death can result from winter weather. Seventy percent of snow injuries<br />
result from vehicle accidents, 25 percent occur in people getting caught in the weather.<br />
Cold injuries occur to 50 percent of people over 60 years old, 75 percent happen to males<br />
and 20 percent occur in the home.<br />
Likely Likely Locations ocations<br />
Winter weather in the St. Louis region moves in an west to east direction. Late winter<br />
storms that have a tendency to be intense tend to generate in the southwest portion of the<br />
United States and move northeast, dependent upon the meteorology and the storm track.<br />
The hazard tends to occur over a much larger area.<br />
Type Type of of Damage amage<br />
Types of damage that could occur in the EWG planning affect both property, as well as<br />
injury and death to individuals. Each year dozens of people die due to exposure to cold. In<br />
addition, vehicle accidents and fatalities, fires due to dangerous use of heaters and other<br />
winter weather fatalities (heart attacks from shoveling snow, for example) result in a threat.<br />
Threats such as hypothermia and frostbite can lead to the loss of fingers and toes or cause<br />
permanent kidney, pancreas, liver damage and death. People can become trapped in their<br />
homes and cars without utilities or assistance. Other damage can include rooftop collapse<br />
due to the weight of a heavy snowfall event, automobile accidents and downed power<br />
lines/power outages from ice storms. Heavy snow can strand commuters, close airports,<br />
stop the flow of supplies and disrupt emergency and medical services. Livestock may be
96<br />
<strong>Jefferson</strong> <strong>County</strong> – Section 2<br />
lost on farms. The cost of snow and debris removal, repairing damages and the loss of<br />
business can have a severe impact on the region.<br />
Hazard Hazard Event Event History<br />
History<br />
St. Louis City<br />
Injuries/Damage<br />
St. Louis <strong>County</strong><br />
Injuries/Damage<br />
St. Charles <strong>County</strong><br />
Injuries/Damage<br />
<strong>Jefferson</strong> <strong>County</strong><br />
Injuries/Damage<br />
TABLE TABLE TABLE J39 J39 JEFFERSON JEFFERSON COUNTY COUNTY WINTER WINTER STORMS<br />
STORMS<br />
1994<br />
1994<br />
2*<br />
15/500K<br />
2*<br />
15/500K<br />
2*<br />
15/500K<br />
1<br />
500K<br />
Franklin<br />
<strong>County</strong><br />
2*<br />
Injuries/Damage 15/500K<br />
Total<br />
9<br />
Injuries/Damage 15/500K<br />
* Denotes ice storm event<br />
• Source NCDC/NOAA<br />
1995 1995<br />
3*<br />
/.3 M<br />
3*<br />
/.3M<br />
5*<br />
/2.7M<br />
3*<br />
/.3 M<br />
5*<br />
/2.7M<br />
19<br />
/2.7M<br />
1996<br />
1996<br />
1997<br />
1997<br />
1998<br />
1998<br />
1999<br />
1999<br />
2000<br />
2000<br />
2001<br />
2001<br />
2002<br />
2002<br />
2003 2003<br />
Total<br />
Total<br />
3* 4 3 2* 4 1 4 1 27<br />
3*<br />
3*<br />
2*<br />
3*<br />
4<br />
4<br />
4<br />
4<br />
4<br />
4<br />
4<br />
3<br />
2*<br />
2*<br />
3*<br />
2*<br />
14 20 18 11 18 4 20 7<br />
The numbers in the table denote the number of winter storms that occurred in each year<br />
listed. The winter storms listed include snow and ice events. Data from Table J41was<br />
provided by the NCDC within NOAA. The report query noted that the data represent ice<br />
and snow events between January 1, 1950 and February 28, 2003. However, no dates<br />
prior to 1994 were displayed in the query results. It is for this reason that the data<br />
provided in Table J41 and J42 above and below should be used with limited reliability in<br />
depicting all events, related injuries and property damage during this time frame. NOAA<br />
does not track winter weather to the same degree it has for severe Midwest spring storms.<br />
This is mainly due to the fact that winter weather and winter storms are more "subjective"<br />
and this kind of information has not been summarized (graphically or otherwise). The<br />
Aviation Weather Service, a part of the NOAA maintains a list of historic weather facts. The<br />
database noted that on November 6, 1951, St. Louis received 12.5 inches of snow, and on<br />
January 31, 1982, regions surrounding St. Louis received 25 inches of snow and left<br />
approximately 4,000 motorists stranded for two days.<br />
4<br />
4<br />
3<br />
3<br />
1<br />
1<br />
1<br />
0<br />
4<br />
4<br />
4<br />
4<br />
2<br />
2<br />
1<br />
1<br />
35<br />
31<br />
26<br />
27
A Regional Overview All-Hazard Mitigation Plan 97<br />
Frequency Frequency of of Occurrence<br />
Occurrence<br />
NOAA weather data shows that winter weather most commonly occurs in January (44% of<br />
storms occurred in this month), followed by December (22%). Records show that<br />
temperatures drop to zero or below an average of two or three days per year, and<br />
temperatures as cold as 32 degrees or lower occur less than 25 days in most years.<br />
Snowfall has averaged a little over 18 inches per winter season, and snowfall of an inch or<br />
less is received on five to ten days in most years.<br />
TABLE TABLE J40 J40 JEFFERSON JEFFERSON COUNTY COUNTY WINTER WINTER STORMS STORMS 1994 1994 TO TO 2007<br />
2007<br />
Lo Location Lo<br />
cation or or <strong>County</strong> <strong>County</strong><br />
Date Date Time Time Type Type Magnitude Magnitude Death Death Injury Injury PrD 1 CrD<br />
1 Central And <strong>East</strong>ern M 04/05/1994 Winter<br />
Storm<br />
N/A 0 0 500K 0<br />
2 MOZ052 - 059>065 - 071>076 01/06/1995 Glaze Ice N/A 0 0 0.3M 1K<br />
3 Southeast Mo 12/08/1995 Snow N/A 0 0 0 0<br />
4 Central And <strong>East</strong> Cent 12/18/1995 Winter<br />
Storm<br />
N/A 0 0 0 0<br />
5 MOZ041>042 - 047>052 - 059>065 - 01/02/1996 3:00 AM Winter N/A 0 0 0 0<br />
072>075 - 084>085 - 099<br />
Storm<br />
6 MOZ041 - 047>052 - 059>065 - 072>073 -<br />
084<br />
11/25/1996 12:00 PM Ice Storm N/A 0 0 0 0<br />
7 MOZ009>010 - 018>019 - 026>027 - 01/08/1997 3:00 PM Winter N/A 0 0 0 0<br />
034>036 - 041>042 - 047>052 - 099<br />
Storm<br />
8 MOZ009>010 - 018>019 - 026>027 - 01/15/1997 10:00 PM Winter N/A 0 0 0 0<br />
034>036 - 041>042 - 047>052<br />
Storm<br />
9 MOZ009>010 - 018>019 - 026>027 - 01/27/1997 4:00 AM Winter N/A 0 0 0 0<br />
034>036 - 041>042 - 047>052<br />
Storm<br />
10 MOZ009>010 - 018>019 - 026>027 - 04/10/1997 6:00 AM Winter N/A 0 0 0 0<br />
034>036 - 041>042 - 047>052 - 059>065<br />
Storm<br />
11 MOZ035>036 - 051>052 - 060>061 - 063 01/08/1998 8:00 AM Winter N/A 0 0 0 0<br />
- 065<br />
Storm<br />
12 MOZ009>010 - 018>019 - 026>027 - 01/12/1998 2:00 AM Winter N/A 0 0 0 0<br />
034>036 - 041>042 - 047>052<br />
Storm<br />
13 MOZ009>010 - 018>019 - 026>027 - 03/08/1998 10:00 PM Winter N/A 0 0 0 0<br />
034>036 - 041>042 - 047>052<br />
Storm<br />
14 MOZ009>010 - 018>019 - 026>027 - 12/21/1998 12:00 AM Winter N/A 0 0 0 0<br />
034>036 - 041>042 - 047>052 084>085<br />
Storm<br />
15 MOZ041>042 - 047>052 - 059>065 01/01/1999 6:00 PM Winter<br />
Storm<br />
N/A 0 0 0 0<br />
16 MOZ052 - 060>065 - 072>075 - 084>085 01/13/1999<br />
- 099<br />
4:30 AM Ice Storm N/A 0 0 0 0<br />
17 MOZ065 - 072>075 - 084>085 - 099 03/13/1999 10:00 PM Winter<br />
Storm<br />
N/A 0 0 0 0<br />
18 MOZ052 - 060>065 - 072>075 - 084>085 01/28/2000 6:00 PM Winter N/A 0 0 0 0<br />
- 099<br />
Storm<br />
19 MOZ041>042 - 049 - 052 - 059>065 - 072 03/11/2000 4:00 AM Winter<br />
Storm<br />
N/A 0 0 0 0<br />
20 MOZ026>027 - 034>036 - 041>042 - 12/13/2000 6:00 AM Heavy N/A 0 0 0 0<br />
CrD 2
98<br />
<strong>Jefferson</strong> <strong>County</strong> – Section 2<br />
TABLE TABLE J40 J40 JEFFERSON JEFFERSON COUNTY COUNTY WINTER WINTER STORMS STORMS 1994 1994 TO TO 2007<br />
2007<br />
Lo Location Lo<br />
cation or or <strong>County</strong> <strong>County</strong><br />
Date Date Time Time Time Type Type Magnitude Magnitude Death Death Injury Injury PrD 1 CrD<br />
047>052 - 059>065 - 072>075 - 084>085 Snow<br />
21 MOZ052 - 060>061 - 063>065 01/26/2001 1:00 AM Winter<br />
Storm<br />
N/A 0 0 0 0<br />
22 MOZ027 - 034>036 - 042 - 048>052 - 02/25/2002 8:00 PM Winter N/A 0 0 0 0<br />
059>065 - 072>075<br />
Storm<br />
23 MOZ041>042 - 049 - 051>052 - 059>065 03/25/2002 6:00 PM Winter<br />
Storm<br />
N/A 0 0 0 0<br />
24 MOZ041 - 047>048 - 050 - 059>065 12/04/2002 1:00 AM Winter<br />
Storm<br />
N/A 0 0 0 0<br />
25 MOZ065 - 072>075 - 084>085 - 099 12/24/2002 1:00 AM Winter<br />
Storm<br />
N/A 0 0 0 0<br />
26 MOZ041 - 047>052 - 059>065 - 073 02/23/2003 5:00 PM Winter<br />
Storm<br />
N/A 0 0 0 0<br />
27 MOZ051>052 - 060>065 - 072>073 12/13/2003 12:00 PM Winter<br />
Storm<br />
N/A 0 0 0 0<br />
28 MOZ018>019 - 026>027 - 034>036 - 01/25/2004 6:00 AM Winter N/A 0 0 0 0<br />
041>042 - 047>052 - 059><br />
Storm<br />
29 MOZ018>019 - 026>027 - 034>036 - 12/08/2005 6:00 AM Winter N/A 2 0 0 0<br />
041>042 - 047>052 - 059>065<br />
Storm<br />
30 MOZ052 - 059>065 - 072 11/30/2006 4:00 AM Winter<br />
Storm<br />
N/A 0 0 0K 0K<br />
31 MOZ018 - 026>027 - 034>036 - 041>042 12/01/2006 12:00 AM Winter N/A 0 0 0K 0K<br />
- 047>052<br />
Storm<br />
32 MOZ018 - 026>027 - 034>036 - 041>042<br />
Ice Storm<br />
- 047>052 - 059>065 - 072 01/12/2007 22:00 PM<br />
Winter<br />
N/A 0 0 0K 0K<br />
33 MOZ062>065 - 072>075 - 084 - 099 12/08/2007 20:00 PM Weather<br />
Heavy<br />
N/A 0 0 0K 0K<br />
34 MOZ036 - 052 - 060>065 - 072 12/15/2007 5:00 AM Snow N/A 0 0 0K 0K<br />
35 MOZ041 - 047>050 - 059 - 062 - 065 -<br />
Winter<br />
072>075 - 084>085 - 099 02/23/2008 20:00 PM Weather N/A 0 0 0K 0K<br />
TOTALS: 2 15 800K 500<br />
Intensity Intensity Intensity or or or Strength Strength<br />
Strength<br />
Winter storms in the EWG planning region, as compared to winter storms to the north and<br />
west, are relatively mild. Severe winter weather is rare. Based on records maintained from<br />
1900 through 2002, the region has experienced total annual snowfall over the average of<br />
18 inches per year. Of these years, only six years experienced annual snowfall of over 40<br />
inches.<br />
Lives Lives Lost, Lost, Lost, Injuries, Injuries, Property Property Damage, Damage, Economic Economic Losses/Other Losses/Other Losses<br />
Losses<br />
Based on queries for St. Louis City, St. Louis <strong>County</strong>, St. Charles <strong>County</strong>, <strong>Jefferson</strong> <strong>County</strong><br />
and Franklin <strong>County</strong> to NOAA, no deaths were reported due to winter storms. However,<br />
CrD 2
A Regional Overview All-Hazard Mitigation Plan 99<br />
fifteen injuries were noted from 1994 to 2003 and property damage totaled $800,000.<br />
No other information was available from NOAA.<br />
Winter storms are considered deceptive killers because most deaths are indirectly related to<br />
the storm. People die in traffic accidents on icy roads and of hypothermia from prolonged<br />
exposure to cold. Everyone is potentially at risk during winter storms. The actual threat<br />
depends on the specific situation. Recent observations indicate the following:<br />
• Related to ice and snow:<br />
o About 70 percent occur in automobiles.<br />
o About 25 percent are people caught out in the storm.<br />
• Related to exposure to cold:<br />
o 50 percent are people over 60 years old.<br />
o Over 75 percent are males.<br />
o About 20 percent occur in the home.<br />
There are a variety of transportation impacts due to cold weather. Diesel engines are<br />
stressed and fuel often gels in extreme cold weather impacting trucking and rail traffic.<br />
Rivers and lakes freeze, stopping barge and ship traffic. Subsequent ice jams threaten<br />
bridges and can close major highways. Cold temperatures take their toll on vehicle<br />
batteries. Shear cold temperatures stress metal bridge structures. Transportation losses for<br />
the winter of 1976 -77 came to $6.5 billion (in 1980 dollars) (NOAA, 1982).<br />
Cold temperature impacts on agriculture are frequently discussed in terms of frost and<br />
freeze impacts early or late in growing seasons. Absolute temperature and duration of<br />
extreme cold can have devastating effects on trees and winter crops as well. Prolonged<br />
cold snaps can impact livestock not protected from the frigid temperatures.<br />
Energy consumption rises significantly during extreme cold weather. In the winter of 1976-<br />
77 additional energy consumption cost $3.8 billion (1980 dollars). This includes increase<br />
costs of electricity, fuel oil, and coal.<br />
Extreme cold temperatures can cause significant ground freezing problems, especially if<br />
there is little snow cover. Buried water pipes can burst causing massive ice problems and<br />
loss of water pressure in metropolitan areas. This poses a variety of public health and<br />
public safety problems. One case of a broken water main in Denver, Colorado forced the<br />
entire evacuation in sub-zero temperatures of the medically fragile patients of the Veteran's<br />
Hospital. Other cases of broken water mains have shut down subway systems and financial<br />
centers.<br />
Schools often close during extreme cold snaps to protect the safety of children who wait<br />
for school buses.
100<br />
Locations/Areas Locations/Areas Affected<br />
Affected<br />
<strong>Jefferson</strong> <strong>County</strong> – Section 2<br />
Winter weather in the St. Louis region moves in a west to east direction. Late winter<br />
storms that have a tendency to be intense tend to generate in the southwest portion of the<br />
United States and move northeast, dependent upon the meteorology and the storm track.<br />
Winter weather is different than other hazards such as tornadoes in that the hazard tends<br />
to occur over a much larger area, often times affecting from several counties to multiple<br />
states.<br />
Seasonal Seasonal Pattern<br />
Pattern<br />
Missouri’s geographic location has the potential to experience severe winter weather<br />
during the months of December through February, although winter weather has been<br />
known to also occur in mid-November and into March.<br />
Speed Speed Of Of Of Onset Onset And/Or And/Or And/Or Existing Existing Warning Warning Systems Systems<br />
Systems<br />
Winter weather typically does not hit the region without warning. The NOAA Weather<br />
Radio, commercial radio, and television track and announce the latest winter storm<br />
watches, warnings, and advisories. The National Weather Service sets up winter weather<br />
warnings in stages of severity. These warnings are found below.<br />
WIND CHILL ADVISORY:<br />
Notice that wind chill conditions will be present and to dress appropriately<br />
WINTER STORM WATCH:<br />
Severe winter conditions, such as heavy snow and/or ice, are possible within<br />
the next day or two. Prepare.<br />
WINTER STORM WARNING:<br />
Severe winter conditions have begun or are about to begin in your area. Stay<br />
indoors!<br />
BLIZZARD WARNING:<br />
Snow and strong winds will combine to produce a blinding snow (near zero<br />
visibility), deep drifts, and life-threatening wind chill. Seek refuge<br />
immediately<br />
WINTER WEATHER ADVISORY:<br />
Winter weather conditions are expected to cause significant inconveniences<br />
and may be hazardous. If caution is exercised, these situations should not<br />
become life- threatening. The greatest hazard is often to motorists.<br />
FROST/FREEZE WARNING:<br />
Below freezing temperatures are expected and may cause significant damage<br />
to plants, crops, or fruit trees. In areas unaccustomed to freezing<br />
temperatures, people who have homes without heat need to take added<br />
precautions.
A Regional Overview All-Hazard Mitigation Plan 101<br />
Map Map Map of of Hazards azards<br />
Refer to Figure J45, located in the back of the Technical Appendix, for a map depicting<br />
potential regions of <strong>Jefferson</strong> <strong>County</strong> that are susceptible to severe winter weather.<br />
Statement Statement of f Probable Probable Future Future Future Severity<br />
Severity<br />
The probable future severity of severe winter weather will most likely be similar to the<br />
climatologic past. Based on the climatic history of <strong>Jefferson</strong> <strong>County</strong>, winter weather and<br />
extreme cold events are highly likely to occur. The future probably severity for each<br />
category of winter events is shown below:<br />
Winter Winter Winter Event Event Event Probable Probable Severity Severity<br />
Heavy Snow Limited<br />
Ice Event Critical<br />
Extreme Cold Critical<br />
Statement Statement of f f Probable Probable Risk/Likeliness Risk/Likeliness of f f Future Future Occurrence<br />
Based upon <strong>Jefferson</strong> <strong>County</strong>’s climatic history, there is a highly likely risk of impacts in the<br />
county due to severe winter weather.. Based in information from the National Oceanic and<br />
Atmospheric Administration and FEMA, severe winter weather occurs between two to<br />
three times per year in the EWG planning region. NOAA has data from EWG planning<br />
region indicating that during the winter months the probability of measurable snowfall<br />
ranges between 91 and 100 percent, depending on the reporting weather station.<br />
Records show that temperatures drop to zero or below an average of two or three days per<br />
year, and temperatures as cold as 32 degrees or lower occur less than 25 days in most<br />
years. The coldest day reported in the region from 1941 through 2001 was minus 18<br />
degrees Fahrenheit on January 20, 1985. Snowfall has averaged a little over 18 inches per<br />
winter season, and snowfall of an inch or less is received on five to ten days in most years.<br />
Winter Winter Event Event Probable Risk<br />
Heavy Snow Likely<br />
Ice Event Likely<br />
Extreme Cold Likely<br />
Statement Statement Statement of f Next Next Disaster’s Disaster’s Likely Likely Likely Adverse Adverse Impact Impact on n n Community<br />
Community<br />
The next severe winter storm will possibly have a detrimental impact on the community in<br />
terms of injuries, property damage and death, based upon the past historic storm events.<br />
This is due to the dense population of residents and workers who live and work in the<br />
planning region. Based on recent history, the likely impact on <strong>Jefferson</strong> <strong>County</strong> is shown<br />
below.
102<br />
Without Without Mitigation Mitigation Measures<br />
Measures<br />
Life Catastrophic<br />
Property Critical<br />
Emotional Catastrophic<br />
Financial Critical<br />
Comments: none<br />
<strong>Jefferson</strong> <strong>County</strong> – Section 2<br />
With With Mitigation Mitigation Measures<br />
Measures<br />
Life Limited<br />
Property Limited<br />
Emotional Limited<br />
Financial Limited<br />
Comments Public education about winter hazards and health dangers can reduce<br />
deaths and injuries<br />
Recommendation<br />
Recommendation<br />
Mitigation activities for <strong>Jefferson</strong> <strong>County</strong> should include the education of its workers and<br />
residents about prevention of injuries and deaths from severe winter weather.<br />
Drought Drought Drought Hazard Hazard Profile Profile<br />
Profile<br />
Description<br />
Description<br />
Drought is defined as the deficiency of precipitation over an extended period of time,<br />
usually a season or more. This deficiency results in a water shortage for some activity,<br />
group or environmental sector. Drought should be considered relative to some long-term<br />
average condition of balance between precipitation and evapotranspiration (i.e.,<br />
evaporation + transpiration) in a particular area, a condition often perceived as “normal”.<br />
It is also related to the timing (i.e., principal season of occurrence, delays in the start of the<br />
rainy season, occurrence of rains in relation to principal crop growth stages) and the<br />
effectiveness (i.e., rainfall intensity, number of rainfall events) of the rains. Other climatic<br />
factors such as high temperature, high wind, and low relative humidity are often<br />
associated with drought in many regions of the world and can significantly aggravate its<br />
severity.<br />
Drought should not be viewed as merely a physical phenomenon or natural event. Its<br />
impacts on society result from the interplay between a natural event (less precipitation than<br />
expected resulting from natural climatic variability) and the demand people place on water<br />
supply. Human beings often exacerbate the impact of drought. Recent droughts in both<br />
developing and developed countries and the resulting economic and environmental<br />
impacts and personal hardships have underscored the vulnerability of all societies to this<br />
hazard.
A Regional Overview All-Hazard Mitigation Plan 103<br />
There are two main kinds of drought definitions: conceptual and operational. Conceptual<br />
definitions, formulated in general terms, help people understand the concept of drought.<br />
Drought is a protracted period of deficient precipitation resulting in extensive damage to<br />
crops, resulting in loss of yield. Operational definitions help define the onset, severity, and<br />
end of droughts. No single operational definition of drought works in all circumstances,<br />
and this is a big part of why policy makers, resource planners, and others have more<br />
trouble recognizing and planning for drought than they do for other disasters. In fact,<br />
most drought planners now rely on mathematic indices to decide when to start<br />
implementing water conservation or drought response measures. Conceptual definitions<br />
may also be important establishing when drought conditions are beyond those that could<br />
be considered part of normal risk management.<br />
In the early 1980s, research by Donald A. Wilhite, director of the National Drought<br />
Mitigation Center, and Michael H. Glantz, of the National Center for Atmospheric<br />
Research, uncovered more than 150 published definitions of drought. The definitions<br />
categorized in terms of four basic approaches to measuring drought: meteorological,<br />
hydrological, agricultural, and socioeconomic. The first three approaches deal with ways to<br />
measure drought as a physical phenomenon. The last approach deals with drought in<br />
terms of supply and demand, tracking the effects of water shortfall as it ripples through<br />
socioeconomic systems.<br />
Meteorological drought is usually an expression of precipitation’s departure from normal<br />
over some period of time. These definitions are usually region-specific, and presumably<br />
based on a thorough understanding of regional climatology. Meteorological measurements<br />
are the first indicators of drought.<br />
Agricultural drought occurs when there is not enough soil moisture to meet the needs of a<br />
particular crop at a particular time. Agricultural drought happens after meteorological<br />
drought but before hydrological drought. Agriculture is usually the first economic sector to<br />
be affected by drought. Agricultural drought links various characteristics of meteorological<br />
(or hydrological) drought to agricultural impacts, focusing on precipitation shortages,<br />
differences between actual and potential evapotranspiration, soil water deficits, reduced<br />
ground water or reservoir levels, and so forth. A good definition of agricultural drought<br />
should be able to account for the variable susceptibility of crops and soil moisture during<br />
different stages of crop development, from emergence to maturity.<br />
Hydrological drought refers to deficiencies in surface and subsurface water supplies. It is<br />
measured as streamflow and as lake, reservoir, and groundwater levels. There is a time lag<br />
between lack of rain and less water in streams, rivers, lakes, and reservoirs. When<br />
precipitation is reduced or deficient over an extended period of time, this shortage will be<br />
reflected in declining surface and subsurface water levels. Hydrological drought is<br />
associated with the effects of shortfall in periods of precipitation (including snowfall) on<br />
surface or subsurface water supply (i.e., streamflow, reservoir and lake levels, ground<br />
water). The frequency and severity of hydrological drought is often defined on a watershed<br />
or river basin scale. It takes longer for precipitation deficiencies to show up in components
104<br />
<strong>Jefferson</strong> <strong>County</strong> – Section 2<br />
of the hydrological system such as soil moisture, streamflow, and ground water and<br />
reservoir levels. As a result, these impacts lag behind impacts in other economic sectors. For<br />
example, a precipitation deficiency may result in a rapid depletion of soil moisture that is<br />
almost immediately discernible to agriculturalists, but the impact of this deficiency on<br />
reservoir levels may not affect hydroelectric power production or recreational uses for many<br />
months. Also, water in reservoirs or rivers is often used for multiple and competing<br />
purposes (e.g., flood control, irrigation, recreation, navigation, hydropower, wildlife<br />
habitat). This further complicates the sequence and quantification of impacts. Competition<br />
for water in these storage systems escalates during drought and conflicts between water<br />
users increase significantly.<br />
Hydrological Hydrological Drought Drought and and Land Land Use<br />
Use<br />
Although climate is a primary contributor to hydrological drought, other factors such as<br />
changes in land use (e.g., deforestation), land degradation, and the construction of dams<br />
all affect the hydrological characteristics of the basin. Because regions are interconnected<br />
by hydrologic systems, the impact of meteorological drought may extend well beyond the<br />
borders of the precipitation-deficient area. Similarly, changes in land use upstream may<br />
alter hydrologic characteristics such as infiltration and runoff rates, resulting in more<br />
variable streamflow and a higher incidence of hydrologic drought downstream.<br />
Bangladesh, for example, has shown an increased frequency of water shortages in recent<br />
years because land use changes have occurred within the country and in neighboring<br />
countries. Land use change is one of the ways human actions alter the frequency of water<br />
shortage even when no change in the frequency of meteorological drought has been<br />
observed.<br />
For the purposes of drought response planning, all three categories (meteorologic,<br />
hydrologic and agriculture) can be regarded as equivalent, since each one relates to the<br />
occurrence of drought to water shortfalls in some component of the hydrologic cycle. The<br />
most commonly used drought severity indicators are the Palmer Drought Severity Index<br />
(PDSI) and the Crop Moisture Index, published by NOAA and the USDA. The PDSI is more<br />
widely used than any other single indicator. It provides a standardized means of depicting<br />
drought severity throughout the US. It measures the departure of water supply (in terms<br />
of precipitation and stored soil moisture) from demand (the amount of water required to<br />
recharge soil and keep rivers, lakes and reservoirs at normal levels). By relating these<br />
figures to the previous regional index a continuous stream of data is created reflecting<br />
long-term wet or dry tendencies.<br />
Socioeconomic drought occurs when physical water shortage starts to affect people,<br />
individually and collectively.<br />
The Palmer Drought Severity Index relates climate and weather to prolonged and abnormal<br />
soil moisture deficiencies affecting water sensitive economies in the US. The index is useful<br />
in delineating disaster areas and indicating the availability of irrigation water supplies,
A Regional Overview All-Hazard Mitigation Plan 105<br />
reservoir levels, range conditions, amount of stock water, and potential intensity of forest<br />
fires.<br />
Missouri has six regions that display similar climatic characteristics. For each region,<br />
drought severity can be determined according to the following Table J41:<br />
TABLE TABLE J41 J41 PALMER PALMER CLASSIFICATIONS<br />
CLASSIFICATIONS<br />
Palmer Palmer Classifications<br />
Classifications<br />
4.0 or more extremely wet<br />
3.0 to 3.99 very wet<br />
2.0 to 2.99 moderately wet<br />
1.0 to 1.99 slightly wet<br />
0.5 to 0.99 incipient wet spell<br />
0.49 to -0.49 near normal<br />
-0.5 to -0.99 incipient dry spell<br />
-1.9 to -1.99 mild drought<br />
-2.0 to -2.99 moderate drought<br />
-3.0 to -3.99 severe drought<br />
-4.0 or less extreme drought<br />
City of St. Louis, St. Louis, St. Charles and Franklin counties are included in the northeast<br />
Region 2 that displays similar climatic characteristics. <strong>Jefferson</strong> <strong>County</strong> is included in the<br />
southeast Region 5. See Figure J46 below.
106<br />
Characteristics<br />
Characteristics<br />
FIGURE FIGURE J46 J46 MISSOURI MISSOURI DROUGHT DROUGHT REGIONS<br />
REGIONS<br />
Source: Missouri Department of Natural Resources<br />
<strong>Jefferson</strong> <strong>County</strong> – Section 2<br />
Drought characteristics include economic, social and environmental. The 1930s drought’s<br />
direct effect is most often remembered as agricultural. Deficient rainfall, high<br />
temperatures, and high winds, as well as insect infestations and dust storms that<br />
accompanied these conditions damaged many crops. Although records focus on other<br />
problems, the lack of precipitation would also have affected wildlife and plant life, and<br />
would have created water shortages for domestic needs. The severity and aerial coverage<br />
of the event played a part in making the 1930s drought the widely accepted drought of<br />
record for the United States.<br />
Likely Likely Locations ocations ocations<br />
According to the State Drought Plan, Missouri is broken up into six climate divisions.<br />
Franklin, St Charles, St. Louis City and St. Louis Counties are all found in the southeastern<br />
section of climate Division 2. <strong>Jefferson</strong> <strong>County</strong> is in the northeast corner of climate Division<br />
5. Based on the NDMC historic drought mapping of Regions 2 and 5, the most common<br />
area for drought conditions to occur is within Region 2 (including St. Louis City, St. Louis,<br />
St. Charles, and Franklin counties).
A Regional Overview All-Hazard Mitigation Plan 107<br />
The State of Missouri has a State Drought Plan in place. Missouri’s plan is such that it<br />
divides the state into three regions according to their susceptibility to drought depending<br />
on the characteristics of surface and ground water supplies. Regions were judged to have<br />
slight, moderate or high susceptibility to drought. Poor groundwater resources, surface<br />
water supplies that become inadequate during extended drought and inadequate irrigation<br />
water supplies characterize areas within Region C, considered to have severe drought<br />
vulnerability. This region includes most of St. Louis <strong>County</strong> just south of the juncture of the<br />
Missouri and Mississippi Rivers. Areas in this region are designated as "Priority Drought<br />
Management Areas”. Areas within western St. Charles <strong>County</strong>, southern Franklin <strong>County</strong><br />
and most of central/western <strong>Jefferson</strong> <strong>County</strong> are included in Region B: Moderate<br />
Susceptibility to Drought. Areas along the Mississippi and Missouri River valley floodplain<br />
areas in the counties in this study are within Region A: Slight Susceptibility.<br />
Information obtained from the Missouri Drought Response Plan (Water Resources Report<br />
No. 44) has a map that depicts a similar concept of drought susceptibility. However, the<br />
NDMC and the Missouri Plan are not in total agreement on common areas of drought.<br />
The Missouri Drought Response Plan divides the state into three categories based on a<br />
slight, moderate or high susceptibility to drought. The Missouri Plan depicts St. Louis City<br />
as having a high susceptibility to drought, and St. Louis, Franklin, <strong>Jefferson</strong>, St. Charles<br />
Counties with a moderate susceptibility to drought. Certain Region A areas in St. Charles,<br />
St. Louis, and Franklin Counties that are underlain by alluvial sands and gravels have a low<br />
susceptibility to drought.<br />
The plan complements and supports the State Consolidated Plan and the State Emergency<br />
Operations Plan. Actions within the drought plan are triggered when the Palmer Drought<br />
Index reaches certain levels. The Drought Assessment Committee (DAC), chaired by the<br />
Director of the Department of Natural Resources, is activated in the Drought Alert Stage.<br />
The DAC then activates the Impact Task Forces, which cover the following topics:<br />
agriculture, natural resources and environmental recreation, water supplies, wastewater,<br />
health, social, economic and post drought evaluation.<br />
Type Type of of Damage<br />
The drought of 1988-89 cost the U. S. an estimated $39 billion. To provide perspective,<br />
estimated damages of the record flood of 1993 were in the range of $20 billion. The<br />
social and economic costs of drought are substantial. Given the extent to which the U. S.<br />
relies on acceptable water supply for health and well- being, the need for advanced<br />
drought planning is obvious. Types of damage can include the increasing incidence of<br />
range fires, depletion of groundwater supplies, poor crop growth, and a decrease in hay<br />
for cattle (overgrazing) conditions. A shortage of hay forces ranchers to sell cattle at low<br />
prices and food prices increase due to lower production levels for milk, meat, produce, and<br />
other foodstuffs. Drought also results in reduced revenues from recreational areas,<br />
environmental damages, contaminant levels in surface and groundwater rise due to<br />
decrease in volume of stream flow. There can be a loss in revenues from agriculturally
108<br />
<strong>Jefferson</strong> <strong>County</strong> – Section 2<br />
related industries such as harvesting, trucking, and food processing. Reduced irrigation<br />
water led to a reduction in vegetable production, with concomitant losses in jobs and<br />
income.<br />
Hazard Hazard Event History History<br />
Some of the worst droughts on record to affect Region 2 in Missouri occurred in 1901-02,<br />
1913-14, 1930-31, 1934, 1936, 1940-41, 1953-56, 1963-64, 1980-81, 1988-89, 1999-<br />
2000 and 2005-2007. The 1953-56 drought is considered to be the worst on record for<br />
Region 2.<br />
Droughts on record to affect Region 5 in Missouri occurred in 1900-09, 1940-49, 1950-<br />
59, 1964-66, 1980 and 2005-2007. The drought from 1954-56 was the worst on record<br />
for Region 5. Table J42 below shows the Big River level stage during drought conditions.<br />
TABLE TABLE J42 J42 J42 RIVER RIVER LEVEL LEVEL STAGES STAGES IN IN DROUGHT DROUGHT CONDITIONS CONDITIONS IN IN JEFFERSON<br />
JEFFERSON<br />
COUNTY COUNTY<br />
COUNTY<br />
Station Station<br />
Stage (Flood Stage 16 ft) Date<br />
Big River at Byrnes Mill 1.5 8/30/1936<br />
1.5 9/13/2000<br />
1.4 10/05/2001<br />
An overall excellent drought resource on the Internet is the National Drought Mitigation<br />
Center (NDMC). The NDMC provides historical drought information for the U.S. from 1895<br />
through current. Linking to the following address will provide drought information:<br />
http://www.drought.unl.edu/whatis/what.htm<br />
Table J43 identifies, using the Palmer Drought Severity Index, the monthly average for the<br />
period of record for the study area.<br />
TABLE TABLE TABLE J43 J43 PALMER DROUGHT SEVERITY INDEX MONTHLY<br />
AVERAGE AVERAGE FOR FOR FOR PERIOD PERIOD PERIOD OF OF OF RECORD RECORD<br />
RECORD<br />
1895 TO 1995<br />
Mon Month Mon th Division 22<br />
2<br />
Division 5<br />
January -0.06 -0.04<br />
February -0.42 -0.94<br />
March -0.66 -1.16<br />
April -0.99 -1.70<br />
May -1.23 -1.62<br />
June -1.17 0.57<br />
July 1.24 1.64<br />
August 1.68 1.65<br />
September 1.48 -0.40<br />
October 0.65 -0.93<br />
November 0.81 0.30
A Regional Overview All-Hazard Mitigation Plan 109<br />
TABLE TABLE TABLE J43 J43 J43 PALMER DROUGHT SEVERITY INDEX MONTHLY<br />
AVERAGE AVERAGE FOR FOR PERIOD PERIOD OF OF RECORD<br />
RECORD<br />
1895 TO 1995<br />
December 2.37 1.79<br />
Within the past few years, the National Drought Mitigation Center has created a U.S.<br />
drought map that utilizes numerous indicators to determine the severity of a drought.<br />
These indicators include the Palmer Index, Crop Moisture Index, Standardized Precipitation<br />
Index, Percent of Normal Rainflow, Daily Streamflow, Snowpack, Soil Moisture, Vegetative<br />
Index, and Fire Danger Classifications. There is also a lot of subjectivity that goes into the<br />
map. The drought authors take heavily into consideration the input they receive from local<br />
experts in terms of the impacts that are being felt.<br />
Frequency Frequency of of Occurrence Occurrence<br />
The NDMC has developed a graphic historic representation of the frequency of occurrence<br />
of areas within the upper Mississippi River Basin experiencing severe to extreme drought<br />
from 1895 to 1995. The graph below depicts the percentage of areas of the upper<br />
Mississippi River Basin that were impacted by drought, including climatic zones 2 and 5.<br />
Based on the NCDC 1980 report, heat and drought events result in the highest damage (in<br />
the range of 120 billion dollars from 1980 to 1999 based on 46 weather related events)<br />
when compared to other natural weather hazards. See Figure J47 below.
110<br />
Intensity Intensity or or Strength trength trength<br />
FIGURE FIGURE J47 J47 SEASONAL SEASONAL DROUGHT<br />
DROUGHT<br />
<strong>Jefferson</strong> <strong>County</strong> – Section 2<br />
The Palmer Drought Severity Index can be utilized to determine the intensity or strength of<br />
droughts. Table J45 above lists the average monthly Palmer Drought Severity Index from<br />
1895 to 1995 for Regions 2 (St. Louis City, St. Louis <strong>County</strong>, St. Charles <strong>County</strong>, Franklin<br />
<strong>County</strong>) and 5 (<strong>Jefferson</strong> <strong>County</strong>).<br />
Lives Lives Lost, Lost, Injuries, Injuries, Property Property Damage, Damage, Economic Economic Economic Losses/Other Losses/Other Losses Losses<br />
Losses<br />
The drought of 1988-89 cost the U.S. an estimated $39 billion. To provide perspective,<br />
estimated damages of the record flood of 1993 were in the range of $12-$16 billion. The<br />
social and economic costs of drought are substantial. Given the extent to which the U.S.<br />
relies on acceptable water supply for health and well- being, the need for advanced<br />
drought planning is obvious.
A Regional Overview All-Hazard Mitigation Plan 111<br />
Although the 1988–89 drought was the most economically devastating disaster in the<br />
history of the United States (Riebsame et al., 1991), a close second is undoubtedly the<br />
series of droughts that affected large portions of the United States in the 1930s.<br />
Determining the direct and indirect costs associated with this period of droughts is a<br />
difficult task because of the broad impacts of drought, the event’s close association with<br />
the Great Depression, the fast revival of the economy with the start of World War II, and<br />
the lack of adequate economic models for evaluating losses at that time. However, broad<br />
calculations and estimates can provide valuable generalizations of the economic impact of<br />
the 1930s drought. In 1937, the Works Progress Administration (WPA) reported that<br />
drought was the principal reason for economic relief assistance in the Great Plains region<br />
during the 1930s (Link et al., 1937). The first federal funds marked specifically for drought<br />
relief were not released until the fall of 1933. In all, assistance may have reached $1 billion<br />
(in 1930s dollars) by the end of the drought (Warrick et al., 1980).<br />
According to the WPA, three-fifths of all first-time rural relief cases in the Great Plains area<br />
were directly related to drought, with a disproportionate amount of cases being farmers<br />
(68%) and especially tenant farmers (70% of the 68%). However, it is not known how<br />
many of the remaining cases (32%) were indirectly affected by drought. The WPA report<br />
also noted that 21% of all rural families in the Great Plains area were receiving federal<br />
emergency relief by 1936 (Link et al., 1937); the number was as high as 90% in hard-hit<br />
counties (Warrick, 1980). Thus, even though the exact economic losses are not known for<br />
this time period, they were substantial enough to cause widespread economic disruption<br />
that affected the entire nation.<br />
Seasonal Seasonal Seasonal Pattern<br />
Pattern<br />
Based on Table J45 above from Missouri Regions 2 and 5, a trend emerges of mild drought<br />
occurring from January through May from the period of record from 1895 to 1995.<br />
Speed Speed Speed of f Onset Onset Onset And/Or And/Or Existing Existing Warning Warning Systems<br />
Systems<br />
By nature, drought occurs very slowly. Existing warning systems have been developed by<br />
Missouri Department of Natural Resources (Missouri Drought Response Plan). The function<br />
of the plan is to assist in the response, monitoring and prediction, communication, and<br />
planning in the event of a drought. The plan provides for operations and administrative<br />
procedures that activate the Drought Assessment Committee, Impact Task Forces,<br />
Governor's Drought Executive Committee, and the State Emergency Operations Center. The<br />
Governor's declaration empowers state agencies to implement water shortage emergency<br />
actions. The statute or authority that regulates this activity is the State Water Resources<br />
Plan (Revised statutes of Missouri Chapters 640.415). The primary agencies involved in<br />
drought activities include: Missouri Dept. of Natural Resources (primary), Missouri Dept. of<br />
Agriculture, Missouri Dept. of Public Safety, Missouri Dept. of Conservation, Missouri Dept.<br />
of Social Services, University of Missouri-Columbia, DOC, USDA, US Army, DOI, EPA, and<br />
FEMA. The drought plan serves the following groups: water supply systems of individual<br />
ranchers and farmers, local governments, federal agencies, domestic water users, health
112<br />
<strong>Jefferson</strong> <strong>County</strong> – Section 2<br />
care facilities, public uses such as electric power generation, firefighting, key military<br />
facilities, communications, and wastewater systems.<br />
As a part of the plan, monthly drought monitoring (consisting of water monitoring data<br />
and weather data) is provided to the State Emergency Management Agency by the<br />
Department of Natural Resources and the National Weather Service. MDNR utilizes the<br />
Palmer Drought Index as a trigger to determine drought phases and actions to be taken.<br />
Palmer greater than or equal to -1.0: Phase 1 (Advisory Phase)<br />
Palmer -1.0 to -2.0: Phase 2 (Drought Alert)<br />
Palmer -2.0 to -4.0: Phase 3 (Conservation Phase)<br />
Palmer less than or equal to -4.0: Phase 4 (Possible Local Rationing Phase)<br />
Once the data demonstrates that there is a Phase 2 drought condition, the Water<br />
Resources Program Director declares drought alert for any region of the state and the<br />
Director of the Department of Natural Resources may activate and chair the Drought<br />
Assessment Committee (DAC). The DAC then activates the Impact Task Forces that include<br />
the following Departments:<br />
Agriculture<br />
Natural Resources and Environmental Recreation<br />
Water Supplies and Wastewater<br />
Health<br />
Social<br />
Economic<br />
Post Drought Evaluation<br />
The state drought plan still has unmet needs at federal, state, local levels. These needs<br />
include changes from customer or "provider" perspective: 1) lack of U.S. coordinated<br />
response to meld with state response plan, 2) need for state climatologist to be available<br />
for consultation, and 3) lack of a permanent source or mechanism of drought response<br />
and mitigation funds at the federal or state level.<br />
There are program limitations to the state drought plan: 1) early stages are voluntary<br />
conservation measures, 2) state mitigation grant or loan funds are limited and may be<br />
available only through mechanisms not well coordinated with emergency response plan.<br />
Map Map of of Hazards azards<br />
Figure J48 below depicts the percent of time the various regions spent in severe and<br />
extreme drought conditions from 1895 to 1995. This is defined as the percentage of time<br />
when the Palmer Drought Severity Index was less than or equal to –3.0. Refer to Figure J45<br />
(located in the back of the Technical Appendix) for another map of the hazard area.
A Regional Overview All-Hazard Mitigation Plan 113<br />
Statement Statement of f Probable Probable Future Future Severity<br />
Severity<br />
FIGURE FIGURE J48 J48 PALMER PALMER DROUGHT DROUGHT INDEX<br />
INDEX<br />
Utilizing MDNR’s drought response system as outlined above, the probable severity levels<br />
of future drought are as follows.<br />
Phase Phase Probable Probable Severity Severity<br />
Phase 1 Negligible<br />
Phase 2 Limited<br />
Phase 3 Critical<br />
Phase 4 Critical<br />
Statement Statement of f Probable Probable Risk/Likeliness Risk/Likeliness of f Future Future Occurr Occurrence Occurr ence<br />
The probable risk or likeliness of future occurrences of drought will most likely be similar to<br />
the climatologic past. However, the past number and severity of events is not necessarily a
114<br />
<strong>Jefferson</strong> <strong>County</strong> – Section 2<br />
predictor of future occurrences. Based on information from the National Oceanic and<br />
Atmospheric Administration and FEMA, droughts occur approximately every 10 years in the<br />
EWG planning region.<br />
Phase Phase Probable Risk<br />
Phase 1 Likely<br />
Phase 2 Likely<br />
Phase 3 Possible<br />
Phase 4 Possible<br />
Statement Statement Statement of of Next Next Disaster’s Disaster’s Lik Likely Lik Likely<br />
ely Adverse Impact on on Community<br />
Community<br />
The next drought will possibly have a detrimental impact on the community in terms of<br />
agricultural (lawns), economic (social) and environmental based upon the past historic<br />
drought events.<br />
Without Without Mitigation Mitigation Measures<br />
Measures<br />
Life Negligible<br />
Property Limited<br />
Emotional Limited<br />
Financial Critical<br />
Comments None<br />
With With Mitigation Mitigation Measures<br />
Measures<br />
Life Negligible<br />
Property (crop damage) Negligible<br />
Emotional Limited<br />
Financial Limited<br />
Comments Education of city residents on watering restrictions of<br />
lawns<br />
Recommendation<br />
Recommendation<br />
Education of city residents on watering restrictions of lawns.<br />
Heat Heat Heat Wave Wave Wave Hazard Hazard Profile<br />
Profile<br />
Description<br />
Description<br />
Heat wave is defined as a prolonged period of excessive heat and humidity with more than<br />
48 hours of high heat (90 o F or higher) and high humidity (80 percent relative humidity or<br />
higher) are expected. The National Weather Service steps up its procedures to alert the<br />
public during these periods of excessive heat and humidity. Based on the NCDC 1980<br />
report, heat and drought events result in the highest damage (in the range of $120 billion
A Regional Overview All-Hazard Mitigation Plan 115<br />
from 1980 to 1999 based on 46 weather related events) when compared to other natural<br />
weather hazards.<br />
Although heat waves are not often taken as seriously as other forms of severe weather, the<br />
mortality from these weather events in the U. S. from 1979 to 1998 is greater than the<br />
number of lives claimed by lightning, hurricanes, tornadoes, floods, and earthquakes<br />
combined (National Center for Environmental Health). Even during a normal year without<br />
a catastrophic heat wave, the National Weather Service claims that an average of about<br />
175 people succumb to summer heat. This number does not include deaths of people<br />
already in poor health, whose deaths may have been advanced by exposure to extreme<br />
heat. Despite the presence of improving technology (e.g., air conditioning, architectural<br />
design, and improved accuracy in weather forecasting), heat waves continue to take many<br />
lives. From the early 20th century to the present time, Americans have experienced a<br />
significant rise in the cost of property damage from severe weather events, while at the<br />
same time the number of lives lost has decreased. Unfortunately, it appears that heat<br />
waves have not followed the same trend.<br />
Like all other major weather events, a heat wave cannot be prevented from developing.<br />
Serious consideration should be given to how our communities deal with heat waves when<br />
they occur. First, it is often the case that many fatalities during even the most severe heat<br />
waves occur after the first day of extreme heat. This means that there is time to help<br />
people who do not have, or cannot afford, air conditioning. People in the U. S. over 65<br />
years old are especially vulnerable to extreme heat, and this population is expected to grow<br />
in the very near future.<br />
Heat waves of the past have often been more intense in urban areas. More people would<br />
be at risk when a heat wave occurs in the region and power companies would be heavily<br />
stressed trying to keep more people cool.<br />
Scientists have observed that the average global temperature increased by the end of the<br />
20th century. This could pose an even greater problem for northern cities in the U.S.,<br />
where people are not accustomed to long periods of high heat. Finally, there are a few<br />
other societal impacts to be considered such as: water usage (heat waves often occur<br />
during droughts), air pollution building up during heat waves, and the economic impact of<br />
keeping millions of people cool.<br />
Social conditions are major players in the hazards posed by heat waves. People most<br />
affected by heat waves are the elderly and low income. In addition, there are still problems<br />
with getting heat wave information out to all members of the public. Often, as with any<br />
nature disaster impacted a city, it is not considered that many U.S. cities where English is<br />
not their primary language.<br />
Because problems still exist when dealing with heat waves in U.S. cities at the community<br />
level, further solutions should come from the community level. In the case of Philadelphia,<br />
both the NWS and Department of Public Health cooperate to reduce heat wave impacts,
116<br />
<strong>Jefferson</strong> <strong>County</strong> – Section 2<br />
and in Chicago the city government and human services departments also work hard to<br />
reduce impacts. Additional solutions may come from community organizations working to<br />
reduce heat wave impacts. An example of this can be seen in San Leandro, California's<br />
"Triad Alliance" where community-based organizations, emergency management<br />
departments, and the city government work together to mitigate disasters associated with<br />
earthquakes. In the case of heat waves, the city government or mayor's office could still<br />
facilitate the registering of people for well-being checks, but then distribute the lists of<br />
people to be checked to the community organizations.<br />
The challenge with developing community heat wave response organizations is finding<br />
enough dedicated members to assist during heat waves or keeping the organization<br />
prepared and ready to mobilize during the warmer parts of the year in U.S. cities. More<br />
people may start to care the next time a heat wave threatens their community.<br />
Education programs could also be given in schools. Children and young adults can<br />
participate in the community organizations and become aware of the risks of excessive<br />
heat exposure to young people (for example, overexertion during excessive heat periods).<br />
Of course, some younger people and employers would have to make sacrifices during a<br />
heat wave to put work aside and mobilize the community organizations to deal with the<br />
situation. Looking at a whole city during a heat wave, we can compare it to a person.<br />
When there is excessive heat a doctor would probably tell a person to rest and "take it<br />
easy." The same could be said for a city as a whole, continue to function, but to slow down<br />
during a heat wave and allow communities to come together to keep their people safe<br />
during a heat wave. Chicago Mayor Richard M. Daley mentioned the importance of the<br />
whole city's cooperation in his 1996 Summer Heat Preparedness Speech: "I want to<br />
continue to stress, however, that the city's efforts alone cannot prevent the tragedies<br />
related to extreme heat. We need everyone to get involved." (Daley 1996).<br />
Extreme heat is a hazard that could rapidly increase in magnitude in the 21 st century. The<br />
increasingly urbanization of the world’s population results in increasing numbers of<br />
vulnerable people. Global warming also dictates a need to improve heat wave mitigation<br />
and response systems.<br />
Heat kills by taxing the human body beyond its abilities. In a normal year, about 175<br />
Americans succumb to the demands of summer heat. Among the large continental family<br />
of hazards, only the cold of winter--not lightning, hurricanes, tornadoes, floods, or<br />
earthquakes-- takes a greater toll. In the 40-year period from 1936 through 1975, nearly<br />
20,000 people were killed in the United States by the effects of heat and solar radiation. In<br />
the disastrous heat wave of 1980, more then 1,250 people died. These are just the direct<br />
casualties of heat waves. It is not known how many more deaths are advanced by heat<br />
wave weather.<br />
North American summers are hot; most summers see heat waves in one section or another<br />
of the United States. <strong>East</strong> of the Rockies, and especially in the St. Louis Metropolitan area,
A Regional Overview All-Hazard Mitigation Plan 117<br />
they tend to combine both high temperature and high humidity, although some of the<br />
worst heat waves have been catastrophically dry.<br />
In response to the tragic death toll of 1980, the National Weather Service (NWS) has<br />
stepped up its efforts to more effectively alert the general public and appropriate<br />
authorities to the hazards of heat waves.<br />
Based on the latest research findings, the NWS has devised the "Heat Index"(HI),<br />
(sometimes referred to as the "apparent temperature"). The HI, given in degrees F, is an<br />
accurate measure of how hot it really feels when the relative humidity (RH) is added to the<br />
actual air temperature.<br />
To find the HI, look at the Heat Index Chart in Figure J49 below. As an example, if the air<br />
temperature is 95 degrees F (found on the left side of the chart) and the RH is 55% (found<br />
at the top of the chart), the HI- or how hot it really feels-- is 110 degrees F. This is at the<br />
intersection of the 95-degree row and the 55% column.<br />
FIGURE FIGURE J49 J49 HEAT HEAT INDEX<br />
INDEX<br />
Source: National Weather Service<br />
The stagnant atmospheric conditions of a heat wave trap pollutants in urban areas and<br />
add the stresses of severe pollution to the already dangerous affects of hot weather,<br />
creating a health problem of undiscovered dimensions. A map of heat related deaths in St.<br />
Louis during 1966, for example, shows a heavier concentration in the crowded alleys and<br />
towers of the inner city, where air quality would also be poor during a heat wave.
118<br />
<strong>Jefferson</strong> <strong>County</strong> – Section 2<br />
The high inner-city death rates also result from poor access to air-conditioned rooms. While<br />
air-conditioning may be a luxury in normal times, it can be a lifesaver during heat wave<br />
conditions. Indications from the 1978 Texas heat wave suggest that some elderly people<br />
on fixed incomes, many of them in buildings that could not be ventilated without air<br />
conditioning, found the cost too high, turned off their units, and ultimately succumbed to<br />
the stresses of heat.<br />
Characteristics<br />
Characteristics<br />
Characteristics<br />
A heat wave moves over an area as a large, deep air mass with descending air, retarding<br />
the development of any significant precipitation that would provide relief to the ground<br />
surface's rising temperatures. As this air mass moves slowly or just sits over one area for<br />
days or even weeks, its rising surface temperatures begin to take its toll on the people who<br />
are trapped in it.<br />
Likely Likely Locations<br />
Locations<br />
Heat wave weather in the St. Louis Region is different that other hazards such as tornadoes<br />
in that the hazard tends to occur over a much larger area, often times affecting from<br />
several counties to multiple states.<br />
Type Type of of Damage<br />
Damage<br />
Heat kills by taxing the human body beyond its abilities. Normally, the body has ways of<br />
keeping itself cool, by letting heat escape through the skin, and by evaporating sweat<br />
(perspiration). If the body does not cool properly, the victim may suffer a heat-related<br />
illness. Anyone can be susceptible although the very young and very old are at greater risk.<br />
Heat-related illnesses can become serious or even deadly if unattended. Damage to the<br />
body ranges from heat cramps to death.<br />
• Heat Heat Cramps: Cramps: Heat cramps are muscular pains and spasms due to heavy exertion.<br />
They usually involve the abdominal muscles or the legs. It is generally thought that<br />
the loss of water and salt from heavy sweating causes the cramps.<br />
• Heat Heat Heat Exhaustion: Exhaustion: Heat exhaustion is less dangerous than heat stroke. It typically<br />
occurs when people exercise heavily or work in a warm, humid place where body<br />
fluids are lost through heavy sweating. Fluid loss causes blood flow to decrease in<br />
the vital organs, resulting in a form of shock. With heat exhaustion, sweat does not<br />
evaporate as it should, possibly because of high humidity or too many layers of<br />
clothing. As a result, the body is not cooled properly. Signals include cool, moist,<br />
pale, flushed or red skin; heavy sweating; headache; nausea or vomiting; dizziness;<br />
and exhaustion. Body temperature will be near normal.<br />
• Heat Heat Stroke: Stroke: Also known as sunstroke, heat stroke is life-threatening. The victim's<br />
temperature control system, which produces sweating to cool the body, stops<br />
working. The body temperature can rise so high that brain damage and death may<br />
result if the body is not cooled quickly. Signals include hot, red and dry skin;
A Regional Overview All-Hazard Mitigation Plan 119<br />
changes in consciousness; rapid, weak pulse; and rapid, shallow breathing. Body<br />
temperature can be very high--sometimes as high as 105 o F.<br />
Hazard Hazard Event Event History<br />
History<br />
The St. Louis Metropolitan area experienced a heat wave in July 1980. It was the first real<br />
prolonged period of extreme heat for the metropolitan area since 1966 when 246 heat<br />
deaths were reported. The heat began around the 4th of July. By July 12th, it was apparent<br />
that there was a very real crisis in the City of St. Louis. Emergency Medical Services (EMS)<br />
crews were finding dead or very ill persons in many areas of the city. Most were elderly<br />
persons living alone and many had been dead for several days before being discovered. City<br />
officials recommended to the mayor that a heat emergency be declared. The Governor<br />
mobilized the National Guard. They searched door-to-door for victims. The Army Reserve<br />
supplied portable air-conditioning to non-air-conditioned parts of City Hospital. The<br />
American Red Cross opened emergency shelters. In 1980, 113 heat deaths were reported.<br />
In August 1980, a team of researchers from the U.S. Centers for Disease Control was sent<br />
to St. Louis and Kansas City, Missouri, to find out why, when the July 1980 heat wave<br />
affected a quarter of the country (the southeast), the death rates were excessively high in<br />
these two cities. A case-control study outlined the reasons found and the risk factors for<br />
heat illness and death in two articles published in the Journal of the American Medical<br />
Association in June 1982.<br />
Early in l981, city officials and representatives began meeting to form an organization to<br />
prevent the crisis of 1980 from happening again. The first community-wide meeting was<br />
held in December l981 after an announced cut in federal energy assistance funds. This was<br />
the beginning of Operation Weather Survival (OWS).<br />
At the same time, the City of St. Louis Department of Health and Hospitals put together a<br />
heat illness prevention plan, titled "The Lion in Summer," that included a slide/sound show<br />
and speakers (health educators and EMS personnel) that was marketed to community and<br />
senior citizens' groups throughout the summer of l981 and again in 1982. Heat and cold<br />
illnesses were also made reportable, first by the St. Louis City Health Commissioner and<br />
eventually by the Missouri Department of Health.<br />
By 1982, health officials in the City of St. Louis and St. Louis <strong>County</strong> had developed a joint<br />
plan to monitor summer temperatures that would quickly warn citizens of anticipated<br />
periods of excessive heat. This was done through the Wet Bulb Glove Temperature that was<br />
used in St. Louis until 1997 when the protocol was changed at the request of the National<br />
Weather Service (NWS) to reflect the terminology used across the nation by the NWS.<br />
OWS began as a formal contract in 1982 between the City and several social service<br />
agencies to provide necessary assistance during periods of extreme heat or cold. It<br />
eventually became a broad group of public health, government, human service, utilities,<br />
and for-profit companies and agencies that worked together to prevent illness or death
120<br />
<strong>Jefferson</strong> <strong>County</strong> – Section 2<br />
from either extreme heat or cold. In l996, a more formal structure was initiated to assure<br />
the continuation of the organization because of many changes in the community and a<br />
drop in attendance at meetings. OWS is staffed by the United Way and now includes all<br />
the major counties in Missouri and Illinois that are considered part of the Metropolitan St.<br />
Louis area.<br />
St. Louis region experienced additional heat waves in l993, 1988 and in 1995 without<br />
again experiencing death rates close to those in 1980. The major challenges of the ongoing<br />
heat illness prevention program are, first, reaching the truly isolated elderly, high risk<br />
person who has no meaningful interaction with anyone, and second, convincing many<br />
seniors that they are at risk and that air-conditioning will save lives.<br />
The major programs of heat illness prevention through NWS, in addition to the monitoring,<br />
warning, education and data collection system of the health departments, are:<br />
• A very successful air-conditioner loan program, funded by Union Electric Company<br />
(now Ameren UE). The window air-conditioners are loaned, installed and<br />
maintained for individuals who apply to the program with a medical "prescription."<br />
At least 50 new air-conditioners are purchased each year.<br />
• A program to weatherize homes for low-income elderly and disabled persons.<br />
• Programs to provide energy assistance for low-income elderly and disabled persons.<br />
• Information and referral for help, including home visits to high-risk individuals and<br />
transportation to services, by a number of agencies.<br />
• Emergency shelter through the St. Louis Homeless Network.<br />
• Monitoring of weather by representatives of the National Weather Service.<br />
• A free telephone reassurance program offered to all high-risk individuals during<br />
declared periods of unusual heat or cold by a for-profit company, called TelAssure.<br />
• A system of neighborhood institutions, primarily senior citizen centers, that offers<br />
air-conditioned relief from the heat for the hottest part of the day.<br />
• A well-informed media in St. Louis that provide invaluable assistance with<br />
dissemination of needed information throughout the community.<br />
Refer to Table J44 for a history of heat wave occurrences.<br />
TABLE TABLE J44 J44 TOP TOP FIFTEEN FIFTEEN CONSECUTIVE CONSECUTIVE DAYS WITH TEMPERATURES 90 90<br />
90<br />
DEGREES DEGREES DEGREES OR OR HIGHER IN ST. LOUIS METROPOLITAN AREA<br />
DATES DATES DATES<br />
CONSECUTIVE DAYS TEMPERATURE TEMPERATURE RANGES<br />
June-August, 1980 28+ days 100+<br />
July 2-July 29, 1936 28 days 108<br />
July 20- August 11, 1941 23 days N.A.<br />
July 11- July 31, 1916 21 days N.A.<br />
August 8-August 28, 1936 21 days 108<br />
June 17-July 7, 1954 21 days 110-115<br />
July 15- August 30, 1901 20 days 100+<br />
June 28-July 17, 1921 20 days N.A.<br />
July 8-July 26, 1934 19 days 108-111
A Regional Overview All-Hazard Mitigation Plan 121<br />
TABLE TABLE J44 J44 J44 TOP FIFTEEN CONSECUTIVE DAYS WITH TEMPERATURES 90<br />
90<br />
DEGREES DEGREES DEGREES OR OR HIGHER IN ST. LOUIS METROPOLITAN AREA AREA<br />
DATES DATES DATES<br />
CONSECUTIVE DAYS TEMPERATURE TEMPERATURE RANGES<br />
July 2- July 20, 1937 19 days N.A.<br />
June 19-July 6, 1901 18 days 106-107<br />
August 3- August 9, 1930 7 days 100+<br />
July 27- August 2, 1953 7 days 100+<br />
July 9- July 14, 1966 6 days 100+<br />
June 27- July 1, 1931 5 days 100<br />
Frequency Frequency Frequency of of Occurrence<br />
Occurrence<br />
Heat waves are sporadic phenomena. Frequency, intensity, and duration of heat waves,<br />
however, vary drastically from year to year. As can be seen from the Table J46 above, there<br />
have been 14 periods of heat waves ranging from a minimum of five consecutive days to a<br />
maximum of 28 days, all over 90 degrees.<br />
Intensity Intensity or or Strength<br />
Strength<br />
Heat waves are sporadic phenomena that occur throughout the United States and<br />
specifically the St. Louis metropolitan area. Frequency, intensity, and duration of heat<br />
waves, however, vary drastically from year to year. The highest temperature documented<br />
during the longest heat wave of 28 days was 108 degrees.<br />
Lives Lives Lost, Lost, Injuries, Injuries, Property Property Property Damage, Damage, Damage, Economic Economic Losses/Other Losses/Other Losses Losses<br />
Losses<br />
Compared to other meteorological hazards that pose threats to property and human<br />
health (e.g., floods, hurricanes, and tornadoes), heat waves rank first as the cause of<br />
human mortality. Extremes of heat have a broad and far-reaching set of impacts on the<br />
nation. These include significant loss of life and illness, economic costs in transportation,<br />
TABLE TABLE J45 J45 HEAT HEAT MORBIDITY MORBIDITY IN IN ST. ST. LOUIS LOUIS METROPOLIT<br />
METROPOLITAN METROPOLIT<br />
METROPOLITAN<br />
AN REGION<br />
REGION<br />
Year Year<br />
St. Louis City St. St. Louis <strong>County</strong> Outstate MO MO TOTAL<br />
1989 13 0 5 18<br />
1990 6 2 5 13<br />
1991 4 4 2 10<br />
1992 3 2 0 5<br />
1993 4 1 1 6<br />
1994 9 0 5 14<br />
1995 26 6 18 50<br />
1996 2 1 0 3<br />
1997 5 1 3 9<br />
1998 2 3 4 9<br />
1999 38 5 29 72<br />
2000 4 2 11 17<br />
2001 10 7 17 34
122<br />
<strong>Jefferson</strong> <strong>County</strong> – Section 2<br />
TABLE TABLE J45 J45 HEAT HEAT HEAT MORBIDITY MORBIDITY MORBIDITY IN IN ST. ST. ST. LOUIS LOUIS METROPOLIT<br />
METROPOLITAN METROPOLIT AN REGION<br />
REGION<br />
Year Year<br />
St. Louis City St. St. Louis <strong>County</strong> Outstate MO MO TOTAL<br />
2002 7 5 9 21<br />
Source: Missouri Department of Health and Social Services City of St Louis Department of Health<br />
agriculture, production, energy and infrastructure. In June to September 1980 the nation<br />
saw a devastating heat wave and drought that claimed at least 1,700 lives and had<br />
estimated economic costs $20 billion in 1980 dollars. Tables J45 above and J46 below<br />
identifies specific damages to the St. Louis metropolitan area<br />
TABLE TABLE J46 J46 J46 ST. ST. LOUIS LOUIS METROPOLITAN METROPOLITAN REGION REGION HEAT<br />
HEAT<br />
WAVES WAVES 11994<br />
1 994 TO 2008 AND AND ASSOCIATED ASSOCIATED DAMAGES<br />
DAMAGES<br />
Date Date Deaths Deaths Injuries Injuries Property<br />
Property<br />
Damage<br />
Damage<br />
Crop<br />
Crop<br />
Damage<br />
Damage<br />
06/12/1994 4 55 0 50K<br />
07/17/1995 20 225 75K 0.4M<br />
07/28/1995 0 120 15K 25K<br />
08/01/1995 9 230 0 400K<br />
05/17/1996 0 25 0 0<br />
06/18/1996 0 0 0 0<br />
06/22/1996 1 0 0 0<br />
06/30/1996 1 0 0 0<br />
07/07/1996 0 8 0 0<br />
07/18/1996 0 11 0 0<br />
06/25/1997 1 0 0 0<br />
07/12/1997 0 14 0 0<br />
07/20/1997 1 0 0 0<br />
08/17/1997 1 0 0 0<br />
06/23/1998 3 143 0 0<br />
07/18/1998 0 137 0 0<br />
08/23/1998 0 10 0 0<br />
09/04/1998 0 13 0 0<br />
07/18/1999 42 397 0 0<br />
07/02/2000 4 103 0 0<br />
08/28/2000 1 125 0 0<br />
09/01/2000 1 38 0 0<br />
06/18/2001 1 0 0 0<br />
07/07/2001 5 61 0 0<br />
07/17/2001 0 19 0 0<br />
07/21/2001 3 71 0 0<br />
07/29/2001 0 4 0 0<br />
08/01/2001 0 34 0 0
A Regional Overview All-Hazard Mitigation Plan 123<br />
TABLE TABLE J46 J46 J46 ST. ST. LOUIS LOUIS METROPOLITAN METROPOLITAN REGION REGION HEAT HEAT<br />
HEAT<br />
WAVES WAVES 11994<br />
1 994 TO 2008 AND AND ASSOCIATED ASSOCIATED DAMAGES<br />
DAMAGES<br />
Date Date Deaths Deaths Injuries Injuries Property<br />
Property<br />
Damage<br />
Damage<br />
Crop<br />
Crop<br />
Damage<br />
Damage<br />
08/07/2001 1 10 0 0<br />
08/12/2001 3 0 0 0<br />
08/21/2001 0 14 0 0<br />
05/31/2002 2 0 0 0<br />
06/01/2002 0 14 0 0<br />
06/25/2002 1 0 0 0<br />
07/08/2002 1 26 0 0<br />
07/17/2002 1 0 0 0<br />
07/20/2002 0 47 0 0<br />
07/26/2002 0 185 0 0<br />
08/01/2002 1 59 0 0<br />
08/26/2002 1 0 0 0<br />
07/03/2003 3 93 0 0<br />
08/15/2003 2 54 0 0<br />
08/24/2003 0 0 0 0<br />
07/09/2004 1 45 0 0<br />
07/20/2004 0 25 0 0<br />
06/06/2005 1 0 0 0<br />
06/23/2005 0 0 0 0<br />
07/20/2005 4 65 0 0<br />
07/13/2006 4 437 0 0<br />
07/29/2006 1 14 0 0<br />
08/01/2006 0 59 0 0<br />
08/07/2006 1 0 0 0<br />
05/12/2007 0 2 0 0<br />
05/13/2007 0 0 0 0<br />
08/04/2007 2 519 0 0<br />
07/20/2008 0 60 0 0<br />
Totals 128 3571 5.09M 875K<br />
Source: NCDC<br />
There are several impacts on transportation documented in case studies. Aircraft lose lift at<br />
high temperatures. The Phoenix airport has been closed due to periods of extreme heat<br />
that made aircraft operations unsafe. Highways and roads are damaged by excessive heat.<br />
Asphalt roads soften. Concrete roads have been known to "explode" lifting –three to four<br />
foot pieces of concrete. During the 1980 heat wave hundreds of miles of highways buckled<br />
(NOAA, 1980). Stress is placed on automobile cooling systems, diesel trucks and railroad<br />
locomotives. This leads to an increase in mechanical failures. Train rails develop sun kinks
124<br />
<strong>Jefferson</strong> <strong>County</strong> – Section 2<br />
and distort. Refrigerated goods experience a significant greater rate of spoilage due to<br />
extreme heat.<br />
Various sectors of the agriculture community are affected by extreme heat. Livestock are<br />
severely impacted by heat waves. Millions of birds have been lost during heat waves. Milk<br />
production and cattle reproduction also decreases during heat waves. Pigs are also<br />
adversely impacted by extreme heat. In terms of crop impacts in the summer of 1980, it is<br />
unclear what the impacts are of very high temperatures for a few days, versus the above<br />
average summer temperatures or the drought. High temperatures at the wrong time can<br />
inhibit crop yields. Wheat, rice, corn, potato, and soybean crop yields can all be<br />
significantly reduced by extreme high temperatures at key development stages.<br />
The electric transmission system is impacted when power lines sag in high temperatures. In<br />
2002 a major west coast power outage impacting four states was blamed in part on<br />
extreme high temperatures causing sagging transmission lines to short out. The<br />
combination of extreme heat and the added demand for electricity to run air conditioning<br />
causes transmission line temperatures to rise.<br />
The demand for electric power during heat waves is well documented. In 1980, consumers<br />
paid $1.3 billion more for electric power during the summer than the previous year. The<br />
demand for electricity, 5.5 percent above normal, outstripped the supply, causing electric<br />
companies to have rolling black outs.<br />
The demand for water increases during periods of hot weather. In extreme heat waves,<br />
water is used to cool bridges and other metal structures susceptible to heat failure. This<br />
causes a reduced water supply and pressure in many areas. This can significantly contribute<br />
to fire suppression problems for both urban and rural fire departments.<br />
The rise in water temperature during heat waves contributes to the degradation of water<br />
quality and negatively impacts fish populations. It can also lead to the death of many other<br />
organisms in the water ecosystem. High temperatures are also linked to rampant algae<br />
growth, causing fish kills in rivers and lakes.<br />
Locations/Areas Locations/Areas Locations/Areas Affected<br />
Affected<br />
Impacts from heat waves are widespread, not selective. Impacts and areas where there are<br />
impacts are dependent upon the weather systems, which affect wide expanses of land.<br />
Season Seasonal Season al Pattern<br />
Pattern<br />
Heat waves typically occur during the warm summer months including June, July and<br />
August as seen on Table J48 above.
A Regional Overview All-Hazard Mitigation Plan 125<br />
Speed Speed of of Onset Onset and/or and/or Existing Existing Warning Warning Systems<br />
Systems<br />
Heat wave weather in the St. Louis region slowly descends into the area. It is different that<br />
other hazards such as tornadoes in that the hazard tends to occur over a much larger area,<br />
often times affecting from several counties to multiple states.<br />
The NWS will initiate alert procedures when the Heat Index is expected to exceed 105<br />
degrees F to 110 degrees F (depending on the local climate) for at least two consecutive<br />
days. The expected severity of the heat determines whether advisories or warnings are<br />
issued. A common guideline for the issuance of excessive heat alerts is when the maximum<br />
daytime HI is expected to equal or exceed 105°F and a nighttime minimum HI of 80°F or<br />
above for two or more consecutive days. Some regions and municipalities are more<br />
sensitive to excessive heat than others. As a result, alert thresholds may vary substantially<br />
from these guidelines. Excessive heat-alert thresholds are being tailored at major<br />
metropolitan centers based on research results that link unusual amounts of heat-related<br />
deaths to city-specific meteorological conditions.<br />
The alert procedures are:<br />
• Include HI values in zone and city forecasts.<br />
• Issue Special Weather Statements and/or Public Information Statements presenting<br />
a detailed discussion of (1) the extent of the hazard including HI values, (2) those<br />
individuals most at risk, (3) safety rules for reducing the risk.<br />
• Assist state and local health officials in preparing Civil Emergency Messages in severe<br />
heat waves. Meteorological information from Special Weather Statements will be<br />
included as well as more detailed medical information, advice, and names and<br />
telephone numbers of health officials.<br />
• Release to the media and over NOAA's own Weather Radio all of the above<br />
information.<br />
Operation Weather Survival was created in l981 to address the needs of the community<br />
during extreme weather conditions. It is comprised of public and private organizations<br />
working together to prevent illness or death from extreme heat, cold conditions and<br />
ground level ozone. The phone number is 1-800-427-4626<br />
OWS OWS OWS Summer Summer Outreach Outreach Programs that work to prevent HEAT-related illness through OWS<br />
are:<br />
• Health Departments: Preventive education, temperature monitoring, alerts,<br />
warnings, and data collection<br />
• OWS Air-Conditioner Program: Provides air conditioners to individuals who are<br />
medically at risk. Air conditioners are purchased with funds primarily donated by<br />
AmerenUE.<br />
• Cooling Sites: Cooling sites are open year-round. During severe heat, hours and<br />
services are extended.<br />
• TelAssure Telephone Reassurance Services: Complimentary service at-risk individuals<br />
during weather emergency Agency referrals needed. TelAssure Telephone
126<br />
<strong>Jefferson</strong> <strong>County</strong> – Section 2<br />
Reassurance Services Utility Assistance: Assistance is provided through OWN<br />
member agencies to prevent electrical disconnection for individuals and families atrisk.<br />
Map Map of of Hazards<br />
Hazards<br />
Figure J45 (located in the back of the Technical Appendix) depicts the potential heat wave<br />
areas in the county. In addition, Figure J50 below depicts the Heat Wave Hazard Impact<br />
areas in the St. Louis Metropolitan area during the heat wave from 1980.<br />
FIGURE FIGURE J50 J50 1980 1980 MIDWEST MIDWEST HEAT HEAT WAVE<br />
WAVE<br />
Source: National Climatic Data Center
A Regional Overview All-Hazard Mitigation Plan 127<br />
Statement Statement of of Probable Probable Future Future Future Severity<br />
Severity<br />
Heat waves are sporadic phenomena that occur throughout the United States. Frequency,<br />
intensity, and duration of heat waves, however, vary drastically from year to year.<br />
The levels of severity, by Heat Index apparent temperature are found below.<br />
• Extreme Danger (heat stroke or sunstroke highly likely at 130 degrees F or<br />
higher).<br />
• Danger (sunstroke, muscle cramps, and/or heat exhaustion likely at 105 degrees F<br />
to 129 degrees F).<br />
• Extreme Caution (sunstroke, muscle cramps, and/or heat exhaustion possible at<br />
90 degrees F to 104 degrees F)<br />
• Caution (fatigue possible at less than 90 degrees F).<br />
The future probably severity for <strong>Jefferson</strong> <strong>County</strong> is shown below according to the Heat<br />
Index levels of severity.<br />
Heat Index Probable Severity<br />
Heat Index of 130°F or higher Catastrophic<br />
Heat Index of 105°F to 129°F Critical<br />
Heat Index of 90°F to 104°F Limited<br />
Heat Index of less than 90°F Negligible<br />
Statement Statement of of Probable Probable Risk/Likeliness Risk/Likeliness of of Future Future Occurrence<br />
Occurrence<br />
Heat waves are sporadic phenomena that occur throughout the United States. Frequency,<br />
intensity, and duration of heat waves, however, vary drastically from year to year.<br />
Based in information from the National Oceanic and Atmospheric Administration and<br />
FEMA there have been at least fifteen heat wave related events from 1901 to 1980 and 43<br />
periods of heat wave related events from 1994 to 2003. In the St. Louis metropolitan area,<br />
days with temperatures of 90 degrees or greater generally occur from June through August<br />
based on Table J48 above. The future probable risk for <strong>Jefferson</strong> <strong>County</strong> is shown below<br />
according to the Heat Index levels of severity.<br />
Heat Index Probable Risk<br />
Heat Index of 130°F or higher Unlikely<br />
Heat Index of 105°F to 129°F Possible<br />
Heat Index of 90°F to 104°F Likely<br />
Heat Index of less than 90°F Highly Likely<br />
Statement Statement of of Next Next Disaster’s Disaster’s Likely Likely Adverse Adverse Impact Impact on on Co Community Co mmunity<br />
The next heat wave will possibly have a detrimental impact on the community in terms of<br />
agricultural, economic (social) and environmental based upon the past historic heat wave<br />
occurrences. The adverse impacts of future heat waves affecting <strong>Jefferson</strong> <strong>County</strong> is shown<br />
below.
128<br />
Without Without Mitigation Mitigation Mitigation Measures<br />
Measures<br />
Life Catastrophic<br />
Property Limited<br />
Emotional Catastrophic<br />
Financial Limited<br />
Comments Based on worst case scenario<br />
<strong>Jefferson</strong> <strong>County</strong> – Section 2<br />
With With Mitigation Mitigation Measures<br />
Measures<br />
Life Limited<br />
Property Negligible<br />
Emotional Limited<br />
Financial Negligible<br />
Comments <strong>Jefferson</strong> <strong>County</strong> has been proactive in protecting those<br />
At-risk residents by organizing OWS.<br />
Recommendation<br />
Recommendation<br />
Recommendation<br />
Educate those people who work outdoors of the dangers of extended exposure to a<br />
combination of high temperatures and high humidities. The people to be educated are<br />
those at risk including:<br />
• "Homeless" living outside<br />
• Poor, elderly, chronically ill persons living alone<br />
• Individuals working outside in extreme heat<br />
Dam Dam Failure Failure Hazard Hazard Profile<br />
Profile<br />
The purpose of a dam is to impound (store) water, wastewater or liquid borne materials for<br />
any of several reasons, including flood control, human water supply, irrigation, livestock<br />
water supply, energy generation, containment of mine tailings, and recreation or pollution<br />
control. Many dams fulfill a combination of the above functions.<br />
Manmade dams may be classified according to the type of construction material used, the<br />
methods used in construction, the slope or cross-section of the dam, the way the dam<br />
resists the forces of the water pressure behind it, the means used for controlling seepage<br />
and, occasionally, according to the purpose of the dam. The materials used for<br />
construction of dams include earth, rock, tailings from mining or milling, concrete,<br />
masonry, steel, timber, miscellaneous materials (such as plastic or rubber) and any<br />
combination of these materials. Dams can be owned and operated by individuals, private<br />
and public organizations and the government. Associated works include spillways, water<br />
supply facilities, and lake drain structures. Most dams have an earth embankment and one<br />
or two spillways.
A Regional Overview All-Hazard Mitigation Plan 129<br />
Embankment dams are the most common type of dam in use today. In Missouri 99<br />
percent of all dams in Missouri are made of earthen materials, the remaining are<br />
constructed of concrete. Materials used for embankment dams include natural soil or rock,<br />
or waste materials obtained from mining or milling operations. An embankment dam is<br />
termed an “earthfill” or “rockfill” dam depending on whether it is comprised of compacted<br />
earth or mostly compacted or dumped rock. The ability of an embankment dam to resist<br />
the reservoir water pressure is primarily a result of the mass weight, type and strength of<br />
the materials from which the dam is made.<br />
Concrete dams may be categorized into gravity and arch dams according to the designs<br />
used to resist the stress due to reservoir water pressure. Typical concrete gravity dams are<br />
the most common form of concrete dam. Because the purpose of a dam is to retain water<br />
effectively and safely, the water retention ability of a dam is of prime importance. Water<br />
may pass from the reservoir to the downstream side of a dam by:<br />
• Passing through the main spillway or outlet works<br />
• Passing over an auxiliary spillway<br />
• Overtopping the dam<br />
• Seepage through the abutments<br />
• Seepage under the dam<br />
Overtopping of an embankment dam is very undesirable because the embankment<br />
materials may be eroded away. Additionally, only a small number of concrete dams have<br />
been designed to be overtopped. Water normally passes through the main spillway or<br />
outlet works; it should pass over an auxiliary spillway only during periods of high reservoir<br />
levels and high water inflow. All embankment and most concrete dams have some<br />
seepage. However, it is important to control the seepage to prevent internal erosion and<br />
instability. Proper dam construction, and maintenance and monitoring of seepage provide<br />
this control.<br />
Description<br />
Description<br />
Thousands of people have been injured, many killed and billions of dollars of property<br />
damaged by dam failures in the United States, including the catastrophic dam failure<br />
upstream from Johnstown, Pennsylvania that killed 2,209 people in May 31, 1889 as a<br />
result of a poor and inappropriate maintenance of a poorly constructed dam. The problem<br />
of unsafe dams in Missouri was underscored by dam failures at Lawrenceton in 1968 (just<br />
south of <strong>Jefferson</strong> <strong>County</strong>), Washington <strong>County</strong> in 1975 and a near failure in Franklin<br />
<strong>County</strong> in 1978.<br />
Safety is of paramount importance to the effectiveness of a dam. Dam failures can be<br />
devastating for the dam owners, to the dam’s intended purpose and, especially, for<br />
downstream populations and property. Property damage can range in the thousands to<br />
billions of dollars. No price can be put on the lives that have been lost and could be lost in
130<br />
<strong>Jefferson</strong> <strong>County</strong> – Section 2<br />
the future due to dam failure. Inundation from a dam failure could affect several states and<br />
large populations.<br />
Although the majority of dams in the U.S. have responsible owners and are properly<br />
maintained, still many dams fail every year. In the past several years, there have been<br />
hundreds of documented failures across the nation (this includes 250 after the Georgia<br />
Flood of 1994). Dam and downstream repair costs resulting from failures in 23 states<br />
reporting in one recent year totaled $54.3 million.<br />
Early in the twentieth century, as many dams failed due to lack of proper engineering and<br />
maintenance, it was recognized that some form of regulation was needed. One of the<br />
earliest state programs was enacted in California in the 1920s. Federal agencies, such as<br />
the Corps of Engineers and the Department of Interior, Bureau of Reclamation built many<br />
dams during the early part of the twentieth century and established safety standards<br />
during this time. Slowly, other states began regulatory programs. But it was not until the<br />
string of significant dam failures in the 1970s that awareness was raised to a new level<br />
among the states and the federal government.<br />
In Missouri, the first state legislation aimed at regulating dams was passed in 1889 and<br />
was called the Dam Mills and Electric Power Law. The law was concerned only with<br />
damaged caused by construction and lake formation. It did not address the engineering<br />
aspects of design or downstream safety of dams.<br />
In 1972, Congress passed the National Dam Safety Act (P.L. 92-367) that called for an<br />
inventory of dams in the U.S. and one time inspection of dams that would result in loss of<br />
life from a failure. In 1986, Congress enacted the Water Resources Development Act (P.L.<br />
99-662). Title XII-Dam Safety authorized the U.S. Army Corps of Engineers (USACE) to<br />
maintain and periodically update the inventory of dams. In 1988 funds were appropriated<br />
for this effort. FEMA and USACE developed a Memorandum of Agreement where FEMA<br />
assumed responsibility for maintaining and updating the inventory using the funds<br />
authorized. The Water Resources Development Act of 1996 (P.L. 104-303) Section 215 reauthorized<br />
periodic update of the National Inventory of Dams (NID) by USACE and<br />
continued a funding mechanism. For the 1998 update, the USACE resumed the lead<br />
responsibility and worked with FEMA and other agencies. There are about 77,000 dams in<br />
the inventory.<br />
The 1996 Act does not apply to any such artificial barrier which is not in excess of six feet<br />
in height, regardless of storage capacity, or which has a storage capacity at a maximum<br />
water storage elevation not in excess of fifteen acre-feet, regardless of height (P.L. 92-367;<br />
Dam Safety Act of 1972) unless such barrier, due to its location or other physical<br />
characteristic, is likely to pose a significant threat to human life or property in the event of<br />
its failure.” (P.L. 99-662, Water Resources Development Act of 1986).
A Regional Overview All-Hazard Mitigation Plan 131<br />
Criteria for dams in the NID are as follows:<br />
• All high hazard potential classification dams<br />
• All significant hazard potential classification dams<br />
• Low hazard or undetermined potential classification dams which<br />
• Equal or exceed 25 feet in height and which exceed 15 acre-feet in storage<br />
• Equal or exceed 50 acre-feet storage and exceed 6 feet in height.<br />
The NID has definitions for downstream hazard potential. These definitions are different<br />
from the Missouri Department of Natural Resources, Geological Survey and Resource<br />
Assessment, Dam and Reservoir Safety Program. The NID definitions, as accepted by the<br />
Interagency Committee on Dam Safety are as follows:<br />
1. Low Hazard Potential<br />
Dams assigned the low hazard potential classification are those where<br />
failure or disoperation results in no probable loss of human life and low<br />
economic and/or environmental losses. Losses are principally limited to<br />
the owner’s property.<br />
2. Significant Hazard Potential<br />
Dams assigned the significant hazard potential classification are those<br />
dams where failure or disoperation results in no probable loss of human<br />
life but can cause economic loss, environmental change, disruption of<br />
lifeline facilities, or impact other concerns. Significant hazard potential<br />
classification dams are often located in predominantly rural or agricultural<br />
areas but could be located in areas with population and significant<br />
infrastructure.<br />
3. High Hazard Potential<br />
Dams assigned the high hazard potential classification are those where<br />
failure or disoperation will probably cause loss of human life.<br />
In September 1979, the first state legislation was passed, the Missouri House Bill 603<br />
(called the Dam Safety Law) and became effective in September 1979. As a result of the<br />
USACE inspection program in Missouri led the country in total number of unsafe dams.<br />
House Bill 603 (now contained in Sections 236.400 through 236.500 of the revised statues<br />
of Missouri) excluded regulation-dams less than 35 feet high, and allowed exemptions for<br />
others used for agricultural purposes and those regulated by other state or federal<br />
agencies. The law requires that a construction permit application be made to construct<br />
new dams or modify, remove or alter existing dams. Owners of existing dams 35 feet or<br />
more in height must obtain a registration permit and owners of new dams 35 feet or more<br />
in height must obtain a safety permit after construction to operate the structures. All
132<br />
<strong>Jefferson</strong> <strong>County</strong> – Section 2<br />
regulated dams must be inspected periodically to assure that their continued operation<br />
does not constitute a hazard to public safety, life and property. The Missouri Department<br />
of Natural Resources, Geological Survey and Resource Assessment, Dam and Reservoir<br />
Safety Program inspects the dams. The Dam and Reservoir Safety Program operates under<br />
the general guidance of the Dam and Reservoir Safety <strong>Council</strong>. The <strong>Council</strong> is responsible<br />
for the development of the rules and regulations and the determination of enforcement<br />
procedures to make the law operative. The Governor appoints all seven council members.<br />
There are around 4,000 dams in Missouri of which approximately 600 are regulated under<br />
the Missouri law.<br />
The Missouri Dam and Reservoir Safety Program is responsible for ensuring that all new<br />
and existing non-agricultural, non-federal dams 35 feet or more in height meet minimum<br />
safety standards. The program reviews engineering plans and specifications; conducts<br />
hydrologic, hydraulic and structural analysis of dams; monitors construction of new dams<br />
and modification of existing dams; performs safety inspections of existing dams; responds<br />
to dam safety emergencies so that public safety, life and property are protected. The<br />
program also prepares inundation mapping, which is provided to recorder of deeds for<br />
each county showing areas impacted by dam failure.<br />
Dam owners are solely responsible for the safety and the liability of the dam and for<br />
financing its upkeep, upgrade and repair. While most infrastructure facilities (roads,<br />
bridges, sewer systems, etc.) are owned by public entities, the majority of dams in the<br />
United States are privately owned. Many different types of people and entities own and<br />
operate dams. About 58 percent are privately owned. Local governments own and<br />
operate the next largest number of dams, about 16 percent. State ownership is next with<br />
about four percent; the federal government, public utilities and undetermined interests<br />
each own smaller numbers of dams (5 percent).<br />
Contact:<br />
Chief Engineer<br />
MO Department of Natural Resources<br />
Dam and Reservoir Safety Program<br />
PO Box 250<br />
Rolla, MO 65402-0250<br />
Phone: 573/368-2175<br />
Fax: 573/368-2111<br />
Web: http://www.dnr.state.mo.us/geology/damsft/damsfthp.htm<br />
2003 Statistics:<br />
Number of Missouri state-regulated dams: 638<br />
Number of Missouri dams in National Inventory of Dams: 4,096
A Regional Overview All-Hazard Mitigation Plan 133<br />
Charact Characteristics<br />
Charact eristics<br />
The characteristics of a dam failure, based on the International Commission of Large Dams<br />
(ICOLD) include following the three major categories of dam failure: (1) overtopping by<br />
flood; (2) foundation defects; and (3) piping. For earthen dams, the major reason for<br />
failure is piping or seepage. For concrete dams, the major reasons for failure are associated<br />
with foundations. Overtopping has been a significant cause of dam failure primarily in<br />
cases where there was an inadequate spillway. Dam failures are most likely to happen for<br />
one of five reasons:<br />
• Overtopping caused by water spilling over the top of a dam<br />
• Structural failure of materials used in dam construction<br />
• Cracking caused by movements like the natural settling of a dam<br />
• Inadequate maintenance and upkeep<br />
• Piping—when seepage through a dam is not properly filtered and soil particles<br />
continue to progress and form sink holes in the dam<br />
Likely Likely Locations<br />
Locations<br />
The National Inventory of Dams, the State of Missouri, and FEMA have summarized the<br />
status of dams in Missouri by hazard classification. Refer to Figure JF51 (located in the<br />
back of the Technical Appendix) that shows the location of the high hazard dams in<br />
<strong>Jefferson</strong> <strong>County</strong>, based on MDNR’s inventory. High hazard potential is defined as dams<br />
that are more than 30 years old, have a high ratio of maximum storage to dam height<br />
and/or high population density downstream. Table J47 identifies the national and state<br />
inventory of dams. Table J48 lists <strong>Jefferson</strong> <strong>County</strong> high hazard potential dams.<br />
TAB TABLE TAB LE J47 SUMMARY SUMMARY STATUS OF MISSOURI DAMS BY HAZARD<br />
CLASSIFICATION<br />
CLASSIFICATION<br />
NATIONAL NATIONAL INVENTORY INVENTORY<br />
STATE STATE REGULATED<br />
REGULATED<br />
Hazard Hazard Classification Classification<br />
Hazard Hazard Classification<br />
Classification<br />
Total Total High High High Significant Significant Low Low Total Total High High High Significant Significant Significant Low Low<br />
4095 607 912 2576 630 440 127 63<br />
Source: Missouri Department of Natural Resources<br />
TABLE TABLE J48 J48 JEFFERSON JEFFERSON COUNTY COUNTY HIGH HIGH HAZARD HAZARD DAMS DAMS<br />
DAMS<br />
DAM DAM NAME NAME RECEIVING RECEIVING RIVER RIVER BUILT BUILT LENGTH<br />
LENGTH<br />
DAM<br />
DAM<br />
HEIGHT HEIGHT HEIGHT VOLUME<br />
VOLUME<br />
STATE<br />
STATE<br />
REGULATED<br />
REGULATED<br />
Fondulac Dam Tr- Saline Creek 1954 0 28 296 N<br />
Glen Rose Lake Dam Tr to Rock Creek 1962 0 30 46 N<br />
Steeger Lake Dam Trib-Sugar Creek 1976 0 33 58 N<br />
Lake Kearney Dam Tr to Sugar Creek 1800 0 25 16 N
134<br />
TABLE TABLE J48 J48 JEFFERSON JEFFERSON COUNTY COUNTY HIGH HIGH HAZARD HAZARD DAMS<br />
DAMS<br />
<strong>Jefferson</strong> <strong>County</strong> – Section 2<br />
DAM<br />
DAM<br />
STATE<br />
STATE<br />
DAM DAM NAME NAME RECEIVING RECEIVING RIVER RIVER<br />
Tributary to Belew<br />
BUILT BUILT LENGTH<br />
LENGTH HEIGHT HEIGHT HEIGHT VOLUME<br />
VOLUME REGULATED<br />
REGULATED<br />
REGULATED<br />
Lake Tishomingo Dam Creek<br />
Lake Wauwanoka<br />
1950 870 68 2376 Y<br />
Dam Dry Creek 1942 1045 50 2370 Y<br />
Lake Montowese Dam Tr Big River 1942 1000 54 606 Y<br />
Lembeck Lake Dam<br />
Upper Valle Mines<br />
Whitehead Creek 1958 0 26 117 N<br />
Dam Tr To Joachim Creek 1958 0 34 142 N<br />
Williams Dam Tr-Joachim Creek 1965 0 26 93 N<br />
Lake Briarwood Dam Ball Branch 1970 1400 57 1398 Y<br />
Spring Lake Dam<br />
Hickory Hills Golf Club<br />
Tr Ball Branch 1970 0 20 33 N<br />
Dam Tr Joachim Creek<br />
<strong>West</strong> Fork Plattin<br />
1965 0 25 19 N<br />
Laguna Palma Dam Creek 1947 530 26 98 N<br />
Kinnippi Lake Dam Tr to Dry Creek<br />
Tributary to Butcher<br />
1960 0 27 64 N<br />
Anderson Lake Dam Branch. 1958 0 26 57 N<br />
Lake Adelle Dam<br />
Conservation Club<br />
Tr-Skullbones Creek 1950 0 29 73 N<br />
Lake Dam Tr. to Mississippi River 1951 0 30 135 N<br />
River Cement Tributary to<br />
Company Dam Mississippi Riv. 1965 605 57 300 Y<br />
Dehner Lake Dam Tr to Sandy Creek 1958 0 29 27 N<br />
Hideout Lake Dam Tr to Sandy Creek 1945 0 33 69 N<br />
Lake Virginia Dam Tr Joachim Creek 1954 0 25 176 N<br />
Leonard,Glen Dam Tr-Heads Creek 1956 0 29 75 N<br />
Lake Ararat Dam Heads Creek<br />
Tributary of Sandy<br />
1960 0 34 248 N<br />
Lake Lorraine Dam Creek 1957 1100 46 400 Y<br />
Lake Bono Del Dam Tr to Belew Creek<br />
Tributary to Belew<br />
1954 0 27 35 N<br />
Becker Lake Dam<br />
Sweetwater Dam -<br />
Creek 1965 0 28 80 N<br />
Noname 251 Tr-Dulin Creek 1960 0 29 74 N<br />
Clear Lake Dam<br />
Lower Valle Mines<br />
Tr to Joachim Creek 1961 0 34 144 N<br />
Dam Tr to Joachim Creek 1952 0 22 54 N<br />
Liguori Lake Dam - Tributary to Glaize<br />
Nonane 255 Creek<br />
Tributary to Rock<br />
1950 0 25 28 N<br />
Autumn Lake Dam Creek 1962 0 32 81 N<br />
Pine Lake Dam<br />
Weber Hill Terrace<br />
Tr-Rock Creek 1961 0 33 77 N<br />
Lake Dam Tr-Bear Creek 1957 519 36 117 Y<br />
Land Of Lakes Dam Tr-Bear Creek 1946 0 30 26 N
A Regional Overview All-Hazard Mitigation Plan 135<br />
TABLE TABLE J48 J48 JEFFERSON JEFFERSON COUNTY COUNTY HIGH HIGH HAZARD HAZARD DAMS<br />
DAMS<br />
DAM<br />
DAM<br />
STATE<br />
STATE<br />
DAM DAM NAME NAME RECEIVING RECEIVING RIVER RIVER BUILT BUILT LENGTH<br />
LENGTH HEIGHT HEIGHT HEIGHT VOLUME<br />
VOLUME REGULATED<br />
REGULATED<br />
REGULATED<br />
Tamarack Dam Tr-Sand Creek 1964 0 29 141 N<br />
Little Lake Dam Tr to Joachim Creek 1961 0 32 24 N<br />
Sunrise Big Lake Dam Tr to Joachim Creek 1961 480 38 97 Y<br />
Summer Set Lake Dam Falling Rock Branch<br />
Deerwood Lake No.3<br />
1974 1200 59 1336 Y<br />
Dam<br />
Bequette Dam -<br />
Trib-Isom Creek 1960 0 25 30 N<br />
Noname 262 Tr-Isum Creek<br />
Tributary to La Barque<br />
1967 0 31 31 N<br />
Glenwilfern Lake Dam Creek 1953 540 38 93 Y<br />
Cedar Hill Lake No. 3 Tributary to<br />
Dam<br />
Skullbones Creek 1949 0 28 60 N<br />
Fisherman's Lake Dam Tr Ball Branch 1970 0 34 167 N<br />
Dresser No. 10 Dam Tr Big River 1974 765 100 1118 Y<br />
Atwood Lake Dam<br />
Sunrise Lake Upper<br />
Tr to Sandy Creek 1969 0 27 43 N<br />
Dam<br />
Winter Haven Lake<br />
Tr to Joachim Creek 1961 360 37 175 Y<br />
Dam Falling Rock Branch 1978 730 49 224 Y<br />
Spring Lake Dam Tr-Falling Rock Branch 1976 600 42 133 Y<br />
Siesta Lake Dam Tr to Fritz Creek 1957 0 30 58 N<br />
Gwenmil Lake Dam Tr to Isum Creek 1957 0 29 23 N<br />
Francois Lake Dam Tr to Mississippi River 1979 470 38 19 Y<br />
Highway 21 Lake Dam Trib-Heads Creek 1940 0 28 47 N<br />
Dresser No. 11 Tr to Big River 1975 500 90 50 Y<br />
Silver Lake Dam Ditch Creek 1981 1600 80 0 Y<br />
Raintree Dam #2 Belew Creek Tributary 1989 1000 55 988 Y<br />
Stonehenge #1 Dam Trib to Sugar Creek<br />
Brian Haskins Lake<br />
1990 360 41 13 Y<br />
Dam<br />
Ralph McNail Lake<br />
1990 0 22 0 N<br />
Dam 1988 0 24 0 N<br />
Source: Missouri Department of Natural Resources<br />
Information on the extent of inundation resulting from dam failure is not available at this<br />
time. The Missouri Department of Natural Resources (MDNR), Dam and Reservoir Safety<br />
Program, has begun an effort to map and analyze potential inundation areas for all stateregulated<br />
dams in Missouri. This effort will be done on an county-by-county basis. An<br />
inundation map is to be part of the Emergency Action Plan prepared by all dam owners. In<br />
2010, MNDR will work with dam owners to understand their responsibilities and to<br />
develop Emergency Action Plans. It is anticipated that inundation information should be<br />
available for the next update.<br />
For more information go to: http://www.damsafetyaction.org/about-eaps/mapping.php .
136<br />
Type Type Type of of Damage<br />
Damage<br />
<strong>Jefferson</strong> <strong>County</strong> – Section 2<br />
When dams fail, the results can be catastrophic. Dams are innately hazardous structures.<br />
Failure or disoperation can result in the release of the reservoir contents--this includes<br />
water, mine wastes or agricultural refuse--causing negative impacts upstream or<br />
downstream or at locations remote from the dam. Negative impacts of primary concern<br />
are loss of human life, economic loss including property damage, lifeline disruption and<br />
environmental damage.<br />
While the definition varies from place to place, it generally means if failure of a high-hazard<br />
dam occurs, there probably will be loss of life. I t must be emphasized that this<br />
determination does not mean that these dams are in need of repair--these dams could be<br />
in excellent condition or they could be in poor condition. "High-hazard" just reflects the<br />
dam's potential for doing damage downstream should it fail. The current issue and debate<br />
is over the increasing number of these high-hazard structures--not because more highhazard<br />
dams are being built, but that more development is occurring downstream. Dam<br />
and reservoir safety regulators generally have no control over local zoning issues or<br />
developers' property rights.<br />
Some dams are considered to have a greater hazard potential than others. There are<br />
approximately 10,000 state-regulated "high-hazard" potential dams in the U.S. "Highhazard"<br />
is a term used by a majority of state dam safety programs and federal agencies as<br />
part of a three-pronged classification system used to determine how hazardous a dam's<br />
failure might be to the downstream area. Historically, dams that failed had some<br />
deficiency, as characterized above, which caused the failure. These dams are typically<br />
termed "unsafe." Currently, there are about 2,000 "unsafe" dams in the U.S. There are<br />
unsafe dams in almost every state. (A majority of states and federal agencies define an<br />
"unsafe" dam as one that has been found to have deficiencies that leave it more susceptible<br />
to failure.)<br />
Hazard Hazard Event Event History<br />
History<br />
Thousands of people have been injured, many killed, and billions of dollars of property<br />
damaged by dam failures in the United States. Dam failures at Lawrenceton in 1968,<br />
Washington <strong>County</strong> in 1975, Fredericktown in 1977, and a near failure in Franklin <strong>County</strong><br />
underscored the problem of unsafe dams in Missouri in 1978.<br />
Frequency Frequency of of Occurrence<br />
Occurrence<br />
Table F49 below summarized the frequency of dam failures in Missouri. Four dams failed<br />
in ten years.
A Regional Overview All-Hazard Mitigation Plan 137<br />
Intensity Intensity Intensity or or or Strength Strength<br />
Strength<br />
TABLE TABLE J49 J49 RECENT RECENT DAM DAM FAILURES FAILURES IN IN MISSOURI<br />
MISSOURI<br />
Community Community<br />
Date<br />
Lawrenceton 1968<br />
Washington <strong>County</strong> 1975<br />
Frederickton 1977<br />
Franklin <strong>County</strong> (near failure) 1978<br />
The intensity or strength of resultant damages from dam failures is dependent upon the<br />
amount of water stored behind the dam as well as the weather. A large rain event can<br />
exacerbate an already critical emergency situation. Damage from dam failures can be<br />
catastrophic.<br />
Lives Lives Lives Lost, Lost, Lost, Injuries, Injuries, Injuries, Property Property Damage, Damage, Economic Economic Losses/Other Losses/Other Losses<br />
Losses<br />
The cost of a dam failure is difficult to assess because flooding can affect large areas. Local<br />
communities may be directly impacted due to building damage, injuries fatalities, lost<br />
water supply, damaged transportation and infrastructure and lost recreational assets. The<br />
extent of an owner’s liability will vary from state to state depending on the statutes and<br />
case law precedents. The concept of strict liability imposes liability on a dam owner for<br />
damages that occur regardless of the cause of failure. The alternative theory of negligence<br />
considers the degree of care employed by the owner in constructing, operating and<br />
maintaining a dam. Historically, courts have sought to compensate those injured by a dam<br />
failure. When assessing liability, the standard of care exercised by an owner will be closely<br />
examined and should be in proportion to the downstream hazards involved. Where the<br />
risk is great, owners must be cautious. In many cases, dams regulated by the federal<br />
government or a state dam safety program must be designed to withstand an<br />
unprecedented flood or earthquake. Thousands of people have been injured, many killed,<br />
and billions of dollars of property damaged by dam failures in the United States.<br />
1972-Buffalo Creek Dam, <strong>West</strong> Virginia-125 dead, $400 million in damages.<br />
1976-Teton Dam, Idaho-14 dead, over $1 billion in damages<br />
1977-Laurel Run Dam, Pennsylvania-40 dead, $5.3 million in damages<br />
1977-Kelly Barnes Dam, Georgia-39 dead, $30 million in damages<br />
1982-Lawn Lake Dam, Colorado-3 dead, $25 million in damages<br />
1988-Quail Creek Dam, Utah-$12 million in damages<br />
The failures of Teton Dam and the Kelly Barnes Dam focused national attention to the<br />
problem of unsafe dams. Dam failures, however, continue to occur with destructive and<br />
sometimes fatal results.
138<br />
Locations/Areas Locations/Areas Affected<br />
Affected<br />
<strong>Jefferson</strong> <strong>County</strong> – Section 2<br />
Locations affected by dam failure will be low-lying areas that are below dams, near a creek,<br />
stream or river valley. Residents, businesses and infrastructure in the path of the dam<br />
waters can become quickly inundated and destroyed.<br />
Seasonal Seasonal Pattern Pattern<br />
Pattern<br />
There is no seasonal pattern to dam failure. However, various climatic conditions and other<br />
situations may result in dam failure including such elements of risk as natural phenomena<br />
such as floods and landslides during wet weather seasons. These hazards threaten dam<br />
structures and their surroundings. Floods that exceed the capacity of a dam's spillway and<br />
then erode the dam or abutments are particularly hazardous, as is seismic activity that may<br />
cause cracking or seepage. Similarly, debris from landslides may block a dam's spillway and<br />
cause an overflow wave that erodes the abutments and ultimately weakens the structure.<br />
Speed Speed of of Onset Onset Onset And/Or And/Or And/Or Existi Existing Existi Existing<br />
ng Warning Systems<br />
A few large Missouri dams have monitoring systems, emergency action plans and warning<br />
systems. However, most dams in Missouri do not.<br />
Map Map of of Hazards Hazards<br />
Hazards<br />
Refer to Figure J51in the back of the Technical Appendix that depicts the regulated dams in<br />
the EWG planning region.<br />
Information on the extent of inundation resulting from dam failure is not available at this<br />
time. The Missouri Department of Natural Resources (MDNR), Dam and Reservoir Safety<br />
Program, has begun an effort to map and analyze potential inundation areas for all stateregulated<br />
dams in Missouri. This effort will be done on an county-by-county basis. An<br />
inundation map is to be part of the Emergency Action Plan prepared by all dam owners. In<br />
2010, MNDR will work with dam owners to understand their responsibilities and to<br />
develop Emergency Action Plans. It is anticipated that inundation information should be<br />
available for the next update.<br />
For more information go to: http://www.damsafetyaction.org/about-eaps/mapping.php .<br />
Statement Statement of of Probable Probable Probable Future Future Severity<br />
Severity<br />
Missouri Geological Survey and Resource Assessment Division has defined three levels of<br />
hazard potential: high, significant and low hazard, as accepted by the Interagency<br />
Committee on Dam Safety.<br />
High: Failure or disoperation will probably cause loss of human life
A Regional Overview All-Hazard Mitigation Plan 139<br />
Significant: Failure or disoperation results in no probable loss of human life, but can<br />
cause economic loss, environmental damage, disruption of lifeline facilities,<br />
or impact other concerns. Significant hazard potential classification dams<br />
are often located in predominantly rural or agricultural areas but could be<br />
located in areas with population and significant infrastructure.<br />
Low: Failure or disoperation results in no probably loss of human life and low<br />
economic and/or environmental losses. Losses are principally limited to the<br />
owner’s property.<br />
According to MDNR’s Dam and Reservoir Safety Program, <strong>Jefferson</strong> <strong>County</strong> has 145 dams.<br />
The mean dam height is 36 feet with the mean storage capacity of 247 acre-feet. Many<br />
are less than 35 feet high and are not regulated by MDNR. People living in low-lying areas<br />
downstream of the smaller unregulated dams, depending upon the safety of the dams may<br />
be at risk if these dams should fail. Of the dams in <strong>Jefferson</strong> <strong>County</strong>, 60 are rated by<br />
MDNR as “high risk”. Only nineteen are regulated by MDNR. The oldest dam on this list<br />
was built in 1800, the most recent one was built in 1990.<br />
The probably future severity of a dam failure for <strong>Jefferson</strong> <strong>County</strong> is below.<br />
Hazard Hazard Level Level Level Future Future Probable Probable Severity Severity<br />
High Catastrophic<br />
Significant Critical<br />
Low Negligible<br />
Statement Statement Statement of of Probable Probable Risk/Likeli Risk/Likeliness Risk/Likeli Risk/Likeli ness Of Of Future Occurrence<br />
According to the Dam and Reservoir Safety Program within MDNR, the likeliness of a future<br />
occurrence of dam failure is very likely, due to the conditions of dams in Missouri. While<br />
the definition varies from place to place, it generally means if failure of a high-hazard dam<br />
occurs, there probably will be loss of life. It must be emphasized that this determination<br />
does not mean that these dams are in need of repair--these dams could be in excellent<br />
condition or they could be in poor condition. "High-hazard" just reflects the dam's potential<br />
for doing damage downstream should it fail.<br />
High-hazard potential dams exist in every state and affect the lives of thousands<br />
downstream. The current issue and debate is over the increasing number of these highhazard<br />
structures--not because more high-hazard dams are being built, but that more<br />
development is occurring downstream. Dam and reservoir safety regulators generally have<br />
no control over local zoning issues or developers' property rights. So this issue continues to<br />
worry regulators as the trend persists.<br />
Hazard azard azard Level Level Level Probable Risk Risk<br />
High Likely<br />
Significant Likely
140<br />
Low Likely<br />
Statement Statement Of Of Next Next Disaster’s Disaster’s Likely Likely Likely Adverse Adverse Impact Impact On On Community<br />
Community<br />
<strong>Jefferson</strong> <strong>County</strong> – Section 2<br />
The impact on the downstream community, dependent upon what is downstream could<br />
be very serious. The adverse impacts of future dam failures affecting <strong>Jefferson</strong> <strong>County</strong> at<br />
the high hazard level are shown below. Intersecting almost all the issues above is the issue<br />
of public education about dams. The ordinary citizen is unaware that the lakes on which<br />
they use are only there because of manmade dams. Developers build in dam break flood<br />
inundation areas unaware of the potential that an upstream dam has, to cause devastation<br />
should it fail. Even if everyone understands and are aware of dams, they still can be overly<br />
confident in the infallibility of these manmade structures. Living in dam break flood-prone<br />
areas is a risk. Many dam owners do not realize their responsibility and liability toward the<br />
downstream public and environment.<br />
Without Without Mitigation Mitigation Measures<br />
Measures<br />
Life Catastrophic<br />
Property Catastrophic<br />
Emotional Catastrophic<br />
Financial Catastrophic<br />
Comments None<br />
With With Mitigation Mitigation Measures<br />
Measures<br />
Life Negligible<br />
Property Negligible<br />
Emotional Negligible<br />
Financial Negligible<br />
Comments None<br />
Recommendation<br />
Recommendation<br />
Implementation of dam safety actions with dam owners and jurisdictions downstream.
A Regional Overview All-Hazard Mitigation Plan 141<br />
Wildland Wildland Fires Fires Hazard Hazard Profile<br />
Profile<br />
Description Description<br />
Description<br />
The term wildfire is defined as "a highly destructive, uncontrollable fire." During a wildfire,<br />
the fire produces the same amount of energy in 10 minutes as a nuclear bomb.<br />
FIGURE FIGURE J52<br />
J52<br />
Fires that burn forest plants can be classified in three ways: ground<br />
fires, surface fires, and crown fires. Ground fires burn the humus<br />
layer of the forest floor, surface fires burn forest undergrowth and<br />
surface litter, and crown fires advance through the tops of trees.<br />
Atmospheric factors such as temperature, humidity, and rainfall<br />
are important factors in determining the combustibility of a given<br />
forest. See Figure J52.<br />
Humans, either through negligence, accident, or intentional arson,<br />
have caused approximately 90 percent of all wildfires in the last<br />
decade in the U.S. Accidental and negligent acts include<br />
unattended campfires, sparks, burning debris, and irresponsibly<br />
discarded cigarettes. Refer to Table 52 below. The remaining 10<br />
percent of fires are mostly caused by lightning, but may also be<br />
caused by other acts-of-nature such as volcanic eruptions or<br />
earthquakes.<br />
During March and April 2000 Missouri sustained devastating fire damage to thousands of<br />
acres resulting from wildland fires. Warm temperatures and low humidity increased the<br />
occurrence and fueled the flames scorching many areas of the state. In an attempt to raise<br />
the public’s awareness of the hazardous situations, the Governor and the State Fire<br />
Marshal issued a statewide voluntary burn ban, urging citizens to refrain from conducting<br />
any open burning. In addition, the Missouri Department of Conservation and U.S. Forestry<br />
Service issued burn bans throughout state and federally owned land.<br />
TABLE TABLE J50 J50 J50 RREASONS<br />
R EASONS FOR FIRES IN MISSOURI<br />
Lightning Lightning<br />
>1%<br />
Camping Camping<br />
1%<br />
Smoking Smoking<br />
4%<br />
Debris Debris Burning Burning<br />
58%<br />
Arson Arson<br />
20%<br />
Equipment Equipment Use Use<br />
3%<br />
Railroads Railroads<br />
1%<br />
Children Children<br />
1%<br />
Miscellaneous Miscellaneous Causes Causes<br />
12%
142<br />
<strong>Jefferson</strong> <strong>County</strong> – Section 2<br />
The Missouri Division of Fire Safety has urged that fire service agencies and local<br />
governments begin planning for this situation by adopting a local ordinance to prohibit<br />
open burning during a high fire hazard time period. Missouri statutes do not allow the<br />
state to issue a MANDATORY burn ban at the state level.<br />
One responsibility of the Forestry Division is protecting state and private land from the<br />
destructive effects of wildfires. The Forestry Division works closely with rural fire<br />
departments to assist with fire suppression activities. Nearly 900 rural fire departments<br />
have mutual aide agreements with the division. Forestry personnel provide training,<br />
equipment and grants to rural fire departments to help them become a more effective firefighting<br />
team.<br />
Statutory authority is given to fire protection districts via RSMo 321.220 (12) to "adopt and<br />
amend bylaws, fire protection and fire prevention ordinances, …". However, coordination<br />
with the county prosecuting attorney’s office is strongly recommended before<br />
implementing such an ordinance to ensure enforcement ability. Voluntary fire service<br />
associations should also coordinate similar efforts at the local level to adopt open burning<br />
laws.<br />
Not only is the land affected, but also personnel throughout many fire service agencies are<br />
pushed to their limit battling these types of fires. These situations place Missouri citizens<br />
and responding fire fighters at risk.<br />
Fire danger is based upon the burning index (BI). The burning index takes into account the<br />
fuel moisture, relative humidity, wind speed, temperature and recent precipitation. The<br />
burning index is the basis for fire suppression crew staffing levels. The vegetative types and<br />
fuel types are different than in the western U.S. As compared to the western U.S., with the<br />
humid climate of the Midwest, fuel decomposes much faster. As a result of this, the<br />
wildfires in Missouri are rare and are nearly not as severe as the fires that the western states<br />
experiences.<br />
Characteristics<br />
Characteristics<br />
Fires in the counties of Franklin, <strong>Jefferson</strong>, St. Louis City, St. Louis and St. Charles Counties<br />
are different than those in the <strong>West</strong> as described above; Missouri does not have large<br />
conflagrations and crown fires, where embers from the fire are thrown a long way from<br />
the fire that results in fire ignition of other dry areas. Damage may result in the burning of<br />
outbuildings, possibly a home and nearby grassy areas. Missouri fires consist of grassy<br />
areas, leaves, ground letter, plants, shrubs, and trees. . However, as new housing<br />
development in forested rural areas, the likelihood of fires will increase, especially in<br />
<strong>Jefferson</strong> <strong>County</strong>.
A Regional Overview All-Hazard Mitigation Plan 143<br />
Likely Likely Locations<br />
Locations<br />
Fires typically occur in highway medians and shoulders, near homes and outbuildings.<br />
People who live at the edge of the woods and vegetative debris, especially in <strong>Jefferson</strong><br />
<strong>County</strong> are at a higher risk of having a fire affect their homes and property.<br />
Type Type of of Damage<br />
Damage<br />
Damage may result in the burning of outbuildings, maybe a home. Missouri does not have<br />
large crown fires like the <strong>West</strong> has, where embers from the fire are thrown a long way<br />
results in fire ignition of other dry areas. Missouri Department of Conservation and Public<br />
Safety recommend that homes in these types of areas should not be built with cedar shake<br />
shingles. Typically homes catch on fire when dry brush, bushes and trees are very close to<br />
the house.<br />
Hazard Hazard Event Event History History<br />
History<br />
In accordance with Missouri Statute 254.230 and 321.220(12), the state is currently<br />
setting up a central fire reporting system. In the past, it was the responsibility of volunteer,<br />
local and district fire departments are supposed to report wildland fires to the state.<br />
However, this is rarely done. MDC is preparing an online central reporting system that will<br />
keep track of fires. As a result, an historical summary of fires was impossible due to the<br />
way in which MDC currently has their records stored.<br />
No Missouri fires are listed among the significant wildfires in the U.S. since 1825. Fires<br />
covering more than 300 acres are considered large in Missouri. Based on limited MDC<br />
data, it was reported that during March and April 2000 all of Missouri sustained<br />
devastating fire damage to thousands of acres resulting from wildland fires. Each year,<br />
about 3,700 wildfires burn more than 55,000 acres of forest and grassland. Missouri's<br />
wildfire season is in the spring and fall, unlike the <strong>West</strong>ern states that have a summer fire<br />
season. Dead vegetation, combined with the low humidities and high winds typical of<br />
these seasons, makes wildfire risk greater at these times.<br />
According to the MDC-Forestry Office, in the past twenty years, there have been only about<br />
five fires in the State of Missouri that MDC has been involved with in the St. Louis<br />
Metropolitan area. For the most part the rural fire departments fight their own fires.<br />
Some areas of land are not covered even by volunteer fire departments. In this event, the<br />
MDC will cover fires in these areas. Missouri has very few fires that occur as a result from<br />
lightening. Most fires result from arson, campers and from residents that burn trash.
144<br />
Frequency Frequency Of Of Occurrence<br />
Occurrence<br />
<strong>Jefferson</strong> <strong>County</strong> – Section 2<br />
Due to the timing factor and the stage of the MDC database development, frequency of<br />
occurrences was not obtained. Generally, occurrences of fires are based on the weather,<br />
humidity and available fuel.<br />
Intensity Intensity Or Or Strength<br />
Strength<br />
Fires that due occur are neither intense nor strong as a result of the weather and fuel<br />
conditions found in Missouri, as compared to the fires in the <strong>West</strong>.<br />
Lives Lives Lives Lost, Lost, Lost, Injuries, Injuries, Injuries, Property Property Property Damage, Damage, Damage, Economic Economic Economic Losses/Other Losses/Other Losses/Other Losses Losses<br />
Losses<br />
Due to the timing factor and the stage of the MDC database development, specific<br />
information on lives lost, injuries, property damage and economic losses was not obtained.<br />
Locations/Areas Locations/Areas Affected<br />
Affected<br />
Fires typically occur in highway medians and shoulders, near homes and outbuildings.<br />
People who live at the edge of the woods and vegetative debris, especially in <strong>Jefferson</strong><br />
<strong>County</strong> are at a higher risk of having a fire affect their homes and property.<br />
Seasonal Seasonal Pattern<br />
Pattern<br />
The season for wildfires in Missouri is between the end of February and the end of April, or<br />
whenever the environment is dry from lack of rain. Due to the lack of moisture throughout<br />
many areas Missouri, from late winter (February) through spring (May) often times the<br />
conditions are favorable for the high risk of wildland fires.<br />
Speed Speed Of Of Onset Onset And And /Or /Or Existing Existing Warning Warning Sy Systems Sy Systems<br />
stems<br />
The Department of Conservation relies upon the news media to help warn citizens of high<br />
fire danger. A set of standardized fire danger adjectives has been developed for fire<br />
warnings. These adjectives include a brief description of burning conditions, open burning<br />
suggestions for homeowners and fire crew staffing levels. Residents should always check<br />
with their local fire department or District Forester for local burning conditions.<br />
Map Map Of Of Of Hazards<br />
Hazards<br />
Refer to Figure J53 (located in the back of the Technical Appendix) for a map that depicts<br />
areas of potential wildfire hazard. These would include those areas of rural homes near<br />
forested areas.
A Regional Overview All-Hazard Mitigation Plan 145<br />
Statement Statement of of Probable Probable Future Future Future Severity<br />
Severity<br />
Location Location<br />
Future Probable Severity<br />
Buffer areas Negligible<br />
Forests Negligible<br />
Grassy areas Negligible<br />
Statement Statement Of Of Probable Probable Risk/Likeliness Risk/Likeliness Of Of Future Future Occurrence<br />
Occurrence<br />
There is a somewhat greater likelihood of future occurrences in <strong>Jefferson</strong> <strong>County</strong> as a result<br />
of the influx of greater numbers of residents moving into rural areas where the homes are<br />
close to forested areas and vegetative debris. Dry weather, available fuel and fires are<br />
sporadic phenomena that occur throughout the United States. Frequency, intensity, and<br />
duration of these conditions vary drastically from year to year.<br />
Based upon <strong>Jefferson</strong> <strong>County</strong>’s lack of a great number of wildfires, a conflagration similar<br />
to those out <strong>West</strong> is unlikely, especially in light of the fact that the humidity and fuel<br />
source is not available. Fires will possibly occur, but on a much smaller scale. These will<br />
consist of grass fires along side roads and railroad tracks and fires near homes in rural<br />
areas. The following fire danger index used by MDC will be the criteria by which an<br />
evaluation of probable risk for <strong>Jefferson</strong> <strong>County</strong> will be developed.<br />
Level Level<br />
Probable Risk of Occurrence<br />
Low Fire Danger Possible<br />
Moderate Fire Danger Possible<br />
High Fire Danger Unlikely<br />
Extreme Fire Danger Unlikely<br />
Statement Statement Of Of Next Next Disaster’s Disaster’s Likely Likely Adverse Adverse Impact Impact On On Community<br />
Community<br />
Missouri Department of Conservation does not believe that Missouri, much less the EWG<br />
planning region as being included in a wildland fire disaster category. It may be a disaster<br />
to an individual, but it is not a disaster to a community. There is a somewhat greater<br />
likelihood of future occurrences in <strong>Jefferson</strong> <strong>County</strong> as a result of the influx of greater<br />
numbers of residents moving into rural areas where the homes are close to woods and<br />
vegetative debris.<br />
Without Without Mitigation Mitigation Mitigation Measures<br />
Measures<br />
Life Negligible<br />
Property Negligible<br />
Emotional Negligible<br />
Financial Negligible
146<br />
With With Mitigation Mitigation Mitigation Measures<br />
Measures<br />
Life Negligible<br />
Property Negligible<br />
Emotional Negligible<br />
Financial Negligible<br />
Recommendation<br />
Recommendation<br />
Recommendation<br />
<strong>Jefferson</strong> <strong>County</strong> – Section 2<br />
Missouri Department of Conservation and <strong>Jefferson</strong> <strong>County</strong> Fire Districts to develop an<br />
education outreach program for communities that have a greater chance of future fires.<br />
MDC has an ongoing educational effort in certain at risk areas. This effort includes visiting<br />
schools, local fairs and other events to educate and pass out fire prevention pamphlets in<br />
terms of seasonal or broad fire prevention approach. Establishing local ordinances to<br />
prohibit open burning during hazardous conditions is a proactive approach and will help<br />
reduce the number of wildland fires in the future.<br />
Multi Multi-Jurisdictional Multi Jurisdictional Risk Risk As Assessment As<br />
sessment In In In <strong>Jefferson</strong> <strong>Jefferson</strong> <strong>County</strong> <strong>County</strong> <strong>County</strong> and Communities<br />
<strong>Jefferson</strong> <strong>County</strong> hazards tend to be either geographically random or regional in nature.<br />
Some areas of the <strong>County</strong> have experienced affects from some tornadoes and localized<br />
flash flooding. The historic floods along the Mississippi River, especially the 1993 flood,<br />
greatly impacted the <strong>County</strong>. The <strong>County</strong> is also susceptible to impacts from earthquakes<br />
due to the proximity to the New Madrid Fault Zone, density of population, condition of the<br />
buildings, and geological environment. The <strong>County</strong> has experienced only scattered damage<br />
from winter storms, thunderstorms, and drought.<br />
Certain incorporated communities within <strong>Jefferson</strong> <strong>County</strong> that exhibit a unique flooding<br />
hazard profile, due to its location on the Mississippi and Meramec River floodplains include<br />
the following jurisdictions:<br />
Arnold<br />
Byrnes Mill<br />
Cedar Hill Lakes<br />
Crystal City<br />
DeSoto<br />
Festus<br />
Herculaneum<br />
Kimmswick<br />
Pevely<br />
Scotsdale<br />
Consequences from riverine and flash flooding could be catastrophic in terms of safety of<br />
lives and property. Riverine flooding is considered a primary hazard for the <strong>County</strong>.<br />
Significant Mississippi River flooding inundated the above communities in July 1947, July<br />
1951, August 1993, and May 1995. Significant Meramec River flooding also inundated
A Regional Overview All-Hazard Mitigation Plan 147<br />
Byrnes Mill and Arnold in May 1973, December 1982, August 1993, and April 1994.<br />
During the 1993 flood, in <strong>Jefferson</strong> <strong>County</strong>, $1,527,199 in public assistance was paid to<br />
claimants as a result of flood damage. In one community, the wastewater treatment plant<br />
was inundated by floodwaters; the community is currently constructing a levee and<br />
floodwall to protect the new infrastructure. Significant flash flooding occurred in the<br />
Meramec, Bourbeuse and Big River basins from an intense rainfall on May 7, 2000. The<br />
flooding resulted in two deaths, extensive damage to structures, roads and bridges and<br />
major economic losses from communities and businesses throughout the area.<br />
Communities including Byrnes Mill and Eureka (St. Louis <strong>County</strong>) were overwhelmed by the<br />
deluge that consisted of a thunderstorm that delivered up 15 inches of rain in 13 hours. A<br />
Federal Disaster declaration was made (DR-1328); damages and losses incurred totaled<br />
$483,511.22 in individual assistance, $473,000 in small business loans, and $574,002.26<br />
in public assistance. In 2003, flash flooding and a severe tornado resulted in inundation,<br />
one death and property storm damage in DeSoto with an estimated at $1 million dollars in<br />
damage.<br />
Consequences from earthquakes (and cascading hazards) could also be catastrophic in<br />
terms of human lives and property in the event of a larger magnitude earthquake (in the<br />
range of 6.7 to 8.6). The nearby New Madrid Fault Zone has the potential to produce an<br />
earthquake of this magnitude and cause damage similar to the earthquake that struck the<br />
San Francisco Bay region during the World Series. The nearby the Wabash Valley Fault and<br />
the fault zones in the vicinity of Farmington (including Big River Fault and the St. Genevieve<br />
Fault Zone) are also capable of producing lesser magnitude earthquakes. The earthquake<br />
hazard is also considered a primary hazard. Certain regions within the <strong>County</strong> are more<br />
susceptible to greater damage from earthquakes due to their position within the soil<br />
liquefaction zone, as identified by Missouri Department of Natural Resources, Geological<br />
Survey Resource Assessment Division, Earthquake Hazards Map of the St. Louis Metro Area.<br />
Areas outside of the soil liquefaction zone will most likely be impacted from an earthquake,<br />
but probably to a lesser degree. These incorporated communities within <strong>Jefferson</strong> <strong>County</strong><br />
that exhibit a unique earthquake hazard profile, due to its location on the Mississippi and<br />
Meramec River floodplains include the following jurisdictions:<br />
Arnold<br />
Byrnes Mill<br />
Cedar Hill Lakes<br />
Crystal City<br />
DeSoto<br />
Festus<br />
Herculaneum<br />
Kimmswick<br />
Pevely<br />
Scotsdale<br />
Refer to Figure J54 (located in the back of the Technical Appendix), which identifies the<br />
combined hazards for <strong>Jefferson</strong> <strong>County</strong>.
148<br />
<strong>Jefferson</strong> <strong>County</strong> – Section 2<br />
Vulnerability Assessment Worksheets for <strong>Jefferson</strong> <strong>County</strong> are located in the back of the<br />
Technical Appendix. These worksheets represent the loss estimates for each hazard<br />
affecting the county, including the communities listed above.<br />
Loss estimates were calculated using a combination of information found below. Rough<br />
economic estimates were also included.<br />
• The number of buildings was based on the recorded number of buildings from the<br />
assessor’s database.<br />
• Values of buildings represent the market value, rather than the dollar loss likely to<br />
result from a given event. Building damages could range from minimal to total<br />
devastation.<br />
• The number of people was derived from the 2000 U.S. Census, EWG, and Office of<br />
Social and Economic Development (OSEDA) databases.<br />
• Dollar figures were based on county assessor’s data and Saylor Construction Cost<br />
Index data.<br />
• Sources for these worksheets include the Missouri Department of Elementary and<br />
Secondary Education, Economic Development, Missouri Department of<br />
Conservation, Missouri Office of Economic Data Analysis; county assessor’s data,<br />
Saylor Construction Cost Index, and EWG databases.<br />
• Projected figures were calculated using the above numbers and factoring in<br />
population projection percentages from the community profile.<br />
For purposes of this assessment, “Developed Land” and “Undeveloped Land” categories<br />
EWG used the definition of the National Resources Conservation Service’s National<br />
Resources Inventory, 2001 (NRI).
A Regional Overview All-Hazard Mitigation Plan 149<br />
WORKSHEETS<br />
WORKSHEETS<br />
JEFFERSON JEFFERSON COUNTY COUNTY HAZARD HAZARD ANALYSIS ANALYSIS NARRATIVE NARRATIVE WORKSHEETS<br />
WORKSHEETS<br />
JEFFERSON JEFFERSON COUNTY COUNTY HAZAR HAZARD HAZAR D PROFILE WORKSHEETS<br />
JEFFERSON JEFFERSON COUNTY COUNTY RISK RISK ASSESSMENT ASSESSMENT WORKSHEETS<br />
WORKSHEETS<br />
JEFFERSON JEFFERSON COUNTY COUNTY RISK RISK INDEX INDEX WORKSHEETS<br />
WORKSHEETS<br />
JEFFERSON JEFFERSON COUNTY COUNTY VULNERABILITY VULNERABILITY WORKSHEETS<br />
WORKSHEETS<br />
Municipality Municipality and and School School District District Risk Risk Analysis/Mitigation Analysis/Mitigation Measure(s)/<br />
Measure(s)/<br />
Benefit Benefit Cost Cost Cost Review Review can can be be found found in in Vo Volume Vo Vo lume 22<br />
2
150<br />
Hazard: Hazard: Dam Dam Failure Failure<br />
Failure<br />
HAZARD HAZARD ANALYSIS ANALYSIS NARRATIVE<br />
NARRATIVE<br />
<strong>Jefferson</strong> <strong>County</strong> – Section 2<br />
Description Description of of Hazard Hazard (Type of hazard, pathways/areas likely affected, type of damage,<br />
etc.)<br />
A dam failure is defined as structural failure of materials used in dam construction,<br />
inadequate maintenance, overtopping by flood, foundation defects and piping/cracking<br />
caused by movements from settling of dam.<br />
Damage occurs downstream from a failing dam to lives of residents and their property,<br />
businesses, infrastructure. Depending upon volume of water released, damage could be<br />
catastrophic in a limited area.<br />
Historical Historical Statistics Statistics (Frequency, strength, # of lives lost, # of injuries, economic losses, etc.)<br />
Based on the National Dam Inventory maintained by the USCOE, Missouri has 607<br />
dams that are considered a high hazard. Historic dam failures have occurred just<br />
south of the EWGCC region near Lawrenceton in 1968 (Ste. Genevieve <strong>County</strong>),<br />
Washington <strong>County</strong> in 1975, in Fredericktown in 1968 (Madison <strong>County</strong>) and a near<br />
failure in Franklin <strong>County</strong> in 1978. The EWGCC region has the largest number of<br />
dams in Missouri. No lives have been lost as a result of these dam failures. No data<br />
is available on the number of injuries or economic losses as a result of these failures.<br />
Statement Statement of of Future Future Probable Probable Severity Severity (Catastrophic/Critical/Limited/Negligible). Severity<br />
of future dam failures will be catastrophic in the path of the released waters. For<br />
topographically higher areas surrounding the failed dam, negligible impacts will occur.<br />
Statement Statement of of Probable Probable Risk Risk (Likeliness of future occurrence- (Highly<br />
Likely/Likely/Possible/Unlikely). According to Missouri Department of Natural Resources, Dam<br />
and Reservoir Safety Program, it is likely that future occurrences of dam failures will occur<br />
based on the poor conditions of the existing dams.<br />
Statement Statement of of Next Next Disaster’s Disaster’s Likely Likely Adverse Adverse Impact Impact on on the the Community<br />
Community<br />
(Catastrophic/Critical/Limited/Negligible). Severity of future dam failures will be catastrophic<br />
in the path of the released waters. For topographically higher areas surrounding the failed<br />
dam, negligible impacts will occur.<br />
Without mitigation measures: Life Property Emotional Financial<br />
Comments:<br />
Catastrophic Catastrophic Catastrophic Catastrophic Catastrophic Catastrophic Catastrophic Catastrophic<br />
Catastrophic<br />
With mitigation measures: Life Property Emotional Financial<br />
Negligible Negligible Negligible Negligible Negligible Negligible Negligible<br />
Negligible
A Regional Overview All-Hazard Mitigation Plan 151<br />
Comments:<br />
Recommendation: Recommendation: EWGCC Hazard Mitigation Planning Committee to initiate mitigation<br />
activity to convince legislators to provide adequate funding to staff the Dam and Reservoir<br />
Safety Program for inspections, permit issuance in order to protect human life and property.
152<br />
HAZARD HAZARD ANALYSIS ANALYSIS ANALYSIS NARRATIVE NARRATIVE<br />
NARRATIVE<br />
Hazard: Hazard: Drought<br />
Drought<br />
<strong>Jefferson</strong> <strong>County</strong> – Section 2<br />
Description Description of of Hazard Hazard (Type of hazard, pathways/areas likely affected, type of damage,<br />
etc.) Drought is defined as the deficiency of precipitation over an extended period of time,<br />
usually a season or more; resulting in extensive damage to crops. Meteorological drought is<br />
the expression of precipitation’s departure from normal over some time period. Agricultural<br />
drought occurs when there isn’t enough soil moisture to meet the needs of a particular<br />
crop at a particular time. Hydrologic drought refers to the deficiencies in surface and<br />
subsurface water supplies; measured as stream flow, lake and groundwater levels.<br />
Socioeconomic drought occurs when physical water shortage starts to affect people.<br />
Drought characteristics include economic, social and environmental. The amount of<br />
damage depends on 1). The length/severity of the drought, 2). Damage can range from very<br />
slight to total.<br />
Historical Historical Statistics Statistics (Frequency, strength, # of lives lost, # of injuries, economic losses,<br />
etc.) Droughts are classified according to various classifications. The National Drought<br />
Mitigation Center created a drought map that uses the Palmer Index, Crop Moisture Index,<br />
Standardized Precipitation Indices, Percent of Normal Rainflow, Daily Streamflow,<br />
Snowpack, Soil Moisture, Vegetative Index and Fire Danger Classifications. According to<br />
The Missouri Climate Center at UMC, the Drought Monitor map is the drought indicator of<br />
choice and is superior to the Palmer Index. The Palmer Index is good for past droughts.<br />
However, the NDMC drought monitor map is the best tool to use.<br />
The EWGCC planning region is divided into two climate divisions (CD): St. Louis City, St.<br />
Louis, St. Charles, and Franklin counties are within CD #2. <strong>Jefferson</strong> <strong>County</strong> is located in<br />
CD #5. According to the Missouri Climate Center, the worst droughts on record to affect<br />
CD#2 occurred in 1901-1902, 1913-14, 1930-31, 1934, 1936, 1940-41, 1953-56, 1963-<br />
64, 1980-81, 1988-89 and 1999-2000. Droughts on record that affected CD#5 occurred<br />
in 1900-09, 1940-49, 1950-59, 1964-66 and 1980. In addition, MDNR divided the state<br />
into three regions, prioritized according to drought susceptibility, slight, moderate and<br />
severe. The EWGCC region is within all three regions. St. Louis city and northern <strong>Jefferson</strong><br />
<strong>County</strong> is in region C (high susceptibility). <strong>East</strong> half of St. Chalres <strong>County</strong> and northern<br />
portions (floodplain areas) of St. Louis and Franklin Counties are within Region A (slight<br />
susceptibility). The western half of St. Charles <strong>County</strong> is included in Region B (moderate<br />
susceptibility).<br />
On average, drought costs the U.S. economy about $7-$9 billion a year according to the<br />
National Drought Mitigation Center. Losses from the drought from 1988 to 1989 are<br />
estimated to have cost $39 billion dollars.<br />
Statement Statement of of Future Future Probable Probable Severity Severity (Catastrophic/Critical/Limited/Negligible)-<br />
Catastrophic to limited.<br />
Statement Statement of of Probable Probable Risk Risk (Likeliness of future occurrence-Highly<br />
Likely/Likely/Possible/Unlikely)- Likely
A Regional Overview All-Hazard Mitigation Plan 153<br />
Statement Statement of of Next Next Disaster’s Disaster’s Likely Likely Adverse Adverse Impact Impact on on the the Community<br />
Community<br />
(Catastrophic/Critical/Limited/Negligible)-Catastrophic to limited<br />
Without Mitigation Measures: Life Property Emotional Financial<br />
Comments:<br />
Negligible Limited Limited Limited Limited Critical<br />
With Mitigation Measures: Life Property Emotional Financial<br />
Comments<br />
Limited Limited Limited Limited Limited Limit<br />
Limited<br />
Recommendations: Recommendations: That the <strong>County</strong> Hazard Mitigation Planning Committee<br />
initiate a mitigation activity to convince state and local government, and county residents to<br />
help reduce the impacts caused by droughts, by implementing the state drought plan.
154<br />
HAZARD HAZARD ANALYSIS ANALYSIS ANALYSIS NARRATIVE NARRATIVE<br />
NARRATIVE<br />
Hazard: Hazard: Earthquake<br />
Earthquake<br />
<strong>Jefferson</strong> <strong>County</strong> – Section 2<br />
Description Description of of Hazard Hazard (Type of hazard, pathways/areas likely affected, type of damage,<br />
etc.)<br />
The characteristics of earthquakes include the rolling or shaking of the ground surface,<br />
landslides, liquefaction and amplification. The severity depends on several factors including<br />
soil/slope conditions, closeness to the fault, earthquake magnitude and type of earthquake.<br />
Any person or structure that is present in the land closest to the epicenter will be most<br />
severely affected. Persons or structures farther away from the epicenter will be less severely<br />
affected, dependent upon the geology of the area. The amount of damage depends on 1).<br />
The intensity/strength of the earthquake, 2). The proximity of the earthquake, 3). The<br />
strength/construction of the structure, 4). How well a person is sheltered. Damage can<br />
range from very slight to total.<br />
Histori Historical Histori Histori cal Statistics Statistics Statistics (Frequency, strength, # of lives lost, # of injuries, economic losses,<br />
etc.)<br />
Since 1811 there have been 16 earthquakes affecting the EWGCC ranging in magnitude<br />
from 2.4 to 8.2 on the Richter scale. The earthquakes have caused multiple deaths,<br />
.injuries, and damaged properties in the past. The Center for Earthquake Studies estimated<br />
that from a 7.6 scale earthquake, there will be over 1400 deaths, and $2.5 million dollars in<br />
property damage and $500K in utility damage. This data excludes St. Charles and Franklin<br />
Counties due to unavailability.<br />
Statement Statement of of Future Future Probable Probable Severity Severity (Catastrophic/Critical/Limited/Negligible)<br />
Catastrophic<br />
Statement Statement of of Probable Probable Risk Risk (Likeliness of future occurrence- (Highly<br />
Likely/Likely/Possible/Unlikely)<br />
Possible<br />
Statement Statement of of Next Next Disaster’s Disaster’s Likely Likely Adverse Adverse Impact Impact on on the the Community<br />
Community<br />
(Catastrophic/Critical/Limited/Negligible)-Catastrophic<br />
The Center for Earthquake Studies estimated that from a 7.6 scale earthquake, there will be<br />
over 1400 deaths, and $2.5 million dollars in property damage and $500K in utility<br />
damage. This data excludes St. Charles and Franklin Counties due to unavailability.<br />
Without mitigation measures: Life Property Emotional Financial<br />
Catastrophic Catastrophic CCatastrophic<br />
C atastrophic Catastrophic Catastrophic<br />
With mitigation measures: Life Property Emotional Financial<br />
Limited Limited Limited Limited Critical Critical Limited<br />
Limited
A Regional Overview All-Hazard Mitigation Plan 155<br />
Recommendation: The <strong>County</strong> Hazard Mitigation Planning Committee to initiate a<br />
mitigation activity to convince various government agencies, businesses, county<br />
residents to retrofit buildings/infrastructure, businesses and homes in earthquake<br />
prone areas to help reduce the loss of life caused by earthquakes.
156<br />
HAZARD HAZARD ANALYSIS ANALYSIS ANALYSIS NARRATIVE NARRATIVE<br />
NARRATIVE<br />
Hazard: Hazard: Flood Flood<br />
Flood<br />
<strong>Jefferson</strong> <strong>County</strong> – Section 2<br />
Description Description of of Hazard Hazard Hazard (Type of hazard, pathways/areas likely affected, type of damage,<br />
etc.) A flood is defined as an overflow or inundation that comes from a river or other<br />
body of water or causes or threatens damage, or any relatively high streamflow that<br />
overtops the natural or artificial banks in any reach of stream. The National Flood Insurance<br />
Program defines a flood as a general and temporary condition of partial or complete<br />
inundation of two or more acres of normally dry land or of two or more properties from<br />
inland waters, unusual and rapid accumulation or runoff of waters from any source or a<br />
mudflow. Floods are most likely to occur in the spring, but can occur in any time of the<br />
year. Any person or structure that is present in the path of floodwaters as described above<br />
could be damaged. Damage is most likely to occur within the flood insurance rate map<br />
designated 100 and 500-year areas. The amount of damage depends on 1). The<br />
intensity/strength of the flood, 2). The proximity of the flood to the person/structure.<br />
Damage can range from very slight to total. Hazards range from death to total property<br />
damage from floodwaters.<br />
Historical Historical Statistics Statistics (Frequency, strength, # of lives lost, # of injuries, economic losses,<br />
etc.) The <strong>East</strong>-<strong>West</strong> <strong>Gateway</strong> <strong>Coordinating</strong> <strong>Council</strong> planning region has many river and<br />
small tributaries in both the unincorporated and incorporated areas that are susceptible to<br />
flooding. Catastrophic floods have occurred in the EWGCC region in 1927, 1951, 1973,<br />
1979, 1982, 1984, 1986, 1993, 1994, 1994, 1995, 1998, 1999 and 2000. In the<br />
Chesterfield Valley of St. Louis <strong>County</strong> alone, damage from the 1993 flood totaled $200<br />
million. (In the 1993 flood approximately $21 billion dollars in damage and costs and 48<br />
deaths resulted (NOAA.) Multiple lives have been lost from flooding; 49 deaths were<br />
recorded from the 1993 Flood.<br />
Statement Statement of of Futu Future Futu re Probable Severity (Catastrophic/Critical/Limited/Negligible) Critical<br />
Statement Statement of of Probable Probable Risk Risk (Likeliness of future occurrence- (Highly<br />
Likely/Likely/Possible/Unlikely)-Highly Likely to occur in future<br />
Statement Statement Statement of of of Next Next Next Disaster’s Disaster’s Disaster’s Likely Likely Likely Adverse Adverse Adverse Im Impact Im Impact<br />
pact on on on the the the Community Community<br />
Community<br />
(Catastrophic/Critical/Limited/Negligible)<br />
Without mitigation measures: Life Property Emotional Financial<br />
Catastrophic Catastrophic Catastrophic Catastrophic Catastrophic Catastrophic Catastrophic<br />
Catastrophic<br />
With mitigation measures: Life Property Emotional Financial<br />
Limited Limited Limited Limited
A Regional Overview All-Hazard Mitigation Plan 157<br />
Recommendation: The <strong>County</strong> Hazard Mitigation Planning Committee to initiate a<br />
mitigation activity to convince county residents to build, move to higher ground or<br />
to retrofit homes in flood prone areas to help reduce the loss of life caused by<br />
floods.
158<br />
HAZARD HAZARD ANALYSIS ANALYSIS ANALYSIS NARRATIVE NARRATIVE<br />
NARRATIVE<br />
Hazard: Hazard: Heat Heat Wave<br />
Wave<br />
<strong>Jefferson</strong> <strong>County</strong> – Section 2<br />
Description Description of of Hazard Hazard (Type of hazard, pathways/areas likely affected, type of damage,<br />
etc.) A heat wave is defined as a prolonged period of excessive heat and humidity (three<br />
consecutive days of 90 degrees plus, Fahrenheit). This usually occurs in June, July and<br />
August. This can result in heat related deaths and damage to infrastructure. The amount of<br />
damage depends on 1). The intensity/length of the heat wave, 2). How well a person is<br />
sheltered.<br />
Historical Historical Statistics Statistics (Frequency, strength, # of lives lost, # of injuries, economic losses,<br />
etc.)<br />
Heat wave are likely to occur as frequently as in past history, or between 10 and<br />
100% in the next 10 years. In 1966, 246 individuals were reported to have died as<br />
a result of the heat in the St. Louis metropolitan area. St. Louis experienced heat<br />
waves in 1993, 1988, 1995, without experiencing death rates close to the total of<br />
113 in 1980. A total of 134 heat related deaths have occurred in St. Louis City from<br />
1989 through 2003. Thirty-nine deaths in this same time period occurred in St.<br />
Louis <strong>County</strong>. No information was available for the other counties. St. Louis ranks<br />
in the top five in the U.S. for heat related deaths.<br />
Statement Statement of of Future Future Probable Probable Severity Severity (Catastrophic/Critical/Limited/Negligible)<br />
Negligible to catastrophic dependent upon the location within the EWGCC<br />
region. The EWGCC region has a history of having multiple heat related<br />
deaths.<br />
Statement Statement of of Proba Probable Proba Probable<br />
ble Risk (Likeliness of future occurrence- (Highly<br />
Likely/Likely/Possible/Unlikely). It is highly likely that heat waves will occur in the future.<br />
Statement Statement of of Next Next Disaster’s Disaster’s Likely Likely Adverse Adverse Impact Impact on on the the Community<br />
Community<br />
(Catastrophic/Critical/Limited/Negligible). Catastrophic<br />
Without mitigation measures: Life Property Emotional Financial<br />
Catastrophic Catastrophic Critical Critical Catastrophic Catastrophic Limited<br />
Limited<br />
With mitigation measures: Life Property Emotional Financial<br />
Limited/Critical Negligible Limited Negligible<br />
Recommendation: The EWGCC Hazard Mitigation Planning Committee will support<br />
continuation of mitigation activity Operation Weather Survival that will assist at risk<br />
residents during heat waves in the region.
A Regional Overview All-Hazard Mitigation Plan 159<br />
HAZARD HAZARD ANALYSIS ANALYSIS ANALYSIS NARRATIVE NARRATIVE<br />
NARRATIVE<br />
Hazard: Hazard: Tornadoes/Severe Tornadoes/Severe Storms Storms (Downbursts, (Downbursts, (Downbursts, Lightening, Lightening, Ha Hail, Ha il, Heavy Rains, Rains,<br />
Wind)<br />
Wind)<br />
Description Description Description of of Hazard Hazard (Type of hazard, pathways/areas likely affected, type of damage,<br />
etc.) Tornadoes are cyclical windstorms or violently rotating column of air. Accompanying<br />
storm activities include severe thunder/electrical storms, down-bursts, straight-line winds,<br />
lightning, hail and heavy rain. The average forward speed of a tornado is about 30 m.p.h.<br />
but may vary from nearly stationary to 70 m.p.h. The average pathway may vary in any<br />
direction, but the average tornado moves from southwest to northeast. Tornadoes are<br />
most likely to occur between 3:00 p.m. and 9:00 p.m. but may ensue at any hour of the<br />
day. Any person or structure at any location could be damaged by a tornado. The amount<br />
of damage depends on 1). The strength of the tornado, 2) the tornado’s proximity to the<br />
person/structure, 3) the strength the structure, 4) how well a person is sheltered. Damage<br />
can range fro very slight to total. On average, tornadoes stay on the ground 30 minutes,<br />
covers 15 miles, is up to 300 years wide, although NOAA determined that the mean path<br />
length was 2.27 miles long and .14 square mile path in length. Most storms move from<br />
southwest to northeast and occur between 3 and 9 in the afternoon hours in the spring<br />
months.<br />
Historical Historical Statistics Statistics (Frequency, strength, # of lives lost, # of injuries, economic losses,<br />
etc.) Tornadoes are classified according to the F-scale (developed by Dr. Theodore Fujita).<br />
The F-scale ranks tornadoes according to its wind speed based on the severity of damage it<br />
caused. On May 27, 1896, 18 tornadoes struck St. Louis, resulting in 306 deaths and $15<br />
million dollars in damages. On May 9, 1927 two tornadoes struck St. Louis, the first killing<br />
306 people and causing $13 million in damages (between Missouri and Illinois). The<br />
second tornado killed 79 people and resulted in $23 million in damages. In November 1988<br />
a tornado struck the St. Charles community. Businesses were able to obtain Small Business<br />
Loans to recover from this disaster. Since 1950, St. Louis <strong>County</strong> has had 23 tornadoes, St.<br />
Charles has had 24, St. Louis City has had 3, <strong>Jefferson</strong> <strong>County</strong> has had 23 and Franklin has<br />
had 16 tornadoes. Since 1950, 11 deaths in St. Louis City have resulted from tornadoes. In<br />
this same period for St. Louis <strong>County</strong>, 13 deaths have resulted, one death in <strong>Jefferson</strong><br />
<strong>County</strong>, and none in St. Charles and Franklin Counties.<br />
F-SCALE SPEED IN M.P.H. COUNTY TORNADOES BY F-SCALE<br />
SINCE 1950?<br />
FO 40-72 F0 16 %<br />
F1 73-112 F1 32<br />
F2 113-157 F2 32<br />
F3 158-206 F3 14<br />
F4 207-260 F4 5<br />
F5 261-318 F5 0
160<br />
<strong>Jefferson</strong> <strong>County</strong> – Section 2<br />
Statement Statement of of Future Future Probable Probable Severity Severity (Catastrophic/Critical/Limited/Negligible)-<br />
Catastrophic<br />
F-SCALE SPEED IN M.P.H. COUNTY TORNADOES BY F-SCALE<br />
SINCE 1950?<br />
FO 40-72 F0 16%<br />
F1 73-112 F1 32<br />
F2 113-157 F2 32<br />
F3 158-206 F3 14<br />
F4 207-260 F4 5<br />
F5 261-318 F5 0<br />
Statement Statement of of Probable Probable Risk Risk (Likeliness of future occurrence-(Highly<br />
Likely/Likely/Possible/Unlikely)- highly likely<br />
F-SCALE SPEED IN M.P.H. COUNTY TORNADOES BY F-SCALE<br />
SINCE 1950?<br />
FO 40-72 F0 16%<br />
F1 73-112 F1 32<br />
F2 113-157 F2 32<br />
F3 158-206 F3 14<br />
F4 207-260 F4 5<br />
F5 261-318 F5 0<br />
Statement Statement of of Next Next Disaster’s Disaster’s Disaster’s Likely Likely Adverse Adverse Impact Impact on on the the Community<br />
Community<br />
(Catastrophic/Critical/Limited/Negligible)-Catastrophic<br />
Without Mitigation Measures: Life Property Emotional Financial<br />
Catastrophic Catastrophic Catastrophic Catastrophic Catastrophic Catastrophic<br />
With Mitigation Measures: Life Property Emotional Financial<br />
Limited Limited Limted Limted Limit Limited Limit ed Limited<br />
Limited<br />
Recommendations: Recommendations: That the <strong>County</strong> Hazard Mitigation Planning Committee<br />
initiate a mitigation activity to convince county residents to construct Tornado Saferooms to<br />
help reduce the loss of life caused by tornadoes.
A Regional Overview All-Hazard Mitigation Plan 161<br />
HAZARD HAZARD ANALYSIS ANALYSIS ANALYSIS NARRATIVE NARRATIVE<br />
NARRATIVE<br />
Hazard: Hazard: Wildland Wildland Fire<br />
Fire<br />
Description Description of of Hazard Hazard (Type of hazard, pathways/areas likely affected, type of damage,<br />
etc.)<br />
A wildland fire is defined as any nonstructure fire, other than prescribed fire, that<br />
occurs in the wildland. Wildland fires impact areas where a common urban/forest<br />
boundary, prairie and grassland is present. The line, area or zone where structures<br />
and other human development meet or intermingle with undeveloped wildland or<br />
vegetative fuels. The type of damage depends on the size of the fire. Typically in<br />
the EWGCC region, wildland fires are not a concern. Damage may be a partially<br />
burned outbuilding.<br />
Historical Historical Statistics Statistics Statistics (Frequency, strength, # of lives lost, # of injuries, economic losses,<br />
etc.)<br />
Fires usually occur in the spring and fall seasons. According to Missouri Department<br />
of Conservation, Forestry staff, in the past 20 years, approximately 4 to 5 fires have<br />
erupted in the EWGCC region. Most firefighting work in Missouri is done in<br />
regions that have large stands of trees and as support to fires in the western United<br />
States.<br />
Statement Statement of of of Future Future Probable Probable Severity Severity (Catastrophic/Critical/Limited/Negligible)-<br />
Negligible<br />
Statement Statement of of Probable Probable Risk Risk (Likeliness of future occurrence- (Highly<br />
Likely/Likely/Possible/Unlikely)-Possible<br />
Statement Statement of of Next Next Disaster’s Disaster’s Likely Likely Adverse Adverse Impact Impact on on the the Community<br />
Community<br />
(Catastrophic/Critical/Limited/Negligible)<br />
Without mitigation measures: Life Property Emotional Financial<br />
Negligible Negligible Negligible Negligible Negligible Negligible Negligible<br />
Negligible<br />
With mitigation measures: Life Property Emotional Financial<br />
Negligible Negligible Negligible Negligible Negligible Negligible Negligible<br />
Negligible<br />
Recommendation: Recommendation: The EWGCC Hazard Mitigation Planning Committee recommends<br />
mitigation activity to convince county residents to help reduce the damage to property and<br />
the potential loss of life caused by wildfires.
162<br />
HAZARD HAZARD ANALYSIS ANALYSIS ANALYSIS NARRATIVE NARRATIVE<br />
NARRATIVE<br />
Hazard: Hazard: Severe Severe Winter Winter Weather<br />
Weather<br />
<strong>Jefferson</strong> <strong>County</strong> – Section 2<br />
Description Description of of Hazard Hazard (Type of hazard, pathways/areas likely affected, type of damage,<br />
etc.) Severe winter weather is defined as sleet, freezing rain, and heavy snow. This can be<br />
accompanied by strong winds creating blizzard conditions, severe drifting and dangerous<br />
wind chill. Ice storms cause significant hazards as well. Communications and power can be<br />
disrupted for days, resulting in residents using alternate fuel sources that are likely to start<br />
fires. Strong winds with intense storms and cold fronts knock down trees, utility poles,<br />
power lines. Extreme cold often accompanies a winter storm in its wake. Winter weather<br />
can result in injuries, death, and property damage. Prolonged exposure to cold can cause<br />
frostbite, hypothermia can become life-threatening. The average pathway may vary in any<br />
direction, but the average winter storm moves from west to east. Winter storms are most<br />
likely to occur in November through February but may ensue from October through April.<br />
Any person or structure at any location could be damaged by a winter storm.<br />
Historical Historical Statistics Statistics Statistics (Frequency, strength, # of lives lost, # of injuries, economic losses,<br />
etc.) Economic losses are difficult to measure. Local governments, home and business<br />
owners can be faced with spending millions of dollars for snow removal, restoration of<br />
services, debris removal and landfill hauling. NOAA weather indicates that the Missouri<br />
counties north of the Missouri River receive an average snowfall of 18-22 inches, and<br />
counties south of the river receive an average of 8-12 inches. Historical statistics for the<br />
EWGCC include the winter storm in January 1994 that resulted in temperatures dropping to<br />
–20 F degrees below zero, with wind chills to –50 degrees F below zero. In January 1977,<br />
the EWGCC region received the maximum snowfall for the area at 23.9 inches of snow with<br />
temperatures hovering around –14 degrees F below zero. Also in January 1982, the<br />
EWGCC region received a 24 maximum snowfall of 13.9 inches with temperatures around –<br />
15 degrees F below zero. In February 1914, the EWGCC received the maximum snowfall for<br />
the area for this month at 23.5 inches of snow. In December 1973, the EWGCC region<br />
received its maximum snowfall for the area for this month at 26.3 inches. The coldest<br />
December on record was 1983 with temperature average of 20.5 degrees F. Multiple<br />
homes and businesses had water pipes break, people were admitted to hospitals for<br />
hypothermia/frostbite and schools were closed.<br />
Statement Statement of of Future Future Probable Probable Severity Severity (Catastrophic/Critical/Limited/Negligible). Ice<br />
storms could be limited to catastrophic<br />
Statement Statement of of Probable Probable Risk Risk (Likeliness of future occurrence-(Highly<br />
Likely/Likely/Possible/Unlikely) Winter/ice storms are likely to occur in the future.<br />
Statement Statement of of Next Next Disaster’s Disaster’s Likely Likely Adverse Adverse Impact Impact on on the the Community<br />
Community<br />
(Catastrophic/Critical/Limited/Negligible)
A Regional Overview All-Hazard Mitigation Plan 163<br />
Without Mitigation Measures: Life Property Emotional Financial<br />
Critical Critical Critical Critical Critical Critical Critical<br />
Critical<br />
With Mitigation Measures: Life Property Emotional Financial<br />
Limited Limited Limited Limited Limited Limited Limited<br />
Limited<br />
Recommendations: Recommendations: That the <strong>County</strong> Hazard Mitigation Planning Committee initiate a<br />
mitigation activity to convince county local governments, residents to help reduce the loss<br />
of life and property damage caused by winter storms by preparing for the storms and<br />
adhering to NOAA winter storm weather warnings.
164<br />
EA EARTHQUAKES<br />
EA RTHQUAKES<br />
<strong>Jefferson</strong> <strong>County</strong> – Section 2<br />
JEFFERSON JEFFERSON COUNTY COUNTY EARTHQUAKE EARTHQUAKE HAZARD HAZARD PROFILE PROFILE WORKSHEET<br />
WORKSHEET<br />
POTENTIAL POTENTIAL MAGNITUDE MAGNITUDE (Percentage of jurisdiction that can be affected):<br />
X Catastrophic<br />
Catastrophic: Catastrophic<br />
More than 50%<br />
_ Critical: 25% to 50%<br />
_ Limited: 10 to 25%<br />
_ Negligible: Negligible: Less than 10%<br />
FREQUENCY FREQUENCY OF OF OCCURRENCE:<br />
OCCURRENCE:<br />
_ Highly Likely: Near 100% probability in next year<br />
_ Likely: Likely: Between 10 and 100% probability in next year, or at least one chance in 10<br />
years<br />
X Possible: Possible: Between 1 and 10% probability in next year or at least one chance in next<br />
100 years.<br />
_ Unlikely: Less than 1% probability in next 100 years<br />
SEAS SEASONAL SEAS ONAL PATTERN:<br />
There is no known relationship between the occurrence of earthquakes and seasonal<br />
weather patterns.<br />
AREAS AREAS LIKELY LIKELY TO TO BE BE AFFECTED AFFECTED MOST MOST (BY (BY SECTOR):<br />
SECTOR):<br />
All areas in county(s) will be affected due to the widespread nature of earthquakes. Those<br />
counties farther south (<strong>Jefferson</strong>, southern, central St. Louis <strong>County</strong> and City will most likely<br />
be impacted more than farther counties north and west (Franklin and St. Charles) due to<br />
the closer proximity to the New Madrid Fault zone.<br />
PROBABLE PROBABLE DURATION: DURATION:<br />
DURATION:<br />
Initial earthquakes and subsequent aftershocks have been known to last in the range of<br />
three or more months (1811-1812 New Madrid Earthquake).<br />
POTENTIAL POTENTIAL SPEED SPEED OF OF ONSET<br />
ONSET<br />
(Probable amount of warning time)<br />
X Minimal (or no) warning<br />
_ 6 to 12 hours warning<br />
_ 12 to 24 hours warning<br />
_ More than 24 hours warning<br />
EXISTING EXISTING WARNING WARNING WARNING SYSTEMS: SYSTEMS: None<br />
COMPLETE COMPLETE COMPLETE VULNERABILITY VULNERABILITY ANALYSIS: ANALYSIS: ANALYSIS: Based on a Mercalli Scale Level VII earthquake, with<br />
an estimated damage in 80% of the county, it was estimated that in the developed
A Regional Overview All-Hazard Mitigation Plan 165<br />
portions of the county approximately 129,000 people would be impacted, 30,000<br />
buildings affected valued at $3 billion dollars. Projected risk for undeveloped areas: 54,450<br />
persons in 21,000 buildings valued at $1.5 billion dollars.<br />
COMMUNITIES: COMMUNITIES: Arnold, Byrnes Mill, Cedar Hill Lakes, Crystal City, DeSoto, Festus,<br />
Herculaneum, Kimmswick, Pevely, Scotsdale.
166<br />
FLOOD FLOOD HAZARD HAZARD PROFILE PROFILE WORKSHEET<br />
WORKSHEET<br />
FLOOD FLOOD HAZARD<br />
HAZARD<br />
<strong>Jefferson</strong> <strong>County</strong> – Section 2<br />
COMMUNITIES: COMMUNITIES: Arnold, Byrnes Mill, Cedar Hill Lakes, Crystal City, DeSoto, Festus,<br />
Herculaneum, Kimmswick, Pevely, Scotsdale<br />
POTENTIAL POTENTIAL MAGNITUDE MAGNITUDE (Percentage of jurisdiction that can be affected):<br />
_ Catastrophic<br />
Catastrophic: Catastrophic<br />
More than 50%<br />
X Critical: 25% to 50%<br />
_ Limited: 10 to 25%<br />
_ Negligible: Less than 10%<br />
FREQUENCY FREQUENCY FREQUENCY OF OF OF OCCURRENCE:<br />
OCCURRENCE:<br />
OCCURRENCE:<br />
_ Highly Likely: Near 100% probability in next year<br />
X Likely: Between 10 and 100% probability in next year, or at least one chance in 10<br />
years<br />
_ Possible: Between 1 and 10% probability in next year or at least one chance in next<br />
100 years.<br />
_ Unlikely: Less than 1% probability in next 100 years<br />
SEASO SEASONAL SEASO SEASONAL<br />
NAL PATTERN:<br />
Floods can occur anytime of the year; however, the most likely time of the year is in the<br />
spring due to winter thaw and spring rains.<br />
AREAS AREAS LIKELY LIKELY TO TO BE BE AFFECTED AFFECTED MOST MOST MOST (BY (BY SECTOR):<br />
SECTOR):<br />
Areas likely to be affected are areas designated on the Flood Insurance Rate Maps. Areas<br />
likely to be affected are dependent upon weather systems and storm track.<br />
PROBABLE PROBABLE DURATION:<br />
DURATION:<br />
Duration of flood can last a few hours up to three or more months of inundation.<br />
POTENTIAL POTENTIAL SPEED SPEED OF OF ONSET<br />
ONSET<br />
(Probable amount of warning time)<br />
X Minimal (or no) warning<br />
_ 6 to 12 hours warning<br />
_ 12 to 24 hours warning<br />
_ More than 24 hours warning<br />
EXISTING EXISTING EXISTING WARNING WARNING WARNING SYSTEMS: SYSTEMS: National Weather Service<br />
COMPLETE COMPLETE COMPLETE VULNERABILITY VULNERABILITY VULNERABILITY ANALYSIS: ANALYSIS: ANALYSIS: Based on a 100-year flood causing damage in 11%<br />
of the county (including Arnold, Byrnes Mill, Cedar Hill Lakes, Crystal City, DeSoto, Festus,<br />
Herculaneum, Kimmswick, Pevely, Scotsdale), in the developed portions of <strong>Jefferson</strong>
A Regional Overview All-Hazard Mitigation Plan 167<br />
<strong>County</strong>, approximately 36,000 persons and 5,400 buildings valued at $$540 million dollars<br />
could be affected. In the undeveloped portions of the county, approximately 11,000<br />
persons, and 3,800 buildings values at $280 million dollars could be impacted.
168<br />
JEFFERSON JEFFERSON COUNTY COUNTY HAZARD HAZARD PROFILE PROFILE WORKSHEET<br />
WORKSHEET<br />
HAZARD: HAZARD: Dam Failure<br />
POTENTIAL POTENTIAL MAGNITUDE<br />
MAGNITUDE MAGNITUDE (Percentage of jurisdiction that can be affected):<br />
X Catastrophic<br />
Catastrophic: Catastrophic<br />
More than 50%<br />
_ Critical: 25% to 50%<br />
_ Limited: 10 to 25%<br />
_ Negligible: Less than 10%<br />
<strong>Jefferson</strong> <strong>County</strong> – Section 2<br />
FREQUENCY FREQUENCY OF OF OCCURRENCE:<br />
OCCURRENCE:<br />
OCCURRENCE:<br />
_ Highly Likely: Near 100% probability in next year<br />
X Likely: Between 10 and 100% probability in next year, or at least one chance in 10<br />
years<br />
_ Possible: Possible: Between 1 and 10% probability in next year or at least one chance in next<br />
100 years.<br />
_ Unlikely: Less than 1% probability in next 100 years<br />
SEASONAL SEASONAL PATTERN:<br />
PATTERN:<br />
Dam failures would be related to seasonal patterns in terms the inability of a dam to<br />
withhold/withstand the deluge of a catastrophic rain event (spring rains) hitting a<br />
weakening dam infrastructure.<br />
AREAS AREAS LIKELY LIKELY TO TO BE BE AFFECTED AFFECTED AFFECTED MOST MOST (BY (BY SECTOR): SECTOR):<br />
SECTOR):<br />
Areas most likely affected will be downstream from dams; torrential floodwaters from<br />
failed dam descending upon residential homes, businesses, schools, agricultural lands, and<br />
outbuildings.<br />
PROBABLE PROBABLE PROBABLE DURATION: DURATION:<br />
DURATION:<br />
By the nature of dam failures, the duration of the event will be instantaneous and the<br />
duration of the failure could last up approximately six hours dependent upon the size of<br />
the reservoir.<br />
POTENTIAL POTENTIAL SPEED SPEED OF OF ONSET<br />
ONSET<br />
(Probable amount of warning time)<br />
X Minimal (or no) warning<br />
_ 6 to 12 hours warning<br />
_ 12 to 24 hours warning<br />
_ More than 24 hours warning<br />
EXISTING EXISTING WARNING WARNING SYSTEMS: SYSTEMS:<br />
SYSTEMS:<br />
A few large Missouri dams have monitoring systems, emergency action plans and warning<br />
systems. However, most dams in Missouri do not.
A Regional Overview All-Hazard Mitigation Plan 169<br />
COMPLETE COMPLETE VULNERABILITY VULNERABILITY ANALYSIS: ANALYSIS: Based on a single dam failure causing damage in<br />
½% of the county, in the developed portion of the county, it has been estimated that<br />
approximately 1,050 persons and 250 buildings valued at $25 million dollars may be<br />
impacted from water inundation. In the undeveloped portion of the county, it has been<br />
estimated that approximately 200 persons and 75 buildings valued at $80,000 may be<br />
impacted from water inundation.
170<br />
JEFFERSON JEFFERSON COUNTY COUNTY HAZARD HAZARD PROFILE PROFILE WORKSHEET<br />
WORKSHEET<br />
HAZARD: HAZARD: Drought<br />
POTENTIAL POTENTIAL MAGNITUDE MAGNITUDE (Percentage of jurisdiction that can be affected):<br />
_ Ca Catastrophic<br />
Ca<br />
tastrophic tastrophic: tastrophic More than 50%<br />
X Critical: 25% to 50%<br />
_ Limited: 10 to 25%<br />
_ Negligible: Negligible: Less than 10%<br />
<strong>Jefferson</strong> <strong>County</strong> – Section 2<br />
FREQUENCY FREQUENCY OF OF OCCURRENCE:<br />
OCCURRENCE:<br />
_ Highly Likely: Near 100% probability in next year<br />
X Likely: Between 10 and 100% probability in next year, or at least one chance in 10<br />
years<br />
_ Possible: Between 1 and 10% probability in next year or at least one chance in next<br />
100 years.<br />
_ Unlikely: Less than 1% probability in next 100 years<br />
SEASONAL SEASONAL PATTERN: PATTERN: Droughts usually occur over an extended period of time, usually a<br />
season or more. Droughts can begin during any season in a year.<br />
AREAS AREAS LIKELY LIKELY TO TO TO BE BE BE AFFECTED AFFECTED MOST MOST MOST (BY (BY SECTOR): SECTOR):<br />
SECTOR):<br />
All areas will most likely to be affected by drought including agricultural, hydrologic<br />
(streamflow, reservoir, groundwater resources) impacts (associated uses including<br />
irrigation, recreation, navigation, hydropower/utilities, wildlife habitat).<br />
PROBABLE PROBABLE DURATION:<br />
DURATION:<br />
Droughts have been known to last up to ten years in duration.<br />
POTENTIAL POTENTIAL SPEED SPEED OF OF ONSET<br />
ONSET<br />
(Probable amount of warning time)<br />
The onset of drought is very slow.<br />
_ Minimal (or no) warning<br />
_ 6 to 12 hours warning<br />
_ 12 to 24 hours warning<br />
X More than 24 hours warning<br />
EXISTING EXISTING EXISTING WARNING WARNING SYSTEMS: SYSTEMS: SYSTEMS: Missouri Department of Natural Resources has a warning<br />
system in place.<br />
COMPLETE COMPLETE VULNERABILITY VULNERABILITY ANAL ANALYSIS: ANAL YSIS: Based on regional drought statistics, the county<br />
could represent 1% of those damages. In the developed portion of the county, it was<br />
estimated that approximately 2,100 persons and 500 buildings/properties valued at $50<br />
million dollars could be impacted from the drought. In the undeveloped portion of the
A Regional Overview All-Hazard Mitigation Plan 171<br />
county, it was estimated that approximately 200 persons and 75 buildings/properties<br />
valued at $75,500 could be impacted from the drought.
172<br />
HAZARD: HAZARD: Wildland fires<br />
fires<br />
JEFFERSON JEFFERSON COUNTY COUNTY HAZARD HAZARD PROFILE PROFILE WORKSHEET<br />
WORKSHEET<br />
POTENTIAL POTENTIAL MAGNITUDE MAGNITUDE (Percentage of jurisdiction that can be affected):<br />
_ Catastrophic<br />
Catastrophic: Catastrophic<br />
More than 50%<br />
_ Critical: 25% to 50%<br />
_ Limited: 10 to 25%<br />
X Negligible: Negligible: Less than 10%<br />
<strong>Jefferson</strong> <strong>County</strong> – Section 2<br />
FREQUENCY FREQUENCY OF OF OCCURRENCE:<br />
OCCURRENCE:<br />
_ Highly Likely: Near 100% probability in next year<br />
_ Likely: Likely: Between 10 and 100% probability in next year, or at least one chance in 10<br />
years<br />
X Possible: Between 1 and 10% probability in next year or at least one chance in next<br />
100 years.<br />
_ Unlikely: Less than 1% probability in next 100 years<br />
SEASONAL SEASONAL PATTERN:<br />
Typically occur in warm months of year. Commonly occurs when there has been little<br />
rainfall.<br />
AREAS AREAS LIKELY LIKELY LIKELY TO TO BE BE AFFECTED AFFECTED AFFECTED MOST MOST (BY (BY SECTOR): SECTOR):<br />
SECTOR):<br />
Areas most likely to be affected are in rural areas where buildings, homes are next to<br />
forest.<br />
PROBABLE PROBABLE DDURATION:<br />
D URATION:<br />
Wildland fires in Missouri are typically short lived due to the type of fuel and climatic<br />
conditions. Fires that do occur may last up a couple of days.<br />
POTENTIAL POTENTIAL SPEED SPEED OF OF ONSET<br />
ONSET<br />
(Probable amount of warning time)<br />
X Minimal (or no) warning<br />
_ 6 to 12 hours warning<br />
_ 12 to 24 hours warning<br />
_ More than 24 hours warning<br />
EXISTING EXISTING EXISTING WARNING WARNING SYSTEMS: SYSTEMS: Local fire department.<br />
COMPLETE COMPLETE VULNERABILITY VULNERABILITY ANALYSIS:<br />
ANALYSIS:<br />
The EWGCC region is not vulnerable to wildland fires in Missouri are typically short lived<br />
due to the type of fuel and climatic conditions. Fires may concentrate near the grasses<br />
along roadsides or where rural homes are adjacent to forested areas. Based on a large<br />
wildfire causing damage in 1% of the county, in the developed portion of the county, it
A Regional Overview All-Hazard Mitigation Plan 173<br />
was estimated that approximately 1,050 people and 250 buildings valued at $25 billion<br />
dollars in damage could be impacted from a fire. In the undeveloped portion of the<br />
county, it was estimated that approximately 250 persons and 75 buildings valued at<br />
$79,000 dollars in damage could be impacted from a fire.
174<br />
HAZARD: HAZARD: Heat Wave<br />
JEFFERSON JEFFERSON COUNTY COUNTY HAZARD HAZARD PROFILE PROFILE WORKSHEET<br />
WORKSHEET<br />
POTENTIAL POTENTIAL MAGNITUDE MAGNITUDE (Percentage of jurisdiction that can be affected):<br />
_ Catastrophic<br />
Catastrophic: Catastrophic<br />
More than 50%<br />
X Critical: 25% to 50%<br />
_ Limite Limited: Limite<br />
d: 10 to 25%<br />
_ Negligible: Negligible: Less than 10%<br />
<strong>Jefferson</strong> <strong>County</strong> – Section 2<br />
FREQUENCY FREQUENCY OF OF OCCURRENCE:<br />
OCCURRENCE:<br />
_ Highly Likely: Near 100% probability in next year<br />
X Likely: Between 10 and 100% probability in next year, or at least one chance in 10<br />
years<br />
_ Possible: Between 1 and 10% probability in next year or at least one chance in next<br />
100 years.<br />
_ Unlikely: Less than 1% probability in next 100 years<br />
SEASONAL SEASONAL PATTERN:<br />
PATTERN:<br />
Heat waves typically occur in the summer months of June, July and August.<br />
AREAS AREAS LIKELY LIKELY TO TO TO BE BE BE AFFECTED AFFECTED MOST MOST (BY (BY SECTOR): SECTOR):<br />
SECTOR):<br />
Every sector of the entire planning region will be affected by a heat wave.<br />
PROBABLE PROBABLE DURATION: DURATION:<br />
DURATION:<br />
Heat wave occurrences have been known to last approximately one month.<br />
POTENTIAL POTENTIAL SPEED SPEED OF OF ONSET<br />
ONSET<br />
(Probable amount of warning time)<br />
_ Minimal (or no) warning<br />
_ 6 to 12 hours warning<br />
X 12 to 24 hours warning<br />
_ More than 24 hours warning<br />
EXISTING EXISTING EXISTING WARNING WARNING SYSTEMS: SYSTEMS: SYSTEMS: National Weather Service<br />
COMPLETE COMPLETE VULNERABILITY VULNERABILITY ANALYSIS:<br />
ANALYSIS:<br />
The EWGCC region is extremely vulnerable to heat wave hazard based upon the summer<br />
weather characteristics; St. Louis has been included in the top five cities in the U.S. for<br />
having the largest number of heat related deaths. Based on regional heat wave statistics,<br />
the county could represent 5% of those damages. In the developed portion of the county,<br />
it was estimated that approximately 2,100 persons and 500 buildings valued at $49 million<br />
dollars could be impacted by a heat wave. In the undeveloped portion of the county, it
A Regional Overview All-Hazard Mitigation Plan 175<br />
was estimated that approximately 200 persons and 75 buildings valued at $79,000 dollars<br />
could be impacted by a heat wave.
176<br />
HAZARD: HAZARD: Tornado<br />
JEFFERSON JEFFERSON COUNTY COUNTY HAZARD HAZARD PROFILE PROFILE WORKSHEET<br />
WORKSHEET<br />
POTENTIAL POTENTIAL MAGNITUDE MAGNITUDE (Percentage of jurisdiction that can be affected):<br />
_ Catastrophic<br />
Catastrophic: Catastrophic<br />
More than 50%<br />
_ Critical: 25% to 50%<br />
_ Limited: 10 to 25%<br />
X Neglig Negligible: Neglig<br />
ible: ible: Less than 10%<br />
<strong>Jefferson</strong> <strong>County</strong> – Section 2<br />
FREQUENCY FREQUENCY OF OF OCCURRENCE:<br />
OCCURRENCE:<br />
_ Highly Likely: Near 100% probability in next year<br />
X Likely: Between 10 and 100% probability in next year, or at least one chance in 10<br />
years<br />
_ Possible: Between 1 and 10% probability in next year or at least one chance in next<br />
100 years.<br />
_ Unlikely: Less than 1% probability in next 100 years<br />
SEASONAL SEASONAL PATTERN: PATTERN: Tornadoes normally occur in the spring and early summer<br />
months.<br />
AREAS AREAS LIKELY LIKELY TO TO TO BE BE BE AFFECTED AFFECTED MOST MOST MOST (BY (BY SECTOR): SECTOR):<br />
SECTOR):<br />
Areas most likely to be affected are dependent upon weather system and storm track.<br />
PROBABLE PROBABLE PROBABLE DURATION: DURATION: Tornadoes move through at an average speed on 30 miles per<br />
hour.<br />
POTENTIAL POTENTIAL SPEED SPEED OF OF ONSET ONSET<br />
ONSET<br />
(Probable amount of warning time)<br />
X Minimal (or no) warning<br />
_ 6 to 12 hours warning<br />
_ 12 to 24 hours warning<br />
_ More than 24 hours warning<br />
EXISTING EXISTING WARNING WARNING SYSTEMS:<br />
SYSTEMS:<br />
National Weather System and tornado weather sirens.<br />
COMPLETE COMPLETE VULNERABILITY VULNERABILITY ANALYSIS:<br />
ANALYSIS:<br />
The EWGCC region is extremely vulnerable for tornado hazards, with 115 total tornadoes<br />
recorded by the National Weather Service. St. Louis has a history of six F4 devastating<br />
tornadoes. This analysis is based on an F4 tornado causing damage in 5% of the county.<br />
In the developed portion of the county, it was estimated that 10,500 persons and 2,500<br />
buildings valued at $245 million dollars could be affected by this disaster. In the
A Regional Overview All-Hazard Mitigation Plan 177<br />
undeveloped portion of the county, it was estimated that 4,500 persons and 1,750<br />
buildings valued at $131million dollars could be affected by this disaster.
178<br />
HAZARD: HAZARD: Winter Winter Weather<br />
JEFFERSON JEFFERSON COUNTY COUNTY HAZA HAZARD HAZA RD PROFILE WORKSHEET<br />
POTENTIAL POTENTIAL MAGNITUDE MAGNITUDE (Percentage of jurisdiction that can be affected):<br />
_ Catastrophic<br />
Catastrophic: Catastrophic<br />
More than 50%<br />
_ Critical: 25% to 50%<br />
X Limited: 10 to 25%<br />
_ Negligible: Negligible: Less than 10%<br />
<strong>Jefferson</strong> <strong>County</strong> – Section 2<br />
FREQUENCY FREQUENCY OF OF OCCURRENCE:<br />
OCCURRENCE:<br />
OCCURRENCE:<br />
_ Highly LLikely:<br />
L<br />
ikely: Near 100% probability in next year<br />
X Likely: Between 10 and 100% probability in next year, or at least one chance in 10<br />
years<br />
_ Possible: Between 1 and 10% probability in next year or at least one chance in next<br />
100 years.<br />
_ Unlikely: Less than 1% probability in next 100 years<br />
SEASONAL SEASONAL PATTERN: PATTERN: Late fall, winter and early spring months<br />
AREAS AREAS LIKELY LIKELY LIKELY TO TO BE BE AFFECTED AFFECTED AFFECTED MOST MOST (BY (BY SECTOR): SECTOR):<br />
SECTOR):<br />
Areas most likely to be affected are dependent upon weather patterns and track of storms.<br />
PROBABLE PROBABLE DURATION: DURATION: Two to three days<br />
POTENTIAL POTENTIAL SPEED SPEED OF OF ONSET<br />
ONSET<br />
(Probable amount of warning time)<br />
_ Minimal (or no) warning<br />
_ 6 to 12 hours warning<br />
_ 12 to 24 hours warning<br />
X More than 24 hours warning<br />
EXISTING EXISTING WARNING WARNING SYSTEMS: SYSTEMS: National Weather Service<br />
COMPLETE COMPLETE VULNERABILITY VULNERABILITY ANALYSI ANALYSIS: ANALYSI ANALYSI S: This analysis is based on regional severe winter<br />
statistics; the analysis assumes that the county could represent 1% of those damages. In<br />
the developed portion of the county, it was estimated that approximately 2,100 persons<br />
and 500 buildings valued at $50 million dollars could be affected by this disaster. In the<br />
undeveloped portion of the county, it was estimated that approximately 3 persons and<br />
1building valued at $1million dollars could be affected by this disaster.
A Regional Overview All-Hazard Mitigation Plan 179<br />
RISK RISK ASSESSMENT ASSESSMENT WORKSHEET<br />
WORKSHEET- WORKSHEET JEFFERSON COUNTY<br />
Dam Dam Failure Failure<br />
Failure<br />
Sector Sector<br />
Essential Facilities at at Risk<br />
Buildings downstream from failed dam<br />
Population at Risk<br />
Individuals living downstream from dams<br />
that are failing<br />
Infrastructure at Risk<br />
Roads, bridges, utilities<br />
Property Property at at Ris Risk Ris<br />
Expected Extent of<br />
Percent Percent of of Sector<br />
Sector<br />
Damage<br />
Damage<br />
Property<br />
Property<br />
Catastrophic<br />
Catastrophic- Catastrophic in areas<br />
5<br />
affected, affected, damage damage could<br />
could<br />
be be catastrophic catastrophic catastrophic in in path<br />
path<br />
of of released released released waters<br />
waters<br />
Critical Critical<br />
5<br />
Limited Limited-topographically<br />
Limited topographically<br />
10<br />
higher higher areas areas<br />
areas<br />
Negligible Negligible<br />
80<br />
RISK RISK RISK ASSESSMENT ASSESSMENT WORKSHEET<br />
WORKSHEET- WORKSHEET JEFFE JEFFERSON JEFFE<br />
RSON COUNTY<br />
Drought<br />
Drought<br />
Sector Sector<br />
Essential Facilities at Risk<br />
All essential facilities that depend on water<br />
will be at risk.<br />
Population at Risk<br />
In severe drought, entire population living<br />
and working in <strong>Jefferson</strong> <strong>County</strong>, the health<br />
and welfare of humans and animals is at risk.<br />
Infrastructure at at Risk<br />
Entire infrastructure pertaining to water<br />
supply, water treatment, utility operations<br />
will be affected.<br />
Property at Risk Risk<br />
Expected Extent of<br />
Percent Percent of of Sector Sector<br />
Sector<br />
Damage<br />
Damage<br />
Property Property<br />
Property<br />
Catastrophic<br />
Catastrophic- Catastrophic<br />
45<br />
Critic Critical Critic Critical<br />
al-Damage al Damage to<br />
essential essential essential facilities,<br />
facilities,<br />
45
180<br />
RISK RISK ASSESSMENT ASSESSMENT WORKSHEET<br />
WORKSHEET- WORKSHEET JEFFE JEFFERSON JEFFE<br />
RSON COUNTY<br />
Drought<br />
Drought<br />
population,<br />
population,<br />
infrastructure,<br />
infrastructure,<br />
infrastructure,<br />
agricultural agricultural industry industry will will<br />
will<br />
be be be critical critical critical to to catastrophic<br />
catastrophic<br />
Limited Limited<br />
5<br />
Negligible Negligible<br />
5<br />
RISK RISK ASSESSMENT ASSESSMENT WORKSHEET<br />
WORKSHEET- WORKSHEET JEFFERSON JEFFERSON COUNTY<br />
Earthquake<br />
Earthquake<br />
Flood Flood<br />
Flood<br />
<strong>Jefferson</strong> <strong>County</strong> – Section 2<br />
Sector Sector<br />
Essential Facilities at Risk Risk<br />
Worst case scenario-older buildings or those<br />
not constructed to building code, near total<br />
devastation from New Madrid earthquake<br />
Population at Risk<br />
Entire population at risk in older buildings or<br />
those not constructed to building code<br />
Infrastructure at at Risk<br />
Entire infrastructure at risk in older facilities<br />
or those not constructed to building code<br />
Property at Risk Risk<br />
Expected Extent of<br />
Percent Percent of of Sector Sector<br />
Sector<br />
Damage<br />
Damage<br />
Property<br />
Property<br />
Catastrophic<br />
Catastrophic-near Catastrophic near total<br />
45<br />
devastation<br />
devastation<br />
Critical Critical<br />
45<br />
Limited Limited<br />
5<br />
Negligible Negligible<br />
5<br />
RISK RISK ASSESSMENT ASSESSMENT WORKSHEET<br />
WORKSHEET- WORKSHEET JEFFERSON COUNTY<br />
Sector Sector<br />
Essential Facilities at Risk<br />
Those facilities in low lying areas within 100<br />
or 500 year floodplains not constructed to<br />
building code.<br />
Population at Risk
A Regional Overview All-Hazard Mitigation Plan 181<br />
Flood<br />
Flood<br />
RISK RISK ASSESSMENT ASSESSMENT WORKSHEET<br />
WORKSHEET- WORKSHEET JEFFERSON JEFFERSON COUNTY<br />
Those living and working in low lying areas<br />
within 100 or 500-year floodplains in<br />
buildings not constructed to building code.<br />
Infrastructure at Risk<br />
Infrastructure in poor condition or located in<br />
low-lying areas within 100 or 500-year<br />
floodplains in facilities not constructed to<br />
building code.<br />
Property at Risk<br />
Expected Extent of<br />
Percent Percent Percent of of Sector<br />
Sector<br />
Damage<br />
Damage<br />
Property<br />
Property<br />
Catastrophic<br />
Catastrophic<br />
Critical<br />
Critical<br />
Limited Limited-11%<br />
Limited 11%<br />
11% 11% area of county<br />
subject to flooding risk<br />
to 100-year event<br />
Negligible Negligible<br />
89%<br />
RISK RISK ASSESSMENT ASSESSMENT WORKSHEET<br />
WORKSHEET- WORKSHEET JEFFERSON COUNTY<br />
Heat Heat Wave<br />
Wave<br />
Sector ector Essential Facilities at Risk<br />
All facilities affected by heat (no air<br />
conditioning) are at risk<br />
Population at Risk<br />
Entire population at risk; elderly, young, ill,<br />
homeless people<br />
Infrastructure at at Risk<br />
All infrastructure affected by heat (roads,<br />
bridges, rail lines) is at risk<br />
Property at Risk Risk<br />
Expected Extent of<br />
Percent Percent of of Sector Sector<br />
Sector<br />
Damage<br />
Damage<br />
Property<br />
Property<br />
Catastrophic<br />
Catastrophic-limited Catastrophic limited to<br />
Approximately 14%<br />
elderly, elderly, ill ill population<br />
population<br />
Critical Critical Critical<br />
3<br />
Limited Limited<br />
3<br />
Negligible Negligible<br />
80
182<br />
RISK RISK ASSESSMENT ASSESSMENT WORKSHEET<br />
WORKSHEET- WORKSHEET JEFFER JEFFERSON JEFFER<br />
SON COUNTY<br />
Tornado<br />
Tornado<br />
<strong>Jefferson</strong> <strong>County</strong> – Section 2<br />
Sector Sector<br />
Essential Facilities at Risk<br />
Buildings in path of storm not constructed to<br />
building code.<br />
Population at Risk<br />
Populations that do not have safe rooms to<br />
seek refuge<br />
Infrastructure at Risk<br />
Infrastructure in path of storm<br />
Property at Risk<br />
Expected Extent of<br />
Percent Percent of of Sector Sector<br />
Sector<br />
Damage<br />
Damage<br />
Property<br />
Property<br />
Catastrophic<br />
Catastrophic-in Catastrophic<br />
Catastrophic path of<br />
storm; dependent upon<br />
magnitude of storm,<br />
damage could be<br />
catastrophic<br />
Critical Critical-in Critical Critical path of storm;<br />
dependent upon<br />
magnitude of storm,<br />
damage could be critical<br />
Limited Limited-in Limited path of storm;<br />
dependent upon<br />
magnitude of storm,<br />
damage could be limited<br />
Negligible Negligible-in Negligible path of<br />
storm; dependent upon<br />
magnitude of storm,<br />
damage could be<br />
negligible<br />
1%<br />
4%<br />
5%<br />
90%<br />
RISK RISK ASSESSMENT ASSESSMENT WORKSHEET<br />
WORKSHEET- WORKSHEET JEFFERSON COUNTY COUNTY<br />
Wildland Wildland Fi Fire Fi Fire<br />
re<br />
Sector Sector<br />
Essential Facilities at Risk<br />
Buildings in path of fire may be burned<br />
Population at Risk<br />
Residents living and working near forested<br />
areas<br />
Infrastructure at at Risk Risk<br />
May burn utility lines<br />
Property at Risk Risk
A Regional Overview All-Hazard Mitigation Plan 183<br />
RISK RISK ASSESSMENT ASSESSMENT WORKSHEET<br />
WORKSHEET- WORKSHEET JEFFERSON COUNTY<br />
Wildland Wildland Fi Fire Fi re<br />
Expected Extent of<br />
Damage Damage<br />
Damage<br />
Catastrophic<br />
Catastrophic<br />
Critical<br />
Critical<br />
Perce Percent Perce nt of Sector<br />
Property Property<br />
Property<br />
Limited Limited<br />
1<br />
Negligible Negligible-wildfires<br />
Negligible wildfires<br />
possible, possible, limited limited to<br />
to<br />
negligible negligible magnitude<br />
magnitude<br />
99<br />
RISK RISK ASSESSMENT ASSESSMENT WORKSHEET<br />
WORKSHEET- WORKSHEET JEFFERSON COUNTY<br />
Winter Winter Weather Weather<br />
Weather<br />
Sector Sector<br />
Essential Facilities at Risk<br />
Some buildings in path of storm may have<br />
power outages.<br />
Population at Risk<br />
Dependent upon where storm hits, entire<br />
population, especially those who work<br />
outdoors, drive for a living, homeless people.<br />
Infrastructure at at Risk<br />
Utility poles downed by ice storms; roads,<br />
bridges impassible<br />
Property at Risk Risk<br />
Expected Extent of<br />
Percent Percent of of Sector Sector<br />
Sector<br />
Damage<br />
Damage<br />
Property<br />
Property<br />
Catastrophic Catastrophic<br />
1%<br />
Critical Critical<br />
1%<br />
Limited Limited Limited<br />
90%<br />
Negligible Negligible<br />
8%
184<br />
RISK RISK INDEX INDEX INDEX WORKSHEET<br />
WORKSHEET- WORKSHEET <strong>Jefferson</strong> <strong>County</strong> <strong>County</strong><br />
HAZARD FREQUENCY MAGNITUDE WARNING<br />
TIME<br />
Dam<br />
Failure<br />
Highly likely4<br />
Likely3<br />
Likely3<br />
Possible2<br />
Unlikely1<br />
Drought Highly likely4<br />
Likely3<br />
Possible2<br />
Possible2<br />
Unlikely1<br />
Earthquake Highly likely4<br />
Likely3<br />
Possible2 Possible2<br />
Possible2<br />
Unlikely1<br />
Flood Highly likely4<br />
Likely3<br />
Likely3<br />
Possible2<br />
Unlikely1<br />
Heat Wave Highly likely4<br />
Likely3<br />
Likely3<br />
Possible2<br />
Unlikely1<br />
Tornado Highly likely4<br />
Likely3<br />
Likely3<br />
Possible2<br />
Unlikely1<br />
Wildland<br />
Fire<br />
Winter<br />
Weather<br />
Highly likely4<br />
Likely3<br />
Possible2 Possible2<br />
Possible2<br />
Unlikely1<br />
Highly likely4<br />
Likely3<br />
Likely3<br />
Possible2<br />
Unlikely1<br />
Catastrophic4<br />
Critical3<br />
Limited2<br />
Limited2<br />
Negligible1<br />
Catastrophic<br />
Critical3 Critical3<br />
Critical3<br />
Limited2<br />
Negligible1<br />
Catastrophic4<br />
Catastrophic4<br />
Catastrophic4<br />
Critical3<br />
Limited2<br />
Negligible1<br />
Catastrophic4<br />
Critical3<br />
Limited2<br />
Limited2<br />
Negligible1<br />
Catastrophic4<br />
Critical3<br />
Limited2<br />
Negligible1<br />
Negligible1<br />
Catastrophic4<br />
Critical3<br />
Limited2<br />
Limited2<br />
Negligible1<br />
Catastrophic4<br />
Critical3<br />
Limited2 Limited2<br />
Limited2<br />
Negligible1<br />
Catastrophic4<br />
Critical3<br />
Limited2<br />
Limited2<br />
Negligible1<br />
Ranking is top bold number<br />
Score is bottom number<br />
Minimal4<br />
Minimal4<br />
6-12 hours<br />
12-24<br />
hours<br />
24+ hours1<br />
Minimal4<br />
6-12 hours<br />
12-24<br />
hours<br />
24+ 24+ hours1<br />
hours1<br />
Minimal4<br />
Minimal4<br />
6-12 hours<br />
12-24<br />
hours<br />
24+ hours1<br />
Minimal4<br />
Minimal4<br />
6-12 hours<br />
12-24<br />
hours<br />
24+ hours1<br />
Minimal4<br />
6-12 hours<br />
12 12-24 12<br />
24<br />
hours<br />
hours<br />
24+ hours1<br />
Minimal4<br />
Minimal4<br />
6-12 hours<br />
12-24<br />
hours<br />
24+ hours1<br />
Minimal4<br />
6-12 hours<br />
12 12-24 12<br />
24<br />
hours<br />
hours<br />
24+ hours1<br />
Minimal4<br />
6-12 hours<br />
12 12-24 12<br />
24<br />
hours<br />
hours<br />
24+ hours1<br />
<strong>Jefferson</strong> <strong>County</strong> – Section 2<br />
SEVERITY SPECIAL<br />
CHARACTERISTICS<br />
& PLANNING<br />
CONSIDERATIONS<br />
Catastrophic4<br />
Critical3<br />
Limited2<br />
Limited2<br />
Negligible1<br />
Catastrophic4<br />
Critical3<br />
Limited2<br />
Limited2<br />
Negligible1<br />
Catastrophic4<br />
Catastrophic4<br />
Critical3<br />
Limited2<br />
Negligible1<br />
Catastrophic4<br />
Critical3<br />
Limited2<br />
Limited2<br />
Negligible1<br />
Catastrophic4<br />
Critical3<br />
Limited2<br />
Negligible1<br />
Negligible1<br />
Catastrophic4<br />
Critical3<br />
Limited2<br />
Limited2<br />
Negligible1<br />
Catastrophic4<br />
Critical3<br />
Limited2<br />
Limited2<br />
Negligible1<br />
Catastrophic4<br />
Critical3<br />
Limited2<br />
Limited2<br />
Negligible1<br />
RISK<br />
PRIORITY<br />
2<br />
11<br />
4<br />
8<br />
1<br />
14<br />
2<br />
11<br />
5<br />
7<br />
2<br />
11<br />
4<br />
8<br />
3<br />
9
A Regional Overview All-Hazard Mitigation Plan 185<br />
TORNADO: TORNADO: TORNADO: JEFFERSON JEFFERSON JEFFERSON COUNTY COUNTY VULNERABILITY VULNERABILITY VULNERABILITY ASSESSMENT<br />
ASSESSMENT<br />
ASSESSMENT<br />
(The (The estimates estimates below below are are based based on on an an F4 F4 tornado tornado causing causing damage damage in in 5% 5% of of the the county.)<br />
county.)<br />
DEVELOP DEVELOPED DEVELOP DEVELOP ED LAND UNDEVELOPED UNDEVELOPED UNDEVELOPED LAND<br />
LAND<br />
# # # of<br />
of<br />
# # of<br />
of # # of<br />
of<br />
# # # of of People<br />
People Buildings Buildings Approx. Approx. Approx. Value<br />
Value People<br />
People Buildings Buildings Approx. Approx. Value<br />
Value<br />
Residential 5,725 2,260 $160,295,000 4,200 1,725 $125,000,000<br />
Commercial / Industrial 2,040 140 $44,470,000 230 15 $5,065,000<br />
Key Non-profit public service facilities 15 1 $250,000 N.A. N.A. N.A.<br />
Public buildings and critical facilities 30 2 $500,000 N.A. N.A. N.A.<br />
Sewage treatment plant N.A. 1 $100,000 N.A. N.A. N.A.<br />
Water treatment plant N.A. N.A. N.A. N.A. N.A. N.A.<br />
Roads N.A. N.A. $2,500,000 N.A. N.A. $192,500<br />
Police 4 1 $180,000 N.A. N.A. N.A.<br />
Fire 3 1 $150,000 N.A. N.A. N.A.<br />
Schools/colleges 2,000 5 $22,925,500 N.A. N.A. N.A.<br />
Utilities/communications 25 1 $1,000,000 N.A. N.A. $305,000.<br />
Hospital/medical/dental 30 1 $1,180,000 N.A. N.A. N.A.<br />
Nursing homes 160 2 $2,298,750 N.A. N.A. N.A.<br />
Hazardous facilities N.A. N.A. N.A. N.A. N.A. N.A.<br />
Other county, state, and federal government 450 30 $9,000,000 N.A. N.A. N.A.<br />
TOTAL 10,482 2445 $242,849,250 4430 1740 $130,562,500<br />
Note: Emergency shelters (see key non-profits)<br />
The entire county is vulnerable to tornado and severe thunderstorm hazards. Data limitations: Because of the timeframe and time limitations of<br />
this project, GIS analysis in <strong>Jefferson</strong> <strong>County</strong> was conducted using an interim product/"work in progress" property map and database; due to<br />
georeferencing shortcomings and attribute data limitations, results were incomplete. MDNR is updating Hazardous Waste Facilities locations and data.
186<br />
FLOOD: FLOOD: FLOOD: JEFFERSON JEFFERSON JEFFERSON COUNTY COUNTY COUNTY VULNERA VULNERABILITY VULNERA VULNERABILITY<br />
BILITY ASSESSMENT<br />
ASSESSMENT<br />
(The (The (The estimates estimates estimates below below are are based based on on a a 100 100-year 100 100 year year flood flood causing damage in 11% 11% of the the county) county)<br />
<strong>Jefferson</strong> <strong>County</strong> – Section 2<br />
DEVELOPED DEVELOPED LAND LAND<br />
UNDEVELOPED UNDEVELOPED UNDEVELOPED LAND<br />
LAND<br />
# # # of<br />
of<br />
# # of<br />
of<br />
# # # of of People<br />
People Buildings Buildings Approx. Approx. Approx. Value Value # # of of People<br />
People Buildings Buildings Approx. Approx. Value<br />
Value<br />
Residential 12,600 5,000 $352,650,000 10,130 3,805 $270,000,000<br />
Commercial / Industrial 4500 300 $98,500,000 510 35 $12,000,000<br />
Key Non-profit public service facilities 35 2 $550,000 N.A. N. A. N.A.<br />
Public buildings and critical facilities 70 4 $110,000 N.A. N. A. N.A.<br />
Sewage treatment plant 150 1 $220,000 N.A. N. A. N.A.<br />
Water treatment plant 150 1 $220,000 N.A. N. A. N.A.<br />
Roads N.A. N.A. $5,475,000 N.A. N. A. $415,000<br />
Police 10 1 $400,000 N.A. N. A. N.A.<br />
Fire 7 1 $330,000 N.A. N. A. N.A.<br />
Schools/colleges 4,500 15 $50,450,000 N.A. N. A. N.A.<br />
Utilities/communications 55 2 $2,200,000 N.A. N. A. $670,000<br />
Hospital/medical/dental 70 1 $2,600,000 N.A. N. A. N.A.<br />
Nursing/disability homes 360 4 $5,100,000 N.A. N. A. N.A.<br />
Hazardous facilities N.A. N.A. N.A. N.A. N. A. N.A.<br />
Other county, state, and federal government 1,000 65 $19,800,000 N.A. N. A. N.A.<br />
TOTAL 36,437 5,397 $538,605,000 10,640 3840 $283,085,000<br />
Note: Emergency shelters (see key non-profits)<br />
Specific riverine and/or flash flood hazard areas include the Meramec, Mississippi Rivers. Data llimitations: Because of the timeframe and time<br />
limitations of this project, GIS analysis in <strong>Jefferson</strong> <strong>County</strong> was conducted using an interim product/"work in progress" property map and database; due<br />
to georeferencing shortcomings and attribute data limitations, results were incomplete. MDNR is updating Hazardous Waste Facilities locations and<br />
data.
A Regional Overview All-Hazard Mitigation Plan 187<br />
SEVERE SEVERE WINTER WINTER STORM: STORM: JEFFERSON JEFFERSON COUNTY COUNTY VULNERABILITY VULNERABILITY ASSESSMENT<br />
ASSESSMENT<br />
(Using (Using regional regional regional severe severe winter winter statistics, statistics, the the county county could could could repr represent repr represent<br />
esent 1% of of those damages.)<br />
DEVELOPED DEVELOPED LAND LAND<br />
UNDEVELOPED UNDEVELOPED UNDEVELOPED LAND<br />
LAND<br />
# # # of of<br />
of<br />
# # # of of<br />
of<br />
SEVERE SEVERE SEVERE WINTER WINTER STORM STORM STORM<br />
# # of of of People<br />
People Buildings Buildings Approx. Approx. Value Value # # of of of People<br />
People Buildings Buildings Approx. Approx. Approx. Value<br />
Value<br />
Residential 1145 450 $32,060,700 3 1 $71,000<br />
Commercial / Industrial 410 30 $8,950,200 0 0 0<br />
Key Non-profit public service facilities 3 1 $50,000 0 0 0<br />
Public buildings and critical facilities 6 1 $100,000 0 0 0<br />
Sewage treatment plant 5 1 $20,000 0 0 0<br />
Water treatment plant 0 0 0 0 0 0<br />
Roads 0 0 $498,800 0 0 0<br />
Police 1 1 $36,000 0 0 0<br />
Fire 1 1 $30,000 0 0 0<br />
Schools/colleges 400 1 $4,585,100 0 0 0<br />
Utilities/communications 5 1 $200,000 0 0 $865,000<br />
Hospital/medical/dental 6 1 $235,500 0 0 0<br />
Nursing/disability homes 30 1 $459,750 0 0 0<br />
Hazardous facilities 0 0 0 0 0 0<br />
Other county, state, and federal government 90 6 $1,800,000 0 0 0<br />
TOTAL 2102 495 $49,026,050 3 1 $936,000<br />
Note: Emergency shelters (see key non-profits)<br />
The entire county is vulnerable to severe winter storm hazards. Data llimitations: Because of the timeframe and time limitations of this project, GIS<br />
analysis in <strong>Jefferson</strong> <strong>County</strong> was conducted using an interim product/"work in progress" property map and database; due to georeferencing<br />
shortcomings and attribute data limitations, results were incomplete. MDNR is updating Hazardous Waste Facilities locations and data.
188<br />
<strong>Jefferson</strong> <strong>County</strong> – Section 2<br />
DROUGHT: DROUGHT: JEFFERSON JEFFERSON COUNTY COUNTY VULNERABILITY VULNERABILITY ASSESSMENT<br />
ASSESSMENT<br />
(Using (Using regional regional drought drought drought statistics, statistics, the the the county county county could could represent represent represent 1% 1% of of those those damages.)<br />
damages.)<br />
DEVELOPED DEVELOPED LAND LAND<br />
UNDEVELOPED UNDEVELOPED LAND<br />
LAND<br />
# # # of<br />
of<br />
# # # of<br />
of Approx. Approx.<br />
Approx.<br />
# # # of of People<br />
People Building Buildings Building Approx. Approx. Approx. Value Value # # # of of People<br />
People Buildings<br />
Buildings Value<br />
Value<br />
Residential and/or agricultural 1145 450 $32,060,700 195 75 $38,000<br />
Commercial / Industrial 410 30 $8,950,200 0 0 $40,500<br />
Key Non-profit public service facilities 3 1 $50,000 N.A. N. A. N.A.<br />
Public buildings and critical facilities 6 1 $100,000 N.A. N. A. N.A.<br />
Sewage treatment plant 5 1 $20,000 N.A. N. A. N.A.<br />
Water treatment plant 0 0 0 N.A. N. A. N.A.<br />
Roads 0 0 $498,800 N.A. N. A. N.A.<br />
Police 1 1 $36,000 N.A. N. A. N.A.<br />
Fire 1 1 $30,000 N.A. N. A. N.A.<br />
Schools/colleges 400 1 $4,585,100 N.A. N. A. N.A.<br />
Utilities/communications 5 1 $200,000 N.A. N. A. N.A.<br />
Hospital/medical/dental 6 1 $235,500 N.A. N. A. N.A.<br />
Nursing/disability homes 30 1 $459,750 N.A. N. A. N.A.<br />
Hazardous facilities 0 0 0 N.A. N. A. N.A.<br />
Other county, state, and federal government 90 6 $1,800,000 N.A. N. A. N.A.<br />
TOTAL 2102 495 $49,026,050 195 75 $75,500<br />
Note: Emergency shelters (see key non-profits)<br />
The entire county is vulnerable to the effects of drought. Data llimitations: Because of the timeframe and time limitations of this project, GIS analysis in<br />
<strong>Jefferson</strong> <strong>County</strong> was conducted using an interim product/"work in progress" property map and database; due to georeferencing shortcomings and<br />
attribute data limitations, results were incomplete. MDNR is updating Hazardous Waste Facilities locations and data.
A Regional Overview All-Hazard Mitigation Plan 189<br />
HEAT HEAT WAVE: WAVE: JEFFERSON JEFFERSON COUNTY COUNTY VULNERABILITY VULNERABILITY ASSESSMENT<br />
ASSESSMENT<br />
(Using (Using regional regional regional heat heat wave wave statistics, statistics, the the county county could could represent represent 1% 1% of of those those damages.)<br />
damages.)<br />
DEVELOPED DEVELOPED LAN LAND LAN<br />
UNDEVELOPED UNDEVELOPED UNDEVELOPED LAND<br />
LAND<br />
# # # of of<br />
of<br />
# # # of of<br />
of Approx.<br />
Approx.<br />
# # of of of People<br />
People Buildings Buildings Approx. Approx. Value Value Value # # of of of People<br />
People Buildings<br />
Buildings Value<br />
Value<br />
Residential 1145 450 $32,060,700 195 75 $38,000<br />
Commercial / Industrial 410 30 $8,950,200 0 0 $40,500<br />
Key Non-profit public service facilities 3 1 $50,000 N.A. N.A. N.A.<br />
Public buildings and critical facilities 6 1 $100,000 N.A. N.A. N.A.<br />
Sewage treatment plant 5 1 $20,000 N.A. N.A. N.A.<br />
Water treatment plant 0 0 0 N.A. N.A. N.A.<br />
Roads 0 0 $498,800 N.A. N.A. N.A.<br />
Police 1 1 $36,000 N.A. N.A. N.A.<br />
Fire 1 1 $30,000 N.A. N.A. N.A.<br />
Schools/colleges 400 1 $4,585,100 N.A. N.A. N.A.<br />
Utilities/communications 5 1 $200,000 N.A. N.A. N.A.<br />
Hospital/medical/dental 6 1 $235,500 N.A. N.A. N.A.<br />
Nursing/disability homes 30 1 $459,750 N.A. N.A. N.A.<br />
Hazardous facilities N.A. N.A. N.A. N.A. N.A. N.A.<br />
Other county, state, and federal government 90 6 $1,800,000 N.A. N.A. N.A.<br />
TOTAL 2102 495 $49,026,050 195 75 $78,500<br />
Note: Emergency shelters (see key non-profits and schools)<br />
The entire county is vulnerable to the effects of heat wave. Data llimitations: Because of the timeframe and time limitations of this project, GIS analysis<br />
in <strong>Jefferson</strong> <strong>County</strong> was conducted using an interim product/"work in progress" property map and database; due to georeferencing shortcomings and<br />
attribute data limitations, results were incomplete. MDNR is updating Hazardous Waste Facilities locations and data.
190<br />
EARTHQUAKE: EARTHQUAKE: JEFFERSON JEFFERSON JEFFERSON COUNTY COUNTY VULNERABILITY VULNERABILITY VULNERABILITY ASSESSMENT<br />
ASSESSMENT<br />
(Based (Based (Based on on a a Level Level VII VII earthquake earthquake earthquake causing causing damage damage in in 80% 80% of of the the cou county) cou nty)<br />
<strong>Jefferson</strong> <strong>County</strong> – Section 2<br />
DEVELOPED DEVELOPED LAND LAND<br />
UNDEVELOPED UNDEVELOPED LAND<br />
LAND<br />
# # of<br />
of<br />
# # of<br />
of Approx.<br />
Approx.<br />
# # of of of People<br />
People Buildings Buildings Buildings Approx. Approx. Approx. Value Value # # of of of People<br />
People Buildings<br />
Buildings Value<br />
Value<br />
Residential 70,000 28,000 $2,000,000,000 51,700 20,800 $1,470,000,000<br />
Commercial / Industrial 24,480 1,600 $536,775,000 2,750 180 $60,800,000<br />
Key Non-profit public service facilities 180 15 $3,000,000 N.A. N. A. N.A.<br />
Public buildings and critical facilities 360 25 $6,000,000 N.A. N. A. N.A.<br />
Sewage treatment plant 1090 2 $1,200,000 N.A. N. A. N.A.<br />
Water treatment plant N.A. N.A. N.A. N.A. N. A. N.A.<br />
Roads - - $30,000,000 N.A. N. A. $2,280,000<br />
Police 50 2 $2,160,000 N.A. N. A. N.A.<br />
Fire 40 2 $1,800,000 N.A. N. A. N.A.<br />
Schools/colleges 25,000 60 $275,110,000 N.A. N. A. N.A.<br />
Utilities/communications 300 15 $12,000,000 N.A. N. A. $3,650,000<br />
Hospital/medical/dental 375 1 $14,135,000 N.A. N. A. N.A.<br />
Nursing/disability homes 2000 25 $30,000,000 N.A. N. A. N.A.<br />
Hazardous facilities 0 0 0 N.A. N. A. N.A.<br />
Other county, state, and federal government 5,400 360 $108,000,000 N.A. N. A. N.A.<br />
TOTAL 129,275 30,107 $3,050,180,000 54,450 20,980 $1,536,730,000<br />
Note: Emergency shelters (see key non-profits)<br />
The entire county is vulnerable to critical damage severity due to earthquake hazards. The eastern portion of the county is especially vulnerable to the<br />
threat of liquefaction due to the alluvial soils in the Mississippi River. Data llimitations: Because of the timeframe and time limitations of this project, GIS<br />
analysis in <strong>Jefferson</strong> <strong>County</strong> was conducted using an interim product/"work in progress" property map and database; due to georeferencing<br />
shortcomings and attribute data limitations, results were incomplete. MDNR is updating Hazardous Waste Facilities locations and data.
A Regional Overview All-Hazard Mitigation Plan 191<br />
DAM FAILURE: JEFFERSON JEFFERSON JEFFERSON COUNTY VULNERABILITY VULNERABILITY VULNERABILITY ASSESSMENT<br />
(B (Based (B ased on a single dam failure causing damage in 1/2% of of the the county)<br />
DEVELOPED DEVELOPED LAND LAND<br />
UNDEVELOPED UNDEVELOPED LAND<br />
LAND<br />
# # of of<br />
of<br />
# # of of<br />
of Approx.<br />
Approx.<br />
# # # of of People<br />
People Buildings Buildings Approx. Approx. Approx. Value Value Value # # # of of People<br />
People Buildings<br />
Buildings Value<br />
Value<br />
Residential 570 225 $16,025,350 195 75 $38,000<br />
Commercial / Industrial 200 15 $4,475,100 0 0 $40,500<br />
Key Non-profit public service facilities 1 1 $25,000 N.A. N.A. N.A.<br />
Public buildings and critical facilities 3 1 $50,000 N.A. N.A. N.A.<br />
Sewage treatment plant 2 1 $10,000 N.A. N.A. N.A.<br />
Water treatment plant 0 0 0 N.A. N.A. N.A.<br />
Roads 0 0 $250,000 N.A. N.A. N.A.<br />
Police 1 1 $18,000 N.A. N.A. N.A.<br />
Fire 1 1 $15,000 N.A. N.A. N.A.<br />
Schools/colleges 200 1 $2,292,550 N.A. N.A. N.A.<br />
Utilities/communications 2 1 $100,000 N.A. N.A. N.A.<br />
Hospital/medical/dental 3 1 $117,750 N.A. N.A. N.A.<br />
Nursing/disability homes 15 1 $229,875 N.A. N.A. N.A.<br />
Hazardous facilities 0 0 0 N.A. N.A. N.A.<br />
Other county, state, and federal government 45 3 $900,000 N.A. N.A. N.A.<br />
TOTAL 1043 252 $24,508,625 195 75 $78,500<br />
Note: Emergency shelters (see key non-profits)<br />
Data llimitations: Because of the timeframe and time limitations of this project, GIS analysis in <strong>Jefferson</strong> <strong>County</strong> was conducted using an interim<br />
product/"work in progress" property map and database; due to georeferencing shortcomings and attribute data limitations, results were incomplete.<br />
MDNR is updating Hazardous Waste Facilities locations and data.
192<br />
WILDFIRE: WILDFIRE: JEFFERSON JEFFERSON JEFFERSON COUNTY COUNTY VULNERABILITY VULNERABILITY ASSESSMENT<br />
ASSESSMENT<br />
(Based (Based (Based on on a a large large wildfire wildfire causing causing damage damage in in 1% 1% 1% of of the the the county.)<br />
county.)<br />
<strong>Jefferson</strong> <strong>County</strong> – Section 2<br />
DEVEL DEVELOPED DEVEL DEVELOPED<br />
OPED LAND UNDEVELOPED UNDEVELOPED LAND<br />
LAND<br />
# # of of<br />
of<br />
# # of of<br />
of Approx.<br />
Approx.<br />
WILDFIRE WILDFIRE WILDFIRE<br />
# # # of of People<br />
People Buildings Buildings Approx. Approx. Approx. Value Value Value # # # of of People<br />
People Buildings<br />
Buildings Value<br />
Value<br />
Residential 570 225 $16,025,350 195 75 $38,000<br />
Commercial / Industrial 200 15 $4,475,100 0 0 $40,500<br />
Key Non-profit public service facilities 1 1 $25,000 N.A. N.A. N.A.<br />
Public buildings and critical facilities 3 1 $50,000 N.A. N.A. N.A.<br />
Sewage treatment plant 2 1 $10,000 N.A. N.A. N.A.<br />
Water treatment plant 0 0 0 N.A. N.A. N.A.<br />
Roads 0 0 $250,000 N.A. N.A. N.A.<br />
Police 1 1 $18,000 N.A. N.A. N.A.<br />
Fire 1 1 $15,000 N.A. N.A. N.A.<br />
Schools/colleges 200 1 $2,292,550 N.A. N.A. N.A.<br />
Utilities/communications 2 1 $100,000 N.A. N.A. N.A.<br />
Hospital/medical/dental 3 1 $117,750 N.A. N.A. N.A.<br />
Nursing/disability homes 15 1 $229,875 N.A. N.A. N.A.<br />
Hazardous facilities 0 0 0 N.A. N.A. N.A.<br />
Other county, state, and federal government 45 3 $900,000 N.A. N.A. N.A.<br />
TOTAL 1043 252 $24,508,625 195 75 $78,500<br />
Note: Emergency shelters (see key non-profits)<br />
There is a very low threat of wildfire across the county. Data llimitations: Because of the timeframe and time limitations of this project, GIS analysis in<br />
<strong>Jefferson</strong> <strong>County</strong> was conducted using an interim product/"work in progress" property map and database; due to georeferencing shortcomings and<br />
attribute data limitations, results were incomplete. MDNR is updating Hazardous Waste Facilities locations and data.
A Regional Overview All-Hazard Mitigation Plan 193<br />
TOTAL TOTAL JEFFERSON JEFFERSON COUNTY COUNTY VULNERABILITY VULNERABILITY SUMMARY<br />
SUMMARY<br />
DEVELOPED DEVELOPED LAND LAND<br />
UNDEVELOPED UNDEVELOPED UNDEVELOPED LAND<br />
LAND<br />
Total Total #<br />
# Total Total #<br />
#<br />
# # of<br />
of Total Total Total #<br />
#<br />
Combined Combined Totals Totals Totals Represent Represent All All All Natural Natural<br />
of of<br />
of of<br />
Total Total Approx. Approx.<br />
Approx. Critical<br />
Critical of<br />
Total Total Total # # # of<br />
of Total Total Total Approx.<br />
Approx.<br />
Hazards Hazards Occurring Occurring in in <strong>Jefferson</strong> <strong>Jefferson</strong> <strong>County</strong><br />
<strong>County</strong> People<br />
People Buildings<br />
Buildings Value<br />
Value Facilities<br />
Facilities People<br />
People Buildings<br />
Buildings Value<br />
Value<br />
# # of<br />
of<br />
Critical<br />
Critical<br />
Facilities Facilities<br />
Facilities<br />
Residential 92,900 37,060 $2,641,177,800 185 66,813 26,561 $1,865,223,000 132<br />
Commercial / Industrial 32,650 2160 $715,545,800 10 920 230 $78,027,000 1<br />
Key Non-profit public service facilities 241 23 $4,000,000 1 N.A. N.A. N.A. N.A.<br />
Public buildings and critical facilities 483 36 $701,000 1 N.A. N.A. N.A. N.A.<br />
Sewage treatment plant 1259 9 $1,600,000 1 N.A. N.A. N.A. N.A.<br />
Water treatment plant 1240 3 $1,420,000 1 N.A. N.A. N.A. N.A.<br />
Roads - - $39,971,400 - N.A. N.A. $2,887,500 N.A.<br />
Police 69 9 $2,884,000 1 N.A. N.A. N.A. N.A.<br />
Fire 55 9 $2,400,000 1 N.A. N.A. N.A. N.A.<br />
Schools/colleges 33,700 85 $366,825,900 1 N.A. N.A. N.A. N.A.<br />
Utilities/communications 399 23 $16,000,000 1 N.A. N.A. $5,490,000 1<br />
Hospital/medical/dental 499 8 $18,857,000 1 N.A. N.A. N.A. N.A.<br />
Nursing/disability homes 2640 36 $39,237,750 3 N.A. N.A. N.A. N.A.<br />
Hazardous facilities N.A. N.A. N.A. N.A. N.A. N.A. N.A. N.A.<br />
Other county, state, and federal government 7210 476 $124,200,000 2 N.A. N.A. N.A. N.A.<br />
TOTAL 173,345 39,940 $3,938,846,394 210 67,733 26,791 $1,951,627,500 134<br />
Note: Emergency shelters (see key non-profits)<br />
Data llimitations: Because of the timeframe and time limitations of this project, GIS analysis in <strong>Jefferson</strong> <strong>County</strong> was conducted using an interim<br />
product/"work in progress" property map and database; due to georeferencing shortcomings and attribute data limitations, results were incomplete.<br />
MDNR is updating Hazardous Waste Facilities locations and data.
A Regional Overview All-Hazard Mitigation Plan<br />
SECTION SECTION 3<br />
3<br />
<strong>County</strong> <strong>County</strong> Capability Capability Assessment<br />
Assessment<br />
Mitigation Mitigation Management Management Policies<br />
Policies<br />
The <strong>Jefferson</strong> <strong>County</strong> Emergency Management Agency is charged with preparing for<br />
disasters. That duty includes advising the <strong>County</strong> Commission on mitigation measures and<br />
implementing those measures deemed appropriate by the Commission. In general, the<br />
<strong>County</strong>’s policies encourage cooperation and coordination within the <strong>Jefferson</strong> <strong>County</strong><br />
agencies; as well as cooperation, including mutual aid compacts, between neighboring<br />
counties and the municipalities within <strong>Jefferson</strong> <strong>County</strong>. The Emergency Operations Plan<br />
(EOP) provides for an integrated countywide emergency preparedness and response plan,<br />
utilizing public, nonprofit, and private resources.<br />
Existing Existing Plans<br />
Plans<br />
The <strong>County</strong> has recently completed the <strong>Jefferson</strong> <strong>County</strong> Official Master Plan with the<br />
anticipation that it will be formally adopted in the near future. The Plan was developed to<br />
provide the framework for planned supportable growth, including promoting best practice<br />
policies relating to stormwater and floodplain management. The Plan identifies a Preferred<br />
Growth Alternative, with the intent to “achieve a balance of growth with preservation of<br />
existing natural features and protection of the rural character of the county.” In general,<br />
growth will be targeted around currently developed areas, utilizing existing transportation<br />
corridors and extending utility and transportation infrastructure in a logical and progressive<br />
manner, thereby ensuring capacity to service new development.<br />
The <strong>County</strong>’s Emergency Operations Plan (EOP) is approved by the <strong>County</strong> Commission.<br />
The Plan identifies facilities and resources that require special security during a disaster;<br />
promotes the development and maintenance of mutual aid agreements with nearby<br />
agencies; requires participation in drills and exercises; identifies human and capital<br />
resources available throughout the county for disaster response; and includes an<br />
evacuation plan. The EOP includes hazard mitigation measures and a damage assessment<br />
plan.<br />
Mitigation Mitigation Programs<br />
Programs<br />
The main mitigation programs are the <strong>County</strong>’s floodplain management regulations and<br />
participation in and administration of the National Flood Insurance Program (NFIP). The<br />
county coordinates with Mississippi River levee districts through the U.S. Corps of<br />
Engineers. Additional programs include the following:<br />
• The <strong>County</strong>’s floodplain regulations are aimed at restricting any new development in<br />
the floodplain. The current ordinance requires two feet of additional freeboard for<br />
1
2<br />
<strong>Jefferson</strong> <strong>County</strong> – Section 3<br />
new structures and requires an increase, if necessary, to that elevation when<br />
structures are significantly reconstructed within the floodplain. Minimum elevation<br />
is one foot above for structures in the identified regional floodplains.<br />
• The county has participated in floodplain property acquisition, funded through<br />
FEMA’s Hazard Mitigation Program.<br />
• Stormwater management and sedimentation and erosion control standards that<br />
comply with Phase II Federal Stormwater Regulations was implemented in 2004.<br />
• Development is prohibited in identified floodways and wetlands.<br />
• Development can occur on slopes steeper than 3 feet to one foot only after<br />
geotechnical analysis and receipt of an engineer’s recommendation.<br />
• The county is able to receive NWS warnings; equipment is radio-activated. During<br />
waking hours, using all available communications, less than 50 percent of the<br />
county’s population could be alerted within 30 minutes; responders and key<br />
executive officials could be alerted within 5 minutes.<br />
• The Emergency Management Agency’s director and key personnel have completed<br />
substantial training in all facets of emergency management. Emergency response<br />
personnel, EOC operations staff, and volunteer agencies have received training and<br />
education within the last five years.<br />
<strong>Jefferson</strong> <strong>County</strong> is located in a Modified Mercalli Zone VII area. Missouri statutes require<br />
school districts in a Modified Mercalli Zone VII or above at a magnitude 7.6 earthquake to<br />
provide for public view each year, an earthquake preparedness and safety information,<br />
such as earthquake procedures and a disaster plan; and conduct earthquake drills twice<br />
each year. Missouri statutes RSMo 260.451, 160.453, 160.455, and 160.457 provide that<br />
“the governing body of each school district shall request assistance from the State<br />
Emergency Management Agency and any local emergency management agency located<br />
within its district boundaries to develop and establish the earthquake emergency procedure<br />
system.”<br />
The questionnaire asked responders to summarize their regulations effectiveness in<br />
reducing potential losses from hazards and the effectiveness of their measures to increase<br />
public awareness of measures to reduce potential losses from hazards. The questions were<br />
answered on a scale of “O” to “4”, with “0” being not effective and “4” being very<br />
effective. In answer to the question: How effective would you rate the regulations<br />
employed by your local government to reduce potential losses from hazards, one<br />
municipality answered “1”, three answered “2”, and one answered “3”. In response to the<br />
question: How effective would you rate the measures employed by your local government<br />
to increase public awareness of measures that can be used to reduce potential losses to<br />
existing development in areas subject to hazards, two municipalities answered “2”, and<br />
three answered “3”.
A Regional Overview All-Hazard Mitigation Plan<br />
<strong>County</strong> <strong>County</strong> Capabilities Capabilities (Organization, (Organization, Staffing, Staffing, Training)<br />
Training)<br />
The capabilities of emergency management, fire protection, law enforcement, and<br />
emergency medical services are detailed at the end of Section I.<br />
The EOC is located in the <strong>Jefferson</strong> <strong>County</strong> Courthouse in Hillsboro. The facility is well<br />
equipped for sustained operations over an extended period of time. A primary alternate<br />
EOC is located at the 911 Center in Hillsboro. Other alternate sights are identified. The<br />
EOC has survivable communications for operating forces, the Emergency Alert System,<br />
commercial and public broadcast stations, the State Emergency Management Agency,<br />
cities within the county, and neighboring jurisdictions. Communication and warning<br />
systems are tested on a regular basis. Five municipalities responding to the questionnaire<br />
have sirens, tested on a monthly basis. A substantial amount of the county’s<br />
unincorporated area is not within hearing range of sirens.<br />
<strong>County</strong>wide, substantial emergency response equipment is available to respond to events.<br />
Within the county, there are a total of nineteen fire protection districts or fire departments<br />
and seven ambulance districts. In addition to the <strong>Jefferson</strong> <strong>County</strong> Sheriff’s Department,<br />
there are ten municipal police departments. Substantial vehicle and heavy equipment is<br />
available through municipal and county public works departments. American Red Cross<br />
has a service center in the county. One hospital is located in the county, and most St.<br />
Louis metropolitan area medical facilities are located within a one-hour drive from any<br />
location in <strong>Jefferson</strong> <strong>County</strong>.<br />
The county has conducted at least one full-scale EOP exercise within the last four years<br />
including testing and evaluating alert notification, coordination and control, and<br />
communications.<br />
Responsibilities Responsibilities and and Authorities Authorities<br />
Authorities<br />
<strong>Jefferson</strong> <strong>County</strong> government and their municipal governments responding to the<br />
questionnaire indicated the following:<br />
• <strong>County</strong> does not have legal basis for authority to order an evacuation.<br />
Municipalities: Six have legal basis.<br />
• <strong>County</strong> has legal basis for redirecting funds for emergency use.<br />
Municipalities: Five have legal basis; one answered not applicable.<br />
• <strong>County</strong> does not have legal basis for ordering a curfew.<br />
Municipalities: Five have legal basis.<br />
• <strong>County</strong> does not have legal basis for commandeering facilities, equipment,<br />
and materials.<br />
Municipalities: Five have legal basis; one does not.<br />
• <strong>County</strong> does not have legal basis to authorize lines of succession to carry out<br />
emergency activities.<br />
3
4<br />
<strong>Jefferson</strong> <strong>County</strong> – Section 3<br />
Municipalities: Six have legal basis; two do not know.<br />
• <strong>County</strong> has system to safeguard records to conduct emergency operations<br />
Municipalities: Five have system to safeguard; one does not.<br />
• <strong>County</strong> has system to safeguard vital records to reconstitute local<br />
government.<br />
Municipalities: Six have system to safeguard.<br />
• <strong>County</strong> has not developed an all-hazard vulnerability analysis to access<br />
potential consequences of disasters.<br />
Municipalities: Five have done analysis; one has not.<br />
• <strong>County</strong> has a multi-hazard emergency operations plan.<br />
Municipalities: Six have a multi-hazard plan.<br />
• <strong>County</strong> has mutual aid compacts with other jurisdictions<br />
Municipalities: Six have mutual aid compacts.<br />
• <strong>County</strong> EOP addresses the protection of people with special needs.<br />
Municipalities: Four address the protection; two do not.<br />
Intergovernmental Intergovernmental and and and Interagency Interagency Coordination<br />
Coordination<br />
The <strong>County</strong> Emergency Management Agency interacts with the municipalities and single<br />
purpose governments on a regular basis to maintain communication and coordination of<br />
policy related to emergency management.<br />
Vulnerability Vulnerability Assessment Assessment of of <strong>County</strong> <strong>County</strong> Policies Policies Policies and and Development Development Trends<br />
Trends<br />
Commitments Commitments to to a a Comprehensive Comprehensive Mitigation Mitigation Mitigation Program<br />
Program<br />
<strong>Jefferson</strong> <strong>County</strong> has a well-established Emergency Management Agency. It regularly<br />
updates the EOP, addressing mitigation measures for hazards, both natural and manmade,<br />
incorporating any changes to the plan necessitated by changes in transportation<br />
infrastructure and land use.<br />
Laws, Laws, Laws, Reg Regulations Reg Regulations<br />
ulations and Policies Policies Related Related to to Development Development Development in in in Hazard Hazard-Prone Hazard Hazard Prone Prone Areas Areas<br />
The floodplain management ordinances of the county and municipalities are based on<br />
policies to protect health and welfare of people and minimize damage to public<br />
infrastructure and physical structures. They also restrict avoidable increases in flood height<br />
or velocity and protect individuals from buying land unsuited for the intended use due to a<br />
flood hazard.<br />
<strong>County</strong> <strong>County</strong> Laws, Laws, Regulations Regulations and and Policies Policies Related Related to to Hazard Hazard Mitigation Mitigation in in General Genera<br />
Zoning and floodplain ordinances, coupled with the enforcement of building codes and<br />
the approval process for subdivisions and new or reconstructive development assures that
A Regional Overview All-Hazard Mitigation Plan<br />
hazards are addressed in the proposal and planning stages of the development process.<br />
Stormwater regulations that the county will soon be adopting and those of seven<br />
responding municipalities are designed to minimize the harmful physical and economic<br />
effects of erosion, sedimentation, and flooding from stormwater runoff. This is<br />
accomplished through the requirement of measures to mitigate erosion, both during and<br />
after construction; the detention and controlled discharge of the differential runoff from<br />
the development; coupled with a well-designed stormwater conveyance system.<br />
Missouri statute RSMo 319.203 requires that cities and counties in the Level VII earthquake<br />
zone pass “an ordinance of order” regarding earthquake preparedness and building<br />
requirements demonstrating compliance with 319.207 for certain types of structures. This<br />
statute applies to <strong>Jefferson</strong> <strong>County</strong>.<br />
How Local Local Local Risk Assessments are Incorporated and and and Prioritized into into Local Local Planning<br />
Planning<br />
Of the hazard risks the county has exposure to, riverine and flash flooding hazard risks are<br />
foremost in frequency and potential magnitude in loss of people and property.<br />
Enforcement of zoning, floodplain, stormwater ordinances, and placement of public<br />
infrastructure provide the most effective tools to minimize known risks.<br />
The county and municipalities recognize the danger and economic impact of severe winter<br />
storms. Clearing of snow and ice from roadways is a main priority during these events.<br />
The Missouri Department of Transportation has responsibility for the interstate and state<br />
designated highways within the county. The <strong>County</strong> Highway Department and<br />
municipalities clear their respective roadways, prioritizing known hazardous stretches of<br />
roadways, school bus stops, and intersections in efforts to reduce accidents and maintain<br />
the movement of people and goods.<br />
Current Current Criteria Criteria Used to Prioritize Mitigation Funding<br />
Mitigation funding is based upon the combination of expected damage, the assumed<br />
frequency of damage, and the likelihood of death or injury to people.<br />
Integration Integration of of Hazard Hazard Mitigation Mitigation with with the the City/<strong>County</strong> City/<strong>County</strong> Department’s Department’<br />
s Plans<br />
A city or county EOP and its floodplain, zoning, subdivision, and building code ordinances<br />
developed and enforced in an integrated fashion insure that avoidable disasters are<br />
prevented, and the vulnerability of people and property to the effects of disasters is<br />
reduced.<br />
5
6<br />
How How the the <strong>County</strong> <strong>County</strong> <strong>County</strong> Determines Determines Determines Cost Cost-Effectiveness Cost Effectiveness of Mitigation Programs<br />
<strong>Jefferson</strong> <strong>County</strong> – Section 3<br />
Cost-effectiveness is considered on a case-by-case basis; dependent upon the scope of<br />
damages, estimated savings in future hazard events, the type of mitigation project, and the<br />
probable hazard to human life in future events. A FEMA cost/benefit analysis is required<br />
for FEMA funded projects.<br />
Mitigation Mitigation Funding Funding Options Options (including (including current current and and potential potential sources sources of of federal, federal, state, state, state, local,<br />
local,<br />
private private private funds)<br />
funds)<br />
The county and municipalities have utilized federal or state funds when disaster<br />
declarations have been made in the case of heavy widespread damages. Sources have<br />
included FEMA, SEMA, the Missouri Department of Natural Resources and Department of<br />
Economic Development. In addition to local government general revenue funds, the<br />
<strong>County</strong> and many of the municipalities have either a dedicated transportation and/or<br />
capital improvements sales/use tax that can be used to fund mitigation projects. These<br />
projects are generally reactive or reconstructive in nature. In some cases, private property<br />
owners cost share in these projects. Private funds are expended when necessary mitigation<br />
measures are incorporated into a development plan.<br />
How How Governments Governments Meet Meet Requirements Requirements for for Hazard Hazard Mitigation Mitigation Funding Funding Programs<br />
Governmental jurisdictions meet the requirements for hazard mitigation funding programs<br />
if the project conforms to Missouri’s Hazard Mitigation Plan, provides a beneficial impact<br />
on the disaster area, meeting environmental requirements, solves the problem<br />
independently, and is cost-effective. Adoption of the Resolution of Intent to Participate in<br />
All-Hazard Mitigation will insure that a county or municipality is eligible for hazard<br />
mitigation funding programs.<br />
Recomme Recommendations Recomme Recomme ndations for Improvement<br />
Recommended improvements include working with watershed groups and engineering<br />
consultants to assess and maintain watersheds, marking flood prone areas, working with<br />
the wastewater and stormwater management districts to control runoff issues and address<br />
growth issues, address soil erosion in parks, improve stormwater ordinances, and conduct<br />
mitigation property buyouts. Additional recommendations pertaining to education and<br />
training include upgrade and install warning and communications systems (through<br />
assistance from business sponsors), create Emergency Management Center (for<br />
communities of Festus, Pevely, Herculaneum, Crystal City), coordination between<br />
communities and planners/cooperative technical agreements, education for public safety<br />
(earthquake proof historic buildings), prioritize assistance to smaller communities (training),<br />
and use of municipal league as nexus for coordination. Further recommendations consist<br />
of collaboration of communities and local emergency services with Highway departments<br />
regarding construction of roads and bridges pertaining to stability/earthquake hazard proof
A Regional Overview All-Hazard Mitigation Plan<br />
structures, performing retrofits of one or two emergency rooms to withstand earthquake,<br />
assist with the full implementation of the MDNR dam safety program, and installation of<br />
back-up power systems for critical facilities and/or burying critical power lines.<br />
The Missouri Seismic Safety Commission (under Missouri statutes RSMo 44.227, 44.229,<br />
44.231, 44.233, 44.235, and 44.277) has developed a Strategic Plan for earthquake safety<br />
in Missouri. This plan contains recommendations for earthquake mitigation. Use of the<br />
Strategic Plan by the <strong>County</strong> would facilitate mitigation planning.<br />
Missouri has an organization called Structural Assessment and Visual Evaluation (SAVE)<br />
coalition. The Coalition's objective is to assist the Missouri State Emergency Management<br />
Agency (SEMA) in the execution of its responsibilities with respect to the use of qualified<br />
volunteers in the emergency assessment of buildings following catastrophic events.<br />
S.A.V.E. volunteers consist of architects, professional engineers, and other qualified<br />
professionals that assist SEMA in assessing buildings and vertical structures following<br />
catastrophic events. The S.A.V.E. Coalition also includes the American Institute of<br />
Architects/Missouri (AIA/MO), the American Society of Civil Engineers (ASCE), the<br />
Consulting Engineers <strong>Council</strong> of MO (CECMO), and the Missouri Society of Professional<br />
Engineers (MSPE).<br />
<strong>County</strong> <strong>County</strong> and and and Municipal Municipal Policies Policies and and and Development Development Trends<br />
Trends<br />
At present, the county is more densely developed in the northern third of the county; along<br />
Interstate 55, located along its eastern boundary; and the State Highway 21 and State<br />
Highway 30 corridors. <strong>Jefferson</strong> <strong>County</strong>’s population was 198,099 in 2000, increasing by<br />
15.6 percent in the last decade. It is predicted that the county will see an increase of 11<br />
percent by 2010, and about 28 percent by 2025, with a population of about 253,000. Of<br />
the county population of 198,099 in year 2000, almost 74 percent lived outside<br />
incorporated areas.<br />
<strong>Jefferson</strong> <strong>County</strong> has a current master plan, zoning, subdivision regulations, and a building<br />
code. Of the municipalities in the county, seven answered that they have master plans and<br />
six did not answer. Seven have zoning, subdivision, stormwater, and building codes; six<br />
did not answer.<br />
<strong>Jefferson</strong> <strong>County</strong>’s capability assessment is summarized at the end of this section.<br />
Funding Funding Sources<br />
Sources<br />
There are several sources of funding for both pre- and post-disaster hazard mitigation<br />
policies and projects. While all mitigation techniques will likely save money by avoiding<br />
losses, the cost of implementing mitigation efforts can be substantial and well beyond the<br />
local government’s capacity to fund the mitigation activity. There are existing federal and<br />
state funding programs that can be utilized for funding assistance. The following is a list<br />
7
8<br />
<strong>Jefferson</strong> <strong>County</strong> – Section 3<br />
of some sources of funding presently available. This list is not comprehensive, as new<br />
programs can be developed or existing programs can be eliminated or modified.<br />
State State State Mitigation Mitigation Resources:<br />
Resources:<br />
http://sema.dps.mo.gov/Mitigation.htm<br />
http://sema.dps.mo.gov/Mitigation.htm<br />
Federal Federal Sources<br />
Sources<br />
TITLE: TITLE: PRE PRE-DISASTER PRE<br />
DISASTER MITIGATION PROGRAM<br />
AGENCY: AGENCY: FEDERAL FEDERAL EMERGENCY MANAGEMENT AGENCY (FEMA)<br />
http://www.fema.gov/government/grant/pdm/index<br />
http://www.fema.gov/government/grant/pdm/index<br />
http://www.fema.gov/government/grant/pdm/index<br />
The Pre-Disaster Mitigation (PDM) program provides funds to states, territories, Indian<br />
tribal governments, communities, and universities for hazard mitigation planning and the<br />
implementation of mitigation projects prior to a disaster event.<br />
Funding these plans and projects reduces overall risks to the population and structures,<br />
while also reducing reliance on funding from actual disaster declarations. PDM grants are<br />
to be awarded on a competitive basis and without reference to state allocations, quotas, or<br />
other formula-based allocation of funds.<br />
The FY 2009 grant application was due FEMA by Dec. 19 th , 2008, by midnight.<br />
TITLE: TITLE: FLOOD MITIGATION ASSISTANCE PROGRAM<br />
AGENCY: AGENCY: FEDERAL FEDERAL EMERGENCY EMERGENCY MANAGEMENT MANAGEMENT AGENCY<br />
AGENCY<br />
http://www.fema.gov/government/grant/fma/index<br />
http://www.fema.gov/government/grant/fma/index<br />
FEMA’S Flood Mitigation Assistance Program (FMA) provides funding to assist states and<br />
communities in implementing measures to reduce or eliminate the long-term risk of flood<br />
damage to buildings, manufactured homes, and other structures insurable under the<br />
National Flood Insurance Program (NFIP). FMA was created as part of the National Flood<br />
Insurance Reform Act of 1994 (42 U.S.C. 4101) with the goal of reducing or eliminating<br />
claims under the NFIP. FMA is a pre-disaster grant program, and is made available to<br />
states on an annual basis. This funding is exclusively available for mitigation planning and<br />
implementation of mitigation measures. There are three such grants: planning grants,<br />
project grants, and technical assistance grants. Planning grants include assessing risk and<br />
developing a mitigation plan to reduce risks. Project grants include the purchase,<br />
relocation, or destruction of NFIP insured buildings to reduce flood losses. Technical<br />
assistance grants help communities develop and implement projects.<br />
• Planning Planning Grants Grants to prepare Flood Mitigation Plans. Only NFIP-participating<br />
communities with approved Flood Mitigation Plans can apply for FMA Project grants<br />
• Project Project Grants Grants to implement measures to reduce flood losses, such as elevation,<br />
acquisition, or relocation of NFIP-insured structures. States are encouraged to<br />
prioritize FMA funds for applications that include repetitive loss properties; these
A Regional Overview All-Hazard Mitigation Plan<br />
include structures with 2 or more losses each with a claim of at least $1,000 within<br />
any ten-year period since 1978.<br />
• Technical Technical Assistance Assistance Gr Grants Gr ants for the State to help administer the FMA program and<br />
activities. Up to ten percent (10%) of Project grants may be awarded to states.<br />
TITLE: TITLE: HAZARD HAZARD MITIGATION GRANT PROGRAM<br />
AGENCY: AGENCY: FEDERAL FEDERAL EMERGENCY EMERGENCY MANAGEMENT MANAGEMENT AGENCY<br />
AGENCY<br />
http://www.fema.gov/government/grant/hmgp/index<br />
http://www.fema.gov/government/grant/hmgp/index<br />
The Hazard Mitigation Grant Program (HMGP) was created in November 1988 through<br />
Section 404 of the Robert T. Stafford Disaster Relief and Emergency Assistance Act. The<br />
HMGP assists states and local communities in implementing long-term mitigation measures<br />
following a Presidential disaster declaration.<br />
Criteria: Project must conform with State’s Hazard Mitigation Plan, provide a beneficial<br />
impact on the disaster area, meet environmental requirements, solve a problem<br />
independently, and be cost-effective.<br />
TITLE: TITLE: REPETITIVE FLOOD CLAIMS CLAIMS PROGRAM<br />
AGENCY: AGENCY: AGENCY: FEDERAL FEDERAL EMERGENCY EMERGENCY EMERGENCY MANAGEMENT MANAGEMENT AGENCY AGENCY<br />
AGENCY<br />
http://www.fema.<br />
http://www.fema.gov/government/grant/rfc/index<br />
http://www.fema. gov/government/grant/rfc/index<br />
The Repetitive Flood Claims (RFC) grant program was authorized by the Bunning-Bereuter-<br />
Blumenauer Flood Insurance Reform Act of 2004 (P.L. 108–264), which amended the<br />
National Flood Insurance Act (NFIA) of 1968 (42 U.S.C. 4001, et al).<br />
Up to $10 million is available annually for FEMA to provide RFC funds to assist States and<br />
communities reduce flood damages to insured properties that have had one or more claims<br />
to the National Flood Insurance Program<br />
Eligible Eligible Mitigation Mitigation Activ Activities Activ Activities<br />
ities: ities<br />
• Acquisition of properties, and either demolition or relocation of flood-prone<br />
structures, where the property is deed restricted for open space uses in perpetuity.<br />
• Elevations (Elevating structures from floodplains).<br />
• Dry Floodproofing of non-residential structures<br />
• Minor localized flood control projects (funding limited to $1M per project).<br />
Federal Federal Federal / / Non Non-Federal Non Federal Cost Share:<br />
FEMA may contribute up to 100 percent of the total amount approved under the RFC<br />
grant award to implement approved activities, if the Applicant has demonstrated that the<br />
proposed activities can not be funded under the Flood Mitigation program due to lack of<br />
9
10<br />
<strong>Jefferson</strong> <strong>County</strong> – Section 3<br />
State or local capacity, which includes either inability to manage the subgrant or lack of<br />
25% match.<br />
The FY 2009 grant application was due FEMA by Dec. 19 th , 2008, by midnight.<br />
TITLE: TITLE: SEVERE REPETITIVE FLOOD CLAIMS PROGRAM<br />
AGENCY: AGENCY: AGENCY: FEDERAL FEDERAL FEDERAL EMERGENCY EMERGENCY EMERGENCY MANAGEMENT MANAGEMENT MANAGEMENT AGENCY AGENCY<br />
AGENCY<br />
http://www.fema.gov/government/grant/srl/i<br />
http://www.fema.gov/government/grant/srl/index<br />
http://www.fema.gov/government/grant/srl/i ndex<br />
The Severe Repetitive Loss (SRL) grant program was authorized by the Bunning-Bereuter-<br />
Blumenauer Flood Insurance Reform Act of 2004, which amended the National Flood<br />
Insurance Act of 1968 to provide funding to reduce or eliminate the long-term risk of flood<br />
damage to severe repetitive loss (SRL) structures insured under the National Flood<br />
Insurance Program (NFIP).<br />
The definition of severe repetitive loss as applied to this program was established in<br />
section 1361A of the National Flood Insurance Act, as amended (NFIA), 42 U.S.C. 4102a.<br />
An SRL property is defined as a residential property that is covered under an NFIP flood<br />
insurance policy and:<br />
(a) That has at least four NFIP claim payments (including building and contents)<br />
over $5,000 each, and the cumulative amount of such claims payments exceeds<br />
$20,000; or<br />
(b) For which at least two separate claims payments (building payments only) have<br />
been made with the cumulative amount of the building portion of such claims<br />
exceeding the market value of the building.<br />
For both (a) and (b) above, at least two of the referenced claims must have occurred within<br />
any ten-year period, and must be greater than 10 days apart.<br />
Eligible Eligible flood flood mitigation mitigation mitigation projec project projec t activities:<br />
• Acquisition and demolition or relocation of at risk structures and conversion of the<br />
property to open space;<br />
• Elevation of existing structures to at least the Base Flood Elevation (BFE) or an<br />
Advisory Base Flood Elevation (ABFE) or higher. For the SRL program only,<br />
mitigation reconstruction is permitted only when traditional elevation cannot be<br />
implemented;<br />
• Minor physical localized flood reduction projects; and<br />
• Dry floodproofing (historic properties only).<br />
Federal Federal / / Non Non-Federal Non Federal Federal cost share: 75 / 25 %; up to 90 % Federal cost-share funding for<br />
projects approved in States, Territories, and Federally-recognized Indian tribes with FEMAapproved<br />
Standard or Enhanced Mitigation Plans or Indian tribal plans that include a<br />
strategy for mitigating existing and future SRL properties.
A Regional Overview All-Hazard Mitigation Plan<br />
TITLE: TITLE: SBA DISASTER ASSISTANCE PROGRAM<br />
AGENCY: AGENCY: U. U. S. S. SMALL SMALL SMALL BUSINESS BUSINESS BUSINESS ADMINISTRATION<br />
ADMINISTRATION<br />
http://www.sba.gov/services/disasterassistance/index.html<br />
http://www.sba.gov/services/disasterassistance/index.html<br />
The purpose of the Pre-Disaster Mitigation Loan Program is to make low-interest, fixed rate<br />
loans to eligible small businesses for the purpose of implementing mitigation measures to<br />
protect business property from damage that may be caused by future disasters. The<br />
program is a pilot program, which supports FEMA’s Pre-Disaster Mitigation Program.<br />
SBA’s Pre-Disaster Mitigation Program is available to businesses whose proposed mitigation<br />
measure conforms to the priorities and goals of the mitigation plan for the community, as<br />
defined by FEMA, in which the business is located. Because the program has been<br />
approved only for limited funding, approved loan requests will be funded on a first-come,<br />
first-served basis up to the limit of the program funds and may not exceed 20% of the total<br />
amount of disaster damage.<br />
TITLE: TITLE: COMMUNITY COMMUNITY DEVELOPMENT DEVELOPMENT BLOCK GRANTS<br />
AGENCY: AGENCY: U. U. S. S. DEPARTMENT DEPARTMENT OF OF HOUSING HOUSING AND AND AND URBAN URBAN URBAN DEVELOPMENT<br />
DEVELOPMENT<br />
http://www.hud.gov/grants/index.cfm<br />
http://www.hud.gov/grants/index.cfm<br />
The Community Development Block Grant (CDBG) program provides grants to local<br />
governments for community and economic development projects that primarily benefit<br />
low-and moderate-income people. The CDBG program also provides grants for postdisaster<br />
hazard mitigation and recovery following a Presidential disaster declaration.<br />
CBDG eligible communities (generally communities with under 50,000 population and<br />
counties under 200,000 population) are located within a Presidential disaster declaration<br />
area.<br />
TITLE:<br />
TITLE: DISASTER MITIGATION PLANNING PLANNING AND TECHNICAL ASSISTANCE<br />
ASSISTANCE<br />
AGENCY: AGENCY: DEPARTMENT DEPARTMENT OF OF COMMERCE, COMMERCE, ECONOMIC ECONOMIC DEVELOPMENT DEVELOPMENT ADMINISTRATION<br />
ADMINISTRATION<br />
http://oamweb.osec.doc.gov/aboutOAM_organization_GMD.ht<br />
http://oamweb.osec.doc.gov/aboutOAM_organization_GMD.html<br />
http://oamweb.osec.doc.gov/aboutOAM_organization_GMD.ht ml<br />
These grants are primarily designed for economic development initiatives, but are<br />
applicable to hazard mitigation when the focus is on creating disaster resistant jobs and<br />
workplaces. Also, these monies are applicable because often projects related to developing<br />
infrastructure are also making the community more disaster resistant.<br />
TITLE: TITLE: WATERSHED MANAGEMENT DEVELOPMENT PROGRAM PROGRAM PROGRAM GRANT<br />
GRANT<br />
AGENCY: AGENCY: M M ISSOURI DEPARTMENT OF NATURAL RESOURCES (Section 319) 319)<br />
www.dnr.mo.gov/env/wpp/wpcnpsmp.htm<br />
www.dnr.mo.gov/env/wpp/wpcnpsmp.htm<br />
www.dnr.mo.gov/env/wpp/wpcnpsmp.htm<br />
• Completed Watershed Management Plans must contain the critical watershed<br />
elements.<br />
• The watershed or water body must be on the Targeted Nonpoint Source 303(d) List<br />
• Funds are available to public institutions of higher education, units of government<br />
and nonprofit organizations with 501(c)(3) status.<br />
11
12<br />
<strong>Jefferson</strong> <strong>County</strong> – Section 3<br />
• The grant award maximum is $15,000.<br />
• Projects may be up to two years in length.<br />
• Non-federal match required in a ratio of 60 percent 319 funds to 40 percent nonfederal<br />
funds. Matching support may include “in-kind” contributions. (Soil and<br />
Water Conservation Districts are not required to document match on agricultural<br />
projects.)<br />
• Completed watershed management plans must be designed to achieve the load<br />
reductions called for in any completed Total Maximum Daily Load (TMDL). If no<br />
TMDL has been completed, the plan must be designed to reduce pollutant loads to<br />
meet water quality standards.<br />
Application Application Criteria<br />
Criteria<br />
1. The project must meet the requirements of this Request for Proposals.<br />
2. The project must demonstrate a high likelihood of success based on quality of the<br />
proposal, previous successes, appropriateness of goals, support of important<br />
partners, an area of manageable size, appropriate practices, adequate funding,<br />
competent management, etc.<br />
3. Projects should encompass a complete watershed or sub-watershed of manageable<br />
size and address all significant nonpoint pollutant sources.<br />
4. Involve interagency coordination and cooperation. Locally led projects are preferred.<br />
Letters of support should be included with the application.<br />
5. Cost-effectiveness of the project will be a significant factor. Projects that include<br />
higher percentages of funds for administrative, overhead or indirect costs will be<br />
considered a lower priority. Indirect rates cannot exceed 13 percent.<br />
TITLE: TITLE: CONSERVATION EFFECTS ASSESSMENT PROJECT<br />
AGENCY: AGENCY: DEPARTMENT DEPARTMENT OF OF AGRICULTURE, AGRICULTURE, Natural Natural Resources<br />
Resources<br />
http://www.csrees.usda.gov/fo/fund<br />
http://www.csrees.usda.gov/fo/fundview.cfm?fonum=1160<br />
http://www.csrees.usda.gov/fo/fund<br />
http://www.csrees.usda.gov/fo/fundview.cfm?fonum=1160<br />
view.cfm?fonum=1160<br />
The Integrated Research, Education, and Extension Competitive Grants Program -<br />
Conservation Effects Assessment Project (CEAP) is to develop research and extension<br />
projects aimed at improving the watershed health of grazing land watersheds. The goal of<br />
this program area is to build a knowledge base that can be used to evaluate the impacts of<br />
conservation projects and programs on grazing land watershed health, improve the<br />
management of grazing lands to achieve environmental goals and inform policy decisions.<br />
Grant monies range from 0-$650,000.
A Regional Overview All-Hazard Mitigation Plan<br />
State State Sources<br />
Sources<br />
TITLE: TITLE: WATER AND SEWER GRANT PROGRAMS<br />
AGENCY: MISSOURI DEPARTMENT DEPARTMENT OF OF ECONOMIC DEVELOPMENT<br />
DEVELOPMENT<br />
FROM FROM COMMUNITY COMMUNITY DEVELOPMENT DEVELOPMENT BLOCK BLOCK GRANT GRANT PROGRAM<br />
PROGRAM<br />
http://www.hud.gov/offices/cpd/communitydevelopment/programs/<br />
http://www.hud.gov/offices/cpd/communitydevelopment/programs/<br />
The Department of Economic Development offers grants to enhance infrastructure such as<br />
water and sewer lines. These grants might be particularly helpful in protecting against<br />
drought by connecting disparate water sources and thereby providing multiple water<br />
sources to isolated communities. These monies might also be helpful in providing<br />
adequate protection of sewage treatment plants from the risk of flood or separation of<br />
storm water from combined sewer lines.<br />
TITLE: TITLE: TITLE: EMERGENCY EMERGENCY MANAGEMENT/MITIGATION MANAGEMENT/MITIGATION TRAINING TRAINING<br />
TRAINING<br />
AGENCY: AGENCY: AGENCY: STATE STATE STATE EMERGENCY EMERGENCY MANAGEMENT MANAGEMENT AGENCY<br />
AGENCY<br />
http://www.sema.dps.mo.gov/<br />
http://www.sema.dps.mo.gov/<br />
The State Emergency Management Agency (SEMA) offers grants for training jurisdictions in<br />
hazard mitigation, preparedness, and planning. These funds are used for training<br />
appropriate staff in identifying projects best suited for mitigation.<br />
TITLE: TITLE: PRE PRE-DISASTER PRE<br />
DISASTER DISASTER MITIG MITIGATION MITIG<br />
ATION PROJECT IMPACT<br />
AGENCY: AGENCY: AGENCY: STATE STATE EMERGENCY EMERGENCY EMERGENCY MANAGEMENT MANAGEMENT AGENCY<br />
AGENCY<br />
http://sema.dps.mo.gov/PDMC2007FEMAGuidanceOverview.pdf<br />
http://sema.dps.mo.gov/PDMC2007FEMAGuidanceOverview.pdf<br />
SEMA funds are provided to assist communities with technical assistance in the<br />
development of a sustained pre-disaster mitigation program. Funds can be used for<br />
planning mitigation initiatives and for providing technical “know-how” in the construction<br />
of mitigation projects.<br />
TITLE: TITLE: PUBLIC ASSISTANCE PROGRAM<br />
AGENCY: GENCY: GENCY: STATE STATE STATE EMERGENCY EMERGENCY EMERGENCY MANAGEMENT MANAGEMENT MANAGEMENT AGENCY AGENCY<br />
AGENCY<br />
http://www.fema.gov/government/grant/pa/index.shtm<br />
http://www.fema.gov/government/grant/pa/index.shtm<br />
These SEMA grants are designed to provide funds to repair damaged infrastructure and<br />
public facilities. Funds can also be used to reinstate government services impacted by a<br />
hazard event. Also, this program can fund the repair of damaged components of a<br />
structure.<br />
The Federal share of assistance is not less than 75% of the eligible cost for emergency<br />
measures and permanent restoration. The grantee (usually the State) determines how the<br />
non-Federal share (up to 25%) is split with the sub grantees (eligible applicants).<br />
13
14<br />
TITLE: TITLE: DISASTER RECOVERY INITIATIVE INITIATIVE<br />
AGENCY: AGENCY: MISSOURI MISSOURI DEPARTMENT DEPARTMENT DEPARTMENT OF OF ECO ECONOMIC ECO NOMIC DEVELOPMENT<br />
DEVELOPMENT<br />
DEVELOPMENT<br />
http://www.hud.gov/info/disasters.cfm<br />
http://www.hud.gov/info/disasters.cfm<br />
http://www.hud.gov/info/disasters.cfm<br />
<strong>Jefferson</strong> <strong>County</strong> – Section 3<br />
The Missouri Department of Economic Development (DED) provides this grant program to<br />
bridge funding gaps in recovery assistance after a disaster. These funds can also be used to<br />
fund gaps in a mitigation development program.<br />
TITLE: TITLE: SOIL AND WATER CONSERVATION PROGRAM<br />
AGENCY: AGENCY: MISSOURI MISSOURI DEPARTMENT DEPARTMENT OF OF NATURAL NATURAL RESOURCES<br />
RESOURCES<br />
http://www.dnr.mo.go<br />
http://www.dnr.mo.gov/financial.htm<br />
http://www.dnr.mo.go<br />
http://www.dnr.mo.go v/financial.htm<br />
The Missouri Department of Natural Resources (DNR), through the Soil and Water<br />
Conservation Program, offer grants, cost share programs, and low interest loans to<br />
agencies and property owners to plan and implement best practices to reduce soil erosion<br />
and improve water quality. Practices that facilitate slower release of water upstream<br />
mitigate downstream flood hazards. The programs are generally applicable to rural and<br />
agricultural environments.<br />
OTHER OTHER SOURCES SOURCES SOURCES IN IN THE THE THE FUNDING FUNDING OF OF MITIG MITIGATION MITIG ATION PROJECTS<br />
Local Local Local Sources Sources<br />
Sources<br />
Municipal and county governments can provide funds for projects through their general<br />
revenue fund and through a dedicated capital improvement and/or transportation, sales,<br />
and use taxes. Special taxing districts, such as a Neighborhood Improvement District (NID),<br />
can be formed if practical, to assess property owners for a portion of the cost of<br />
improvements.<br />
Non Non-governmental<br />
Non governmental<br />
Other potential sources of revenue for implementing local mitigation projects are monetary<br />
contributions from nonprofit organizations such as the American Red Cross, community<br />
relief funds, churches, charitable trusts, and land trusts.<br />
Conclusion<br />
Conclusion<br />
There are many sources of funding available for hazard mitigation projects. Those<br />
identified here, while they are significant, do not comprise all potential sources. It should<br />
be noted that new programs can become available, and existing programs can be modified<br />
or dropped. Many funds available are leveraged with “local” matching funds at various<br />
contribution percentages. In order to take advantage of state and federal funding,<br />
community diligence in keeping abreast of changes in funding opportunities will be<br />
necessary for implementing hazard mitigation projects.
A Regional Overview All-Hazard Mitigation Plan<br />
WORKSHEET<br />
WORKSHEET<br />
JEFFERSON JEFFERSON COUNTY COUNTY CAPABILITY CAPABILITY CAPABILITY AS ASSESSMENT AS SESSMENT WORKSHEET<br />
15
16<br />
Policies Policies and and<br />
and<br />
Programs<br />
Programs<br />
(ex. (ex. Zoning<br />
Zoning<br />
Ordinance) Ordinance)<br />
Ordinance)<br />
Floodplain<br />
management<br />
Multi-hazard<br />
emergency plan<br />
Stormwater<br />
regulations<br />
Building<br />
regulations<br />
Document Document<br />
Document<br />
Reference<br />
Reference<br />
(ex.<br />
(ex.<br />
Comprehensive<br />
Comprehensive<br />
Plan Plan Plan & & & page page<br />
page<br />
number)<br />
number)<br />
<strong>County</strong> Floodplain<br />
Management<br />
Ordinance<br />
<strong>County</strong> Emergency<br />
Operations Plan<br />
<strong>County</strong> Stormwater<br />
and Subdivision<br />
Regulations<br />
<strong>County</strong><br />
BOCA<br />
2003<br />
Flood insurance Joined NFIP<br />
Mississippi River<br />
Levee issues<br />
5/16/83<br />
#290808<br />
CAPABILITY CAPABILITY ASSESSMENT<br />
ASSESSMENT<br />
Effective-<br />
Effective<br />
ness ness for for<br />
for<br />
Mitigation<br />
Mitigation<br />
(ex. (ex. low,<br />
low,<br />
medium, medium,<br />
medium,<br />
high)<br />
high)<br />
High<br />
<strong>Jefferson</strong> <strong>County</strong> – Section 3<br />
Rationale Rationale for for for Effectiveness<br />
Effectiveness<br />
(ex. (ex. low low because because allows<br />
allows<br />
development development in in floodplain) floodplain)<br />
floodplain)<br />
New construction and improvements are<br />
not allowed without extensive mitigation<br />
requirements. Any encroachments such as<br />
fill, new construction, or other<br />
developments within in the floodway must<br />
not create any increase in flood levels<br />
within the community during a base flood<br />
discharge.<br />
Requires 2 feet freeboard.<br />
Medium Consider more formal mutual aid<br />
agreements, improve the Emergency<br />
Operations Center, warning systems in rural<br />
areas, emergency response equipment,<br />
training for volunteer agencies and the<br />
private sector, and public preparedness<br />
education.<br />
Medium Stormwater runoff, sediment and erosion<br />
management provides effective measures to<br />
deal with increasing development trends.<br />
Medium The county has building inspectors that<br />
ensure construction is built to code.<br />
High The county administers and participates<br />
fully in the NFIP.<br />
Levee districts Medium Coordination with county jurisdictions<br />
through US Corps of Engineers.
A Regional Overview All-Hazard Mitigation Plan 1<br />
SECTION SECTION 4<br />
4<br />
Introduction Introduction to to Mitigation<br />
Mitigation<br />
The <strong>East</strong>-<strong>West</strong> <strong>Gateway</strong> <strong>Council</strong> of Governments is subject to many types of hazards:<br />
flooding, tornado/severe windstorm, winter storm, earthquake/landslide, dam failure,<br />
drought, heat wave, and an occasional wildfire. All-hazard mitigation planning is the<br />
process associated with devising strategies needed to mitigate the damages associated<br />
with these natural disasters.<br />
Definition Definition of of Mitigation<br />
Mitigation<br />
Mitigation is defined as “sustained action that reduces or eliminates long-term risk to<br />
people and property from hazards and their effects.” It describes the ongoing efforts at<br />
the Federal, State, local and individual levels to lessen the impact of disasters upon families,<br />
homes, jurisdictions and the economy.<br />
Mitigation includes avoiding the development of hazard prone sections of the jurisdiction,<br />
and making existing development in hazard-prone areas safer. Certain areas in some<br />
jurisdictions are susceptible to damage from hazards. As such, steps are taken to make<br />
these areas less vulnerable through flood buyouts.<br />
Jurisdictions can steer growth to less risky areas, through non-structural measures such as<br />
avoiding construction in flood-prone areas. Keeping buildings and people out of harm’s<br />
way is the essence of mitigation. Incorporating mitigation into decisions relating to a<br />
jurisdiction’s growth can result in a safer, more resilient jurisdiction, and one that is more<br />
attractive to families and businesses.<br />
Categories Categories Categories of of Mitigation<br />
Mitigation<br />
Mitigation categories are grouped into six categories.<br />
• Prevention Prevention - Prevention measures are intended to keep a hazard risk problem from<br />
getting worse; it ensures future development does not increase losses. Some<br />
examples include: planning and zoning, open space preservation, land development<br />
regulations, and storm water management.<br />
• Property Property Protection Protection - These measures are used to modify buildings and other<br />
surroundings subject to hazard risk or their surroundings, rather than prevent the<br />
hazard from occurring. These measures protect people and property at risk. Some<br />
examples include: acquisition/public procurement and management of lands that<br />
are vulnerable to damage from hazards; relocation/permanent evacuation of hazard<br />
prone areas to safer areas; rebuilding and modifying structures to reduce damage
2<br />
<strong>Jefferson</strong> <strong>County</strong> – Section 4<br />
by future hazard events; floodproofing or protection of floodprone buildings, using<br />
various methods.<br />
• Natural Natural Natural Resource Resource Resource Protection Protection Protection - These measures are intended to reduce the intensity<br />
of hazard effects and to improve the quality of the environment and wildlife. Parks,<br />
recreation, conservation agencies and similar organizations implement these<br />
activities. Some examples of this mitigation measure include: erosion and sediment<br />
control, and wetlands protection.<br />
• Emergency Emergency Services Services Services - Emergency services measures protect people before and after a<br />
hazard event. Most counties and many cities have emergency management offices<br />
to coordinate warning, responses and recovery during disasters. Emergency services<br />
include warning, capacity of response, critical facilities protection and health and<br />
safety maintenance.<br />
• Structural Structural Projects Projects Projects - These measures directly protect people and property at risk.<br />
They are called structural because they involve construction of manmade structures<br />
to control hazards. Structural projects for flood control include reservoirs,<br />
levees/floodwalls, diversions, channel modifications, and storm sewers.<br />
• Public Public Information<br />
Information Information - Public information activities inform and remind citizens about<br />
hazardous areas and measures needed to avoid damage and injury. This<br />
information is directed to present and future property owners, present and future<br />
business owners, and visitors. Some examples of public information activities<br />
include providing hazard maps and other information; outreach hazard mitigation<br />
programs through newspapers, radio/TV/videotape, mass mailings, notices/displays,<br />
property owner handbook, presentations; real estate disclosure, public library,<br />
technical assistance, and school age and adult education classes.<br />
Mitigation Mitigation Mitigation Versus Versus Prepa Preparedness<br />
Prepa Prepa redness<br />
Mitigation differs from preparedness in that it is designed to address long term activities<br />
that reduce or eliminate a hazard and/or a hazard’s damages, such as development and<br />
implementation of a hazard mitigation plan, promoting/developing tornado saferooms,<br />
promoting/developing business continuity plans, rerouting transportation of HAZMAT<br />
materials, development/enforcement of building/fire seismic and flood codes and<br />
promoting flood buyouts or retrofit projects. Preparedness activities occur at the predisaster<br />
stage and addresses activities that develop response and recovery activities. These<br />
activities include an inventory of local resources, development/implementation of training<br />
citizens, design/conduct and evaluate responder exercises; development of resource lists<br />
and procurement resources; development of unified incident command agreements and<br />
development of mutual aid agreements.
A Regional Overview All-Hazard Mitigation Plan 3<br />
Mitigation Mitigation Mitigation Versus Versus Response Response and and Recovery<br />
Recovery<br />
Mitigation differs from response and recovery in that mitigation is designed to address<br />
long-term activities that reduce or eliminate a hazard and/or a hazard’s damages.<br />
Response and recovery activities occur at the disaster onset and during the post disaster<br />
time frames. Response activities include immediate actions that save lives, protect property<br />
and stabilize the situation and include alerting, securing and aiding the public, mobilizing<br />
emergency personnel and equipment, implementing plans and protective actions,<br />
assessment of the disaster, activating the incident command system and response and<br />
react to the disaster’s effects. Recovery activities occur after the disaster has occurred.<br />
They ensure that all systems return to normal. Such activities include implementation of<br />
damage assessment procedures, remove debris, develop after action reports, develop<br />
disaster assistance grants and rebuild better.<br />
Mitigation Mitigation Plan Plan Benefits Benefits<br />
Benefits<br />
Hazard mitigation planning offers many benefits. These include: saving lives and property,<br />
meeting the needs/policies of each specific jurisdiction, educates jurisdiction officials, public<br />
and partners, reduces vulnerability to future hazards, guide and speed post disaster<br />
recovery, enhance funding opportunities (HMGP, flood mitigation plan credit for FMA and<br />
CRS programs, NOAA/NWS StormReady credit, NRCS/DNR/COE/CDBG grants), promotes<br />
public participation, helps place mitigation project in the budget cycle, helps keep projects<br />
and spending on track, focuses jurisdiction disaster mitigation efforts, guides post disaster<br />
recovery, employs pro-active approach to minimize adverse effects of disasters, evaluates<br />
hazards and risks, and determines mitigation needs and capabilities, solutions, activities<br />
and projects.<br />
<strong>Jefferson</strong> <strong>County</strong> <strong>County</strong> Hazard Mitigation Goals, Goals, Objectives, Objectives, Strategies Strategies and and Coordination<br />
Coordination<br />
This section contains strategies that promote achievement of hazard mitigation, impact<br />
reduction and other hazard mitigation jurisdiction goals. This section will address<br />
mitigation strategies for hazards including flooding, tornado/severe windstorm, winter<br />
storm, earthquake/landslide, dam failure, drought, heat wave and wildfire.<br />
<strong>Jefferson</strong> <strong>County</strong>’s mitigation goals were derived from conferences with emergency<br />
managers, jurisdiction stakeholders as well as the key planning documents (i.e. Emergency<br />
Operations Plan, Official Master Plan, floodplain and building ordinances).<br />
The mitigation goals include the following:<br />
• Prevent the loss of life, minimize illness and injury<br />
• Preserve property, infrastructure, business, maintain jurisdiction integrity<br />
• Develop sustainable long-range growth strategy
4<br />
<strong>Jefferson</strong> <strong>County</strong> – Section 4<br />
This section is organized with general goals that are to be met by accomplishing the<br />
accompanying objectives, actions and subsequent strategies. An action matrix has been<br />
included for <strong>Jefferson</strong> <strong>County</strong>. It provides a reference for the jurisdiction during the<br />
implementation process. It identifies each goal, objective and strategy, identifies the<br />
hazards addressed by each strategy, type of strategy, target completion date, responsible<br />
party/organization for implementation, potential funding source, prioritization, as well as<br />
monitoring and evaluation indicators. Specific information on potential funding sources is<br />
in found in Section 3 of <strong>Jefferson</strong> <strong>County</strong> Hazard Mitigation Plan.<br />
The goals, objectives, actions and strategies identified here were developed through a<br />
multi-step process.<br />
• Hazard identification and analysis (identification of the hazards most prevalent of<br />
the area and following the area).<br />
• Area vulnerability assessment (identification the areas of the jurisdiction most<br />
vulnerable to the previously identified hazards).<br />
• Jurisdiction capability assessment questionnaire (assessment identified the steps the<br />
jurisdiction had taken toward reducing their vulnerability to hazards by reviewing<br />
the jurisdiction’s legal, institutional, political, technical and fiscal capability. This<br />
step identified the jurisdiction’s capability to implement future mitigation measures.)<br />
Community Emergency Management Directors and Locations are listed below:<br />
TABLE TABLE J51A J51A J51A LIST LIST OF OF EM EMD EM D AUTHORITIES<br />
Community Salutation Title First Name Last Name Address1 Phone<br />
<strong>Jefferson</strong> EMD Ms. Susan Green P.O. Box 100 (636) 797-<br />
5381<br />
Festus EMD Mr. Donald D. DeClue 711 <strong>West</strong><br />
Main<br />
(639) 937-<br />
6646<br />
Kimmswick EMD Mr. Jerome Selsor P.O. Box 27 (636) 464-<br />
7407<br />
Arnold EMD Mr. Robert Shockey 2101 Jeffco<br />
Blvd.<br />
(636) 296-<br />
3204<br />
Pevely EMD Lt. Terry Thomas P.O. Box 304 (636) 475-<br />
5301<br />
Herculaneum EMD Chief Christopher J. Pigg 1 Parkwood<br />
Ct.<br />
Crystal City EMD Mr. Karry Friedmeyer 130<br />
Mississippi<br />
Ave.<br />
(636) 475-<br />
4447<br />
(636) 931-<br />
2905
A Regional Overview All-Hazard Mitigation Plan 5<br />
Surveys<br />
Surveys<br />
Public input was sought during the planning process. Missouri has a requirement for an<br />
open meeting process called the Sunshine Law. Section 610.011 of the Sunshine Law<br />
states: "It is the public policy of this state that meetings, records, votes, actions, and<br />
deliberations of public governmental bodies be open to the public unless otherwise<br />
provided by law."<br />
Meetings, discussions and mitigation recommendations have been<br />
documented. The Hazard Mitigation Plan process called for 30-day public comment period<br />
to solicit comments for this plan. Public input was gathered through three workshops held<br />
in St. Louis, Franklin, <strong>Jefferson</strong>, and St. Louis <strong>County</strong>. There were also surveys sent to each<br />
municipality and school district in the area with around a 50% return rate. <strong>East</strong> <strong>West</strong><br />
<strong>Gateway</strong> <strong>Council</strong> of Governments will file the surveys and be available upon request.<br />
Municipalities and School Districts who did not respond were sent the letter with two<br />
follow up calls to retrieve the information.<br />
TABLE TABLE J51B J51B LOCAL<br />
LOCAL<br />
Old<br />
Old<br />
JURISDICTIONS<br />
JURISDICTIONS JURISDICTIONS Survey Survey Received<br />
Received Resolution<br />
Resolution<br />
City of Ballwin Yes Yes<br />
Yes<br />
City of Bellefontaine Neighbors Yes Yes<br />
Yes<br />
City of Black Jack Yes Yes<br />
Yes<br />
City of Breckenridge Hills Yes Yes<br />
Yes<br />
City of Chesterfield Yes Yes<br />
Yes<br />
City of Clarkson Valley Yes Yes<br />
Yes<br />
City of Clayton Yes Yes<br />
Yes<br />
City of Cool Valley Yes Yes<br />
Yes<br />
City of Country Club Hills Yes<br />
Yes<br />
City of Crestwood Yes Yes<br />
Yes<br />
City of Creve Coeur Yes Yes<br />
Yes<br />
City of Des Peres Yes Yes<br />
Yes<br />
City of DeSoto Yes Yes<br />
Yes<br />
City of Ellisville Yes<br />
Yes<br />
City of Eureka Yes<br />
Yes<br />
City of Glendale Yes<br />
Yes<br />
City of Hazelwood Yes Yes<br />
Yes<br />
City of Herculaneum Yes Yes<br />
Yes<br />
City of Ladue Yes<br />
Yes<br />
City of Lakeshire Yes<br />
Yes<br />
City of Moline Acres Yes<br />
Yes<br />
City of New Melle Yes<br />
Yes<br />
City of Olivette Yes Yes<br />
Yes<br />
City of Olympian Village Yes<br />
Yes<br />
City of Pagedale Yes Yes<br />
Yes<br />
City of Pevely Yes Yes Yes<br />
Yes<br />
City of Richmond Heights Yes<br />
Yes<br />
City of St. Charles Yes Yes<br />
Yes<br />
City of St. Clair Yes<br />
Yes
6<br />
TABLE TABLE J51B J51B LOCAL<br />
LOCAL<br />
Old<br />
Old<br />
JURISDICTIONS JURISDICTIONS Survey Survey Received<br />
Received Resolution<br />
Resolution<br />
City of St. Louis Yes Yes Yes<br />
Yes<br />
City of St. Peters Yes<br />
Yes<br />
City of Sullivan Yes Yes<br />
Yes<br />
City of Sunset Hills Yes Yes Yes<br />
Yes<br />
City of University City Yes Yes<br />
Yes<br />
City of Vinita Park Yes Yes Yes<br />
Yes<br />
City of Warson Woods Yes Yes<br />
Yes<br />
City of Washington Yes Yes<br />
Yes<br />
City of Webster Groves Yes Yes<br />
Yes<br />
City of Weldon Spring Yes Yes<br />
Yes<br />
Village of Champ Yes<br />
Yes<br />
Village of Hanley Hills Yes Yes<br />
Yes<br />
Village of Parkdale Yes<br />
Yes<br />
Village of Riverview Ye Yes Ye<br />
Yes<br />
Village of Twin Oaks Yes Yes<br />
Yes<br />
City of Lake Saint Louis Yes Yes<br />
Yes<br />
City of Bella Villa Yes Yes<br />
Yes<br />
City of Berkeley Yes<br />
Yes<br />
Village of Wilbur Park Yes<br />
Yes<br />
City of Cottleville Yes<br />
Yes<br />
City of Florissant Yes Yes<br />
Yes<br />
City of Jennings Yes Yes Yes<br />
Yes<br />
City of Kirkwood Yes<br />
Yes<br />
City of Manchester Yes Yes<br />
Yes<br />
City of Maplewood Yes Yes<br />
Yes<br />
City of Maryland Heights Yes<br />
Yes<br />
City of New Haven Yes<br />
Yes<br />
City of Oakland Yes Yes<br />
Yes<br />
City of Overland Yes<br />
Yes<br />
City of Portage Des Sioux Yes<br />
Yes<br />
City of St. George Yes<br />
Yes<br />
City of Union Yes Yes<br />
Yes<br />
City of Velda City Yes<br />
Yes<br />
City of Wentzville Yes Yes<br />
Yes<br />
City of Wildwood Yes Yes<br />
Yes<br />
TABLE TABLE J51C J51C SCHOOL SCHOOL SCHOOL DISTRICTS DISTRICTS Survey Survey Received<br />
Received<br />
Bayless School District Yes<br />
Yes<br />
Brentwood School District Yes Yes<br />
Yes<br />
DeSoto 73 School Dist. Yes<br />
Yes<br />
Dunklin R-V School Dist. Yes<br />
Yes<br />
Fort Zumwalt R-II School Dist. Yes<br />
Yes<br />
Francis Howell R-III Yes<br />
Yes<br />
Hillsboro R-3 School District Yes<br />
Yes<br />
<strong>Jefferson</strong> <strong>County</strong> – Section 4
A Regional Overview All-Hazard Mitigation Plan 7<br />
Survey Survey Results<br />
Results<br />
TABLE TABLE J51C J51C SCHOOL SCHOOL DISTRICTS DISTRICTS Survey Survey Received<br />
Received<br />
<strong>Jefferson</strong> <strong>County</strong> R-VII School Yes<br />
Yes<br />
Ladue School Dist. Yes<br />
Yes<br />
Mehlville R-IX School Dist. Yes<br />
Yes<br />
Northwest R-I School Dist. Yes<br />
Yes<br />
Parkway School District Yes<br />
Yes<br />
Rockwood R-VI School District Yes<br />
Yes<br />
Special School District of St. Louis Co Yes<br />
Yes<br />
St. Charles R-VI School Dist. Yes<br />
Yes<br />
St. Clair R-XIII School Yes<br />
Yes<br />
Strain-Japan R-16 School Dist. Yes<br />
Yes<br />
Sullivan School District Yes<br />
Yes<br />
University City School Dist. Yes<br />
Yes<br />
Washington School District Yes<br />
Yes<br />
*School Districts not included in 2004 All Hazard Mititgation Resolution Signoff<br />
Each county and one by school jurisdiction broke down the survey results.<br />
St. Louis <strong>County</strong> had the highest return rate of surveys at 46.9% or 45 of 96 municipalities.<br />
Most of the municipalities who were involved in Hazard Mitigation projects pertained to<br />
flooding or in adopting Emergency Management Programs. Most of the projects<br />
implemented since 2004 were mostly in response to CERT training and Emergency<br />
response service and not to mitigation project itself. Only 22% of county municipalities<br />
have ever applied for mitigation funding with only 6.7% successful in receiving funding.<br />
The county seems to not have concerns with the original mitigation plan and is adequate in<br />
educating the public on most natural disasters.<br />
St. Charles <strong>County</strong> had a low survey response rate of 33.3% as in comparison with St. Louis<br />
<strong>County</strong>. There were only 6 survey responses from the 18 municipalities, which may skew<br />
the percentages with such a low return rate. Every municipality was given a survey via mail<br />
and two phone calls to respond. 83.3% of municipalities in St. Charles <strong>County</strong> responded<br />
to not being involved in Mitigation Projects at the time. Only 16.7% responded to<br />
implementing projects since 2004 with two responses in floodplain management and levee<br />
construction near 370. Municipalities in St. Charles <strong>County</strong> have applied for mitigation<br />
funding in the past yet unsuccessful in every case (according to the surveys). None of the<br />
municipalities have concerns in mitigation and most believe their public output concerning<br />
mitigation preparedness is sufficient. In relation to repetitive loss properties in the St.<br />
Charles <strong>County</strong> these survey responses seem skewed. Some of the flood prone<br />
municipalities and/or unincorporated did not respond to the survey which may give<br />
reasoning in not having mitigation plan update concerns.
8<br />
<strong>Jefferson</strong> <strong>County</strong> – Section 4<br />
Franklin <strong>County</strong> had the lowest response rate at 25% or 2 surveys out of the 12<br />
municipalities. The one response yes to migration projects involved brush clearance from<br />
Busch Creek to prevent future flooding. One municipality wanted to apply for funding<br />
from the government for generators and feels this is vital need in mitigating the effects of<br />
power outages due to ice, wind, and flooding. Mitigation funding does not cover<br />
generators, which denied the request before put forth. Except for the generator request,<br />
all three municipalities did not see mitigation funding as concern. None of the<br />
municipalities have concerns in mitigation and most believe their public output concerning<br />
mitigation preparedness is sufficient.<br />
<strong>Jefferson</strong> <strong>County</strong> had a better response rate at 46.2% or 6 out of 13 municipalities.<br />
<strong>Jefferson</strong> <strong>County</strong> and Herculaneum both responded to hazard mitigation projects at of<br />
2008 for a spring flood damaging a section of a high school and some residential<br />
properties. Mitigation funding was applied for in the housing buyout yet is still pending<br />
and private insurance covered damages at the high school. Two of the six responses were<br />
concerned with mitigation funding and with the care of special needs persons yet believed<br />
public education and emergency preparedness was satisfactory.<br />
The School Districts, new to the All Hazard Mitigation Update, had a 35.3% response rate<br />
with 18 of 51 responding. Nearly ever school responded to having a basic emergency<br />
safety plan in the case of a natural and/or terrorist event. Only one spoke of building a<br />
section of the school in a floodplain. Most have implemented emergency plans but have<br />
not taken advantage of funding given for specific mitigation funding pertaining to this<br />
update. Though one of the schools have applied and received funding for the removal of<br />
mercury from their facility. School districts had the highest percentage at 44% of concern<br />
with the mitigation update. In being new to the update most do not have the knowledge<br />
of grants and funding options one would have for federal funding. The school districts feel<br />
they take care of their students yet half do have concerns in educating the public<br />
concerning mitigation procedures in the case of natural or man made disasters.<br />
Survey responses are located below with an asterisk explaining the number of surveys<br />
received in comparison with the percentages.<br />
TABLE TABLE J51D J51D<br />
SURVEY<br />
St. St. St. Louis Louis Louis <strong>County</strong> <strong>County</strong><br />
<strong>County</strong><br />
Jurisdiction<br />
Involved in<br />
Hazard Mit.<br />
Projects<br />
SURVEY RESULTS<br />
RESULTS<br />
Projects<br />
Implement-ed<br />
Since 2004<br />
Applied for<br />
Mitigation<br />
Funding Fed,<br />
State, Local<br />
Successful<br />
Funding<br />
Request<br />
Mitigation<br />
Concerns or<br />
Update Plan<br />
Jurisdiction's<br />
EOP Protect<br />
People w/<br />
Needs<br />
Educ. Public<br />
Concerning Mit.<br />
& Preparedness<br />
No No-N/A No<br />
N/A 71.1% 48.9% 77.8% 86.7% 60.0% 28.9% 26.7%<br />
Yes Yes<br />
28.9% 51.1% 22.2% 6.7% 40.0% 68.9% 71.1%<br />
Pending Pending<br />
6.7%<br />
*45 survey responses out of 96 municipalities (46.9%)
A Regional Overview All-Hazard Mitigation Plan 9<br />
St. St. Charles Charles <strong>County</strong> <strong>County</strong><br />
<strong>County</strong><br />
Jurisdiction<br />
Involved in<br />
Hazard Mit.<br />
Projects<br />
Projects<br />
Implemented<br />
Since 2004<br />
Applied for<br />
Mitigation<br />
Funding Fed,<br />
State, Local<br />
Successful<br />
Funding<br />
Request<br />
Mitigation<br />
Concerns or<br />
Update Plan<br />
Jurisdiction's<br />
EOP Protect<br />
People w/<br />
Needs<br />
Educ. Public<br />
Concerning Mit.<br />
& Preparedness<br />
No No-N/A No<br />
N/A 83.3% 83.3% 83.3% 83.3% 100.0% 66.7% 33.3%<br />
Yes Yes<br />
16.7% 16.7% 16.7% 0.0% 0.0% 33.3% 66.7%<br />
Pending Pending<br />
16.7%<br />
*6 survey responses out of 18 municipalities (33.3%)<br />
Franklin Franklin <strong>County</strong><br />
<strong>County</strong><br />
Jurisdiction<br />
Involved in<br />
Hazard Mit.<br />
Projects<br />
Projects<br />
Implemented<br />
Since 2004<br />
Applied for<br />
Mitigation<br />
Funding Fed,<br />
State, Local<br />
Successful<br />
Funding<br />
Request<br />
Mitigation<br />
Concerns or<br />
Update Plan<br />
Jurisdiction's<br />
EOP Protect<br />
People w/<br />
Needs<br />
Educ. Public<br />
Concerning Mit.<br />
& Preparedness<br />
No No-N/A No<br />
N/A 66.7% 66.7% 100.0% 100.0% 100.0% 33.3% 33.3%<br />
Yes Yes<br />
33.3% 33.3% 0.0% 0.0% 0.0% 66.7% 66.7%<br />
Pending Pending Pending<br />
0.0%<br />
*3 survey responses out of 12 municipalities (25%)<br />
<strong>Jefferson</strong> <strong>Jefferson</strong> <strong>County</strong><br />
<strong>County</strong><br />
Jurisdiction<br />
Involved in<br />
Hazard Mit.<br />
Projects<br />
Projects<br />
Implemented<br />
Since 2004<br />
Applied for<br />
Mitigation<br />
Funding Fed,<br />
State, Local<br />
Successful<br />
Funding<br />
Request<br />
Mitigation<br />
Concerns or<br />
Update Plan<br />
Jurisdiction's<br />
EOP Protect<br />
People w/<br />
Needs<br />
Educ. Public<br />
Concerning Mit.<br />
& Preparedness<br />
No No-N/A No<br />
N/A 50.0% 50.0% 66.7% 83.3% 66.7% 50.0% 33.3%<br />
Yes Yes<br />
50.0% 50.0% 33.3% 0.0% 33.3% 50.0% 66.7%<br />
TABLE TABLE J51E J51E 2009 2009 All All Hazard Hazard Mitigation Mitigation Plan Plan Update Update Local Local Government Government Survey Surve<br />
Jurisdiction Jurisdiction Involved Involved in<br />
in Projects Projects Implemented<br />
Implemented<br />
Applied Applied for for Mitigation<br />
Mitigation<br />
Funding Funding Fed, Fed, State,<br />
State,<br />
Municipality<br />
Municipality<br />
City of Arnold<br />
City of Byrnes Mill<br />
Hazard Hazard Mit. Mit. Projects<br />
Projects Since Since 2004<br />
2004<br />
Local<br />
Local<br />
Village of Cedar Hill Lakes<br />
City of Crystal City<br />
City of DeSoto No. No. No.<br />
City of Olympian Village<br />
City of Festus<br />
No. No. No.<br />
City of Herculaneum Storm water at Barclay Emergency warning Sewer/Manhole/Flood<br />
street that is flooding sirens have been Plain Mitigation<br />
and damaging the ordered. Waiting for<br />
high school locker delivery and<br />
room and track.<br />
Emergency notification<br />
system<br />
installation.<br />
Village of Parkdale No. No. No.
10<br />
City of Hillsboro<br />
<strong>Jefferson</strong> <strong>County</strong> Yes. Resulting from<br />
2008 spring flood we<br />
are working in<br />
residential home buyout<br />
programs.<br />
Property Buy-outs<br />
under Mitigation<br />
Program.<br />
Scotsdale<br />
City of Pevely Yes. Adopting more<br />
stringent building<br />
codes to meet<br />
earthquake and high<br />
wind standards.<br />
Adding more<br />
emergency sirens.<br />
<strong>Jefferson</strong> <strong>County</strong> – Section 4<br />
Fed/State Programs for<br />
buy-outs.<br />
TABLE TABLE JJ51F<br />
J J51F<br />
51F 2009 2009 All All Hazard Hazard Mitigation Mitigation Plan Update Local Local Local Government Government Survey<br />
Jurisdiction's Jurisdiction's Jurisdiction's EOP EOP<br />
EOP Educ. Educ. Educ. Public<br />
Public<br />
Successful Successful Funding Funding<br />
Funding Mitigation Mitigation Concerns Concerns or<br />
or Protect Protect People People w/ w/<br />
w/ Concerning Concerning Mit. Mit. &<br />
&<br />
Municipality<br />
Municipality<br />
City of Arnold<br />
City of Byrnes Mill<br />
Village of Cedar Hill Lakes<br />
City of Crystal City<br />
Request<br />
Request<br />
Update Update Plan<br />
Plan<br />
Needs<br />
Needs<br />
Preparedness<br />
Preparedness<br />
City of DeSoto N/A. No. Yes. Through newspaper,<br />
newsletter, activity<br />
participation<br />
City of Olympian Village No. No. No. No.<br />
City of Festus<br />
City of Herculaneum No. Storm Water Project-<br />
At the high school<br />
adding an additional<br />
18" storm drain, a<br />
double curb catch<br />
basin and repairing<br />
previous detention<br />
ponds.<br />
No.<br />
Yes. media and quarterly<br />
news letter<br />
Village of Parkdale No. No. No. No.<br />
City of Hillsboro<br />
<strong>Jefferson</strong> <strong>County</strong> For 2008 funding<br />
request still pending. I<br />
do not know about<br />
previous years.<br />
Yes. Yes. Training for core<br />
services, education for<br />
public- workshops and<br />
media releases.<br />
Scotsdale<br />
City of Pevely No. No. No. Through newspaper,<br />
newsletter, activity<br />
participation.
A Regional Overview All-Hazard Mitigation Plan 11<br />
Evaluation<br />
Evaluation<br />
Several mitigation actions were proposed and discussed by all of the participants at the<br />
mitigation workshops for inclusion into the Hazard Mitigation Plan. The following table<br />
provides an analysis of the <strong>County</strong>’s proposed mitigation actions. Each action was<br />
reviewed according to the STAPLEE criteria. STAPLEE criteria include: Social, Technical,<br />
Administrative, Political, Legal, Economic and Environmental considerations. The asterisks<br />
in the columns on the right indicate the action would have a positive effect.<br />
TABLE TABLE J52 J52 JEFFERSON JEFFERSON COUNTY COUNTY PROPOSED PROPOSED MITIGATION MITIGATION ACTION<br />
ACTION<br />
EVALUATION<br />
EVALUATION<br />
Proposed Proposed Action Action<br />
S T A P L E E<br />
Objective Objective 1.1: 1.1: Raise Raise public public awareness.<br />
awareness.<br />
Encourage development of public outreach programs * * * * * *<br />
Encourage organizations to develop hazard measures for<br />
employees/visitors<br />
* * * * * * *<br />
Encourage development of emergency management<br />
curriculum in schools.<br />
* * * * * * *<br />
Encourage agencies to identify, develop outreach program<br />
for special needs population and hazard mitigation<br />
measures<br />
* * * * * * *<br />
Encourage education and construction of saferooms in<br />
mobile home parks<br />
* * * * * * *<br />
Objective Objective 11.2:<br />
1 .2: Establish Establish Establish warning warning systems systems for for all all hazards.<br />
hazards.<br />
Encourage jurisdictions, LEPC, EMA to determine, report<br />
warning system data gaps for all hazards.<br />
* * * * * * *<br />
Encourage development of evacuation plan for all disasters * * * * *<br />
Encourage placement of flood warning signs * * * * * * *<br />
Encourage special needs population to obtain NOAA radios, *<br />
saferooms<br />
* * * * * *<br />
Objective Objective 1.3: 1.3: Decrease Decrease occurrence occurrence and and impacts impacts of of flooding.<br />
flooding.<br />
Encourage participation in NFIP, CRS * * * * * * *<br />
Encourage residents, jurisdictions, developers to protect<br />
rivers and corridors<br />
* * * * * * *<br />
Encourage residents, etc. to design, build stormwater<br />
systems that replicate water movement<br />
* * * * *<br />
Encourage residents, stakeholders to participate in<br />
* * * * * *<br />
watershed plans to prevent flooding.<br />
Encourage jurisdictions to identify, purchase remaining<br />
repetitive flood buyout properties.<br />
* * * * *<br />
Revise flood fighting plans as needed. * * * * * * *<br />
Encourage jurisdictions to strengthen floodplain<br />
regulations.<br />
Objective Objective 2.1: 2.1: Reduce Reduce or or prevent prevent impacts impacts from from hazards hazards on<br />
on<br />
private private private properties.<br />
properties.<br />
* * * * * * *<br />
Encourage education of residents on property protection<br />
from hazards (checklists, preparedness kits).<br />
* * * * * *<br />
Jurisdiction planning departments encouraged to use<br />
hazard maps with developers, home buyers, construction<br />
and engineers.<br />
* * * * * * *
12<br />
<strong>Jefferson</strong> <strong>County</strong> – Section 4<br />
TABLE TABLE J52 J52 JEFFERSON JEFFERSON COUNTY COUNTY PROPOSED PROPOSED MITIGATION MITIGATION ACTION<br />
ACTION<br />
EVALUATION<br />
EVALUATION<br />
Proposed Proposed Action Action<br />
S T A P L E E<br />
Encourage utilities, communications, developers to<br />
construct underground lines<br />
Objective Objective 2.2: 2.2: Reduced Reduced or or prevent prevent impacts impacts from from hazards hazards on on<br />
public public properties.<br />
properties.<br />
* * * * * * *<br />
Encourage jurisdictions to adopt, enforce most current * * * * * *<br />
codes, ordinances for all hazards.<br />
Encourage those responsible for special needs population to<br />
take FEMA structural safety classes for building integrity<br />
* * * * * *<br />
Encourage emergency response agencies and districts to<br />
relocate facilities away from geographically redundant<br />
areas.<br />
* * * * * * *<br />
Encourage jurisdictions to adopt open burning control<br />
ordinances.<br />
* * * * * * *<br />
Encourage jurisdiction agencies to coordinate<br />
communications plans.<br />
* * * *<br />
Encourage jurisdictions, state, federal agencies to review,<br />
prioritize emergency routes, retrofit infrastructure used for<br />
hazard events<br />
* * * * * * *<br />
Encourage upgrade of lifeline facilities to meet most current<br />
building seismic codes<br />
Objective Objective 3.1: 3.1: Develop Develop collaborative collaborative hazard hazard mitigation<br />
mitigation<br />
efforts efforts across across jurisdictional jurisdictional boundaries.<br />
boundaries.<br />
boundaries.<br />
* * * * * *<br />
Encourage jurisdictions to implement Hazard Mitigation<br />
Plan<br />
* * * * * * *<br />
Encourage partnering with local, county, region, state<br />
governments<br />
* * * *<br />
Encourage coordination between levee districts to protect<br />
those living up and downstream.<br />
* * * * * * *<br />
Highly recommend pertinent jurisdictions conduct proper<br />
record keeping for all documents related to disasters.<br />
Objective Objective 3.2: 3.2: Reduce Reduce impacts impacts and and promote promote protection protection of<br />
natural natural natural resources.<br />
resources.<br />
* * * * *<br />
Encourage development of jurisdiction land use plans,<br />
zoning, regulations to protect downstream residents from<br />
dam failure.<br />
* * * * * * *<br />
Encourage jurisdiction educate residents on proper disposal<br />
of yard, commercial and household waste.<br />
* * * * *<br />
Encourage jurisdictions, residents to maintain streams,<br />
corridors.<br />
* * * * * * *<br />
Encourage jurisdictions assist MDNR in full implementation<br />
of dam safety program.<br />
* * * * * * *<br />
Encourage jurisdictions to develop greenways for flood<br />
protection that parallels streams, rivers.<br />
* * * * * * *<br />
Encourage jurisdictions to become familiar and comply with<br />
drought, water restrictions.<br />
* * * * * *<br />
Encourage jurisdictions, stakeholders to work together to<br />
protect watersheds, encourage stormwater practices for<br />
flood protection<br />
* * * * * * *
A Regional Overview All-Hazard Mitigation Plan 13<br />
Workshop participants discussed suggestions, added suggestions and deleted some for<br />
various actions by using the STAPLEE evaluation. The following actions were eliminated for<br />
various reasons as shown on the following list:<br />
• A comment was made pertaining to coordination between local stakeholders and<br />
various state agencies on design and construction of roadways that were being<br />
rebuilt from severe flooding. The local stakeholders felt that the state agencies were<br />
not taking their suggestions and expertise into advisement.<br />
• A comment was made regarding the need for specialty equipment for response and<br />
recovery activities. This was discarded as not being directly relevant to hazard<br />
mitigation planning.<br />
The final mitigation recommendations include the six categories of mitigation: prevention,<br />
property protection, natural resource protection, emergency services, structural projects<br />
and public information. Recommendations include, but are not limited to those listed<br />
below.<br />
GOAL GOAL #1: #1: Prevent Prevent the the loss loss of of life; life; minimize minimize minimize illness illness and and injury injury injury on on a a local, local, countywide countywide and<br />
and<br />
regional regional basis.<br />
basis.<br />
Objectives:<br />
Objectives:<br />
1. Raise public awareness concerning hazards, including measures that can be taken to<br />
promote mitigation and increase disaster preparedness, response and recovery<br />
capabilities.<br />
Actions Actions<br />
Actions<br />
a. Develop public outreach programs that ensure all members of the jurisdiction<br />
have access to information on hazards, consequences, and steps to be taken<br />
to reduce risk at home and work.<br />
b. Businesses, governments and special districts to develop and distribute<br />
pertinent hazard mitigation measures for employees and visitors<br />
c. Develop emergency management curriculum in public and private schools,<br />
colleges and universities to develop hazard mitigation measures (for<br />
incorporation into emergency plans) for schools; post plans on school<br />
internet site.<br />
d. Appropriate jurisdiction agencies to identify all special needs populations in<br />
the jurisdiction, and develop a special outreach program for those at risk,<br />
and coordinate hazard mitigation plans (including backup power,<br />
evacuation, and warning plans for all hazards).<br />
e. Educate and construction of saferooms in all mobile<br />
home parks.
14<br />
<strong>Jefferson</strong> <strong>County</strong> – Section 4<br />
2. Establish warning systems for all disasters for businesses, schools, special districts<br />
and special needs populations and governments.<br />
Actions<br />
Actions<br />
a. Jurisdictions to work with local emergency planning committee and<br />
emergency management agency to determine and report on warning system<br />
gaps for all hazards, including dam failures, tornadoes and flash floods;<br />
make recommendations and act on them.<br />
b. Develop evacuation plan for all disasters.<br />
c. Place flash flood warning signs.<br />
d. Special needs population to develop hazard measures to include distribution<br />
of NOAA weather radios; encourage placement of saferooms (in strategic<br />
locations).<br />
3. Decrease occurrence and impact of flooding.<br />
Actions<br />
Actions<br />
a. Appropriate jurisdictions to participate in National Flood Insurance Program,<br />
CRS, Hazard Mitigation Plan.<br />
b. Residents, jurisdictions and developers to protect and maintain natural river<br />
and stream channels and corridors.<br />
c. Residents, jurisdictions and developers to utilize, design and/or build systems<br />
to detain stormwater in ways to promote infiltration and replicate natural<br />
movement of water.<br />
d. Local governments and stakeholders to participate in watershed planning<br />
that protect streams against flooding.<br />
e. Jurisdictions to identify remaining repetitive flood loss properties for buyout<br />
purposes; prioritize and implement buyouts.<br />
f. Review and revise flood-fighting plans as appropriate.<br />
g. Jurisdictions to strengthen floodplain regulations.<br />
GOAL GOAL # # 2: 2: Preserve Preserve Preserve and and maintain maintain property, property, infrastructure, infrastructure, infrastructure, businesses, businesses, and and jurisdiction<br />
jurisdiction<br />
vitality vitality on on on local, local, countywide countywide and and regional regional regional basis. basis.<br />
basis.<br />
Objecti Objectives: Objecti ves:<br />
1. Reduce or prevent impacts from hazards on private properties<br />
Actions<br />
Actions<br />
a. Educate residents, businesses and jurisdictions on hazards by circulating<br />
brochures, checklist and preparedness kits to prepare structures for disasters<br />
(such as tiedowns, gas shutoff valves and other utilities).
A Regional Overview All-Hazard Mitigation Plan 15<br />
b. Jurisdiction planning departments to work with home builders associations,<br />
realtors’ associations, developers; encourage use of hazard maps by public<br />
for purchasing, construction, improvement of properties.<br />
c. Utilities and communications businesses and developers to<br />
consider installation of underground electric and communications lines.<br />
2. Reduce or prevent impacts from hazards on public properties.<br />
Actions<br />
Actions<br />
a. Jurisdictions adopting and enforcing most current<br />
codes, ordinances, policies for all hazards, especially floods, earthquakes and<br />
tornadoes.<br />
b. Those who are responsible for special needs populations to take<br />
FEMA structural safety training classes for building integrity.<br />
c. Emergency response agencies and districts to locate facilities<br />
away from all geographically redundant hazard areas<br />
d. Jurisdictions to adopt open burning control ordinances<br />
e. Utilize municipal leagues as nexus for coordination<br />
f. Appropriate jurisdiction agencies to coordinate communications plan for<br />
hazard events.<br />
g. Appropriate jurisdictions, state and federal agencies to review, prioritize<br />
emergency route and retrofit infrastructure (roads, bridges, buildings,<br />
emergency medical facilities) that will be utilized for disasters.<br />
h. Upgrade lifeline facilities to meet current building code seismic standards<br />
GOAL GOAL #3: #3: Encourage Encourage growth growth that that is is compatible compatible with with hazard hazard mitigation mitigation strategies<br />
strategies<br />
identified identified in in this this plan plan on on on a a local, local, countywide countywide and and regional regional basis.<br />
basis.<br />
Objectives:<br />
Objectives:<br />
1. Develop collaborative hazard mitigation efforts across jurisdictional boundaries.<br />
Actions Actions<br />
Actions<br />
a. Jurisdictions and local emergency management agencies to implement the<br />
All-Hazard Mitigation programs.<br />
b. Partner with local, county and region-wide governments and encourage<br />
legislation to collaborate and promote best management practices in local,<br />
regional and state planning.<br />
c. Coordinate levee districts in order to protect upstream and downstream<br />
interests.<br />
d. Highly recommend participating jurisdictions maintain proper recordkeeping<br />
of pertinent documents related to disasters.
16<br />
2. Reduce impacts and promote protection to natural resources.<br />
Actions Actions<br />
Actions<br />
<strong>Jefferson</strong> <strong>County</strong> – Section 4<br />
a. Develop land use plans, zoning and regulations to protect downstream<br />
residents from impacts of storm water as well as levee and dam failure.<br />
b. Jurisdictions to educate residents on proper disposal of yard, commercial and<br />
household waste (not in sewer system or streams).<br />
c. Jurisdictions, residents to clean up creeks and streams.<br />
d. Jurisdictions to assist MDNR in full implementation of dam safety program.<br />
e. Jurisdictions to develop greenways for flood protection that parallel streams,<br />
rivers<br />
f. Jurisdictions to become familiar and comply with drought/water<br />
restrictions<br />
g. Jurisdictions and local stakeholders to work together to protect watersheds<br />
and encourage sound stormwater practices for flood protection.<br />
Strategic Strategic Implementation<br />
Implementation<br />
Implementation<br />
The State of Missouri SEMA requires that the Hazard Mitigation Plan contain a description<br />
of the jurisdiction’s mitigation strategy for reducing disaster damages and implementing<br />
mitigation activities.<br />
Adoption of the plan demonstrates <strong>Jefferson</strong> <strong>County</strong>’s commitment to working toward<br />
fulfilling the mitigation goals and objectives outlines in the plan. This also legitimizes the<br />
plan and authorizes the various responsible agencies to incorporate mitigation as a part of<br />
their job duties. Adoption fulfills requirements of several Federal programs (CRS, FMS) that<br />
require local governments to adopt mitigation strategy. Adoption mechanisms provide a<br />
better opportunity for the mitigation planning activities to be ingrained into regular<br />
government operations. <strong>Jefferson</strong> <strong>County</strong>’s Hazard Mitigation Plan will be implemented by<br />
various departments and agencies within <strong>Jefferson</strong> <strong>County</strong>. The implementation process<br />
will include coordination among the <strong>County</strong> departments and coordinated with other<br />
relevant agencies or districts though <strong>Jefferson</strong> <strong>County</strong>’s Emergency Management Agency.<br />
<strong>Jefferson</strong> <strong>County</strong> will set up a system to monitor progress and evaluate the effectiveness of<br />
implemented actions with revisions as needed. Every five years, the county will review the<br />
plan and include any needed updates. The updated plan will be submitted for<br />
SEMA/FEMA approval. Copies of the signed adoption resolutions are included in the<br />
Regional Overview. The plan will be reviewed for any updates following any major<br />
disasters that occur within the county.
A Regional Overview All-Hazard Mitigation Plan 17<br />
Cities Cities with with Higher Higher Exposure Exposure to to <strong>County</strong> <strong>County</strong> Hazards<br />
Hazards<br />
The cities of Arnold, Byrnes Mill, Cedar Hill Lakes, DeSoto, Festus, Herculaneum,<br />
Kimmswick, Pevely, Crystal City, and Scotsdale are the incorporated areas within <strong>Jefferson</strong><br />
<strong>County</strong> that are found to have a significantly higher exposure to those hazards affecting<br />
the <strong>County</strong>. The <strong>County</strong>’s goals, objectives, and actions encompass those needed to deal<br />
with the issues found in these cities; especially targeting repetitive flood loss properties for<br />
buyout. It is recommended that <strong>Jefferson</strong> <strong>County</strong> work with these cities to incorporate<br />
county actions into these jurisdictions specific hazard mitigation concerns.<br />
Analysis Analysis and and Prioritization Prioritization of of Mitigation Mitigation Actions Actions<br />
Actions<br />
<strong>Jefferson</strong> <strong>County</strong>’s mitigation actions promote and/or support the development of local<br />
hazard mitigation plans, projects and activities. Examples of actions include instituting<br />
watershed plans, encouraging adoption of the most current codes and ordinances,<br />
development of flood fighting plans, prioritizing flood buyout properties.<br />
The following matrix provides an analysis and prioritization of the county’s hazard<br />
mitigation goals, objectives and actions. The matrix distinguishes between the identified<br />
hazards and the county’s mitigation actions. It is recommended that the <strong>County</strong> will place<br />
an emphasis on cost-benefit analysis for further mitigation project prioritization purposes<br />
when the budget analyses are conducted. The matrix also identifies those agencies<br />
responsible for implementation along with the respective funding sources. It is<br />
recommended that actions be coordinated, where applicable with Missouri’s mitigation<br />
actions.<br />
Criteria for prioritization are:<br />
Historically, <strong>Jefferson</strong> <strong>County</strong> has been most affected by flooding hazards followed in<br />
severity by tornado/thunderstorm, severe winter storm, heat wave, and drought. The risk<br />
of earthquake, dam failure and wildfire must be addressed, even though the <strong>County</strong> has<br />
not yet experienced these hazards.<br />
Some actions may be high priorities, but will require a lengthy planning process. These<br />
types of actions will be designated as a “high priority” with a future target date for<br />
completion.<br />
Certain hazards can impact incorporated areas more than the <strong>County</strong> as a whole. The<br />
incorporated areas that could be specifically affected are identified as follows:<br />
1= Arnold<br />
2=Byrnes Mill<br />
3=Cedar Hill Lakes<br />
4=Crystal City<br />
5=DeSoto
18<br />
6=Festus 11=Hillsboro<br />
7=Herculaneum 12=Olympian Village<br />
8=Kimmswick 13=Parksdale<br />
9=Pevely 14= All communities<br />
10=Scotsdale<br />
<strong>Jefferson</strong> <strong>County</strong> – Section 4<br />
<strong>Jefferson</strong> <strong>County</strong> involvement is assumed for all of the items on the following Action<br />
Matrix.<br />
Monitoring, Monitoring, Monitoring, Evaluating Evaluating Evaluating and and and Updating Updating Updating th the th the<br />
e Plan Plan<br />
Plan<br />
The narrative below describes the process to follow for monitoring, evaluating,<br />
maintaining, updating and obtaining SEMA/FEMA’s approval of the Hazard Mitigation Plan<br />
every five years and on an as needed basis.<br />
In the course of their duties, emergency managers, in collaboration with their respective<br />
Emergency Management Committee should meet annually and on an informal and routine<br />
basis to focus on monitoring and evaluating as well as updating the Hazard Mitigation<br />
Plan. In addition, a regional meeting could also be organized by Emergency Managers on<br />
an annual basis to provide cross-jurisdictional information sharing federal and state<br />
updates and opportunities for project development, implementation, and funding with<br />
jurisdictions and stakeholders. It is recommended that the Emergency Management<br />
Committee include <strong>County</strong> Commissioners, municipal officials, fire, law enforcement,<br />
emergency medical and public health officials for various objectives of this plan. It is<br />
recommended that the <strong>County</strong> public notice these meetings and encourage the public to<br />
participate.<br />
It is recommended that the committee review each goal and objective to determine the<br />
relevance to local, regional, statewide and federal disaster situations and to ensure that<br />
they are addressing current and expected conditions. The committee should review the risk<br />
assessment portion of the plan to determine if this information should be updated. The<br />
parties responsible for the various implementation actions should report on the status of<br />
their projects and will include which implementation processes worked well, difficulties<br />
encountered, coordination efforts and which strategies should be revised.<br />
The Emergency Management Committee should take three months to update the plan<br />
before submitting it to the State Hazard Mitigation Officer. If no changes are necessary,<br />
the State Hazard Mitigation Officer should be given a justification for this determination.<br />
Copies of the plan should be catalogued and kept on hand at the main <strong>Jefferson</strong> <strong>County</strong><br />
library branch. In addition, a copy of the plan will be available on the <strong>East</strong>-<strong>West</strong> <strong>Gateway</strong><br />
<strong>Council</strong> of Governments website (www.ewgateway.org), the Office of Emergency<br />
Management and at the <strong>Jefferson</strong> <strong>County</strong> Clerk’s Office. The existence and location of<br />
these copies should be publicized by the daily local newspaper, and listed on the county<br />
website. Contained in the plan is the address and telephone number of the Office of
A Regional Overview All-Hazard Mitigation Plan 19<br />
Emergency Management responsible for keeping track of public comments on the plan.<br />
Copies of the plan and proposed changes will be posted on the county website. The site<br />
will contain an email address and telephone number to which people can direct their<br />
comments. A link to this site will be provided on the <strong>East</strong>-<strong>West</strong> <strong>Gateway</strong> <strong>Council</strong> of<br />
Governments website.
20<br />
WORKSHEET<br />
WORKSHEET<br />
<strong>Jefferson</strong> <strong>County</strong> – Section 4<br />
JEFFERSON JEFFERSON COUNTY COUNTY FIVE FIVE-YEAR FIVE YEAR ACTION MATRIX WORKSHEET
A Regional Overview All-Hazard Mitigation Plan 21<br />
Community Community<br />
Action<br />
Action<br />
Type Type Type of of<br />
of<br />
Strategy<br />
Strategy<br />
<strong>Jefferson</strong> <strong>Jefferson</strong> <strong>County</strong>'s <strong>County</strong>'s Proposed Proposed Five Five-Year Five Year Action Matrix<br />
New,<br />
New, Estimated<br />
Estimated<br />
Revision/Ongoing<br />
Revision/Ongoing Ta Target Ta rget Date<br />
Probable Probable Lead<br />
Lead<br />
Organizer<br />
Organizer<br />
Goal Goal #1: #1: Prevent Prevent loss loss of of life, life, minimize minimize illness, illness, injury injury on on local, local,<br />
countywide and regional basis.<br />
1.1 1.1 Raise Raise Raise public public awareness.<br />
awareness.<br />
14<br />
14<br />
14<br />
14<br />
14<br />
Develop public<br />
outreach program<br />
Encourage<br />
development of<br />
hazard measures for<br />
visitors, employees<br />
Develop emergency<br />
management<br />
curriculum in<br />
schools<br />
Agencies to identify<br />
and develop<br />
jurisdiction outreach<br />
plan for special<br />
needs population<br />
Public<br />
Information New & Ongoing<br />
Public<br />
Information New & Ongoing<br />
Public<br />
Information New & Ongoing<br />
Public<br />
Information New<br />
Educate, need,<br />
construct saferooms<br />
in mobile home Public<br />
parks<br />
Information New<br />
1.2 1.2 Establish Establish warning warning systems systems for for all all hazards.<br />
hazards.<br />
14<br />
Jurisdictions to<br />
work with LEPC,<br />
EMA to determine<br />
and report on<br />
warning system<br />
data gaps including<br />
dam failure,<br />
Emergency<br />
Services New<br />
2009 &<br />
Continuing<br />
<strong>County</strong><br />
Information/<br />
Planning Officer<br />
2009 &<br />
Continuing <strong>County</strong> EMA<br />
2009 &<br />
Continuing Schools<br />
2009 &<br />
Continuing<br />
2009 &<br />
Continuing<br />
<strong>County</strong><br />
Information/<br />
Planning Officer<br />
American Red<br />
Cross<br />
2009 &<br />
Annually <strong>County</strong> EMA<br />
Potential<br />
Potential<br />
Funding<br />
Funding<br />
Sources Sources Priority Priority Evaluation<br />
Evaluation<br />
fed, state,<br />
local govt.<br />
program<br />
funds High<br />
internal<br />
funds Low<br />
fed &<br />
state govt.<br />
program<br />
funds/<br />
private<br />
funding High<br />
fed, state,<br />
local govt.<br />
program<br />
funds High<br />
govt.<br />
program<br />
funds/<br />
private<br />
funding High<br />
fed, state,<br />
local govt.<br />
program<br />
funds High<br />
Identified Identified Natural Natural Hazards<br />
Hazards<br />
Tornado<br />
Tornado<br />
Flood<br />
Flood<br />
Winter Winter<br />
Drought<br />
Drought<br />
Heat Heat Wave Wave<br />
Earthquake<br />
Earthquake<br />
Dam Dam Failure Failure<br />
Wildfire<br />
Wildfire<br />
Program<br />
completed and<br />
distributed x x x x x x x x<br />
Program<br />
completed and<br />
distributed x x x x x x<br />
Curriculum<br />
completed and<br />
implemented x x x x x x x<br />
Program<br />
completed,<br />
distributed and<br />
implemented x x x x x x x<br />
Program<br />
completed,<br />
distributed and<br />
implemented x<br />
Program<br />
completed,<br />
distributed and<br />
implemented x x x x x x x x
22<br />
14<br />
tornadoes, flash<br />
floods<br />
Encourage<br />
development of<br />
evacuation plan for<br />
all natural disasters<br />
Encourage<br />
1,2,3,4,5,6,7,8,9, placement of flood<br />
10,11,12,13 warning signs<br />
Special needs<br />
population obtain<br />
NOAA weather<br />
radios, saferooms<br />
(in strategic<br />
14 locations)<br />
1.3 1.3 Decrease Decrease occurrence occurrence occurrence and and impacts impacts of of flooding.<br />
flooding.<br />
Emergency<br />
Services New & Ongoing<br />
2009 &<br />
Continuing <strong>County</strong> EMA<br />
Emergency<br />
Services Ongoing Continuing <strong>County</strong> EMA<br />
Emergency<br />
Services New & Ongoing<br />
1,2,3,4,5,6,7,8,9, Participate in NFIP,<br />
10,11,12,13 CRS Prevention Ongoing<br />
14<br />
1,2,3,4,5,6,7,8,9,<br />
10,11,12,13<br />
Encourage<br />
residents,<br />
jurisdictions,<br />
developers to<br />
protect, maintain<br />
rivers, corridors Prevention<br />
Residents,<br />
jurisdictions,<br />
developers to use,<br />
design, build<br />
New and<br />
ongoing<br />
systems to detain<br />
stormwater that<br />
replicates natural Structural New & Ongoing<br />
2009 &<br />
Continuing <strong>County</strong> EMA<br />
2009 &<br />
Continuing<br />
2009 &<br />
Continuing<br />
2009 &<br />
Continuing<br />
<strong>County</strong><br />
Floodplain<br />
manager<br />
Watershed<br />
Advisory<br />
Committee<br />
University<br />
Engineering<br />
Department<br />
govt.<br />
program<br />
funds Medium<br />
<strong>Jefferson</strong> <strong>County</strong> – Section 4<br />
Program<br />
completed,<br />
distributed and<br />
implemented x x x x x x x x<br />
fed, state,<br />
local govt.<br />
program<br />
funds Medium Signs placed x x<br />
govt.<br />
program<br />
funds/<br />
private<br />
funding High<br />
Program<br />
completed,<br />
distributed and<br />
implemented x x x x<br />
internal<br />
funds High Status Improved x x<br />
internal<br />
funds Medium Status Improved x x<br />
govt.<br />
program<br />
funds/<br />
private<br />
funding High<br />
Design<br />
Plans/Construction<br />
of Structures x x
A Regional Overview All-Hazard Mitigation Plan 23<br />
1,2,3,4,5,6,7,8,9,<br />
10,11,12,13<br />
1,2,3,4,5,6,7,8,9,<br />
10,11,12,13<br />
1,2,3,4,5,6,7,8,9,<br />
10,11,12,13<br />
1,2,3,4,5,6,7,8,9,<br />
10,11,12,13<br />
water movement<br />
Jurisdictions,<br />
stakeholders to<br />
participate in<br />
watershed planning<br />
to protect against<br />
floods Prevention New & Ongoing<br />
Jurisdictions to<br />
identify, purchase<br />
remaining repetitive<br />
flood loss buyout<br />
properties<br />
Revise floodfighting<br />
plans as<br />
needed<br />
Jurisdictions to<br />
strengthen<br />
floodplain<br />
Property<br />
Protection Ongoing<br />
Emergency<br />
Services Ongoing<br />
regulations to<br />
reduce impacts<br />
from flooding Prevention Ongoing<br />
2009 &<br />
Continuing<br />
2009 &<br />
Continuing<br />
2009 &<br />
Annually<br />
2009 &<br />
Continuing<br />
Goal Goal #2: #2: Preserve Preserve and and maintain maintain property, property, infrastructure, infrastructure, businesses, businesses, jurisdiction jurisdiction vitality.<br />
Watershed<br />
Advisory<br />
Committee<br />
Floodplain<br />
manager<br />
<strong>County</strong><br />
Floodplain<br />
manager<br />
<strong>County</strong><br />
Commission<br />
2.1 2.1 2.1 Reduce Reduce Reduce or or prevent prevent impacts impacts impacts from from hazards hazards on on private private properties.<br />
properties.<br />
Educate residents<br />
on property<br />
protection from<br />
hazards (checklists, Public<br />
14 preparedness kits) Information Ongoing Ongoing <strong>County</strong> EMA<br />
govt.<br />
program<br />
funds/<br />
private<br />
funding High<br />
govt.<br />
program<br />
funds High<br />
fed, state,<br />
local govt.<br />
program<br />
funds High<br />
fed, state,<br />
local govt.<br />
program<br />
funds High<br />
Attendance<br />
Records x x<br />
Repetitive Loss<br />
Properties<br />
Mitigated x x<br />
Updated Plans<br />
Revised and<br />
Adopted x x<br />
Revised<br />
Regulations in<br />
Place x x<br />
fed, state,<br />
local govt.<br />
program<br />
funds High Status Improved x x x x x x x x
24<br />
14<br />
14<br />
Jurisdiction<br />
planning<br />
department to use<br />
hazard maps with<br />
developers, home<br />
buyers,<br />
construction,<br />
engineers<br />
Utilities,<br />
communications,<br />
developers to<br />
installation of<br />
Prevention New<br />
underground lines Prevention New<br />
2.2 2.2 Reduce Reduce or or prevent prevent impacts impacts from from hazards hazards on on public public properties.<br />
properties.<br />
Jurisdictions to<br />
adopt, enforce most<br />
current codes,<br />
ordinances for all<br />
14 hazards<br />
Those responsible<br />
for special needs<br />
population to take<br />
FEMA structural<br />
Prevention New<br />
safety classes for<br />
New and<br />
14 building integrity<br />
Emergency response<br />
agencies and<br />
districts to locate<br />
facilities away from<br />
Prevention ongoing<br />
geographically Property<br />
14 redundant areas<br />
Jurisdictions to<br />
adopt open burning<br />
Protection New<br />
14 control ordinances<br />
Jurisdictions to<br />
coordinate<br />
communications<br />
Prevention Ongoing<br />
14 plans Prevention Ongoing<br />
14<br />
Jurisdictions, state,<br />
federal agencies to<br />
review, prioritize<br />
emergency routes, Prevention New & Ongoing<br />
2009 &<br />
<strong>County</strong><br />
Planning/Building<br />
Continuing Department<br />
2009 &<br />
<strong>County</strong><br />
Planning/Building<br />
Continuing Department<br />
2009 &<br />
Continuing<br />
<strong>County</strong><br />
Commission<br />
2009 &<br />
Continuing <strong>County</strong> EMA<br />
2009 &<br />
Continuing <strong>County</strong> EMA<br />
2009 &<br />
Continuing<br />
<strong>County</strong><br />
Commission<br />
2009 &<br />
Continuing <strong>County</strong> EMA<br />
2009 &<br />
Continuing <strong>County</strong> EMA<br />
internal<br />
funds High<br />
internal<br />
funds Low<br />
internal<br />
funds High<br />
fed &<br />
state govt.<br />
program<br />
funds High<br />
<strong>Jefferson</strong> <strong>County</strong> – Section 4<br />
Completed and<br />
publicized<br />
Inquiries and<br />
Design<br />
Plans/Construction<br />
of Underground<br />
Infrastructure<br />
x x x x x<br />
Revised<br />
Regulations in<br />
Place x x x x x x x x<br />
Attendance<br />
Records x<br />
fed, state,<br />
local govt.<br />
program<br />
At Risk Facilities<br />
funds High Relocated<br />
Revised<br />
x x x x<br />
internal<br />
Regulations in<br />
funds<br />
fed &<br />
state govt.<br />
program<br />
Low Place x<br />
funds Medium Status Improved x x x x x x x x<br />
fed &<br />
state govt.<br />
program<br />
funds Medium<br />
Completed and<br />
Implemented x
A Regional Overview All-Hazard Mitigation Plan 25<br />
14<br />
retrofit<br />
infrastructure<br />
Upgrade of lifeline<br />
facilities to meet<br />
seismic codes Prevention New<br />
2009 &<br />
Continuing <strong>County</strong> EMA<br />
fed &<br />
state govt.<br />
program<br />
funds Medium<br />
Encourage Encourage growth growth that that is is compatible compatible compatible with with hazard hazard hazard mitigation mitigation strategies strategies identified identified in in this this plan plan on on local, local, countywide countywide and and regional regional basis. basis.<br />
basis.<br />
3.1 3.1 Develop Develop collaborative collaborative multi multi-interest multi multi interest interest committee to develop and achieve achieve multi multi-jurisdictional<br />
multi<br />
jurisdictional goals. goals.<br />
goals.<br />
Jurisdictions to<br />
implement hazard<br />
2009 and<br />
internal<br />
14 mitigation plan<br />
Partner with local,<br />
county, regionwide,<br />
state<br />
governments;<br />
encourage<br />
legislation to<br />
promote, establish<br />
Prevention New annually <strong>County</strong> EMA funds High<br />
state planning<br />
2009 &<br />
internal<br />
14 department<br />
State planning<br />
department to<br />
coordinate levee<br />
districts to protect<br />
those living<br />
Prevention New Continuing Legislature funds High<br />
1,2,3,4,5,6,7,8,9, upstream and<br />
2009 & State Planning internal<br />
10,11,12,13 downstream<br />
Recommend<br />
pertinent<br />
jurisdictions<br />
conduct proper<br />
recordkeeping for<br />
all documents<br />
Prevention New Continuing Department funds High<br />
related to natural Public<br />
2009 &<br />
internal<br />
14 disasters<br />
Information New Continuing <strong>County</strong> funds Low<br />
3.2 3.2 Reduce Reduce impacts impacts and and promote promote protection protection of of natural natural resources.<br />
resources.<br />
Construction<br />
Complete x<br />
Plan Completed<br />
and Implemented x x x x x x x x<br />
Establishment of<br />
State Planning<br />
Department x x x x x x x x<br />
Levee Districts<br />
inventoried x x<br />
Documents<br />
Archived x x x x x x x x
26<br />
1,2,3,4,5,6,7,8,9,<br />
10,11,12,13<br />
14<br />
14<br />
1,2,3,4,5,6,7,8,9,<br />
10,11,2,13<br />
14<br />
14<br />
14<br />
Develop<br />
jurisdictions' land<br />
use plans, zoning,<br />
regulations to<br />
protect downstream<br />
residents from<br />
impacts of dam<br />
failure<br />
Jurisdictions to<br />
educate residents<br />
on proper disposal<br />
of yard,<br />
commercial,<br />
household waste<br />
Jurisdictions,<br />
residents to<br />
maintain creeks,<br />
streams<br />
Natural<br />
resource<br />
protection New<br />
2009 &<br />
Continuing<br />
Natural<br />
resource<br />
protection Ongoing Ongoing<br />
Natural<br />
resource<br />
protection Ongoing Ongoing<br />
<strong>County</strong><br />
Planning/Zoning<br />
Officer<br />
<strong>County</strong><br />
Department of<br />
Environment<br />
Watershed<br />
Advisory<br />
Committee<br />
Jurisdictions to<br />
assist MDNR in full Natural<br />
<strong>County</strong><br />
implementation of resource<br />
2009 & Planning/Zoning<br />
dam safety program protection<br />
Jurisdictions to<br />
develop greenways<br />
New Continuing Officer<br />
for flood protection Natural<br />
Watershed<br />
that parallel streams resource<br />
Advisory<br />
and rivers<br />
Jurisdictions to<br />
become familiar<br />
protection New & Ongoing Ongoing Committee<br />
and comply with Natural<br />
drought, water resource<br />
2009 &<br />
restrictions<br />
Jurisdictions,<br />
stakeholders to<br />
work together<br />
together to protect<br />
watersheds and<br />
protection New Continuing NRCS<br />
encourage<br />
Natural<br />
Watershed<br />
stormwater resource<br />
2009 & Advisory<br />
practices for flood protection New & Ongoing Continuing Committee<br />
internal<br />
funds High<br />
<strong>Jefferson</strong> <strong>County</strong> – Section 4<br />
Regulations in<br />
place x x<br />
internal<br />
funds Low Status Improved x x<br />
internal<br />
funds Low Status Improved x x<br />
Potential<br />
Funding<br />
Sources High<br />
Status<br />
Improved/Risk<br />
Reduced x x<br />
internal<br />
Design<br />
Plans/Construction<br />
funds Medium of Greenways x x<br />
fed &<br />
state govt.<br />
program<br />
funds Low Status Improved x x<br />
internal<br />
funds High<br />
Establishment of<br />
Sustainable<br />
Watershed<br />
committees x x
A Regional Overview All-Hazard Mitigation Plan 27<br />
protection<br />
1 Arnold 2 Byrnes Mill 3 Cedar Hill Lakes 4 Crystal City 5 DeSoto 6 Festus 7 Herculaneum 8 Kimmswick 9 Pevely 10 Scotsdale 11<br />
Hillsboro 12 Olympian Village 13 Parkdale 14 All Communities