The FORE-SCE model: Land Use Modeling ... - Farm Foundation
The FORE-SCE model: Land Use Modeling ... - Farm Foundation
The FORE-SCE model: Land Use Modeling ... - Farm Foundation

You also want an ePaper? Increase the reach of your titles
YUMPU automatically turns print PDFs into web optimized ePapers that Google loves.
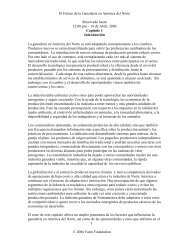
<strong>The</strong> <strong>FORE</strong>-<strong>SCE</strong> <strong>model</strong>: <strong>Land</strong> <strong>Use</strong> <strong>Modeling</strong><br />
Parameterized with USGS Historical Data<br />
USGS EROS Data Center<br />
Terry Sohl<br />
Science Applications International Corporation (SAIC)<br />
Contractor to:<br />
USGS Center for Earth Observation and Science (EROS)<br />
Sioux Falls, SD 57198<br />
October 17th, 2007
USGS EROS Data Center
USGS EROS Data Center<br />
<strong>Land</strong> Cover Trends:<br />
Telling the story of<br />
Change
Applications of <strong>Land</strong> Cover and <strong>Land</strong><br />
Cover Change Data<br />
NOAA temperature trends analysis<br />
Hale, R. C., K. P. Gallo, T. W. Owen, and T R.<br />
Loveland (2006), <strong>Land</strong> use/land cover change<br />
effects on temperature trends at U.S. Climate<br />
Normals stations. Geophysical Research Letters<br />
33: L11703<br />
USGS EROS Data Center
Monthly Minimum Temperature Anomaly - Memphis, TN<br />
USGS EROS Data Center<br />
Monthly Minimum Temperature Anomaly ( o C)<br />
5.0<br />
4.0<br />
3.0<br />
2.0<br />
1.0<br />
0.0<br />
-1.0<br />
-2.0<br />
-3.0<br />
-4.0<br />
Dominant Change<br />
Period<br />
-5.0<br />
Jan-71 Jan-75 Jan-79 Jan-83 Jan-87 Jan-91 Jan-95 Jan-99<br />
Pre-change Pre change trend: -0.03 0.03 ± 0.06 °C/yr C/yr<br />
Post-change Post change trend: 0.15 ± 0.12 °C/yr C/yr
Applications of <strong>Land</strong> Cover and <strong>Land</strong><br />
Cover Change Data<br />
USGS/NASA United States regional carbon dynamics<br />
Liu, J, S. Liu, and T.R. Loveland, 2006. Temporal evolution of carbon<br />
budgets of the Appalachian Forests in the U.S. from 1972 to 2000. Forest<br />
Ecology and Management (in press).<br />
Liu, J., S. Liu, T.R. Loveland, and T.L. Tieszen, 2006. Estimating carbon<br />
sequestration in agricultural ecosystems in the Western Corn Belt Plains of<br />
the United States. Global Change Biology (currently going through USGS<br />
review).<br />
Tan, Z., S. Liu, C. A. Johnston, T. R. Loveland, L. L. Tieszen, J. Liu, and<br />
R. Kurtz, 2005. Soil organic carbon dynamics as related to land use<br />
history in the northwestern Great Plains. Global Biogeochemical Cycles<br />
19: GB3011.<br />
Liu, S., T.R. Loveland, and R.M. Kurtz, 2004. Contemporary carbon<br />
dynamics on terrestrial ecosystems in the southeastern plains of the United<br />
States. Environmental Management 33: S442-S456.<br />
USGS EROS Data Center
Total C Change (Mg C/ha/yr)<br />
2.5<br />
2<br />
1.5<br />
1<br />
0.5<br />
0<br />
-0.5<br />
-1<br />
Southeastern<br />
Plains<br />
1973 1978 1983 1988 1993 1998<br />
Year<br />
Ecoregion Carbon Dynamics<br />
USGS EROS Data Center<br />
Total C Change (Mg C/ha/yr)<br />
2.5<br />
2<br />
1.5<br />
1<br />
0.5<br />
0<br />
-0.5<br />
-1<br />
Piedmont Northern<br />
2.5<br />
2 Piedmont<br />
1971 1976 1981 1986 1991 1996<br />
Year<br />
Total C Change (Mg C/ha/yr)<br />
1.5<br />
1<br />
0.5<br />
0<br />
-0.5<br />
-1<br />
1973 1978 1983 1988 1993 1998<br />
Year
Applications of <strong>Land</strong> Cover and <strong>Land</strong><br />
Cover Change Data – Conservation Issues<br />
USGS ARMI regional amphibian habitat analysis<br />
Price, S., M. Dorcas, A. Gallant, R. Klaver, and J. Wilson,<br />
2006. Three decades of urbanization: estimating the impact<br />
of land-cover change on stream salamander populations.<br />
Biological Conservation.<br />
USGS/FWS National Wildlife Refuge ecological integrity<br />
assessment<br />
Scott, J.M., Loveland, T.R., Gergley, K., Strittholt, J., and<br />
Staus, N., 2004. National Wildlife Refuge System:<br />
ecological context and integrity. Natural Resources<br />
Journal 44(4): 1041-1066.<br />
USGS EROS Data Center
“<strong>The</strong> Influence of Historical and Projected<br />
<strong>Land</strong> <strong>Use</strong> and <strong>Land</strong> Cover Changes on <strong>Land</strong><br />
Surface Hydrology and Regional Weather and<br />
Climate Variability”<br />
NASA ESE funded proposal<br />
T. Loveland, R. Pielke Sr., T. Sohl, L. Steyaert<br />
Conduct a series of regional experiments that collectively<br />
address the extent to which changes in specific regional<br />
land use and land cover characteristics, including the types,<br />
biophysical properties, and spatial configurations, affect<br />
surface hydrology and regional weather and climate<br />
variability.<br />
Sister USGS Prospectus funding<br />
USGS EROS Data Center
Blue -- Primary<br />
Assessment Region<br />
Magenta -- Atmospheric<br />
Boundary<br />
Conditions<br />
USGS EROS Data Center
Technical Components<br />
<strong>Land</strong> cover database development (pre-settlement,<br />
1920, 1992, and 2020)<br />
Biophysical parameter dataset development<br />
Sensitivity tests for summer months using<br />
RAMS/LEAF2/GEMTM<br />
Validation of <strong>model</strong> sensitivity<br />
Assessment of future regional climate vulnerability<br />
USGS EROS Data Center
LULC databases -- LEAF2 (modified)<br />
classification scheme (Western Plains Application)<br />
• Oceans, Lakes<br />
• Ice Caps, Glaciers<br />
• Evergreen Needleleaf Forest<br />
• Deciduous Needleleaf Forest<br />
• Deciduous Broadleaf Forest<br />
• Evergreen Broadleaf Forest<br />
• Short Grass<br />
• Tall Grass<br />
• Desert<br />
USGS EROS Data Center<br />
• Evergreen Shrub<br />
• Deciduous Shrub<br />
• Mixed Woodland<br />
• Crops/Mixed <strong>Farm</strong>ing<br />
• Row Crop (Dryland)<br />
• Irrigated Crop<br />
• Bog or Marsh<br />
• Bare Ground<br />
• Urban and Built-up
Historical <strong>Land</strong> Cover Reconstruction<br />
A modified Kuchler’s<br />
Potential Natural Vegetation<br />
(PNV) is used to represent<br />
pre-settlement (~1650)<br />
~1920 chosen as it<br />
represents the period where<br />
agricultural activity reached<br />
a peak in much of the U.S.,<br />
with eastern forests greatly<br />
reduced<br />
A cartographic <strong>model</strong>ing<br />
process used to reconstruct<br />
1920s land cover, using:<br />
PNV<br />
County Ag stats<br />
Census Data<br />
Other historical data sources<br />
USGS EROS Data Center
Historical,<br />
Contemporary, and<br />
Future <strong>Land</strong> cover<br />
in the High Plains:<br />
Assessing the<br />
Consequences of<br />
<strong>Land</strong> Cover Change<br />
on Regional<br />
Weather and<br />
Climate Variability<br />
USGS EROS Data Center<br />
Pre-Settlement 1920<br />
1992 2020
Biophysical Parameter Construction<br />
Biophysical parameter datasets<br />
for coupled land-atmosphere<br />
<strong>model</strong>ing are based on mapped<br />
land cover classes.<br />
Aggregated time series of<br />
MODIS products (albedo, leaf<br />
area, veg. indices) used to<br />
improve the basis for<br />
prescribing these parameters<br />
for each land cover type.<br />
<strong>The</strong>se data are combined with<br />
field and other data to construct<br />
final biophysical parameter<br />
data layers<br />
<strong>The</strong>se serve as input to<br />
RAMS/GEMTM <strong>model</strong>ing<br />
system<br />
USGS EROS Data Center
Projecting <strong>Land</strong> Cover Change:<br />
<strong>The</strong> <strong>FORE</strong>-<strong>SCE</strong> <strong>model</strong><br />
<strong>FORE</strong>-<strong>SCE</strong> – <strong>FORE</strong>casting <strong>SCE</strong>narios of land use change<br />
Our goal is to:<br />
Provide scenario-based projections of change (3 scenarios per<br />
region)<br />
Project the proportions of each land cover in a region<br />
Site the cover on the lands with the highest potential for<br />
supporting that land use and cover<br />
Generate the clusters of cover and patterns of fragmentation so<br />
that the projected landscape represents a specific composition and<br />
configuration for each region.<br />
USGS EROS Data Center
<strong>FORE</strong>-<strong>SCE</strong>: Model structure<br />
Issues of Scale -- Demand vs. Spatial Allocation module<br />
Demand Module<br />
Driven by macro-level socioeconomic drivers<br />
Drivers often not spatially explicit, not able to be mapped<br />
quantitatively<br />
Non-spatial...calculates area change for all land use types at the<br />
aggregate level<br />
Spatial Allocation Module<br />
Driven by lower-level socioeconomic and biophysical drivers<br />
Requires the establishment of quantitative relationships between<br />
LULC distribution and drivers<br />
Drivers MUST be mappable at the scale of analysis<br />
Output from Demand Module translated into spatially explicit<br />
allocation of land use change, based on a combination of<br />
empirical information, spatial analysis, and dynamic <strong>model</strong>ing.<br />
USGS EROS Data Center
<strong>Land</strong> Cover Trends Data --<br />
Our Ace-in-the-hole<br />
<strong>Use</strong> of <strong>Land</strong> Cover Trends project data<br />
We have empirical data on<br />
contemporary land cover change in the<br />
three study areas (change rates, patch<br />
characteristics, habitat fragmentation,<br />
drivers of change)<br />
Incorporation of Trends information --<br />
Gives us an advantage that many<br />
<strong>model</strong>ers of LULC change don’t have.<br />
Existence of Trends data, 1992 NLCD,<br />
and 2000 NLCD offers the possibility<br />
for calibrating <strong>model</strong> results<br />
USGS EROS Data Center
1992<br />
NLCD<br />
Climate<br />
(DAYMET)<br />
NED and<br />
Derivatives<br />
STATSGO<br />
Proximity to<br />
Transportation<br />
Population<br />
Data<br />
Socioeconomic<br />
Data<br />
Ag Census<br />
Data<br />
FIA<br />
Points<br />
Recode<br />
USGS EROS Data Center<br />
Modified<br />
NLCD<br />
Logistic<br />
Regression<br />
Interpolation<br />
(IDW)<br />
Stand Age<br />
(History)<br />
Elasticity<br />
Values<br />
Probability<br />
Surfaces<br />
(<strong>Land</strong> Cover(X)=1,19)<br />
<strong>Land</strong> Cover<br />
Trends Data<br />
Yearly Change<br />
Rates<br />
Prob(X)*Elas(X)*<br />
History<br />
Year(i)=1,58<br />
Layerstack-<br />
1992-2050<br />
<strong>Land</strong> Cover<br />
Patch<br />
Library<br />
Patch Size<br />
Characteristics<br />
TProb. X(i+1)<br />
History (i+1)<br />
Seed/Patch<br />
Placement<br />
<strong>Land</strong><br />
Cover X(i+1)<br />
Final <strong>Land</strong><br />
Cover (i+1)
<strong>FORE</strong>-<strong>SCE</strong> Model: Trends data and <strong>model</strong><br />
parameterization<br />
Ecoregion-by-ecoregion <strong>model</strong> parameterization using Trends data<br />
Ecoregion specific parameters including change rates, change patch<br />
characteristics, “Elasticity” values, “Clumpiness” values<br />
USGS EROS Data Center
Ancillary Data – <strong>Use</strong>d in Logistic Regression<br />
Modified 1992 NLCD and all<br />
ancillary data compiled into<br />
one data stack<br />
50,000 points, minimum<br />
1,000 per land cover class<br />
Point land cover and<br />
corresponding ancillary data<br />
values imported into SAS<br />
USGS EROS Data Center
Regression-based Probability Surfaces<br />
USGS EROS Data Center<br />
• Logistic regression<br />
used to analyze<br />
relationships between<br />
each land cover type<br />
and ancillary data sets<br />
• Probability surfaces<br />
constructed for each<br />
land cover type
Tracking Change through Time –<br />
HISTORY Variable<br />
Forestry activity in the Southeast results in an extremely dynamic landscape<br />
Over 20% of the Southeastern Plains ecoregion changed land cover type at least once<br />
between 1973 and 2000<br />
~75% of change in the Southeastern Plains is directly related to forest cutting<br />
Forest cutting cycles on loblolly pine plantations in the Southeast average 20-25 years<br />
Introduction of HISTORY variable that tracks “age” of every pixel in the SE study area<br />
Allows for much more realistic <strong>model</strong>ing of forest cutting cycle<br />
USGS EROS Data Center
Establishing Stand Age – Forest Inventory<br />
and Analysis (FIA) Data<br />
USGS EROS Data Center
Controlling Transition Probabilities<br />
“Elasticity” is an ecoregion-specific modifier to base probability values. It’s<br />
simply a number from 0 to 10 that gives the likelihood of a specific transition type<br />
occurring in that ecoregion.<br />
Elasticity for every possible land cover transition determined from <strong>Land</strong> Cover<br />
Trends data<br />
Powerful tool for control of scenario development. Depending upon the scenario,<br />
we can tightly or loosely restrict the types of land cover transitions that are allowed<br />
to occur.<br />
USGS EROS Data Center
Calculating Total Probability (TPROB)<br />
Total Probability (TPROB) constructed prior to generation of change polygons<br />
TPROB = Baseline Probability * ELASTICITY * Function(HISTORY) * PAD<br />
ELASTICITY used both to modify probabilities based on likelihood of change,<br />
and to “zero out” probabilities for transitions we don’t want to occur<br />
Value 0-10, rescale to 0.0 to 1.0 for TPROB multiplier<br />
HISTORY used to zero out probability of new transitional (clear-cut) patches until<br />
forest stand age reaches minimum of 20 years<br />
PAD – Protected Areas Database<br />
Baseline Probability Total Probability<br />
USGS EROS Data Center<br />
Existing Cover<br />
Elasticity<br />
History<br />
PAD
Generating Change Polygons<br />
TRANSITION TYPE Mean Patch Size Standard Deviation<br />
Grass/shrub to Urban 7.10 5.84<br />
Grass/shrub to Mining 1.37 2.40<br />
Grass/shrub to Agriculture 57.14 114.22<br />
Grass/shrub to Wetland 2.88 1.08<br />
Agriculture to Urban 3.75 3.54<br />
Agriculture to Mining 6.84 8.41<br />
Agriculture to Grass/shrub 58.43 103.17<br />
Agriculture to Wetland 3.00 0.74<br />
Wetland to Agriculture 4.36 6.44<br />
Wetland to Wetland 3.76 8.85<br />
USGS EROS Data Center<br />
• Probability surfaces used in conjunction with<br />
Trends information to create change polygons<br />
• <strong>Use</strong> of “Seeds” planted on probability surfaces<br />
• Change patches assigned a realistic size range<br />
for that transition type<br />
• <strong>Use</strong>s lookup table of mean and standard<br />
deviation of patch size for each LC type, for<br />
each ecoregion (from Trends project)<br />
• Normal distribution of patch size <strong>model</strong>ed<br />
based on those parameters (simplification)<br />
• Random number (normal distribution)<br />
used to select patch size for each seed<br />
• DEMAND drives # of “seed” pixels<br />
• With normal distribution:<br />
# Seeds = TotalArea(lc x ) / Mean
Old Method<br />
New (improved?) Method<br />
USGS EROS Data Center<br />
Generating Change Polygons<br />
and <strong>FORE</strong>-<strong>SCE</strong> run time<br />
Once seed size is determined, a change patch<br />
centered on that seed is placed<br />
Old method – Region grow function into<br />
adjacent pixels of similar (or higher)<br />
probability<br />
Patches more “organic”, dependent upon<br />
probability surface characteristics<br />
Problem – Model Run times were 2-3 real days<br />
per yearly <strong>model</strong> iteration<br />
New method – Pre-established patch “library”<br />
of a limited number of patch configurations<br />
Assigned patch size for a seed determines pool<br />
of potential patch configurations<br />
Underlying probability surface still controls<br />
individual pixel placement<br />
“Canned” patches with less variability, but:<br />
1992 to 2050 <strong>model</strong> run (58 iterations) now<br />
takes just over 24 hours
Controlling “Clumpiness” of LULC change<br />
USGS EROS Data Center<br />
Probability surface guides<br />
placement of seed pixels for<br />
change<br />
Some land cover transitions<br />
are spread evenly across the<br />
landscape, some are more<br />
clumped<br />
Histogram breakpoints used<br />
to control “clumpiness”<br />
Ecoregion-by-ecoregion<br />
parameterization<br />
Highly dependent upon<br />
characteristics of individual<br />
probability surface<br />
Quantitatively determined<br />
from Trends data….???
“Footprint” of Change – 1992 to 2050<br />
USGS EROS Data Center
RAMS/LEAF2/GEMTM <strong>Modeling</strong><br />
RAMS/LEAF2 coupled <strong>model</strong>ing system<br />
is used to quantify the potential effects of<br />
LULC change on surface hydrology,<br />
weather, and climate variability<br />
Summer season (60-90 day duration)<br />
conducted, using each land cover data set,<br />
but with identical meteorological forcing<br />
data<br />
“Wet” year (1993, top right) and “Dry”<br />
year (2002, bottom right) averaged<br />
maximum monthly air temperature shown<br />
Top row – 1992 NLCD baseline run<br />
2nd – 4 th row – Differences from baseline<br />
S1 – Trends extrapolation<br />
S2 – Agricultural decline scenario<br />
S3 – Agricultural expansion scenario<br />
USGS EROS Data Center
USGS EROS Data Center
1992 to 2050<br />
Projected<br />
Change:<br />
Florida<br />
USGS EROS Data Center
1992 to 2050 Projected<br />
LULC Change:<br />
Mobile, Alabama<br />
USGS EROS Data Center
1992 to 2050 Projected<br />
LULC Change:<br />
Montgomery, AL area<br />
USGS EROS Data Center
1992 to 2050 Projected<br />
LULC Change:<br />
New Orleans area<br />
USGS EROS Data Center
1992 Conifer – Percent changed by 2050<br />
USGS EROS Data Center
Red-cockaded Woodpecker – Conifer Stand Age<br />
Only bird in North America that regularly<br />
nests in cavities in living pine trees<br />
Longleaf Pine is preferred nesting tree<br />
Seek out Longleaf pine suffering from a<br />
fungal infection, “Red-heart disease”<br />
Causes inner wood to rot, become<br />
conducive for cavity building<br />
Longleaf pine and other pines don’t become<br />
susceptible to red-heart disease until an<br />
average age of 80-120 years old<br />
Also prefers contiguous patches of suitable<br />
habitat > 120 acres<br />
Even-aged, short rotation forestry<br />
management in the Southeast eliminates<br />
suitable nesting and foraging habitat<br />
USGS EROS Data Center
Red-cockaded Woodpecker – Conifer Stand Age<br />
RCW Family Clusters, 1990-1994<br />
15 Groups of 100+ Family<br />
Clusters, all but 1 on public land<br />
USGS EROS Data Center<br />
Projected 2050 Conifer Stand Age and Historical RCW Range<br />
Blue: Stand Age 75<br />
Crosshatch: Historical Range
Great Plains -- 1992 to 2020<br />
Change (Agriculture<br />
Expansion Scenario)<br />
USGS EROS Data Center
Scenario Comparison -- SW Kansas<br />
USGS EROS Data Center
South Dakota -- 1992 to projected 2020 Change<br />
Northern Great Plains – Study Area<br />
USGS EROS Data Center
FY2008 development: Northern Great Plains –<br />
Biofuel-driven Agricultural Change<br />
USGS EROS Data Center<br />
Primary goal – To evaluate the<br />
effects of an expanded agricultural<br />
base for biofuels and concurrent<br />
changes in climate on ecosystem<br />
sustainability across the Northern<br />
Great Plains<br />
Development of credible landchange<br />
scenarios to project<br />
alternative landscape futures<br />
through 2050<br />
Analyze results to estimate effects<br />
on ecosystem processes and<br />
services.
Northern Great Plains Biomass for Biofuel:<br />
Key Research Questions<br />
What landscape patterns are likely to result from an expanded<br />
biomass-for-biofuel economy and what are our estimates of the<br />
uncertainties?<br />
What are the environmental consequences?<br />
What are the full economic costs and benefit of biomass<br />
production for energy, including agricultural sector profitability?<br />
How will projected climate change impact agricultural production<br />
and profitability?<br />
How will projected climate change impact the provision of<br />
ecosystem services?<br />
What are the feedbacks among land-use change, economic and<br />
policy drivers, climate, biophysical processes, and a variety of<br />
ecosystem services?<br />
USGS EROS Data Center
FY2008 development: Scenarios<br />
Corn for ethanol – Large-scale production already underway in<br />
the Northern Great Plains, with continued expansion<br />
Soybeans for biodiesel<br />
Grasses for cellulosic ethanol<br />
Switchgrass<br />
Miscanthus<br />
Mixed Prairie Species<br />
Climate – IPCC-defined scenarios<br />
No change, Low-IPCC, High-IPCC<br />
USGS EROS Data Center
FY2008 development: DEMAND<br />
DEMAND in current <strong>FORE</strong>-<strong>SCE</strong><br />
applications has largely been<br />
based on extrapolations of<br />
historical (L.C. Trends) data<br />
Priority: Building a DEMAND<br />
module that instead is driven by<br />
policy, economic costs and<br />
returns, and biophysical<br />
conditions<br />
Prerequisite – Quantifying<br />
relationships between these<br />
drivers and actual land cover<br />
change<br />
USGS EROS Data Center<br />
Public policies<br />
Biofuel<br />
demands<br />
Commodity<br />
prices<br />
Climate<br />
Change<br />
Drivers<br />
and<br />
Feedbacks<br />
Drainage<br />
subsidies<br />
Site<br />
Conditions<br />
Irrigation<br />
incentives<br />
<strong>Land</strong> Cover Hectares<br />
Corn 18,500,000<br />
Soybeans 12,200,000<br />
Switchgrass 6,194,000<br />
Hay/Pasture 23,529,000<br />
Etc. Etc.
FY2008 development: Parcel (field) based<br />
<strong>model</strong>ing<br />
CLU<br />
NASS CDL<br />
USGS EROS Data Center<br />
MODIS NDVI<br />
USDA – Common <strong>Land</strong> Unit<br />
(CLU)<br />
Smallest unit of land that has a<br />
permanent, contiguous<br />
boundary, a common land cover<br />
and land management, a<br />
common owner and a common<br />
producer in ag land associated<br />
with USDA farm programs.<br />
MODIS 16-day Vegetation<br />
Index composites – <strong>Use</strong>d to map<br />
crop type, augment 2001 NLCD<br />
classification<br />
NASS Cropland Data Layer<br />
(CDL) used to validate MODIS<br />
crop-type information
FY2008 Development – Model integration<br />
USGS EROS Data Center
FY2010 and Beyond<br />
USGS plans for national land-cover monitoring<br />
NLCD updates every 5 years<br />
NLCD change products<br />
Integrate Trends expertise<br />
And…land cover projection component?<br />
USGS EROS Data Center