Predicting Partial Customer Churn Using Markov for Discrimination ...
Predicting Partial Customer Churn Using Markov for Discrimination ...
Predicting Partial Customer Churn Using Markov for Discrimination ...
You also want an ePaper? Increase the reach of your titles
YUMPU automatically turns print PDFs into web optimized ePapers that Google loves.
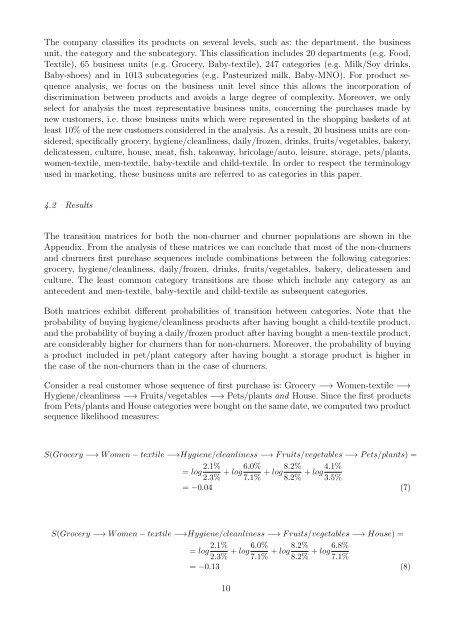
The company classifies its products on several levels, such as: the department, the business<br />
unit, the category and the subcategory. This classification includes 20 departments (e.g. Food,<br />
Textile), 65 business units (e.g. Grocery, Baby-textile), 247 categories (e.g. Milk/Soy drinks,<br />
Baby-shoes) and in 1013 subcategories (e.g. Pasteurized milk, Baby-MNO). For product sequence<br />
analysis, we focus on the business unit level since this allows the incorporation of<br />
discrimination between products and avoids a large degree of complexity. Moreover, we only<br />
select <strong>for</strong> analysis the most representative business units, concerning the purchases made by<br />
new customers, i.e. those business units which were represented in the shopping baskets of at<br />
least 10% of the new customers considered in the analysis. As a result, 20 business units are considered,<br />
specifically grocery, hygiene/cleanliness, daily/frozen, drinks, fruits/vegetables, bakery,<br />
delicatessen, culture, house, meat, fish, takeaway, bricolage/auto, leisure, storage, pets/plants,<br />
women-textile, men-textile, baby-textile and child-textile. In order to respect the terminology<br />
used in marketing, these business units are referred to as categories in this paper.<br />
4.2 Results<br />
The transition matrices <strong>for</strong> both the non-churner and churner populations are shown in the<br />
Appendix. From the analysis of these matrices we can conclude that most of the non-churners<br />
and churners first purchase sequences include combinations between the following categories:<br />
grocery, hygiene/cleanliness, daily/frozen, drinks, fruits/vegetables, bakery, delicatessen and<br />
culture. The least common category transitions are those which include any category as an<br />
antecedent and men-textile, baby-textile and child-textile as subsequent categories.<br />
Both matrices exhibit different probabilities of transition between categories. Note that the<br />
probability of buying hygiene/cleanliness products after having bought a child-textile product,<br />
and the probability of buying a daily/frozen product after having bought a men-textile product,<br />
are considerably higher <strong>for</strong> churners than <strong>for</strong> non-churners. Moreover, the probability of buying<br />
a product included in pet/plant category after having bought a storage product is higher in<br />
the case of the non-churners than in the case of churners.<br />
Consider a real customer whose sequence of first purchase is: Grocery −→ Women-textile −→<br />
Hygiene/cleanliness −→ Fruits/vegetables −→ Pets/plants and House. Since the first products<br />
from Pets/plants and House categories were bought on the same date, we computed two product<br />
sequence likelihood measures:<br />
S(Grocery −→ W omen − textile −→Hygiene/cleanliness −→ F ruits/vegetables −→ P ets/plants) =<br />
= log 2.1% 6.0% 8.2% 4.1%<br />
+ log + log + log<br />
2.3% 7.1% 8.2% 3.5%<br />
= −0.04 (7)<br />
S(Grocery −→ W omen − textile −→Hygiene/cleanliness −→ F ruits/vegetables −→ House) =<br />
= log 2.1% 6.0% 8.2% 6.8%<br />
+ log + log + log<br />
2.3% 7.1% 8.2% 7.1%<br />
= −0.13 (8)<br />
10


