Predicting Partial Customer Churn Using Markov for Discrimination ...
Predicting Partial Customer Churn Using Markov for Discrimination ...
Predicting Partial Customer Churn Using Markov for Discrimination ...

Create successful ePaper yourself
Turn your PDF publications into a flip-book with our unique Google optimized e-Paper software.
Both sequences reveal that this customer is likely to churn. However, we only consider the<br />
maximum log-odds ratio in order to avoid an overestimation of the churner likelihood based on<br />
a non-unique product sequence.<br />
To evaluate the impact of the inclusion of the sequence likelihood variables in the partial churn<br />
prediction models, we compare the prediction per<strong>for</strong>mance of a model including these variables<br />
with the per<strong>for</strong>mance of the model including only the recency, frequency, monetary value and<br />
increased or decreased tendency. However, first we consider the possible multicollinearity issues.<br />
One popular multicollinearity metric is the variance inflation factor (VIF) (see Gujarati, 2002).<br />
A value of VIF greater than 10 means that multicollinearity may be causing problems with<br />
the estimations (Neter et al., 1996). VIF <strong>for</strong> the independent variables considered in this study<br />
ranges from 1 to 2. This is within the acceptable range and thus multicollinearity is not an<br />
important issue <strong>for</strong> the analysis.<br />
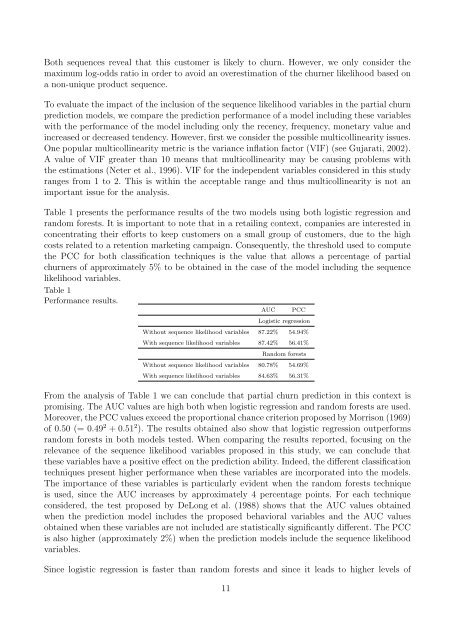
Table 1 presents the per<strong>for</strong>mance results of the two models using both logistic regression and<br />
random <strong>for</strong>ests. It is important to note that in a retailing context, companies are interested in<br />
concentrating their ef<strong>for</strong>ts to keep customers on a small group of customers, due to the high<br />
costs related to a retention marketing campaign. Consequently, the threshold used to compute<br />
the PCC <strong>for</strong> both classification techniques is the value that allows a percentage of partial<br />
churners of approximately 5% to be obtained in the case of the model including the sequence<br />
likelihood variables.<br />
Table 1<br />
Per<strong>for</strong>mance results.<br />
AUC PCC<br />
Logistic regression<br />
Without sequence likelihood variables 87.22% 54.94%<br />
With sequence likelihood variables 87.42% 56.41%<br />
Random <strong>for</strong>ests<br />
Without sequence likelihood variables 80.78% 54.69%<br />
With sequence likelihood variables 84.63% 56.31%<br />
From the analysis of Table 1 we can conclude that partial churn prediction in this context is<br />
promising. The AUC values are high both when logistic regression and random <strong>for</strong>ests are used.<br />
Moreover, the PCC values exceed the proportional chance criterion proposed by Morrison (1969)<br />
of 0.50 (= 0.49 2 + 0.51 2 ). The results obtained also show that logistic regression outper<strong>for</strong>ms<br />
random <strong>for</strong>ests in both models tested. When comparing the results reported, focusing on the<br />
relevance of the sequence likelihood variables proposed in this study, we can conclude that<br />
these variables have a positive effect on the prediction ability. Indeed, the different classification<br />
techniques present higher per<strong>for</strong>mance when these variables are incorporated into the models.<br />
The importance of these variables is particularly evident when the random <strong>for</strong>ests technique<br />
is used, since the AUC increases by approximately 4 percentage points. For each technique<br />
considered, the test proposed by DeLong et al. (1988) shows that the AUC values obtained<br />
when the prediction model includes the proposed behavioral variables and the AUC values<br />
obtained when these variables are not included are statistically significantly different. The PCC<br />
is also higher (approximately 2%) when the prediction models include the sequence likelihood<br />
variables.<br />
Since logistic regression is faster than random <strong>for</strong>ests and since it leads to higher levels of<br />
11