Predicting Partial Customer Churn Using Markov for Discrimination ...
Predicting Partial Customer Churn Using Markov for Discrimination ...
Predicting Partial Customer Churn Using Markov for Discrimination ...

You also want an ePaper? Increase the reach of your titles
YUMPU automatically turns print PDFs into web optimized ePapers that Google loves.
granularity of the analysis and the amount spent threshold used was the result of a sensitivity<br />
analysis. We verified the impact of a higher/lower temporal aggregation and the impact of the<br />
variation of the threshold on the proportion of partial churners identified. The proportion which<br />
was considered as realistic by the domain expert from the company used <strong>for</strong> the case study<br />
dictated these parameters.<br />
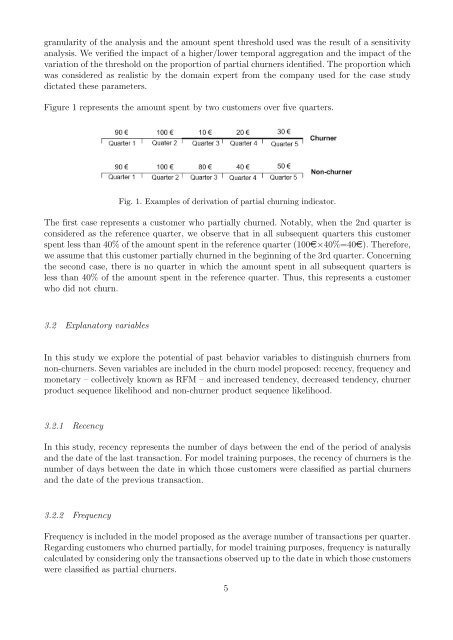
Figure 1 represents the amount spent by two customers over five quarters.<br />
Fig. 1. Examples of derivation of partial churning indicator.<br />
The first case represents a customer who partially churned. Notably, when the 2nd quarter is<br />
considered as the reference quarter, we observe that in all subsequent quarters this customer<br />
spent less than 40% of the amount spent in the reference quarter (100e×40%=40e). There<strong>for</strong>e,<br />
we assume that this customer partially churned in the beginning of the 3rd quarter. Concerning<br />
the second case, there is no quarter in which the amount spent in all subsequent quarters is<br />
less than 40% of the amount spent in the reference quarter. Thus, this represents a customer<br />
who did not churn.<br />
3.2 Explanatory variables<br />
In this study we explore the potential of past behavior variables to distinguish churners from<br />
non-churners. Seven variables are included in the churn model proposed: recency, frequency and<br />
monetary – collectively known as RFM – and increased tendency, decreased tendency, churner<br />
product sequence likelihood and non-churner product sequence likelihood.<br />
3.2.1 Recency<br />
In this study, recency represents the number of days between the end of the period of analysis<br />
and the date of the last transaction. For model training purposes, the recency of churners is the<br />
number of days between the date in which those customers were classified as partial churners<br />
and the date of the previous transaction.<br />
3.2.2 Frequency<br />
Frequency is included in the model proposed as the average number of transactions per quarter.<br />
Regarding customers who churned partially, <strong>for</strong> model training purposes, frequency is naturally<br />
calculated by considering only the transactions observed up to the date in which those customers<br />
were classified as partial churners.<br />
5