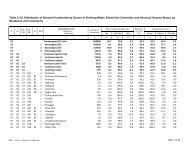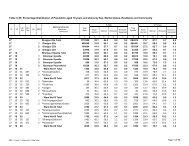
Table C-09: Percentage Distribution of Population by ... - Bbs.gov.bd
Table C-09: Percentage Distribution of Population by ... - Bbs.gov.bd
Table C-09: Percentage Distribution of Population by ... - Bbs.gov.bd

You also want an ePaper? Increase the reach of your titles
YUMPU automatically turns print PDFs into web optimized ePapers that Google loves.
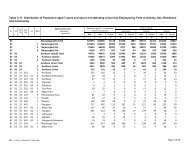
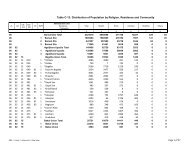
<strong>Table</strong> C-<strong>09</strong>: <strong>Percentage</strong> <strong>Distribution</strong> <strong>of</strong> <strong>Population</strong> <strong>by</strong> Type <strong>of</strong> disability, Residence and Community<br />
ZL UZ<br />
UN /<br />
WA<br />
1<br />
MZ /<br />
MH<br />
Vill RMO<br />
Administrative Unit<br />
Residence<br />
Community<br />
Total<br />
<strong>Population</strong><br />
Type <strong>of</strong> disability (%)<br />
All Speech Vision Hearing Physical Mental Autism<br />
2 3 4 5 6 7 8 9 10<br />
86 Shariatpur Zila Total 1155824 1.3 0.2 0.3 0.1 0.5 0.2 0.1<br />
86 1 Shariatpur Zila 1024780 1.3 0.2 0.3 0.1 0.5 0.2 0.1<br />
86 2 Shariatpur Zila 115970 1.5 0.2 0.2 0.1 0.6 0.2 0.1<br />
86 3 Shariatpur Zila 15074 1.4 0.2 0.2 0.1 0.7 0.2 0.1<br />
86 14 Bhedarganj Upazila Total 253234 1.3 0.2 0.2 0.1 0.5 0.2 0.1<br />
86 14 1 Bhedarganj Upazila 244041 1.2 0.2 0.2 0.1 0.5 0.2 0.1<br />
86 14 2 Bhedarganj Upazila 8169 2.4 0.1 0.2 0.1 1.7 0.2 0.1<br />
86 14 3 Bhedarganj Upazila 1024 1.7 0.0 0.0 0.0 1.5 0.0 0.2<br />
86 14 Bhedarganj Paurashava<br />
86 14 01 Ward No-01 Total 542 0.6 0.0 0.0 0.0 0.4 0.0 0.2<br />
86 14 02 Ward No-02 Total 1060 5.9 0.3 0.2 0.2 4.9 0.4 0.0<br />
86 14 03 Ward No-03 Total 1010 0.2 0.0 0.0 0.0 0.2 0.0 0.0<br />
86 14 04 Ward No-04 Total 996 0.7 0.0 0.0 0.2 0.3 0.2 0.0<br />
86 14 05 Ward No-05 Total 851 1.5 0.1 0.5 0.0 0.5 0.2 0.2<br />
86 14 06 Ward No-06 Total 661 1.2 0.0 0.5 0.0 0.3 0.2 0.3<br />
86 14 07 Ward No-07 Total 1219 5.5 0.2 0.2 0.2 4.3 0.2 0.2<br />
86 14 08 Ward No-08 Total 1137 1.1 0.3 0.1 0.0 0.5 0.3 0.0<br />
86 14 <strong>09</strong> Ward No-<strong>09</strong> Total 693 2.7 0.3 0.1 0.3 2.0 0.0 0.0<br />
86 14 12 Arshi Nagar Union Total 16826 0.9 0.1 0.1 0.1 0.4 0.1 0.0<br />
86 14 15 Char Bhaga Union Total 24478 1.2 0.2 0.3 0.1 0.3 0.1 0.1<br />
86 14 17 Char Kumaria Union Total 17247 1.4 0.3 0.2 0.1 0.4 0.1 0.3<br />
86 14 25 Chhaygaon Union Total 14515 2.7 0.3 0.4 0.1 1.5 0.3 0.1<br />
86 14 28 Char Census Union Total 18132 0.9 0.1 0.2 0.1 0.3 0.1 0.1<br />
86 14 32 Dhakhin Tarabunia Union Total 16943 0.7 0.1 0.1 0.1 0.2 0.1 0.0<br />
86 14 43 Digar Mahishkhali Union Total 21012 1.1 0.2 0.2 0.2 0.3 0.2 0.1<br />
86 14 51 Kachikata Union Total 25674 0.9 0.2 0.2 0.0 0.2 0.1 0.2<br />
86 14 60 Mahisar Union Total 16077 1.5 0.2 0.1 0.1 0.9 0.2 0.1<br />
86 14 69 Narayanpur Union Total 7814 2.1 0.2 0.5 0.3 0.7 0.3 0.1<br />
86 14 77 Rambhadrapur Union Total 18712 1.7 0.2 0.3 0.1 0.8 0.2 0.1<br />
RMO: 1 = Rural, 2 = Urban and 3 = Other Urban<br />
Page 1 <strong>of</strong> 5
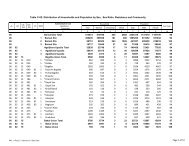
<strong>Table</strong> C-<strong>09</strong>: <strong>Percentage</strong> <strong>Distribution</strong> <strong>of</strong> <strong>Population</strong> <strong>by</strong> Type <strong>of</strong> disability, Residence and Community<br />
ZL UZ<br />
UN /<br />
WA<br />
1<br />
MZ /<br />
MH<br />
Vill RMO<br />
Administrative Unit<br />
Residence<br />
Community<br />
Total<br />
<strong>Population</strong><br />
Type <strong>of</strong> disability (%)<br />
All Speech Vision Hearing Physical Mental Autism<br />
2 3 4 5 6 7 8 9 10<br />
86 14 77 1 Rambhadrapur Union 17688 1.7 0.2 0.3 0.2 0.7 0.2 0.1<br />
86 14 77 3 Rambhadrapur Union 1024 1.7 0.0 0.0 0.0 1.5 0.0 0.2<br />
86 14 86 Sakhipur Union Total 25590 1.1 0.1 0.2 0.1 0.4 0.2 0.1<br />
86 14 94 Tarabunia Union Total 22045 0.9 0.1 0.3 0.1 0.3 0.1 0.0<br />
86 25 Damudya Upazila Total 1<strong>09</strong>003 1.5 0.2 0.3 0.1 0.5 0.2 0.1<br />
86 25 1 Damudya Upazila 91680 1.4 0.2 0.3 0.1 0.4 0.2 0.1<br />
86 25 2 Damudya Upazila 14242 2.2 0.3 0.3 0.2 1.0 0.2 0.2<br />
86 25 3 Damudya Upazila 3081 1.6 0.1 0.3 0.2 0.7 0.2 0.0<br />
86 25 Damudya Paurashava<br />
86 25 01 Ward No-01 Total 838 2.1 0.7 0.2 0.2 0.6 0.1 0.2<br />
86 25 02 Ward No-02 Total 1877 2.9 0.5 0.5 0.3 1.0 0.3 0.3<br />
86 25 03 Ward No-03 Total 1767 1.0 0.2 0.2 0.1 0.2 0.3 0.1<br />
86 25 04 Ward No-04 Total 2073 2.0 0.6 0.1 0.2 0.9 0.1 0.0<br />
86 25 05 Ward No-05 Total 1300 0.9 0.5 0.2 0.0 0.2 0.1 0.0<br />
86 25 06 Ward No-06 Total 2069 2.1 0.1 0.2 0.1 1.4 0.2 0.0<br />
86 25 07 Ward No-07 Total 1326 5.1 0.3 1.4 0.0 3.0 0.3 0.0<br />
86 25 08 Ward No-08 Total 1560 2.4 0.3 0.2 0.4 1.1 0.5 0.0<br />
86 25 <strong>09</strong> Ward No-<strong>09</strong> Total 1432 1.7 0.1 0.1 0.1 0.5 0.1 0.9<br />
86 25 23 Darul Aman Union Total 9652 1.2 0.1 0.2 0.1 0.5 0.2 0.0<br />
86 25 23 1 Darul Aman Union 6571 1.0 0.2 0.2 0.1 0.5 0.1 0.0<br />
86 25 23 3 Darul Aman Union 3081 1.6 0.1 0.3 0.2 0.7 0.2 0.0<br />
86 25 35 Dhankati Union Total 20559 1.2 0.2 0.3 0.1 0.4 0.1 0.1<br />
86 25 40 Islam Pur Union Total 8369 2.3 0.3 0.5 0.1 0.9 0.2 0.3<br />
86 25 47 Kaneshwar Union Total 15784 1.4 0.3 0.2 0.3 0.4 0.1 0.2<br />
86 25 59 Purba Damudya Union Total 21253 1.3 0.2 0.3 0.1 0.3 0.2 0.1<br />
86 25 71 Sidulkura Union Total 11669 1.3 0.1 0.3 0.1 0.4 0.2 0.1<br />
86 25 83 Sidya Union Total 7475 1.6 0.2 0.3 0.1 0.5 0.3 0.1<br />
86 36 Gosairhat Upazila Total 157665 1.2 0.2 0.3 0.1 0.5 0.1 0.1<br />
86 36 1 Gosairhat Upazila 146696 1.2 0.2 0.3 0.1 0.5 0.1 0.1<br />
RMO: 1 = Rural, 2 = Urban and 3 = Other Urban<br />
Page 2 <strong>of</strong> 5
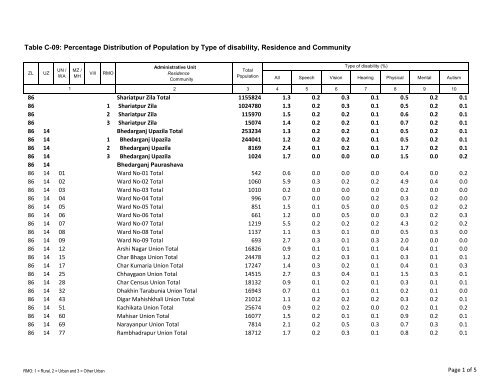
<strong>Table</strong> C-<strong>09</strong>: <strong>Percentage</strong> <strong>Distribution</strong> <strong>of</strong> <strong>Population</strong> <strong>by</strong> Type <strong>of</strong> disability, Residence and Community<br />
ZL UZ<br />
UN /<br />
WA<br />
1<br />
MZ /<br />
MH<br />
Vill RMO<br />
Administrative Unit<br />
Residence<br />
Community<br />
Total<br />
<strong>Population</strong><br />
Type <strong>of</strong> disability (%)<br />
All Speech Vision Hearing Physical Mental Autism<br />
2 3 4 5 6 7 8 9 10<br />
86 36 3 Gosairhat Upazila 1<strong>09</strong>69 1.3 0.2 0.2 0.0 0.6 0.2 0.1<br />
86 36 11 Alawalpur Union Total 18556 1.1 0.1 0.3 0.1 0.5 0.1 0.1<br />
86 36 23 Gosairhat Union Total 11507 1.8 0.2 0.3 0.3 0.6 0.3 0.1<br />
86 36 35 Idilpur Union Total 37641 1.5 0.2 0.4 0.1 0.5 0.1 0.1<br />
86 36 35 1 Idilpur Union 26672 1.5 0.2 0.5 0.2 0.5 0.1 0.1<br />
86 36 35 3 Idilpur Union 1<strong>09</strong>69 1.3 0.2 0.2 0.0 0.6 0.2 0.1<br />
86 36 47 Kodalpur Union Total 20346 0.6 0.1 0.1 0.1 0.3 0.1 0.0<br />
86 36 51 Kuchaipatti Union Total 21313 0.7 0.1 0.1 0.1 0.2 0.1 0.1<br />
86 36 59 Nager Para Union Total 25903 1.6 0.3 0.3 0.2 0.6 0.2 0.1<br />
86 36 71 Nalmuri Union Total 13528 1.6 0.2 0.7 0.1 0.5 0.1 0.0<br />
86 36 83 Samantasar Union Total 8871 1.1 0.2 0.2 0.1 0.4 0.1 0.1<br />
86 65 Naria Upazila Total 231644 1.4 0.2 0.2 0.1 0.6 0.2 0.1<br />
86 65 1 Naria Upazila 208871 1.5 0.2 0.2 0.1 0.6 0.2 0.1<br />
86 65 2 Naria Upazila 22773 1.1 0.2 0.2 0.1 0.4 0.2 0.1<br />
86 65 Naria Paurashava<br />
86 65 01 Ward No-01 Total 3448 0.7 0.1 0.1 0.0 0.2 0.1 0.1<br />
86 65 02 Ward No-02 Total 3675 1.0 0.2 0.2 0.0 0.3 0.2 0.1<br />
86 65 03 Ward No-03 Total 2223 1.3 0.4 0.1 0.0 0.4 0.2 0.1<br />
86 65 04 Ward No-04 Total 2463 1.3 0.2 0.1 0.0 0.2 0.5 0.3<br />
86 65 05 Ward No-05 Total 1935 0.8 0.1 0.1 0.0 0.4 0.2 0.1<br />
86 65 06 Ward No-06 Total 2033 1.0 0.2 0.3 0.0 0.3 0.1 0.0<br />
86 65 07 Ward No-07 Total 2540 1.4 0.2 0.6 0.1 0.4 0.2 0.0<br />
86 65 08 Ward No-08 Total 1949 1.3 0.1 0.3 0.1 0.6 0.2 0.1<br />
86 65 <strong>09</strong> Ward No-<strong>09</strong> Total 2507 1.7 0.1 0.2 0.3 0.8 0.2 0.1<br />
86 65 11 Bhojeshwar Union Total 18240 1.4 0.2 0.2 0.1 0.6 0.2 0.1<br />
86 65 12 Bhumkhara Union Total 14865 1.6 0.2 0.3 0.1 0.6 0.3 0.1<br />
86 65 18 Bijhari Union Total 14007 1.4 0.1 0.2 0.1 0.7 0.2 0.1<br />
86 65 25 Chamta Union Total 13598 1.4 0.3 0.3 0.1 0.5 0.2 0.0<br />
86 65 31 Char Atra Union Total 7763 1.0 0.3 0.2 0.1 0.3 0.0 0.1<br />
RMO: 1 = Rural, 2 = Urban and 3 = Other Urban<br />
Page 3 <strong>of</strong> 5
<strong>Table</strong> C-<strong>09</strong>: <strong>Percentage</strong> <strong>Distribution</strong> <strong>of</strong> <strong>Population</strong> <strong>by</strong> Type <strong>of</strong> disability, Residence and Community<br />
ZL UZ<br />
UN /<br />
WA<br />
1<br />
MZ /<br />
MH<br />
Vill RMO<br />
Administrative Unit<br />
Residence<br />
Community<br />
Total<br />
<strong>Population</strong><br />
Type <strong>of</strong> disability (%)<br />
All Speech Vision Hearing Physical Mental Autism<br />
2 3 4 5 6 7 8 9 10<br />
86 65 37 Dinga Manik Union Total 21858 1.9 0.3 0.2 0.2 0.8 0.3 0.1<br />
86 65 44 Fateh Jangapur Union Total 12112 1.8 0.3 0.4 0.2 0.5 0.3 0.2<br />
86 65 50 Gharisar Union Total 25305 1.9 0.2 0.3 0.2 0.8 0.2 0.2<br />
86 65 56 Japsa Union Total 10498 2.0 0.2 0.2 0.2 1.0 0.2 0.1<br />
86 65 63 Kedarpur Union Total 15852 1.3 0.2 0.2 0.1 0.4 0.3 0.1<br />
86 65 69 Muktarer Char Union Total 15578 1.4 0.2 0.3 0.2 0.5 0.2 0.1<br />
86 65 82 Nasasan Union Total 11<strong>09</strong>0 0.9 0.2 0.2 0.1 0.3 0.1 0.0<br />
86 65 88 Noapara Union Total 15552 0.8 0.1 0.1 0.1 0.2 0.1 0.1<br />
86 65 94 Rajnagar Union Total 12553 1.2 0.2 0.3 0.1 0.4 0.1 0.1<br />
86 69 Shariatpur Sadar Upazila Total 210259 1.3 0.2 0.3 0.1 0.5 0.2 0.1<br />
86 69 1 Shariatpur Sadar Upazila 160724 1.3 0.2 0.3 0.1 0.4 0.2 0.1<br />
86 69 2 Shariatpur Sadar Upazila 49535 1.3 0.1 0.2 0.1 0.5 0.2 0.1<br />
86 69 Shariatpur Paurashava<br />
86 69 01 Ward No-01 Total 6221 1.6 0.2 0.3 0.2 0.7 0.2 0.0<br />
86 69 02 Ward No-02 Total 4903 0.7 0.1 0.1 0.0 0.3 0.1 0.0<br />
86 69 03 Ward No-03 Total 5633 2.2 0.2 0.1 0.2 1.1 0.4 0.1<br />
86 69 04 Ward No-04 Total 6127 0.4 0.0 0.1 0.0 0.1 0.2 0.0<br />
86 69 05 Ward No-05 Total 4781 1.0 0.1 0.3 0.0 0.2 0.2 0.2<br />
86 69 06 Ward No-06 Total 4748 1.6 0.2 0.1 0.2 0.6 0.4 0.0<br />
86 69 07 Ward No-07 Total 7345 1.2 0.2 0.3 0.1 0.6 0.1 0.0<br />
86 69 08 Ward No-08 Total 5582 1.5 0.1 0.3 0.1 0.6 0.2 0.2<br />
86 69 <strong>09</strong> Ward No-<strong>09</strong> Total 4195 1.0 0.1 0.2 0.1 0.3 0.2 0.0<br />
86 69 17 Angaria Union Total 24162 1.3 0.2 0.2 0.1 0.6 0.3 0.1<br />
86 69 19 Binodpur Union Total 14718 2.0 0.2 0.5 0.1 0.8 0.3 0.1<br />
86 69 28 Chandrapur Union Total 12827 1.8 0.3 0.8 0.1 0.3 0.2 0.1<br />
86 69 38 Chikandi Union Total 15672 1.3 0.2 0.2 0.1 0.5 0.1 0.1<br />
86 69 47 Chitalia Union Total 14290 1.2 0.2 0.2 0.1 0.5 0.2 0.1<br />
86 69 57 Domsar Union Total 15580 1.2 0.2 0.2 0.1 0.4 0.2 0.1<br />
86 69 62 Mohammadpur Union Total 6565 1.7 0.2 0.5 0.1 0.6 0.1 0.2<br />
RMO: 1 = Rural, 2 = Urban and 3 = Other Urban<br />
Page 4 <strong>of</strong> 5
<strong>Table</strong> C-<strong>09</strong>: <strong>Percentage</strong> <strong>Distribution</strong> <strong>of</strong> <strong>Population</strong> <strong>by</strong> Type <strong>of</strong> disability, Residence and Community<br />
ZL UZ<br />
UN /<br />
WA<br />
1<br />
MZ /<br />
MH<br />
Vill RMO<br />
Administrative Unit<br />
Residence<br />
Community<br />
Total<br />
<strong>Population</strong><br />
Type <strong>of</strong> disability (%)<br />
All Speech Vision Hearing Physical Mental Autism<br />
2 3 4 5 6 7 8 9 10<br />
86 69 66 Palong Union Total 9154 1.2 0.2 0.2 0.1 0.4 0.2 0.0<br />
86 69 76 Rudrakar Union Total 24398 1.0 0.2 0.2 0.1 0.3 0.2 0.1<br />
86 69 85 Shaul Para Union Total 13844 1.0 0.2 0.2 0.1 0.2 0.1 0.2<br />
86 69 95 Tulasar Union Total 9514 1.0 0.3 0.2 0.0 0.4 0.1 0.0<br />
86 94 Zanjira Upazila Total 194019 1.3 0.2 0.3 0.1 0.4 0.2 0.1<br />
86 94 1 Zanjira Upazila 172768 1.3 0.2 0.3 0.1 0.4 0.2 0.1<br />
86 94 2 Zanjira Upazila 21251 1.5 0.2 0.3 0.1 0.6 0.2 0.1<br />
86 94 Zanjira Paurashava<br />
86 94 01 Ward No-01 Total 2551 0.5 0.1 0.1 0.0 0.2 0.2 0.0<br />
86 94 02 Ward No-02 Total 1602 0.4 0.0 0.1 0.0 0.0 0.3 0.0<br />
86 94 03 Ward No-03 Total 2554 3.4 0.4 0.4 0.2 2.0 0.3 0.1<br />
86 94 04 Ward No-04 Total 2957 1.7 0.2 0.1 0.2 0.8 0.3 0.0<br />
86 94 05 Ward No-05 Total 3255 1.1 0.1 0.2 0.1 0.3 0.2 0.1<br />
86 94 06 Ward No-06 Total 2458 1.5 0.4 0.2 0.2 0.2 0.4 0.1<br />
86 94 07 Ward No-07 Total 1037 5.4 0.5 1.7 0.6 2.4 0.1 0.1<br />
86 94 08 Ward No-08 Total 1783 0.7 0.1 0.2 0.1 0.2 0.2 0.0<br />
86 94 <strong>09</strong> Ward No-<strong>09</strong> Total 3054 0.7 0.2 0.1 0.0 0.1 0.1 0.1<br />
86 94 12 Bara Gopalpur Union Total 10580 1.4 0.2 0.4 0.1 0.5 0.2 0.1<br />
86 94 14 Barakandi Union Total 18559 0.9 0.2 0.1 0.1 0.2 0.1 0.1<br />
86 94 21 Bara Krishnagar Union Total 13101 1.3 0.2 0.2 0.2 0.5 0.2 0.1<br />
86 94 29 Bilaspur Union Total 14131 1.6 0.3 0.4 0.1 0.5 0.2 0.1<br />
86 94 43 Joynagar Union Total 14376 1.1 0.3 0.2 0.1 0.3 0.1 0.0<br />
86 94 51 Kunder Char Union Total 11263 1.2 0.2 0.3 0.2 0.3 0.1 0.1<br />
86 94 58 Mulna Union Total 15055 1.2 0.2 0.2 0.2 0.4 0.2 0.0<br />
86 94 65 Naodoba Union Total 19867 1.2 0.2 0.2 0.1 0.4 0.2 0.1<br />
86 94 73 Paler Char Union Total 12304 0.8 0.2 0.1 0.0 0.3 0.1 0.0<br />
86 94 80 Purba Naodoba Union Total 17036 1.0 0.1 0.2 0.1 0.3 0.1 0.1<br />
86 94 87 Sener Char Union Total 18878 1.6 0.2 0.4 0.2 0.6 0.1 0.1<br />
86 94 94 Zanjira Union Total 7618 3.6 0.3 1.2 0.6 1.1 0.3 0.2<br />
RMO: 1 = Rural, 2 = Urban and 3 = Other Urban<br />
Page 5 <strong>of</strong> 5