Implementation of data collection tools using NetFlow for statistical ...
Implementation of data collection tools using NetFlow for statistical ...
Implementation of data collection tools using NetFlow for statistical ...

You also want an ePaper? Increase the reach of your titles
YUMPU automatically turns print PDFs into web optimized ePapers that Google loves.
4 <strong>Implementation</strong><br />
This was what turned out to be the source <strong>of</strong> the long execution time; the query back to the<br />
<strong>data</strong>base. Although each file ([in], [out] and [attack]) only contained ~1100 rows each <strong>for</strong> a total <strong>of</strong><br />
little over 3330 entries, it also meant that the script had to send a query to the <strong>data</strong>base and check its<br />
reply 3300 times be<strong>for</strong>e it was done.<br />
Pseudo-code <strong>for</strong> the relevant section <strong>of</strong> the script:<br />
1. Loop through every line in every text file.<br />
2. For each row, take the AS and make a query back to the <strong>data</strong>base: Does this ISP already<br />
exist in the <strong>data</strong>base?<br />
3. If YES, there is an entry with the same AS – update the AS in question and sum together the<br />
values from the file and the value already present.<br />
4. If NO, there is no such record – create a new entry with the relevant in<strong>for</strong>mation about that<br />
particular ISP.<br />
Solution:<br />
Once the safety check to avoid duplicate ISP's was removed, the script executed in less than a<br />
second. Even if the scale up from ~48k routes to ~400k, almost ten times more routes, is linear it<br />
shouldn't pose a problem. Worst case scenario would be that the script would take ten times longer<br />
to execute, finishing in at about 10 seconds. Considering the <strong>data</strong> is refreshed every 60 seconds,<br />
there is plenty <strong>of</strong> time to spare.<br />
This is the preferred solution, despite there now being some duplicate ISP's in the <strong>data</strong>base. The<br />
solution to this is simply to let MySQL sum it together when the query <strong>for</strong> that in<strong>for</strong>mation is made.<br />
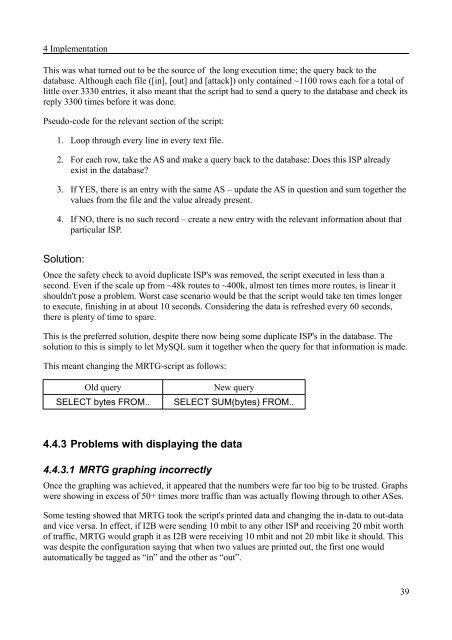
This meant changing the MRTG-script as follows:<br />
Old query New query<br />
SELECT bytes FROM.. SELECT SUM(bytes) FROM..<br />
4.4.3 Problems with displaying the <strong>data</strong><br />
4.4.3.1 MRTG graphing incorrectly<br />
Once the graphing was achieved, it appeared that the numbers were far too big to be trusted. Graphs<br />
were showing in excess <strong>of</strong> 50+ times more traffic than was actually flowing through to other ASes.<br />
Some testing showed that MRTG took the script's printed <strong>data</strong> and changing the in-<strong>data</strong> to out-<strong>data</strong><br />
and vice versa. In effect, if I2B were sending 10 mbit to any other ISP and receiving 20 mbit worth<br />
<strong>of</strong> traffic, MRTG would graph it as I2B were receiving 10 mbit and not 20 mbit like it should. This<br />
was despite the configuration saying that when two values are printed out, the first one would<br />
automatically be tagged as “in” and the other as “out”.<br />
39