Nitrogen distribution and potential nitrate leaching in a combined ...
Nitrogen distribution and potential nitrate leaching in a combined ...
Nitrogen distribution and potential nitrate leaching in a combined ...

Create successful ePaper yourself
Turn your PDF publications into a flip-book with our unique Google optimized e-Paper software.
content <strong>in</strong> the willow zones of the small <strong>and</strong> large paddocks (Fig 9a). The mean Nm<strong>in</strong> contents<br />
<strong>in</strong> the 0-25 cm <strong>and</strong> 25-75 cm soil layers <strong>in</strong> November are respectively more than 3 <strong>and</strong> 4<br />
times higher <strong>in</strong> the willow zones of the small paddocks compared to the willow zones of the<br />
large paddocks <strong>and</strong> the reference willow zones (Fig 9b). However, the means are not<br />
significantly different. In the 0-25 cm soil layer, the mean Nm<strong>in</strong> of the SP willow zones was<br />
significantly different from the other zones at 6 % level of significance. A high degree of<br />
variation was found <strong>in</strong> the soil Nm<strong>in</strong> <strong>in</strong> November compared to the other two measur<strong>in</strong>g<br />
periods. In April 2010 the mean Nm<strong>in</strong> content was significantly higher <strong>in</strong> the willow zones of<br />
the small paddocks, <strong>in</strong> the 0-25cm <strong>and</strong> 25-75cm soil layers compared to the other willow<br />
zones (Fig.9c). In the same soil layers there was no significant difference between the large<br />
willow zones <strong>and</strong> the reference willow zones.<br />
To sum up, the Nm<strong>in</strong> contents were <strong>in</strong> most cases not significantly different between the<br />
willow reference zones <strong>and</strong> contents <strong>in</strong> the soil of the large paddocks. Nm<strong>in</strong> contents varied<br />
considerably <strong>in</strong> the willow zones <strong>in</strong> November 2009.<br />
3.3 <strong>Nitrogen</strong> balance<br />
3.3.1 Water balance <strong>and</strong> <strong>potential</strong> <strong>nitrate</strong> <strong>leach<strong>in</strong>g</strong><br />
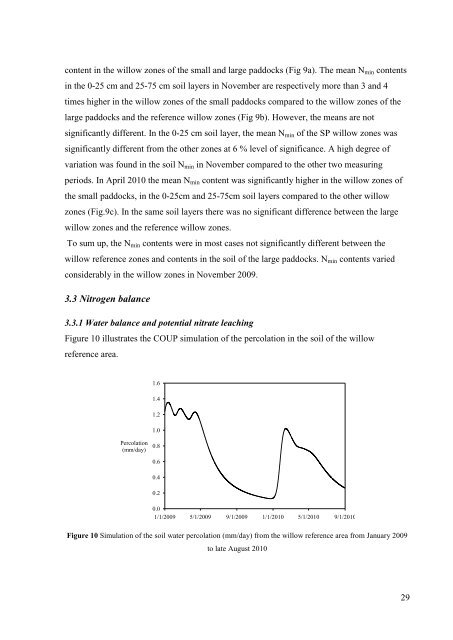
Figure 10 illustrates the COUP simulation of the percolation <strong>in</strong> the soil of the willow<br />
reference area.<br />
Percolation<br />
(mm/day)<br />
1.6<br />
1.4<br />
1.2<br />
1.0<br />
0.8<br />
0.6<br />
0.4<br />
0.2<br />
0.0<br />
1/1/2009 5/1/2009 9/1/2009 1/1/2010 5/1/2010 9/1/2010<br />
Figure 10 Simulation of the soil water percolation (mm/day) from the willow reference area from January 2009<br />
to late August 2010<br />
29