CHEMICAL WARFARE SIMULANTS - FLIR® Detection & Protection
CHEMICAL WARFARE SIMULANTS - FLIR® Detection & Protection
CHEMICAL WARFARE SIMULANTS - FLIR® Detection & Protection

Create successful ePaper yourself
Turn your PDF publications into a flip-book with our unique Google optimized e-Paper software.
<strong>CHEMICAL</strong> <strong>WARFARE</strong> <strong>SIMULANTS</strong><br />
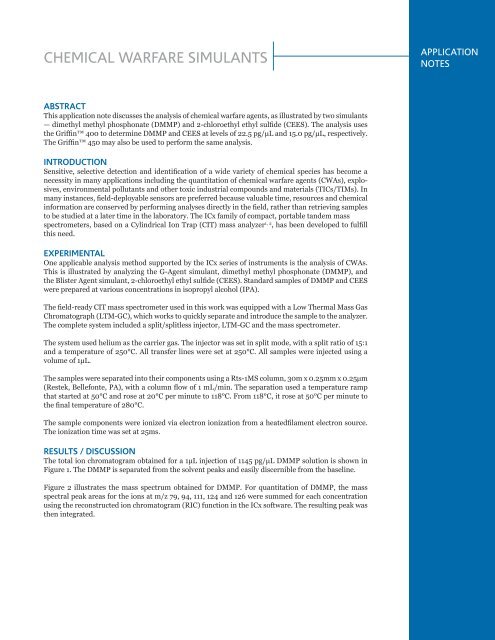
ABSTRACT<br />
This application note discusses the analysis of chemical warfare agents, as illustrated by two simulants<br />
— dimethyl methyl phosphonate (DMMP) and 2-chloroethyl ethyl sulfide (CEES). The analysis uses<br />
the Griffin 400 to determine DMMP and CEES at levels of 22.5 pg/μL and 15.0 pg/μL, respectively.<br />
The Griffin 450 may also be used to perform the same analysis.<br />
INTRODUCTION<br />
Sensitive, selective detection and identification of a wide variety of chemical species has become a<br />
necessity in many applications including the quantitation of chemical warfare agents (CWAs), explosives,<br />
environmental pollutants and other toxic industrial compounds and materials (TICs/TIMs). In<br />
many instances, field-deployable sensors are preferred because valuable time, resources and chemical<br />
information are conserved by performing analyses directly in the field, rather than retrieving samples<br />
to be studied at a later time in the laboratory. The ICx family of compact, portable tandem mass<br />
spectrometers, based on a Cylindrical Ion Trap (CIT) mass analyzer 1, 2 , has been developed to fulfill<br />
this need.<br />
EXPERIMENTAL<br />
One applicable analysis method supported by the ICx series of instruments is the analysis of CWAs.<br />
This is illustrated by analyzing the G-Agent simulant, dimethyl methyl phosphonate (DMMP), and<br />
the Blister Agent simulant, 2-chloroethyl ethyl sulfide (CEES). Standard samples of DMMP and CEES<br />
were prepared at various concentrations in isopropyl alcohol (IPA).<br />
The field-ready CIT mass spectrometer used in this work was equipped with a Low Thermal Mass Gas<br />
Chromatograph (LTM-GC), which works to quickly separate and introduce the sample to the analyzer.<br />
The complete system included a split/splitless injector, LTM-GC and the mass spectrometer.<br />
The system used helium as the carrier gas. The injector was set in split mode, with a split ratio of 15:1<br />
and a temperature of 250°C. All transfer lines were set at 250°C. All samples were injected using a<br />
volume of 1μL.<br />
The samples were separated into their components using a Rts-1MS column, 30m x 0.25mm x 0.25μm<br />
(Restek, Bellefonte, PA), with a column flow of 1 mL/min. The separation used a temperature ramp<br />
that started at 50°C and rose at 20°C per minute to 118°C. From 118°C, it rose at 50°C per minute to<br />
the final temperature of 280°C.<br />
The sample components were ionized via electron ionization from a heatedfilament electron source.<br />
The ionization time was set at 25ms.<br />
RESULTS / DISCUSSION<br />
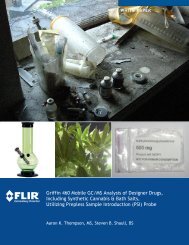
The total ion chromatogram obtained for a 1μL injection of 1145 pg/μL DMMP solution is shown in<br />
Figure 1. The DMMP is separated from the solvent peaks and easily discernible from the baseline.<br />
Figure 2 illustrates the mass spectrum obtained for DMMP. For quantitation of DMMP, the mass<br />
spectral peak areas for the ions at m/z 79, 94, 111, 124 and 126 were summed for each concentration<br />
using the reconstructed ion chromatogram (RIC) function in the ICx software. The resulting peak was<br />
then integrated.<br />
APPLICATION<br />
NOTES
Figure1: Total ion current trace for the DMMP solution<br />
Figure 2: Mass spectrum of DMMP<br />
The total ion chromatograph obtained for a 1μL injection of 1070 pg/μL CEES Solution is shown in Figure<br />
3. The CEES is well-separated from the solvent peaks and easily discernible from the baseline.<br />
Figure 4 illustrates the mass spectrum obtained for CEES. For quantitation of CEES, the mass spectral<br />
peak areas for the ions at m/z 75 and 124 were summed for each concentration using the reconstructed<br />
ion chromatogram (RIC) function in the Griffin system software. The resulting peak was then integrated.<br />
Figure 3: Total ion current trace for the CEES solution<br />
Figure 4: Mass spectrum of CEES
Figure 5 illustrates the calibration curve obtained for DMMP over the concentration range from 115pg/<br />
μL to 2290 pg/μL. This calibration curve, together with blank injections of IPA run under the conditions<br />
described previously, indicate a limit of detection (LOD) of 22.5pg/μL.<br />
Figure 6 illustrates the calibration curve obtained for CEES over the concentration range from 107pg/μL<br />
to 2140 pg/μL. This calibration curve, together with blank injections of IPA run under the conditions described<br />
previously, indicate a limit of detection (LOD) of 15.0pg/μL.<br />
Figure 5: Calibration curve obtained for DMMP over the concentration range 115 pg/μL<br />
Figure 6: Calibration curve obtained for CEES over the concentration range 107 pg/μL to 2140 pg/μL<br />
As this experiment illustrates, chemical warfare agents, as represented by the simulants DMMP and CEES,<br />
are detectable to low levels using the Griffin 400. Combining this low level of detection with the portability<br />
of the Griffin 400 creates a combination that can be used in varying areas and conditions for quick analysis<br />
of samples.<br />
These data represent typical results.<br />
References<br />
1. Wells, J.M.; Badman, E.R.; Cooks, R.G. Anal. Chem. 1998, 70, 438-444.<br />
2. Patterson, G.E.; Guymon, A.J.; Riter, L.S.; Everly, M.; Griep-Raming, J.; Laughlin, B.C.; Ouyang,<br />
Z.; Cooks, R.G. Anal. Chem. 2002, 74, 6145-6153.<br />
3000 Kent Avenue<br />
West Lafayette, IN<br />
47906<br />
T +1.888.775.1701<br />
www.icxt.com