Daimler Sustainability Report 2010 - Daimler Sustainability Report ...
Daimler Sustainability Report 2010 - Daimler Sustainability Report ...
Daimler Sustainability Report 2010 - Daimler Sustainability Report ...

You also want an ePaper? Increase the reach of your titles
YUMPU automatically turns print PDFs into web optimized ePapers that Google loves.
Energy consumption<br />
CO2 emissions<br />
Emissions<br />
into the atmosphere<br />
Waste volumes<br />
Water consumption<br />
Costs related<br />
to environmental<br />
protection<br />
Total<br />
Of which electricity<br />
Of which natural gas<br />
Of which district heating<br />
Of which fuel oil<br />
Of which liquefied petroleum gas (LPG)<br />
Of which coal<br />
Total<br />
Of which direct (Scope 1)<br />
Of which indirect (Scope 2)<br />
Solvents (VOC)<br />
Sulfur dioxide (SO2)<br />
Carbon monoxide (CO)<br />
Nitrogen oxides (NOX)<br />
Dust (total)<br />
Waste for disposal<br />
Waste for reuse (without scrap metal)<br />
Scrap metal for reuse<br />
Hazardous waste for disposal<br />
Hazardous waste for reuse<br />
Drinking water (externally supplied)<br />
Well water (derived on site)<br />
Surface water<br />
Investments<br />
Current expenditure<br />
R&D expenditure<br />
Environmental protection,<br />
innovation, and safety<br />
� 16 Group-wide data on production-related environmental protection<br />
Unit<br />
GWh<br />
GWh<br />
GWh<br />
GWh<br />
GWh<br />
GWh<br />
GWh<br />
1,000 t<br />
1,000 t<br />
1,000 t<br />
t<br />
t<br />
t<br />
t<br />
t<br />
1,000 t<br />
1,000 t<br />
1,000 t<br />
1,000 t<br />
1,000 t<br />
million m3 million m3 million m3 million €<br />
million €<br />
million €<br />
2007<br />
10,323<br />
4,608<br />
4,302<br />
976<br />
143<br />
114<br />
180<br />
3,739<br />
909<br />
2,830<br />
7,381<br />
51<br />
2,167<br />
884<br />
262<br />
79<br />
210<br />
801<br />
16<br />
60<br />
9.87<br />
5.48<br />
0.82<br />
86<br />
435<br />
1,418<br />
2008<br />
10,420<br />
4,579<br />
4,383<br />
1,025<br />
135<br />
101<br />
197<br />
3,611<br />
925<br />
2,686<br />
6,356<br />
37<br />
2,657<br />
938<br />
243<br />
69<br />
231<br />
751<br />
19<br />
60<br />
9.24<br />
5.31<br />
0.84<br />
74<br />
483<br />
1,799<br />
2009*<br />
8,631<br />
3,863<br />
3,473<br />
932<br />
115<br />
121<br />
127<br />
3,037<br />
743<br />
2,293<br />
4,275<br />
33<br />
2,148<br />
802<br />
186<br />
42<br />
149<br />
527<br />
24<br />
45<br />
7.11<br />
4.24<br />
0.61<br />
44<br />
373<br />
1,721<br />
The steep decline in the quantities of wastes is mostly due to the reduction in production volumes. The disposal of circulation fluids in the course<br />
of the changeover in painting processes nonetheless gave rise to a further increase in the quantity of hazardous wastes for disposal.<br />
The recycling rate for non-hazardous waste (without scrap) increased slightly to 78 percent. Expenditure related to environmental protection<br />
dropped in line with the business development. The rise in environmentally related R&D expenditures as a proportion of the total R&D expenditures<br />
(from 39 to 43 percent), however, underlines their increasing priority. (*2009 figures are provisional)<br />
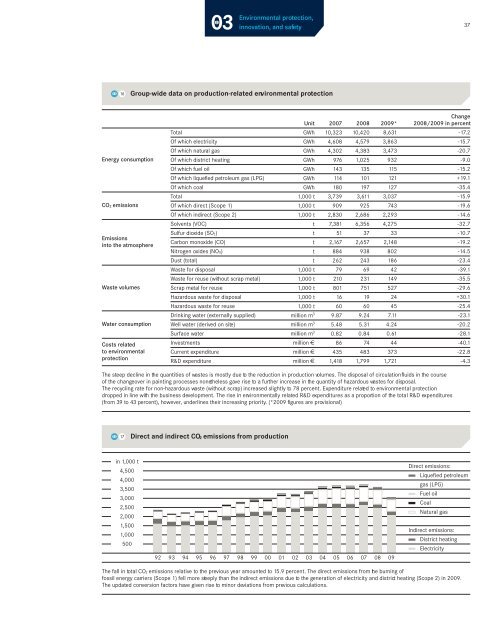
� 17 Direct and indirect CO2 emissions from production<br />
in 1,000 t<br />
4,500<br />
4,000<br />
3,500<br />
3,000<br />
2,500<br />
2,000<br />
1,500<br />
1,000<br />
500<br />
92 93 94 95 96 97 98 99 00 01 02 03 04 05 06 07 08 09<br />
37<br />
Change<br />
2008/2009 in percent<br />
-17.2<br />
-15.7<br />
-20.7<br />
-9.0<br />
-15.2<br />
+19.1<br />
-35.4<br />
-15.9<br />
-19.6<br />
-14.6<br />
-32.7<br />
-10.7<br />
-19.2<br />
-14.5<br />
-23.4<br />
-39.1<br />
-35.5<br />
-29.6<br />
+30.1<br />
-25.4<br />
-23.1<br />
-20.2<br />
-28.1<br />
-40.1<br />
-22.8<br />
-4.3<br />
Direct emissions:<br />
Liquefied petroleum<br />
gas (LPG)<br />
Fuel oil<br />
Coal<br />
Natural gas<br />
Indirect emissions:<br />
District heating<br />
Electricity<br />
The fall in total CO2 emissions relative to the previous year amounted to 15.9 percent. The direct emissions from the burning of<br />
fossil energy carriers (Scope 1) fell more steeply than the indirect emissions due to the generation of electricity and district heating (Scope 2) in 2009.<br />
The updated conversion factors have given rise to minor deviations from previous calculations.