

2005 - OPEC
2005 - OPEC
2005 - OPEC

Create successful ePaper yourself
Turn your PDF publications into a flip-book with our unique Google optimized e-Paper software.
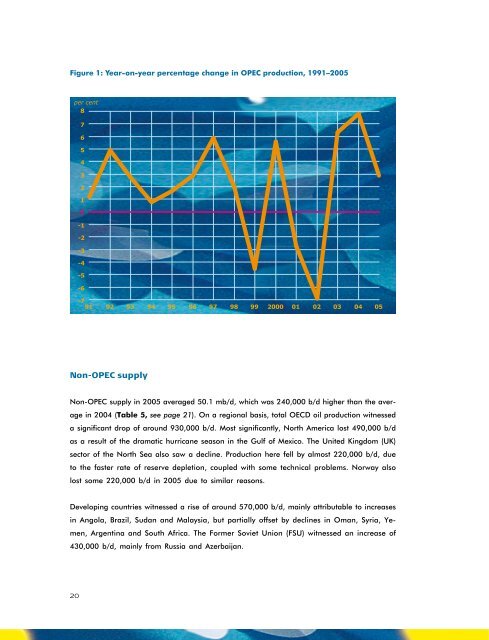
Figure 1: Year-on-year percentage change in <strong>OPEC</strong> production, 1991–<strong>2005</strong><br />
Non-<strong>OPEC</strong> supply<br />
Non-<strong>OPEC</strong> supply in <strong>2005</strong> averaged 50.1 mb/d, which was 240,000 b/d higher than the aver-<br />
age in 2004 (Table 5, see page 21). On a regional basis, total OECD oil production witnessed<br />
a significant drop of around 930,000 b/d. Most significantly, North America lost 490,000 b/d<br />
as a result of the dramatic hurricane season in the Gulf of Mexico. The United Kingdom (UK)<br />
sector of the North Sea also saw a decline. Production here fell by almost 220,000 b/d, due<br />
to the faster rate of reserve depletion, coupled with some technical problems. Norway also<br />
lost some 220,000 b/d in <strong>2005</strong> due to similar reasons.<br />
Developing countries witnessed a rise of around 570,000 b/d, mainly attributable to increases<br />
in Angola, Brazil, Sudan and Malaysia, but partially offset by declines in Oman, Syria, Ye-<br />
men, Argentina and South Africa. The Former Soviet Union (FSU) witnessed an increase of<br />
430,000 b/d, mainly from Russia and Azerbaijan.<br />
20


