ERGONOMÍA OCUPACIONAL - SOCIEDAD DE ERGONOMISTAS ...
ERGONOMÍA OCUPACIONAL - SOCIEDAD DE ERGONOMISTAS ...
ERGONOMÍA OCUPACIONAL - SOCIEDAD DE ERGONOMISTAS ...

You also want an ePaper? Increase the reach of your titles
YUMPU automatically turns print PDFs into web optimized ePapers that Google loves.
Ergonomía Ocupacional. Investigaciones y Aplicaciones. Vol 3 2010<br />
The impossibility to make a design for the whole population forces us to pick a segment<br />
which includes the data in between. Thus, highest and lowest values are left out and focus on the<br />
90% of the population. As a norm, the practical totality of anthropometric data is expressed in<br />
percentiles. In order to make this research more effective, population is broken into percentages<br />
categories, sorted from lowest to highest according to a specific body measure. For example, the<br />
first height percentile indicates that 99% of the individuals measured would be above this<br />
dimension. In the same way, a percentile of 95% in height would state that only 5% of the<br />
individuals measured would be over it, since the remaining 95% would be just as tall or shorter.<br />
(Panero, 1993).<br />
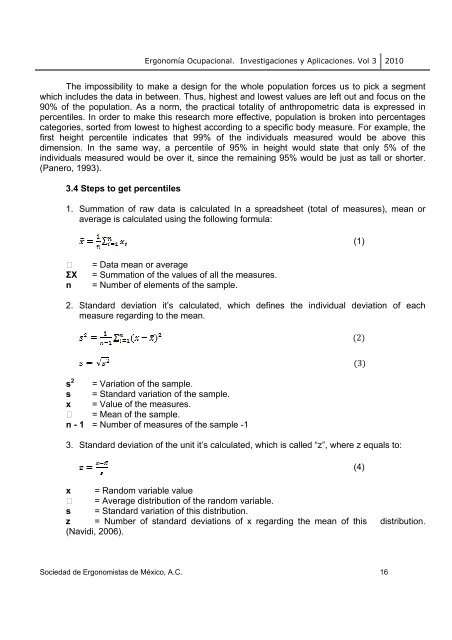
3.4 Steps to get percentiles<br />
1. Summation of raw data is calculated In a spreadsheet (total of measures), mean or<br />
average is calculated using the following formula:<br />
= Data mean or average<br />
ΣX = Summation of the values of all the measures.<br />
n = Number of elements of the sample.<br />
2. Standard deviation it’s calculated, which defines the individual deviation of each<br />
measure regarding to the mean.<br />
s 2 = Variation of the sample.<br />
s = Standard variation of the sample.<br />
x = Value of the measures.<br />
= Mean of the sample.<br />
n - 1 = Number of measures of the sample -1<br />
3. Standard deviation of the unit it’s calculated, which is called “z”, where z equals to:<br />
x = Random variable value<br />
= Average distribution of the random variable.<br />
s = Standard variation of this distribution.<br />
z = Number of standard deviations of x regarding the mean of this distribution.<br />
(Navidi, 2006).<br />
Sociedad de Ergonomistas de México, A.C. 16<br />
(1)<br />
2<br />
3<br />
(4)