ERGONOMÍA OCUPACIONAL - SOCIEDAD DE ERGONOMISTAS ...
ERGONOMÍA OCUPACIONAL - SOCIEDAD DE ERGONOMISTAS ...
ERGONOMÍA OCUPACIONAL - SOCIEDAD DE ERGONOMISTAS ...

You also want an ePaper? Increase the reach of your titles
YUMPU automatically turns print PDFs into web optimized ePapers that Google loves.
Ergonomía Ocupacional. Investigaciones y Aplicaciones. Vol 3 2010<br />
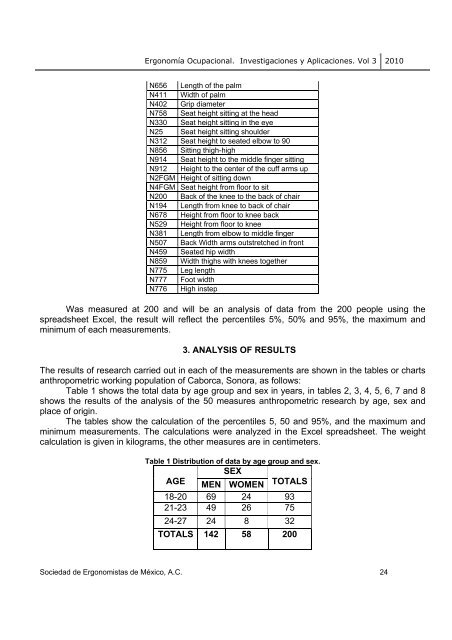
N656 Length of the palm<br />
N411 Width of palm<br />
N402 Grip diameter<br />
N758 Seat height sitting at the head<br />
N330 Seat height sitting in the eye<br />
N25 Seat height sitting shoulder<br />
N312 Seat height to seated elbow to 90<br />
N856 Sitting thigh-high<br />
N914 Seat height to the middle finger sitting<br />
N912 Height to the center of the cuff arms up<br />
N2FGM Height of sitting down<br />
N4FGM Seat height from floor to sit<br />
N200 Back of the knee to the back of chair<br />
N194 Length from knee to back of chair<br />
N678 Height from floor to knee back<br />
N529 Height from floor to knee<br />
N381 Length from elbow to middle finger<br />
N507 Back Width arms outstretched in front<br />
N459 Seated hip width<br />
N859 Width thighs with knees together<br />
N775 Leg length<br />
N777 Foot width<br />
N776 High instep<br />
Was measured at 200 and will be an analysis of data from the 200 people using the<br />
spreadsheet Excel, the result will reflect the percentiles 5%, 50% and 95%, the maximum and<br />
minimum of each measurements.<br />
3. ANALYSIS OF RESULTS<br />
The results of research carried out in each of the measurements are shown in the tables or charts<br />
anthropometric working population of Caborca, Sonora, as follows:<br />
Table 1 shows the total data by age group and sex in years, in tables 2, 3, 4, 5, 6, 7 and 8<br />
shows the results of the analysis of the 50 measures anthropometric research by age, sex and<br />
place of origin.<br />
The tables show the calculation of the percentiles 5, 50 and 95%, and the maximum and<br />
minimum measurements. The calculations were analyzed in the Excel spreadsheet. The weight<br />
calculation is given in kilograms, the other measures are in centimeters.<br />
Table 1 Distribution of data by age group and sex.<br />
SEX<br />
AGE MEN WOMEN TOTALS<br />
18-20 69 24 93<br />
21-23 49 26 75<br />
24-27 24 8 32<br />
TOTALS 142 58 200<br />
Sociedad de Ergonomistas de México, A.C. 24