Whitehorse Climate Change Adaptation Plan - Yukon College
Whitehorse Climate Change Adaptation Plan - Yukon College
Whitehorse Climate Change Adaptation Plan - Yukon College

You also want an ePaper? Increase the reach of your titles
YUMPU automatically turns print PDFs into web optimized ePapers that Google loves.
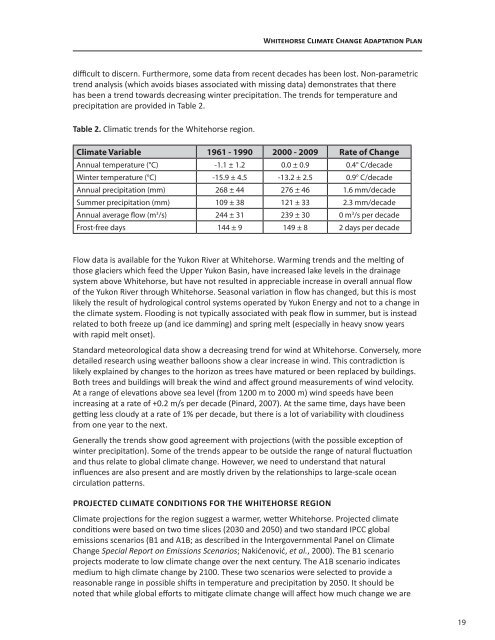
difficult to discern. Furthermore, some data from recent decades has been lost. Non-parametric<br />
trend analysis (which avoids biases associated with missing data) demonstrates that there<br />
has been a trend towards decreasing winter precipitation. The trends for temperature and<br />
precipitation are provided in Table 2.<br />
Table 2. Climatic trends for the <strong>Whitehorse</strong> region.<br />
Flow data is available for the <strong>Yukon</strong> River at <strong>Whitehorse</strong>. Warming trends and the melting of<br />
those glaciers which feed the Upper <strong>Yukon</strong> Basin, have increased lake levels in the drainage<br />
system above <strong>Whitehorse</strong>, but have not resulted in appreciable increase in overall annual flow<br />
of the <strong>Yukon</strong> River through <strong>Whitehorse</strong>. Seasonal variation in flow has changed, but this is most<br />
likely the result of hydrological control systems operated by <strong>Yukon</strong> Energy and not to a change in<br />
the climate system. Flooding is not typically associated with peak flow in summer, but is instead<br />
related to both freeze up (and ice damming) and spring melt (especially in heavy snow years<br />
with rapid melt onset).<br />
Standard meteorological data show a decreasing trend for wind at <strong>Whitehorse</strong>. Conversely, more<br />
detailed research using weather balloons show a clear increase in wind. This contradiction is<br />
likely explained by changes to the horizon as trees have matured or been replaced by buildings.<br />
Both trees and buildings will break the wind and affect ground measurements of wind velocity.<br />
At a range of elevations above sea level (from 1200 m to 2000 m) wind speeds have been<br />
increasing at a rate of +0.2 m/s per decade (Pinard, 2007). At the same time, days have been<br />
getting less cloudy at a rate of 1% per decade, but there is a lot of variability with cloudiness<br />
from one year to the next.<br />
Generally the trends show good agreement with projections (with the possible exception of<br />
winter precipitation). Some of the trends appear to be outside the range of natural fluctuation<br />
and thus relate to global climate change. However, we need to understand that natural<br />
influences are also present and are mostly driven by the relationships to large-scale ocean<br />
circulation patterns.<br />
PROJECTED CLIMATE CONDITIONS FOR THE WHITEHORSE REGION<br />
<strong>Whitehorse</strong> <strong>Climate</strong> <strong>Change</strong> <strong>Adaptation</strong> <strong>Plan</strong><br />
<strong>Climate</strong> Variable 1961 - 1990 2000 - 2009 Rate of <strong>Change</strong><br />
Annual temperature (°C) -1.1 ± 1.2 0.0 ± 0.9 0.4° C/decade<br />
Winter temperature (°C) -15.9 ± 4.5 -13.2 ± 2.5 0.9° C/decade<br />
Annual precipitation (mm) 268 ± 44 276 ± 46 1.6 mm/decade<br />
Summer precipitation (mm) 109 ± 38 121 ± 33 2.3 mm/decade<br />
Annual average flow (m3 /s) 244 ± 31 239 ± 30 0 m3 /s per decade<br />
Frost-free days 144 ± 9 149 ± 8 2 days per decade<br />
<strong>Climate</strong> projections for the region suggest a warmer, wetter <strong>Whitehorse</strong>. Projected climate<br />
conditions were based on two time slices (2030 and 2050) and two standard IPCC global<br />
emissions scenarios (B1 and A1B; as described in the Intergovernmental Panel on <strong>Climate</strong><br />
<strong>Change</strong> Special Report on Emissions Scenarios; Nakićenović, et al., 2000). The B1 scenario<br />
projects moderate to low climate change over the next century. The A1B scenario indicates<br />
medium to high climate change by 2100. These two scenarios were selected to provide a<br />
reasonable range in possible shifts in temperature and precipitation by 2050. It should be<br />
noted that while global efforts to mitigate climate change will affect how much change we are<br />
19