Reflex Country study - School of Business and Economics ...
Reflex Country study - School of Business and Economics ...
Reflex Country study - School of Business and Economics ...

Create successful ePaper yourself
Turn your PDF publications into a flip-book with our unique Google optimized e-Paper software.
Ree<br />
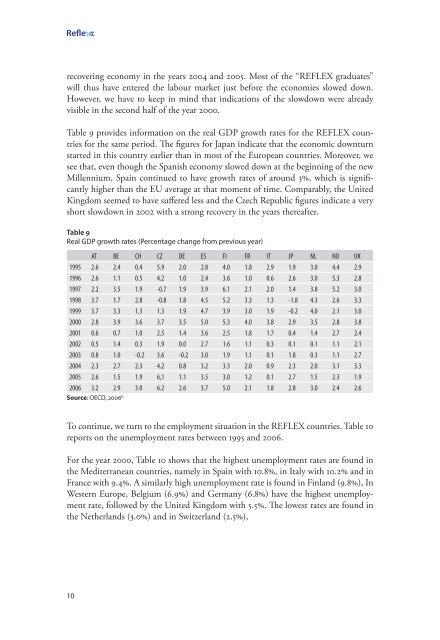
recovering economy in the years 2004 <strong>and</strong> 2005. Most <strong>of</strong> the “REFLEX graduates”<br />
will thus have entered the labour market just before the economies slowed down.<br />
However, we have to keep in mind that indications <strong>of</strong> the slowdown were already<br />
visible in the second half <strong>of</strong> the year 2000.<br />
Table 9 provides information on the real GDP growth rates for the REFLEX countries<br />
for the same period. The figures for Japan indicate that the economic downturn<br />
started in this country earlier than in most <strong>of</strong> the European countries. Moreover, we<br />
see that, even though the Spanish economy slowed down at the beginning <strong>of</strong> the new<br />
Millennium, Spain continued to have growth rates <strong>of</strong> around 3%, which is significantly<br />
higher than the EU average at that moment <strong>of</strong> time. Comparably, the United<br />
Kingdom seemed to have suffered less <strong>and</strong> the Czech Republic figures indicate a very<br />
short slowdown in 2002 with a strong recovery in the years thereafter.<br />
Table 9<br />
Real GDP growth rates (Percentage change from previous year)<br />
AT BE CH CZ DE ES FI FR IT JP NL NO UK<br />
1995 2.6 2.4 0.4 5.9 2.0 2.8 4.0 1.8 2.9 1.9 3.0 4.4 2.9<br />
1996 2.6 1.1 0.5 4.2 1.0 2.4 3.6 1.0 0.6 2.6 3.0 5.3 2.8<br />
1997 2.2 3.5 1.9 -0.7 1.9 3.9 6.1 2.1 2.0 1.4 3.8 5.2 3.0<br />
1998 3.7 1.7 2.8 -0.8 1.8 4.5 5.2 3.3 1.3 -1.8 4.3 2.6 3.3<br />
1999 3.7 3.3 1.3 1.3 1.9 4.7 3.9 3.0 1.9 -0.2 4.0 2.1 3.0<br />
2000 2.8 3.9 3.6 3.7 3.5 5.0 5.3 4.0 3.8 2.9 3.5 2.8 3.8<br />
2001 0.6 0.7 1.0 2.5 1.4 3.6 2.5 1.8 1.7 0.4 1.4 2.7 2.4<br />
2002 0.5 1.4 0.3 1.9 0.0 2.7 1.6 1.1 0.3 0.1 0.1 1.1 2.1<br />
2003 0.8 1.0 -0.2 3.6 -0.2 3.0 1.9 1.1 0.1 1.8 0.3 1.1 2.7<br />
2004 2.3 2.7 2.3 4.2 0.8 3.2 3.3 2.0 0.9 2.3 2.0 3.1 3.3<br />
2005 2.6 1.5 1.9 6,1 1.1 3.5 3.0 1.2 0.1 2.7 1.5 2.3 1.9<br />
2006 3.2 2.9 3.0 6.2 2.6 3.7 5.0 2.1 1.8 2.8 3.0 2.4 2.6<br />
Source: OECD, 2006 b<br />
To continue, we turn to the employment situation in the REFLEX countries. Table 0<br />
reports on the unemployment rates between 995 <strong>and</strong> 2006.<br />
For the year 2000, Table 0 shows that the highest unemployment rates are found in<br />
the Mediterranean countries, namely in Spain with 0.8%, in Italy with 0.2% <strong>and</strong> in<br />
France with 9.4%. A similarly high unemployment rate is found in Finl<strong>and</strong> (9.8%), In<br />
Western Europe, Belgium (6.9%) <strong>and</strong> Germany (6.8%) have the highest unemployment<br />
rate, followed by the United Kingdom with 5.5%. The lowest rates are found in<br />
the Netherl<strong>and</strong>s (3.0%) <strong>and</strong> in Switzerl<strong>and</strong> (2.5%),<br />
0