Fiscal Impact of Trade Liberalization: The Case of Jordan ... - Femise
Fiscal Impact of Trade Liberalization: The Case of Jordan ... - Femise
Fiscal Impact of Trade Liberalization: The Case of Jordan ... - Femise

You also want an ePaper? Increase the reach of your titles
YUMPU automatically turns print PDFs into web optimized ePapers that Google loves.
FEMISE RESEARCH PROGRAMME<br />
<strong>Fiscal</strong> <strong>Impact</strong> <strong>of</strong> <strong>Trade</strong> <strong>Liberalization</strong>:<br />
<strong>The</strong> <strong>Case</strong> <strong>of</strong> <strong>Jordan</strong> and Syria<br />
Pr<strong>of</strong>. Dr. Bernd Lucke<br />
University <strong>of</strong> Hamburg, Germany<br />
May 2001<br />
This text has been drafted with financial assistance from the Commission <strong>of</strong> the European Communities. <strong>The</strong> views<br />
expressed herein are those <strong>of</strong> the authors and therefore in no way reflect the <strong>of</strong>fical opinion <strong>of</strong> the Commission
Final Report<br />
<strong>Fiscal</strong> <strong>Impact</strong> <strong>of</strong> <strong>Trade</strong> <strong>Liberalization</strong>: <strong>The</strong> <strong>Case</strong> <strong>of</strong><br />
<strong>Jordan</strong> 1<br />
by<br />
Dorothea Lucke<br />
Lucke Consult, Winsen<br />
Germany<br />
May 2001<br />
Research Team:<br />
Dr. Dorothea Lucke, Lucke Consult, Winsen, Germany,<br />
Pr<strong>of</strong>. Dr. Bernd Lucke, University <strong>of</strong> Hamburg, Germany<br />
Anbara Abu-Ayyash, University <strong>of</strong> Hamburg, Germany.<br />
Introduction<br />
1 This work has benefited from a financial grant from the Commission <strong>of</strong> the European Communities within the<br />
context <strong>of</strong> the FEMISE program. <strong>The</strong> views expressed are those <strong>of</strong> the beneficiary and therefore in no way<br />
reflect the <strong>of</strong>ficial opinion <strong>of</strong> the Commission.
<strong>The</strong> Association Agreement between the European Union (EU) and <strong>Jordan</strong> has been signed on<br />
November 24, 1997. It includes provisions on political and security issues, specifies an<br />
economic and financial partnership as well as a partnership in social and human affairs. Our<br />
research project only treats the provisions on trade between the EU and <strong>Jordan</strong>.<br />
<strong>The</strong> Association Agreement aims at establishing an Euro-<strong>Jordan</strong>ian Free <strong>Trade</strong> Area in<br />
progressive steps by the year 2010. This covers trade <strong>of</strong> goods and services, capital<br />
movements, intellectual property rights and cooperation in all fields <strong>of</strong> the economy. Its<br />
provisions on the trade <strong>of</strong> goods and services are <strong>of</strong> main interest here. Important is the<br />
different treatment <strong>of</strong> trade in agricultural and industrial products.<br />
For industrial products the Agreement specifies that exports to the Community originating in<br />
<strong>Jordan</strong> shall be allowed free <strong>of</strong> customs duties. Imports to <strong>Jordan</strong> originating in the<br />
Community shall - with a few exceptions - be allowed free <strong>of</strong> customs duties after a<br />
transitional period <strong>of</strong> 12 years.<br />
As <strong>Jordan</strong>ian industrial exports could enter the EU without customs´ restrictions already by<br />
virtue <strong>of</strong> the General Cooperation Agreement between the EU and <strong>Jordan</strong> in 1977 and 1979,<br />
these provisions do hardly change the status quo <strong>of</strong> the <strong>Jordan</strong>ian exports. On the other hand,<br />
the implications for imports to <strong>Jordan</strong> may be large.<br />
For agricultural products, the Agreement specifies product specific regulations on <strong>Jordan</strong>ian<br />
exports to the Community concerning duties, quotas and timetables. However, no concessions<br />
have been made by <strong>Jordan</strong> for the import <strong>of</strong> agricultural commodities originating in the<br />
Community.<br />
Part I <strong>of</strong> this research project aims at quantifying the effects <strong>of</strong> the Association Agreement<br />
between the EU and <strong>Jordan</strong> on <strong>Jordan</strong>´s economy, in particular on the government budget. In<br />
the first three sections it describes the <strong>Jordan</strong>ian economy, starting with its structure in section<br />
1. Section 2 gives detailed information on <strong>Jordan</strong>´s external trade. In the third section <strong>Jordan</strong>´s<br />
indirect tax system is presented. <strong>The</strong>se features <strong>of</strong> the <strong>Jordan</strong>ian economy are then introduced<br />
into a computable general equilibrium (CGE) model which is described in a nonmathematical<br />
manner in section 4 and in analytical form in section 5. In section 6 the database for the<br />
simulations in the format <strong>of</strong> a social accounting matrix for the year 1998 is laid down. Section<br />
7 presents and explains the simulation results. In Part II, fiscal budget modifications which<br />
could help to overcome the loss <strong>of</strong> tariff revenues in the course <strong>of</strong> trade liberalization are<br />
discussed<br />
2
Part I<br />
1. <strong>The</strong> Structure <strong>of</strong> <strong>Jordan</strong>´s Economy<br />
<strong>The</strong> Kingdom <strong>of</strong> <strong>Jordan</strong> is a developing state with a population <strong>of</strong> about 4.8 million people in<br />
1998, growing at the rapid pace <strong>of</strong> 3.3 percent p.a. Almost 80 percent <strong>of</strong> the population is<br />
urban population. <strong>The</strong> total land area are 89.3 thousand square kilometers. Its gross domestic<br />
product (GDP) per capita was 1,565 $ in 1999 compared to 988 $ in Syria and 4,042 $ for<br />
Lebanon.<br />
After Abdullah Hussein ascended to the throne in 1999 a period <strong>of</strong> pr<strong>of</strong>ound economic reform<br />
began which aims at stabilizing the <strong>Jordan</strong>ian economy and giving impulse for higher growth<br />
rates in GDP 2 . <strong>The</strong> major reforms concerning industry are privatization <strong>of</strong> state enterprises<br />
and liberalization <strong>of</strong> foreign trade and capital movements. <strong>The</strong>se reforms will change the<br />
<strong>Jordan</strong>ian economy considerably during the next years.<br />
<strong>The</strong> (pre-reform) structure <strong>of</strong> <strong>Jordan</strong>´s economy can best be presented having first a look at its<br />
producing sectors and their weights in the economy in Table 1. In 1998, agriculture had a<br />
weight <strong>of</strong> 3.2 percent in GDP at factor costs. It has lost significance during the 1990s. 3<br />
Although the production <strong>of</strong> cereals is subsidized, <strong>Jordan</strong> is heavily dependent on imports <strong>of</strong><br />
all sorts <strong>of</strong> cereals. <strong>The</strong> irrigated area is not sufficient to prevent droughts as in 1999 from<br />
hitting agricultural output on a large scale. Agriculture accounted for 5.7 percent <strong>of</strong> total<br />
employment in 1999 4 which shows that its labor intensity is above average.<br />
2 Ministry <strong>of</strong> Finance, 2000.<br />
3 World Bank 1999.<br />
4 Data on the sectors´contribution to GDP at factor costs is not yet published for 1999 however, the only<br />
employment data which includes employment in agriculture and was available to us is from 1999.<br />
3
Table 1<br />
Gross Domestic Product at Factor Costs and Employment by Sector<br />
Sectors 1998 1999<br />
GDP at factor Weight in Weight in<br />
costs, in Mio. GDP at<br />
total<br />
J.D. factor costs, employment,<br />
percentages percentages<br />
Agriculture 141.7 3.2 5.7<br />
Mining and quarrying 169.7 3.9<br />
13.4<br />
Manufacturing 609.8 13.<br />
8<br />
Food, beverages and tobacco 137.5 3.1<br />
Textils, apparels and leather<br />
products<br />
38.2 0.9<br />
Wood, paper and printing 41.5 0.9<br />
Petroleum and chemicals 183.0 4.2<br />
Rubber and non-metallic<br />
minerals<br />
84.5 1.9<br />
Base metals and fabricated<br />
metal<br />
36.5 0.8<br />
Other manufactures 88.8 2.0<br />
5<br />
Electricity and water 119.9 2.7 1.5<br />
Construction 193.1 4.4 6.4<br />
<strong>Trade</strong> , restaurants and hotels 549.5 12.5 20.1<br />
Transport and Communications 704.4 16.0 10.8<br />
Finance; insurance , real estate<br />
and business services<br />
830.1 18.8 5.3<br />
Social and personal services 192 4.4<br />
31.4<br />
Government services 942.7 21.4<br />
6<br />
Imputed bank service charge -107.5 -2.4 -<br />
Total 4407.7 100 100<br />
Source: Department <strong>of</strong> Statistics, <strong>Jordan</strong><br />
Ministry <strong>of</strong> Planning, <strong>Jordan</strong>: <strong>Jordan</strong>ian Employment Breakdown by Sector,<br />
1999.<br />
<strong>Jordan</strong> has no significant oil resources and only modest reserves <strong>of</strong> natural gas. Thus most <strong>of</strong><br />
its energy demand is satisfied by imports. Mining and electricity production is mainly state<br />
owned but as part <strong>of</strong> its structural reforms the <strong>Jordan</strong>ian government aims at privatizing its<br />
firms. As a growing economy relies on sufficient energy supply, the government has been<br />
seeking ways to attract foreign capital to fund additional capacity. With the new Investment<br />
Promotion Law it already lifted most limits on foreign ownerhsip <strong>of</strong> formerly state-owned<br />
companies. 7<br />
Manufacturing had a weight <strong>of</strong> only 14 percent in GDP at factor cost in 1998. It had been<br />
expanding on average during the first half <strong>of</strong> the 1990s but then underwent sluggish growth as<br />
5 Data on employment is not further disaggregated.<br />
6 Data on employment and GDP are not disaggregated correspondingly: 31.4% includes education and health<br />
(16,1%) and public administration and defence (15.3%).<br />
7 Ministry <strong>of</strong> Planning, 2000.<br />
4
did the whole economy. In manufacturing, the chemical and petroleum industry has the<br />
highest weight (30 percent in 1998) and is responsible for about one fifth <strong>of</strong> <strong>Jordan</strong>´s<br />
domestic exports. <strong>The</strong> importance <strong>of</strong> this sector is due to the country´s large phosphate and<br />
potash industry which is state owned but now also earmarked for privatization.<br />
Manufacturing <strong>of</strong> textiles and apparels, now having a weight <strong>of</strong> only 6 percent in<br />
manufacturing is projected to gain importance. In recent years much investment has been<br />
done in the textil and apparel sector. First, as <strong>Jordan</strong> is not subject to quotas under the Multi<br />
Fiber Agreement, it is a favored location for investment <strong>of</strong> multinational textile firms. Second,<br />
since 1997 the Qualifying Industrial Zones (QIZ) program, which gives products under<br />
certain conditions duty free access to the U.S. market, promotes the textile and apparels<br />
industry. Third, those exports <strong>of</strong> textiles and apparels not qualifiying for the QIZ status,<br />
hindered until now by high US import tariffs, will pr<strong>of</strong>it by the already signed Free <strong>Trade</strong><br />
Agreement (FTA) between <strong>Jordan</strong> and the USA. 8 Similar impulses will be given by better<br />
access to the US market to <strong>Jordan</strong>´s jewelry and handicraft industry.<br />
<strong>Jordan</strong>´s light manufacturing and manufacturing <strong>of</strong> electrical goods is protected partly by very<br />
high import tariffs which generated a local import substitution assembly industry. Stronger<br />
competition on <strong>Jordan</strong>´s domestic market for these products when the FTA with the US<br />
comes into force could lead to a modernization <strong>of</strong> these industries.With competitiveness thus<br />
strengthened exports are likely to expand.<br />
<strong>The</strong> service sector had a weight <strong>of</strong> 53 percent in GDP at factor costs in 1998 and accounted<br />
for about 50 percent <strong>of</strong> <strong>Jordan</strong>´s total exports. Among the service sector, „finance, insurance,<br />
real estate and business services“ is most important, but did not develop well in recent years.<br />
„Transport and Communications“ , previously state dominated (e.g. Aquaba Railway, Royal<br />
<strong>Jordan</strong>ian, <strong>Jordan</strong> Telecommunications Company), is a focal point <strong>of</strong> the government´s<br />
privatization efforts.<br />
Even though tourism did not develop as well as had been hoped for after the peace treaty with<br />
Israel in 1994 9 , the sector „trade, restaurants and hotels“ experienced growth rates above<br />
average throughout the 1990s and travel accounted for almost 50 percent <strong>of</strong> exports in nonfactor<br />
services in 1998. Besides, the sector „ trade, restaurants and hotels“ is very labor<br />
intensive and thus together with its high growth rates most important for employment.<br />
2. External <strong>Trade</strong> <strong>of</strong> <strong>Jordan</strong><br />
2.1 External <strong>Trade</strong> <strong>of</strong> Goods<br />
2.1.1 Imports <strong>of</strong> Goods<br />
In 1998, <strong>Jordan</strong>´s imports <strong>of</strong> goods and non-factor services had a nominal value <strong>of</strong> 3608.7<br />
Mio. J.D which is 70 percent <strong>of</strong> GDP at market prices. In the years before, this percentage has<br />
been over 80 percent several times. About two thirds <strong>of</strong> these imports are imports <strong>of</strong> goods.<br />
<strong>Jordan</strong> presents its foreign trade with goods in the Harmonized Commodity and Coding<br />
System (H.S.). Table 2 shows the imports <strong>of</strong> the H.S. top level commoditiy aggregates<br />
disaggregated into regions <strong>of</strong> origin. In Table 3 the imports <strong>of</strong> the rest <strong>of</strong> the world (ROW) are<br />
8 Ruebner, 2000.<br />
9 EIA 2000.<br />
5
further disaggregated, listing the most important import countries or regions <strong>of</strong> the ROW with<br />
their imports explicitely.<br />
Table 2<br />
Imports <strong>of</strong> Goods<br />
Value C.I.F. in thousand J.D., 1998<br />
H.S. Commodity Description Total.<br />
from<br />
Code<br />
No.<br />
MENA EU ROW<br />
I Live animals; animal products 109753 18437 52439 38877<br />
II Vegetable products 310746 47045 12874 250826<br />
III Animal or vegetable fats and oils<br />
and their cleavage products; prepared<br />
edible fats; prepared animal<br />
or vegetable waxes<br />
57788 4375 7056 46356<br />
IV Prepared foodstuffs;beverages,<br />
spirits and vinegar; tobacco and<br />
manufactured tobacco substitutes<br />
155431 22116 60251 73064<br />
V Mineral products 272189 254948 13877 3364<br />
VI Products <strong>of</strong> the chemical or allied<br />
industries<br />
272169 36929 145787 89453<br />
VII Plastics and articles there<strong>of</strong>; rubber 121944<br />
and articles there<strong>of</strong><br />
44287 36514 41144<br />
VIII Raw hides and skins, leather,<br />
furskins and articles there<strong>of</strong>;<br />
saddlery and harness; travel goods.<br />
handbags and similiar containers;<br />
articles <strong>of</strong> animal gut (other than<br />
silk-worm gut)<br />
2150 440 53 1658<br />
IX Wood and articles <strong>of</strong> wood; wood<br />
charcoal; cork and articles <strong>of</strong> cork;<br />
manufactures <strong>of</strong> straw <strong>of</strong> esparto or<br />
<strong>of</strong> other plaiting materials;<br />
basketware and wickerwork<br />
32302 293 6523 25486<br />
X Pulp <strong>of</strong> wood or <strong>of</strong> other fibrous<br />
cellulosic material; waste and scrap<br />
<strong>of</strong> paper or paperboard; paper and<br />
paperboard and articles there<strong>of</strong><br />
75810 7763 31279 36768<br />
XI Textiles and textile articles 154817 23674 38344 92799<br />
XII Footwear, headgear, umbrellas,sun<br />
umbrellas, walking-sticks, seatsticks,<br />
whips, riding-crops and parts<br />
there<strong>of</strong>; prepared feathers and<br />
articles made therewith; artificial<br />
flowers; articles <strong>of</strong> human hair<br />
7026 154 2234 4639<br />
6
XIII Articles <strong>of</strong> stone,plaster, cement,<br />
asbestos mica or similar materials;<br />
ceramic products; glass and<br />
glassware<br />
XIV Natural or cultured pearls, precious<br />
or semi-precious stones, precious<br />
metals, metals clad with precious<br />
metal and articles there<strong>of</strong>; imitation<br />
jewellery;coin<br />
XV Base metals and articles <strong>of</strong> base<br />
metals<br />
XVI Machinery and mechanical<br />
appliances; electrical equipment;<br />
parts there<strong>of</strong>; sound recorders and<br />
reproducers, television image and<br />
sound recorders and reproducers,<br />
and parts and accessories <strong>of</strong> such<br />
articles<br />
XVII Vehicles, aircraft, vessels and<br />
associated transport equipment<br />
XVIII Optical,photographic, cinematographic,<br />
measuring, checking,<br />
precision, medical or surgical<br />
instruments and apparatus; clocks<br />
and watches; musical instruments;<br />
parts and accessories there<strong>of</strong><br />
XX Miscellaneous manufactured<br />
articles<br />
XXI Works <strong>of</strong> art, collectors’ pieces and<br />
antiques<br />
7<br />
35200 9053 13357 12790<br />
28803 950 8612 19241<br />
209910 35087 55575 119248<br />
397665 10054 215181 172430<br />
375703 448 150282 224972<br />
60608 33 28404 32172<br />
30026 4839 9259 15928<br />
51 0 24 26<br />
Unspecified 4283 0 21 4262<br />
Total 2714374 520926 887946 1305502<br />
Source:Department <strong>of</strong> Statistics, <strong>Jordan</strong> 2001. „External <strong>Trade</strong>“-Modul.
Table 3<br />
Imports <strong>of</strong> Goods from ROW<br />
Value C.I.F. in thousand J.D., 1998<br />
H.S. Commodity Discription Total<br />
Imports from<br />
Code (shortended)<br />
Imports India Turkey USA East<br />
No.<br />
<strong>of</strong> ROW<br />
Asia 10<br />
I Live animals; animal<br />
products<br />
38877 6956 29 1245 95<br />
II Vegetable products 250826 4815 64256 55401 6892<br />
III Animal or vegetable fats<br />
and oils<br />
46356 3 1963 11325 32151<br />
IV Prepared foodstuffs;<br />
beverages, tobacco<br />
73064 12970 4716 18293 9248<br />
V Mineral products 3364 57 102 1263 111<br />
VI Products <strong>of</strong> the chemical or<br />
allied industries<br />
89453 8556 4635 14773 21098<br />
VII Plastics and articles<br />
there<strong>of</strong>; rubber and articles<br />
there<strong>of</strong><br />
41144 1326 3937 2981 24704<br />
VIII Raw hides and skins,<br />
leather, furskins and<br />
articles there<strong>of</strong><br />
1658 28 19 55 627<br />
IX Wood and articles <strong>of</strong> wood;<br />
wood charcoal; cork;<br />
basketware and wickerwork<br />
25486 15 1233 763 13812<br />
X Pulp <strong>of</strong> wood or <strong>of</strong> other<br />
fibrous cellulosic material;<br />
waste and scrap <strong>of</strong> paper<br />
36768 1265 30 9710 8656<br />
XI Textiles and textile articles 92799 6763 10721 7981 44863<br />
XII Footwear, headgear,<br />
umbrellas,sun umbrellas,<br />
walking-sticks, seat-sticks,<br />
4639 3 406 87 3677<br />
XIII Articles <strong>of</strong> stone,plaster,<br />
glass cement, ceramic<br />
products<br />
12790 289 3153 817 6980<br />
XIV Natural or cultured pearls,<br />
precious or semi-precious<br />
stones, precious metals<br />
19241 77 22 12 393<br />
XV Base metals and articles <strong>of</strong><br />
base metals<br />
119248 1987 11140 7560 16074<br />
XVI Machinery and mechanical<br />
appliances; electrical<br />
equipment<br />
172430 1351 10023 48256 78375<br />
XVII Vehicles, aircraft, vessels 224972 1513 4339 61890 144058<br />
XVIII Optical, photographic<br />
instruments<br />
32172 564 410 11540 9076<br />
XX Miscellaneous<br />
manufactured articles<br />
15928 111 511 3416 8145<br />
10 China, Japan, Malaysia, Indonesia, South Korea and Thailand have been subsumed under East Asia.<br />
8
XXI Works <strong>of</strong> art, collectors’<br />
pieces and antiques<br />
26 0 4 135<br />
Unspecified 4262 2 700 0<br />
Total 1305502 48649 121648 258072 429171<br />
Source:Department <strong>of</strong> Statistics, <strong>Jordan</strong> 2001. „External <strong>Trade</strong>“-Modul.<br />
In Table 3, note the imports <strong>of</strong> vegetable products from the ROW. <strong>The</strong>se imports are mainly<br />
imports <strong>of</strong> wheat, garley, rice and other cereals and the by far largest importer in this<br />
commodity group is Turkey followed by the USA.<br />
<strong>The</strong> large imports <strong>of</strong> minerals are mostly oil imports as <strong>Jordan</strong> has no significant own energy<br />
sources. In 1998, <strong>Jordan</strong> purchased oil almost totally from Iraq which is possible because <strong>of</strong> a<br />
special exemption from the general U.N. embargo <strong>of</strong> Iraq. 11<br />
It is interesting to note that <strong>Jordan</strong>´s imports <strong>of</strong> textiles and articles there<strong>of</strong> are many times<br />
higher than the value added <strong>of</strong> the textile industry. <strong>Jordan</strong>´s textile industry is heavily<br />
dependent on imports <strong>of</strong> its inputs. <strong>The</strong>se stem to the largest part from East Asian Countries.<br />
With the prospected stronger growth in this sector the imports in this commodity group will<br />
further increase.<br />
<strong>The</strong> largest commodity groups in imports are the H.S. categories XVI and XVI. <strong>The</strong>se imports<br />
mainly come from the EU, the US and East Asian countries. <strong>The</strong>ir significance for the<br />
<strong>Jordan</strong>ian economy becomes obvious when compared to the domestic production in this field:<br />
In 1998, gross output <strong>of</strong> „other manufactures“ which corresponds approximately to the H.S.<br />
categories XVI – XXI, was 261 Mio. J.D.<br />
<strong>The</strong> just described picture <strong>of</strong> <strong>Jordan</strong>ian imports did not change very much in recent years.<br />
11 EIA, 2000.<br />
9
Table 4<br />
Imports <strong>of</strong> Goods by Economic Function 1999<br />
Commodity Groups Value C.I.F. in<br />
10<br />
000 J.D.<br />
Weights in total<br />
Total 2635206.9 1.00<br />
First : Consumer Good 782911.4 0.30<br />
A- Current Consumer Goods 539046.7 0.20<br />
- Foodstuffs 254071.8 0.10<br />
- Pharmaceutical Products 79776.0 0.03<br />
- Other Current Consumer Goods 205198.9 0.08<br />
B- Durable Consumer Goods 243864.7 0.09<br />
- Small Motor Vehicles For Passengers 162090.3 0.06<br />
- Other Durable Consumer Goods 81774.4 0.03<br />
Second : Crude Materials And Other<br />
1307320.0 0.50<br />
Intermediate Consumer Goods<br />
- Fuels Including Crude Petroleum 309881.6 0.12<br />
- Crude Potassium 44.4 0.00<br />
- Fertilizers 9711.7 0.00<br />
- Construction Materials 26969.5 0.01<br />
- Other Intermediate Goods 960712.9 0.36<br />
Third: Parts And Accessories 205750.9 0.08<br />
- Parts And Accessories Of Aircraft 73617.2 0.03<br />
- Parts And Accessories Of Transport Equipment<br />
Except Aircraft<br />
52722.4 0.02<br />
- Parts And Accessories Of Other Machines And<br />
Equipment<br />
79411.3 0.03<br />
Fourth: Capital Good 327865.6 0.12<br />
- Transport Equipment Except Small Motor<br />
Vehicles<br />
53016.9 0.02<br />
- Other Capital Goods Including Machinery’S And<br />
Equipment’S<br />
272555.6 0.10<br />
- Live Animals For Breeding 2293.2 0.00<br />
Fifth : Other Goods Not Classified Elsewhere In<br />
H.S.<br />
11358.9 0.00<br />
Source: Department <strong>of</strong> Statistics, <strong>Jordan</strong>. CD-ROM: External <strong>Trade</strong> 1999.<br />
Tables 4 and 5 confirm the strong dependence <strong>of</strong> <strong>Jordan</strong> from foreign intermediate inputs, oil<br />
and basic food stuffs.
Table 5<br />
<strong>The</strong> 10 Most Important Commodities in Imports 1998<br />
Commodity description H.S. Code No. Tariff rate 2000 Imports in<br />
Mio. J.D.<br />
Petroleum oils and oils obtained from<br />
bituminous minerals, crude.<br />
270900000 5% 180433<br />
Durum wheat 100110000 0 89851<br />
Medicaments, other 300490000 30% 55511<br />
Motor vehicles for the transportation <strong>of</strong><br />
goods, weight exceeding 5 tonnes but<br />
not exceeding 20 tonnes<br />
870422000 0 51096<br />
Barley 100300000 0 47367<br />
Ingots 720610000 5% 45452<br />
Maize other than seeds 100590000 5% 43812<br />
Parts <strong>of</strong> aeroplanes or helicopters, other 880330000 10% 40424<br />
Refined sugar 170199100 5% 35878<br />
Parts <strong>of</strong> powered and non-powered<br />
aircraft, other<br />
880390000 10% 32014<br />
Source: Department <strong>of</strong> Statistics, <strong>Jordan</strong>. CD-ROM: External <strong>Trade</strong> 1999.<br />
2.1.2 Exports <strong>of</strong> Goods and Sector Specific <strong>Trade</strong> Balances<br />
Since many years <strong>Jordan</strong> has a negative trade balance. As Table 6 shows it is a net importer in<br />
almost all top level goods categories. <strong>The</strong> significant exception are chemicals and products <strong>of</strong><br />
allied industries. Whereas on average <strong>Jordan</strong>´s industries export about 28 percent <strong>of</strong> their<br />
gross output, the chemical industry exports 40 percent <strong>of</strong> its gross output. However, to<br />
interpret these figures correctly it has to be said that 77 percent <strong>of</strong> the chemical industry´s<br />
gross output are inputs <strong>of</strong> other sectors. Thus, a large part <strong>of</strong> the chemical industry´s exports is<br />
actually value added <strong>of</strong> other sectors. Looking at the chemical industry´s most important<br />
export products makes this point more obvious: One half <strong>of</strong> its exports are fertilizers, mainly<br />
phosphates and potash. Most <strong>of</strong> the value <strong>of</strong> these products is value added <strong>of</strong> „mining and<br />
quarrying“.<br />
Table 6 shows that reexports were 18 percent <strong>of</strong> total exports in 1998. In the commodity<br />
aggregates machinery and vehicles total exports mainly consist <strong>of</strong> reexports. Thus, to evaluate<br />
which <strong>of</strong> <strong>Jordan</strong>´s sectors are export-oriented, domestic rather than total exports are relevant.<br />
11
H.S.<br />
Code<br />
No.<br />
Table 6<br />
Exports <strong>of</strong> Goods and <strong>Trade</strong> Balance<br />
Value in thousand J.D., 1998<br />
Commodity Description Domestic Export: Re-Export: Value<br />
(shortended) Value F.O.B. F.O.B.<br />
12<br />
Balance (Total<br />
Export - Import):<br />
I Live animals; animal products 45105 4509 -60140<br />
II Vegetable products 102163 9339 -199244<br />
III Animal or vegetable fats and<br />
oils<br />
56329 2526 1068<br />
IV Prepared foodstuffs;<br />
beverages, tobacco<br />
25452 7630 -122349<br />
V Mineral products 161697 5770 -104721<br />
VI Products <strong>of</strong> the chemical or<br />
allied industries<br />
415810 25860 169501<br />
VII Plastics and articles there<strong>of</strong>;<br />
rubber and articles there<strong>of</strong><br />
28863 6230 -86850<br />
VIII Raw hides and skins, leather,<br />
furskins and articles there<strong>of</strong><br />
1738 655 244<br />
IX Wood and articles <strong>of</strong> wood;<br />
wood charcoal; cork;<br />
basketware and wickerwork<br />
216 650 -31436<br />
X Pulp <strong>of</strong> wood or <strong>of</strong> other<br />
fibrous cellulosic material;<br />
waste and scrap <strong>of</strong> paper<br />
41333 4451 -30026<br />
XI Textiles and textile articles 57037 11900 -85880<br />
XII Footwear, headgear,<br />
umbrellas,sun umbrellas,<br />
walking-sticks, seat-sticks,<br />
9675 1380 4029<br />
XIII Articles <strong>of</strong> stone,plaster, glass<br />
cement, ceramic products<br />
11594 2724 -20881<br />
XIV Natural or cultured pearls,<br />
precious or semi-precious<br />
stones, precious metals<br />
5175 1404 -22224<br />
XV Base metals and articles <strong>of</strong><br />
base metals<br />
26135 13248 -170527<br />
XVI Machinery and mechanical<br />
appliances; electrical<br />
equipment<br />
37900 54703 -305062<br />
XVII Vehicles, aircraft, vessels 7494 63588 -304620<br />
XVIII Optical, photographic<br />
instruments<br />
1812 9305 -49492<br />
XX Miscellaneous manufactured<br />
articles<br />
10551 5070 -14405<br />
XXI Works <strong>of</strong> art, collectors’<br />
pieces and antiques<br />
302 109 361<br />
Unspecified 2 436 -3818<br />
Total 1046382 231517 -1436475<br />
Source: Department <strong>of</strong> Statistics, <strong>Jordan</strong> 2001.
Note the exports <strong>of</strong> vegetables which go mainly to MENA countries. <strong>The</strong> large exports <strong>of</strong><br />
minerals and chemicals are further described by Table 7 where domestic exports are presented<br />
according to their economic function.<br />
Table 7<br />
Domestic Exports, Value F.O.B in 000 J.D., 1999<br />
Commodity Groups Value Weight in total<br />
Total 1051353.5 1.00<br />
First : Consumer Good 417622.1 0.40<br />
A- Current Consumer Goods 379893.9 0.36<br />
- Foodstuffs 135401.2 0.13<br />
- Pharmaceutical Products 100653.2 0.10<br />
- Other Current Consumer Goods 143839.4 0.14<br />
B- Durable Consumer Goods 37728.2 0.04<br />
- Small Motor Vehicles For Passengers 0.5 0.00<br />
- Other Durable Consumer Goods 37727.7 0.04<br />
Second : Crude Materials And Other Intermediate 591851.0 0.56<br />
Consumer Goods<br />
- Fuels Including Crude Petroleum 70.8 0.00<br />
- Crude Phosphates 115165.2 0.11<br />
- Crude Potassium 125955.9 0.12<br />
- Fertilizers 78316.0 0.07<br />
- Construction Materials 32851.8 0.03<br />
- Other Intermediate Goods 239491.3 0.23<br />
Third: Parts And Accessories 6528.9 0.01<br />
- Parts And Accessories Of Transport Equipment Except<br />
Aircraft<br />
1880.1 0.00<br />
- Parts And Accessories Of Other Machines And Equipment 4648.8 0.00<br />
Fourth: Capital Good 35264.5 0.03<br />
- Transport Equipment Except Small Motor Vehicles 9508.8 0.01<br />
- Other Capital Goods Including Machinery’S And<br />
Equipment’S<br />
25674.9 0.02<br />
- Live Animals For Breeding 80.8 0.00<br />
Fifth : Other Goods Not Classified Elsewhere In H.S. 87.0 0,00<br />
Source: Department <strong>of</strong> Statisitcs, <strong>Jordan</strong>.CD-ROM:External <strong>Trade</strong> <strong>of</strong> <strong>Jordan</strong> 1999<br />
Table 7 shows that the chemical industry not only has a strong position in exporting<br />
intermediate goods but also that their exports <strong>of</strong> pharmaceuticals (which are mostly consumer<br />
goods) are also considerable.<br />
Besides, Table 7 shows that <strong>Jordan</strong>´s exports do largely depend on its natural endowment with<br />
phosphates and potash and are ins<strong>of</strong>ar not supported by a broad industrial basis.<br />
13
Table 8<br />
Domestic Exports <strong>of</strong> Goods minus Imports <strong>of</strong> Goods versus Different Regions<br />
Value in thousand J.D., 1998<br />
Code Commodity_Description<br />
versus<br />
14<br />
MENA EU ROW<br />
I Live animals; animal products 25582 -52412 -37818<br />
II Vegetable products 48639 -8512 -248710<br />
III Animal or vegetable fats and oils 51818 -7045 -46232<br />
-7320 -56931 -65728<br />
IV Prepared foodstuffs; beverages,<br />
tobacco<br />
V Mineral products -222314 10182 101641<br />
118924 -127938 152654<br />
VI Products <strong>of</strong> the chemical or allied<br />
industries<br />
VII Plastics and articles there<strong>of</strong>; rubber<br />
and articles there<strong>of</strong><br />
VIII Raw hides and skins, leather,<br />
furskins and articles there<strong>of</strong><br />
IX Wood and articles <strong>of</strong> wood; wood<br />
charcoal; cork; basketware and<br />
wickerwork<br />
X Pulp <strong>of</strong> wood or <strong>of</strong> other fibrous<br />
cellulosic material; waste and scrap<br />
<strong>of</strong> paper<br />
-27391 -36149 -29540<br />
-169 -17 -226<br />
-171 -6523 -25393<br />
7986 -26653 -15810<br />
XI Textiles and textile articles -12100 -28229 -57451<br />
3321 -2234 1561<br />
XII Footwear, headgear, umbrellas,sun<br />
umbrellas, walking-sticks, seatsticks,<br />
XIII Articles <strong>of</strong> stone,plaster, glass<br />
cement, ceramic products<br />
XIV Natural or cultured pearls, precious<br />
or semi-precious stones, precious<br />
metals<br />
XV Base metals and articles <strong>of</strong> base<br />
metals<br />
XVI Machinery and mechanical<br />
appliances; electrical equipment<br />
373 -13350 -10628<br />
-896 -8611 -14121<br />
-18482 -53045 -112248<br />
6817 -214735 -151847<br />
XVII Vehicles, aircraft, vessels 2155 -150236 -220127<br />
XVIII Optical, photographic instruments 1343 -28393 -31746<br />
XX Miscellaneous manufactured articles 400 -9017 -10859<br />
111 -23 163<br />
XXI Works <strong>of</strong> art, collectors’ pieces and<br />
antiques<br />
Unspecified 0 -21 -4260<br />
Total -21373 -819893 -826725<br />
Source: Department <strong>of</strong> Statistics, <strong>Jordan</strong> 2001.<br />
<strong>Jordan</strong> is a net importer versus all three regions. Versus the EU, <strong>Jordan</strong> has no significant<br />
positive trade balance for any <strong>of</strong> the disaggregated product groups. Even the trade balance<br />
with chemicals is negative. <strong>The</strong> high exports <strong>of</strong> the chemical industry go mainly to MENA
and ROW. Versus the ROW the positive trade balances in trade with minerals – (H.S. 25: salt,<br />
sulphur, earth and stone, plastering materials, lime , cement) and chemicals ( H.S. 31:<br />
fertilizers) are remarkable.<br />
2.2 External <strong>Trade</strong> in Services<br />
<strong>Trade</strong> in services is documented in the balance <strong>of</strong> payments and is distinguished between<br />
trade with non-factor services and trade with factor services. <strong>Jordan</strong>´s balance <strong>of</strong> trade in nonfactor<br />
services is positive since many years. 12 For one, this is due to the positive balance in<br />
travel. Unfortunately, in the balance <strong>of</strong> payments the service account is presented only at a<br />
highly aggregated level. Thus a significant surplus in the balance <strong>of</strong> non-factor services is<br />
summarized under the heading „other services“.<br />
<strong>Trade</strong> in factor services consists on the one hand on workers remittances and on the other<br />
hand on investment income. Workers‘ remittances to <strong>Jordan</strong> is labor income <strong>of</strong> <strong>Jordan</strong>ians<br />
working abroad. If these <strong>Jordan</strong>ians are still residents <strong>of</strong> <strong>Jordan</strong> the remittances are added to<br />
GDP to get GNP. In the case <strong>of</strong> <strong>Jordan</strong>, workers remittances is mainly labor income earned<br />
abroad by non-residents. <strong>The</strong> balance <strong>of</strong> investment income is negative since many years.<br />
This is not surprising as <strong>Jordan</strong> experiences a large capital inflow because <strong>of</strong> its usually<br />
negative trade balances. <strong>The</strong> efforts <strong>of</strong> the government to attract foreign direct investment in<br />
the course <strong>of</strong> privatization will most likely further increase <strong>Jordan</strong>´s net payments <strong>of</strong><br />
investment income to foreign countries.<br />
3. Indirect Taxation in <strong>Jordan</strong><br />
3.1 Import Tariffs<br />
<strong>Jordan</strong> levies import duties on goods but not on services. 13 <strong>The</strong> tariff rates are actually at 0, 5,<br />
10, 20, and 30 percent <strong>of</strong> the goods´ value. In only a few cases the tariff rate is based on the<br />
quantity <strong>of</strong> the imported goods. Imports that are intended for reexportation are not charged<br />
with tariffs. However, it is not possible to separate those imports going to be reexported from<br />
total imports because imports and corresponding reexports do not necessarily fall into the<br />
same year. Thus reexports in many H.S. categories are higher than the imports <strong>of</strong> the same<br />
year.<br />
<strong>The</strong>re is - to our knowledge – no evidence <strong>of</strong> significant non-tariff barriers in <strong>Jordan</strong>.<br />
Since 1997 <strong>Jordan</strong> has shown great interest in liberalizing its external trade. It has signed free<br />
trade agreements with several countries and regions. A small scale start was in 1997, when the<br />
Qualifying Industrial Zones (QIZ) program among <strong>Jordan</strong>, Israel and the USA came into<br />
force. Under this legislation, products with a certified minimum content <strong>of</strong> <strong>Jordan</strong>ian and<br />
Israeli inputs that are manufactured in specially designated qualifying industrial zones are<br />
eligible for unilateral duty-free access to the U.S. market.<br />
In order to be admitted to the World <strong>Trade</strong> Organization (WTO) <strong>Jordan</strong> had to cut its tariff<br />
rates until 1998 to a maximum <strong>of</strong> 40 percent for all trading partners and has to end up with a<br />
maximum tariff rate <strong>of</strong> 20 percent by 2010. 14 After further reductuions in 1999 and 2000 the<br />
12 Department <strong>of</strong> Statisitics, 2000.<br />
13 Custom´s Department, <strong>Jordan</strong>: <strong>The</strong> <strong>Jordan</strong>ian Customs Tariff.<br />
14 <strong>Jordan</strong> became member <strong>of</strong> the WTO on April 12 th ,2000.<br />
15
maximum tariff rate is now at 30 percent. Besides, <strong>Jordan</strong> signed the Arab Free <strong>Trade</strong><br />
Agreement in 1998 which came into force the same year. For all member states 15 , it enforces<br />
a stepwise reduction <strong>of</strong> import tariffs from 1998 until 2007 such that each year all tariff rates<br />
have to be reduced by ten percent <strong>of</strong> the 1998 rate. Until November 2000, <strong>Jordan</strong>´s Ministry<br />
<strong>of</strong> Finance estimated the costs <strong>of</strong> lower import duties at 17 million JD. This amounts to 0.3<br />
percent <strong>of</strong> GDP estimated for 2000.<br />
In 2000, <strong>Jordan</strong> started negotiations on a Free <strong>Trade</strong> Agreement (FTA) with the USA. <strong>The</strong><br />
proposed FTA would eventually extend reciprocal duty-free treatment to all products traded<br />
between the two countries.<br />
Finally, there is the Association Agreement between <strong>Jordan</strong> and the European Union which<br />
has been signed in 1997 but which, pending ratification, did not yet come into force. As<br />
described in the introduction it aims at establishing an Euro-<strong>Jordan</strong>ian Free <strong>Trade</strong> Area in<br />
progressive steps by the year 2010. Industrial products originating in the Community shall -<br />
with a few exceptions - be allowed to enter <strong>Jordan</strong> free <strong>of</strong> customs duties after a transitional<br />
period <strong>of</strong> 12 years. Imports <strong>of</strong> agricultural products from the EU will still be charged with<br />
duties.<br />
To calculate import-weighted tariff rates by commodity groups and regions the actual tariff<br />
rates have to be weighted with the corresponding import values for each commodity and<br />
region. In principle, only the value <strong>of</strong> those imports staying in <strong>Jordan</strong> is relevant. However, as<br />
explained above, reexports cannot be assigned to the corresponding imports. <strong>The</strong>refore, we<br />
use the total import value for calculating the weighted import tariffs such that the exemption<br />
<strong>of</strong> reexports from tariffs lowers the average weighted tariff rates rather than the tariff base. As<br />
data on external trade were not yet available for 1999, import data <strong>of</strong> 1998 has been used for<br />
these calculations. 16 Besides, it has to be noted that the tariff revenue resulting from<br />
multiplying the actual tariff rates by the corresponding import values exceeds the collected<br />
tariff revenues because <strong>of</strong> exemptions. Thus the average import-weighted tariff rate is 12.8<br />
percent whereas the effective average tariff rate is 10.9 percent.<br />
<strong>The</strong> weighted import tariff rates presented in Table 9 show the burden <strong>of</strong> taxed commodity<br />
categories for the three regions.<br />
15 Members are all arab states, including Sudan and Iraq, excluding Turkey and Iran.<br />
16 This proceeding is supported by <strong>Jordan</strong>´s customs department.<br />
16
Table 9<br />
Weighted Import Tariff Rates by Regions and Commodity Groups<br />
Weighted import tariffs for<br />
Commodity groups MENA EU ROW<br />
Agriculture 0.14 0.18 0.06<br />
Mining and quarrying 0.06 0.20 0.11<br />
Food, beverages,<br />
tobacco<br />
0.25 0.20 0.19<br />
Textils, apparels,<br />
leather products<br />
0.20 0.17 0.20<br />
Wood, paper, and<br />
printing<br />
0.17 0.12 0.06<br />
Petroleum and<br />
chemicals<br />
0.09 0.08 0.09<br />
Rubber and nonmetallic<br />
minerals<br />
0.07 0.15 0.18<br />
Base metals and 0.13 0.16 0.11<br />
fabricated metal<br />
Other manufactures 0.18 0.14 0.16<br />
Average 0.10 0.14 0.13<br />
Source: Department <strong>of</strong> Statistics, <strong>Jordan</strong> 1999. External <strong>Trade</strong> Statistics.<br />
Weighted import tariffs range from 6 percent to 20 percent. <strong>The</strong> differences in the<br />
weighted import tariffs <strong>of</strong> the three regions within a commodity group show that the<br />
composition <strong>of</strong> imports differs quite considerably among regions. Averaged over all<br />
imports, MENA countries face the lowest import tariffs. However, the weighted import<br />
tariffs <strong>of</strong> MENA countries are not minimal for each commodity group.<br />
3.2 Sales Taxes<br />
General Sales Tax<br />
<strong>The</strong> main indirect tax is the General Sales Tax (GST) laid down in the General Sales Tax Law<br />
No. 6 1994. It specifies that the value <strong>of</strong> taxable local or imported goods and services shall be<br />
taxable. <strong>The</strong> taxable value <strong>of</strong> imported goods is the cif value plus duty. Locally produced or<br />
imported goods and services which are going to be exported are not charged with GST. This<br />
conforms with the international practice that such exports are taxed by the importing country.<br />
<strong>The</strong> GST rate has been raised in 1999 from 10 percent to 13 percent to compensate for the<br />
loss <strong>of</strong> tariff revenues. Until now the GST is not a value added tax, but about 50 percent <strong>of</strong> the<br />
taxes on intermediate inputs can be deducted from the own tax load. No sales tax is levied on<br />
agriculture, trade, construction, social and private services and on government services. In<br />
addition, there is a long list <strong>of</strong> goods exempted from GST. 17 Until now this list has almost<br />
remained untouched. Also, several imported goods are not charged with GST. To further<br />
17 According to sectoral data <strong>of</strong> <strong>Jordan</strong>´s Department <strong>of</strong> Statistics further exemptions cause that also the sectors<br />
electricity and water, transport, storage and communications and real estate are hardly paying indirect taxes.<br />
17
fulfill the WTO membership requirements, GST rates on domestic and imported goods are<br />
going to be harmonized. 18<br />
<strong>The</strong>re is a list <strong>of</strong> goods, produced locally or imported, which are taxed at a rate <strong>of</strong> 20 percent<br />
<strong>of</strong> their value, e.g. photographic films, air conditioners, perfumes, wallpaper, video cameras,<br />
fireworks and microwave ovens.<br />
Supplementary Sales Tax<br />
<strong>The</strong> supplementary sales tax took effect in August 1999 and was introduced to make up for<br />
tariff revenues lost in the course <strong>of</strong> trade liberalization. First, it is levied on those imported<br />
goods which had been charged with tariff rates ranging from 50 to 180 percent before 1998 19<br />
In these cases the supplementary sales tax rate has to be equal to the reduction <strong>of</strong> the tariff<br />
rate <strong>of</strong> that good since 1998. Second, it specifies three groups <strong>of</strong> goods, locally produced or<br />
imported, which have to be charged at a rate less than or equal to the reduction <strong>of</strong> the relevant<br />
tariff rate. <strong>The</strong> supplementary sales tax is planned to be abolished in 2001.<br />
Specific Sales Tax<br />
Attached to the General Sales Tax Law is a schedule <strong>of</strong> goods, imported or locally produced,<br />
e.g. carbonated beverages, alcoholic beverages, cigarettes, cement, iron and mineral oils,<br />
which are charged with specific sales taxes. <strong>The</strong>se taxes are based on the type, size, weight or<br />
unit <strong>of</strong> the taxable goods. In several cases the tax rates on imported and locally produced<br />
goods differ.<br />
Sales taxes come on top <strong>of</strong> import duties and must not be considered as „tariff equivalent“<br />
under the EU association agreement.<br />
<strong>Jordan</strong>´s revenues from indirect taxes amounted to 719.0 Mio. J.D. in 1998 and are estimated<br />
at 834 Mio. J.D. in 2000. <strong>The</strong> share <strong>of</strong> customs duties in indirect tax revenues has fallen from<br />
40 percent in 1998 to (estimated) 34 percent in 2000. Sales tax revenues on imported goods<br />
are estimated to remain approximately constant at around 26 percent during this time. In<br />
contrast to the lower tax revenues from foreign trade transactions in 2000, sales tax revenues<br />
on domestic transactions are estimated to increase from 32 percent <strong>of</strong> total indirect tax<br />
revenues to 37 percent in 2000. This shift <strong>of</strong> tax burden from imports to domestic transactions<br />
is a consequence <strong>of</strong> the starting trade liberalization and the fiscal budget reform described<br />
above.<br />
Table 10 shows the effective average tax rates <strong>of</strong> the main indirect taxes and - in case <strong>of</strong><br />
the GST on domestic transactions - also on the level <strong>of</strong> sectors.<br />
18 Ministry <strong>of</strong> Finance, 2000.<br />
19 <strong>The</strong>se goods are natural, mineral and carbonated water including soda water, carbonated beverages, beer,<br />
including non-alcoholic, wine, liquors, tobacco and tobacco products. (Schedule 5 attached to the General Sales<br />
Tax Law No.6 <strong>of</strong> 1994.)<br />
18
Table 10<br />
Effective Indirect Tax Rates, percentages<br />
Sectors GST rates on domestic transactions<br />
Agriculture 0.5<br />
Mining and quarrying 12.6<br />
Food, beverages and tobacco 13.0<br />
Textils, apparels and leather products 6.8<br />
Wood, paper and printing 2.2<br />
Petroleum and chemicals 19.0<br />
Rubber and non-metallic minerals 8.2<br />
Base metals and fabricated metal 6.4<br />
Other manufactures 8.5<br />
Electricity and Water 0.3<br />
Construction 0.2<br />
Services 0.9<br />
Government services 0.0<br />
Average 4.1<br />
Sales tax rate on imports<br />
Average 4.9<br />
Import tariff rate<br />
Average 10.9<br />
19
4. <strong>The</strong> Model <strong>of</strong> <strong>Jordan</strong>: A Non-Mathematical Description<br />
A CGE model starts from the idea that the Walrasian general equilibrium structure should be<br />
used to depict an actual economy. It is thus assumed as sufficiently realistic that all markets in<br />
an economy are simultaneously in equilibrium. A certain base year is chosen to represent the<br />
benchmark equilibrium and key parameters <strong>of</strong> the model are calibrated to match this<br />
particular year’s observations. Starting from the observed equilibrium, counterfactual policy<br />
changes can be modeled and their effects can be traced by analyzing the new equilibrium<br />
values <strong>of</strong> the variables.<br />
<strong>The</strong> disaggregation <strong>of</strong> <strong>Jordan</strong>´s producing sector is firstly motivated by the classification the<br />
Department <strong>of</strong> Statisitics uses for presenting sectoral output data, secondly by the restriction<br />
that in the balance <strong>of</strong> payments services are not disaggregated in the same way as in the<br />
sectoral output statistics. Consequently, we have the following sectors and subsectors:<br />
Agriculture, mining and quarrying, manufacturing, water and electricity, construction, trade<br />
and services 20 and government services. Manufacturing has been disaggregated into seven<br />
subsectors: Manufacturing <strong>of</strong> food, beverages and tobacco, manufacturing <strong>of</strong> textiles, apparels<br />
and leather products, manufacturing <strong>of</strong> wood, paper and printing, manufacturing <strong>of</strong> petroleum<br />
and chemicals, manufacturing <strong>of</strong> rubber and other non metallic minerals, manufacturing <strong>of</strong><br />
basic metals and fabricated metal except machinery and equipment. <strong>The</strong> seventh subsector is<br />
called `other manufactures´ and includes e.g. machinery and equipment and vehicles.<br />
According to these sectors and subsectors goods and services have been aggregated into 13<br />
commodity groups.<br />
All sectors except „electricity and water“, „construction“ and „government services“<br />
participate in international trade. Major trading partners distinguished in this paper are the<br />
MENA region 21 , the EU 22 and the Rest <strong>of</strong> the World (ROW).<br />
20 <strong>The</strong> sector „trade and services“ includes wholesail and retail trade, restaurants and hotels, transport storage<br />
and communications, finance, insurance and business services, real estate, community, social and personal<br />
services as well as private non-pr<strong>of</strong>it services to households and domestic services to households. It has been<br />
aggregated that much because there is no data on exports and imports for the subsectors available and in any way<br />
imports <strong>of</strong> this aggregate are not charged with tariffs.<br />
21 For data reasons, the MENA region is defined here as including Algeria, Bahrain, Djibouti, Egypt, Iraq,<br />
<strong>Jordan</strong>´s Free <strong>Trade</strong> Zone, Kuwait, Lebanon, Lybia, Mauritania, Marocco, Oman, Palestine, Qatar, Saudi Arabia,<br />
Somalia, Sudan, Syria, Tunisia, the United Arab Emirates and Yemen. <strong>The</strong>se are the states which joined the<br />
Arab Free <strong>Trade</strong> Agreement which came into force in 1998.<br />
22 To the European Union (EU 15) belong the countries Austria Belgium, Denmark, Finland, France, Germany,<br />
Greece, Ireland, Italy, Luxemburg, Netherlands, Portugal, Spain, Sweden, United Kingdom.<br />
20
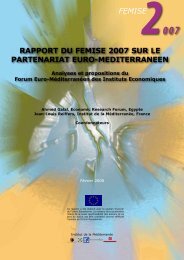
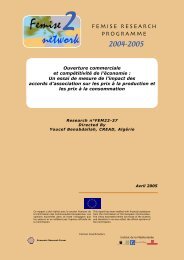
Figure 1: <strong>The</strong> Commodity Markets<br />
Labor<br />
Domestic<br />
output<br />
Capital<br />
Inputs<br />
CET<br />
Exports<br />
Domestic use<br />
CES<br />
Composite goods<br />
(Armington)<br />
Imports<br />
Trading partners<br />
Private consumption<br />
Privat investment<br />
Government<br />
consumption<br />
Government investment
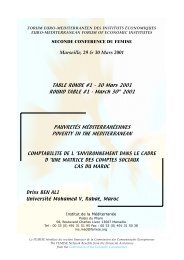
Figure 2: Government finance<br />
savings<br />
Households<br />
Capital market<br />
Factors<br />
(Labor, capital)<br />
Activities<br />
government deficit<br />
direct taxes<br />
transfers<br />
Foreign Savings<br />
capital<br />
income <strong>of</strong><br />
public<br />
enterprises<br />
22<br />
Government<br />
indirect taxes<br />
duties<br />
Importers
5. <strong>The</strong> Analytical Model<br />
<strong>The</strong> theoretical model for <strong>Jordan</strong> is very much in the spirit <strong>of</strong> the models <strong>of</strong> Dervis et al.,<br />
1982. As it is described in section 4., <strong>Jordan</strong>´s economy is decomposed into thirteen activities,<br />
t<br />
I : = 1,..,9,12 export parts <strong>of</strong> their output whereas the activities<br />
i=1.....13. <strong>The</strong> activities { }<br />
nt<br />
I { 10, 11, 13}<br />
= produce non-traded goods.<br />
Real net value added at factor cost Qi. i=1.....13 is produced under constant elasticity <strong>of</strong><br />
substitution (CES) production functions with the inputs labor Li and capital K i . (Note that.<br />
unless otherwise specified variables are in capital letters with bars denoting exogenous<br />
variables. Parameters are denoted in lowercase letters).<br />
1<br />
−ρi −ρ<br />
−<br />
i<br />
⎡ i<br />
i i α ρ<br />
i i ( αi)<br />
⎤ i<br />
Q = a ⎣ K + 1 − L ⎦ , i = 1,...,13<br />
(1)<br />
Assuming competitive factor markets pr<strong>of</strong>it maximization implies the equalitiy between<br />
nominal factor prices and marginal products. Hence factor demands are implicitly given by<br />
1<br />
1<br />
K Q<br />
−ρi −ρ − −<br />
i i 1<br />
( 1<br />
ρ −ρ −<br />
i<br />
i i = ⎡ i i αi i + −αi)<br />
⎤ i αi<br />
i<br />
rP P a ⎣ K L ⎦ K<br />
(2)<br />
1<br />
1<br />
Q<br />
−ρi −ρ − −<br />
i i 1<br />
( 1 ρ<br />
−ρ −<br />
⎡ i<br />
i i αi i αi) ⎤ i ( 1 αi)<br />
i<br />
w= P a ⎣ K + − L ⎦ − L<br />
(3)<br />
for all sectors. Note that this specification allows for heterogenous rates <strong>of</strong> return to capital<br />
across sectors. Further, the constant returns property <strong>of</strong> the production function implies zero<br />
economic pr<strong>of</strong>its for all activities:<br />
PQ= rPK+ wL<br />
(4)<br />
Q K<br />
i i i i i i<br />
From (2) and (3) the nominal incomes <strong>of</strong> the production factors are given by<br />
13<br />
K K<br />
i i i<br />
i=<br />
1<br />
Y = ∑ rP K<br />
(5)<br />
13<br />
L<br />
Y wLi<br />
i=<br />
1<br />
= ∑ (6)<br />
<strong>The</strong> resource constraint for the production factor labor is simply<br />
13<br />
∑ Li= L<br />
(7)<br />
where L is the total supply <strong>of</strong> labor.<br />
i=<br />
1<br />
In accordance with the activity aggregates we distinguish j = 1,..., 13 commodity aggregates.<br />
t<br />
<strong>The</strong> commodities J<br />
not traded.<br />
nt<br />
= { 1,.., 912 , } are traded whereas the commodities J = { 10, 11, 13}<br />
are<br />
24
t<br />
For each traded commodity aggregate a composite commodity Xj. j∈ J , the so-called<br />
Armington good, is produced using the inputs domestic supply j D and imports M j in a CESproduction<br />
function:<br />
1<br />
M M −<br />
M<br />
M M −ρj M −ρj<br />
ρ j<br />
j = ⎡<br />
j α j j + −α<br />
⎤<br />
j j<br />
25<br />
( 1 )<br />
X a D M<br />
⎣ ⎦<br />
<strong>The</strong> cost minimizing input relation is given by<br />
and the zero pr<strong>of</strong>it condition is<br />
M ( 1−α<br />
j )<br />
D<br />
M ⎛<br />
j P ⎞<br />
j<br />
= ⎜ ⎟<br />
M M<br />
D ⎜ j Pj<br />
α ⎟<br />
⎝ j ⎠<br />
1<br />
M<br />
1+<br />
ρ j<br />
X D M<br />
j j j j j j<br />
,<br />
P X = P D + P M<br />
(10)<br />
Equation (10) describes trade creation as a function <strong>of</strong> the relative prices between domestic<br />
and imported goods. To model trade diversion, assume that for a given import value j M<br />
<strong>Jordan</strong> minimizes the costs <strong>of</strong> imports over trading partners k = 1,.., 3 (as defined in 2.1) under<br />
a CES technology<br />
Minimization requires<br />
and total costs <strong>of</strong> imports are given by<br />
1<br />
−<br />
m<br />
ρ j<br />
3<br />
m<br />
m ⎡ m − ρ ⎤ j<br />
M j = aj⎢∑ α jkM jk ⎥ .<br />
(11)<br />
⎣k= 1 ⎦<br />
m m<br />
M ⎛ jk α jk P ⎞ j1<br />
= ⎜ m m<br />
M ⎜<br />
⎟<br />
j1 α j1 P ⎟<br />
⎝ jk ⎠<br />
1<br />
m<br />
1+<br />
ρ j<br />
3<br />
M m<br />
j j jk jk<br />
k = 1<br />
(8)<br />
(9)<br />
(12)<br />
P M = ∑ P M<br />
(13)<br />
Having defined the supply side <strong>of</strong> the domestic commodity market by Armington aggregates,<br />
intermediate demand for commodity j <strong>of</strong> sector i is assumed to depend linearly on gross<br />
output G i <strong>of</strong> sector i :<br />
Total (nominal) intermediate demand <strong>of</strong> sector i is therefore<br />
Vji = ajiG (14)<br />
i<br />
V<br />
i<br />
13<br />
i = ∑<br />
j=<br />
1<br />
X<br />
j ji<br />
PV PV<br />
(15)
Depreciation per sector depends linearly on the capital stock:<br />
Hence gross output at factor costs is given by<br />
O = δ K<br />
(16)<br />
i i i<br />
P G = P Q + P V + P O . (17)<br />
G Q V K<br />
i i i i i i i i<br />
Equation (17) describes the value <strong>of</strong> total supply <strong>of</strong> activity i at producers‘ cost. To specify<br />
the demand side, let us start with exports, whose treatment is completely analogous to<br />
imports. Assume that for a given quantity <strong>of</strong> gross output Gi, producers <strong>of</strong> traded activities<br />
t<br />
i∈ I maximize its nominal value<br />
P G = P D + P E<br />
(18)<br />
G D E<br />
i i i i i i<br />
subject to a constant elasticity <strong>of</strong> transformation (CET) choice between sales on the domestic<br />
market and exports:<br />
It is then necessary to have<br />
i =<br />
E ⎡ E<br />
i αi E<br />
ρi i +<br />
E<br />
−αi<br />
1<br />
E<br />
ρ E<br />
i ⎤ρi<br />
i<br />
26<br />
( 1 )<br />
G a D E<br />
⎣ ⎦<br />
E E<br />
E ⎛<br />
i Pi<br />
α ⎞<br />
i = ⎜ ⎟<br />
D E<br />
D ⎜ i Pi<br />
( 1−α<br />
i ) ⎟<br />
⎝ ⎠<br />
1<br />
E<br />
ρi<br />
−1<br />
Further, for a given aggregate export volume Ei, export revenue<br />
E<br />
i<br />
3<br />
i = ∑<br />
k = 1<br />
e<br />
ik ik<br />
P E P E<br />
is maximized over sales to trading partners k=1....3 under a CET-transformation function<br />
It is then necessary to have<br />
i =<br />
3<br />
e ⎡ e<br />
i ⎢∑ αik<br />
k = 1<br />
1<br />
e<br />
e ρ<br />
ρ ⎤ i<br />
i<br />
ik ⎥<br />
E a E<br />
⎣ ⎦<br />
e e<br />
E ⎛ ik αi1<br />
P ⎞ ik = ⎜ e e ⎟<br />
Ei1 ⎝αik Pi1<br />
⎠<br />
In fact, since we assume that world market prices are equal for all countries, equations (21)<br />
and (23) simplify to<br />
1<br />
e<br />
ρi<br />
−1<br />
.<br />
(19)<br />
(20)<br />
(21)<br />
(22)<br />
(23)
and<br />
E<br />
E<br />
3<br />
E = ∑ E<br />
i ik<br />
k = 1<br />
⎛α⎞ = ⎜ ⎟<br />
⎝ ⎠<br />
ik<br />
e<br />
i1<br />
i1 e<br />
αik<br />
27<br />
1<br />
e<br />
ρi<br />
−1<br />
such that the export shares <strong>of</strong> individual trading blocks are invariant.<br />
Disposable labor income is given by<br />
( 1 τ )<br />
L<br />
D<br />
L L<br />
L<br />
F<br />
(21‘)<br />
(23‘)<br />
Y = − Y + Y ,<br />
(24)<br />
F<br />
where effective direct tax rates are denoted τ with appropriate superscript. YL is labor income<br />
earned by <strong>Jordan</strong>ians working abroad minus labor income earned in <strong>Jordan</strong> by non-residents.<br />
Disposable capital income is given by<br />
K<br />
( )( F )<br />
K F G K K<br />
Y = (1 −π −π ) 1−<br />
τ Y + Y . (25)<br />
D<br />
K<br />
F<br />
where Y F is capital income from abroad. π is the constant share <strong>of</strong> net capital income<br />
earned by foreign capital and G<br />
π is the constant share <strong>of</strong> net capital income earned by the<br />
government.<br />
Nominal household income consists <strong>of</strong> disposable factor incomes plus exogenous transfers<br />
G<br />
F<br />
from the government ( TR ) and abroad ( TR ):<br />
H K L<br />
D D<br />
G F<br />
Y = Y + Y + TR + TR<br />
(26)<br />
Nominal household savings are assumed to be a constant fraction <strong>of</strong> household income<br />
H H H<br />
S = s Y , (27)<br />
while (real) household consumption is derived from maximizing the utility function <strong>of</strong> a<br />
Stone-Geary linear expenditure system (LES)<br />
subject to the budget constraint<br />
( C )<br />
12<br />
H<br />
j γ j<br />
H<br />
α j<br />
12<br />
H<br />
∑α<br />
j<br />
j=<br />
1<br />
j=<br />
1<br />
max ∏ − , = 1<br />
(28)<br />
12<br />
X H<br />
∑ Pj Cj j=<br />
1<br />
H H H<br />
+ S = Y −T<br />
(29)
where theγ j are minimum consumption levels and<br />
28<br />
H<br />
T is a catchall for other government taxes<br />
on households. Note that households do not consume government services which is why<br />
13<br />
j = is excluded in (29). Maximization yields the following demand functions:<br />
C<br />
H<br />
j<br />
⎧<br />
0 j = 13<br />
⎪<br />
⎪ ⎛ ⎞<br />
12<br />
⎪ H H H H X<br />
= α ⎜<br />
j ( 1 s ) Y T Pj’<br />
γ ⎟<br />
⎨ − − −<br />
j’<br />
⎜ ∑ ⎟<br />
⎪ ⎜ j ’1 = ⎟<br />
⎪ γ j +<br />
⎝ ⎠<br />
X<br />
⎪⎩<br />
Pj<br />
j ≠13<br />
(30)<br />
<strong>The</strong> capital market is modeled as an institution with revenues (supply) and expenditures<br />
(demand). Capital market revenues are defined as<br />
K<br />
=<br />
13<br />
i=<br />
1<br />
i +<br />
H<br />
+<br />
G<br />
+<br />
G<br />
+<br />
F<br />
R ∑ O S S CE S<br />
(31)<br />
G<br />
where G<br />
S denotes government savings. CE denotes government capital expenditure to<br />
specialized agencies and F<br />
S is foreign savings.<br />
Capital market expenditures are given by private investment demand and stocks<br />
Capital market equilibrium requires that<br />
13<br />
K X ST<br />
= j j + j<br />
j=<br />
1<br />
ST<br />
I j :<br />
E ∑ P (I I )<br />
(32)<br />
K<br />
R<br />
K<br />
= E<br />
(33)<br />
Assuming that gross investment is equal to capital market revenues minus a fixed amount <strong>of</strong><br />
stocks<br />
13<br />
X ST<br />
∑ P j (I j − I j<br />
K<br />
) = R<br />
(34)<br />
j=<br />
1<br />
makes it possible to treat foreign savings<br />
functions gross investment is given by<br />
I<br />
F<br />
S as an endogenous variable. Using CES demand<br />
⎧ 0 j = 1,..,3,6,10,13<br />
⎪<br />
=<br />
α s R<br />
: 4,5,7,..,9,11,12<br />
I<br />
+ ρ<br />
= 1<br />
I K K<br />
⎪<br />
j I ig I<br />
j ⎨<br />
I j∈ J =<br />
1<br />
ρ<br />
j<br />
IG<br />
⎪ X I I<br />
j’ J<br />
1 I X<br />
∈<br />
1<br />
( P + ρ<br />
j ) α j’ ( P + ρ<br />
j’<br />
⎪ ∑ )<br />
ig<br />
j’ ∈J<br />
⎩<br />
{ } ( ) 1<br />
∑ α<br />
ig<br />
where I j is zero for j∉ J . since these commodity aggregates do not include significant<br />
amounts <strong>of</strong> investment goods.<br />
Revenues consolidated in the government budget are given by<br />
(35)
G<br />
13<br />
∑ i<br />
D<br />
i i<br />
3<br />
∑∑(<br />
jk<br />
m<br />
j jk)(1 m<br />
j )<br />
L<br />
τ<br />
L K<br />
τ<br />
K<br />
i= 1 t<br />
j∈I k=<br />
1<br />
K<br />
+ YG H<br />
+ T<br />
F<br />
+ DEF<br />
29<br />
K<br />
( F )<br />
R = t P D + c p M + t + Y + Y + Y<br />
Here t i is the effective GST rate per sector, c jk is the effective tariff rate for good j imported<br />
from country k and m<br />
t j is the effective GST rate on imports.<br />
state enterprises and<br />
F<br />
DEF are foreign grants.<br />
Government expenditure is given by<br />
G<br />
=<br />
X<br />
13<br />
G<br />
13 +<br />
X<br />
j<br />
G<br />
j +<br />
G<br />
+<br />
G<br />
+<br />
G<br />
+<br />
G<br />
F<br />
ig<br />
j∈J K<br />
YG denotes capital income from<br />
(36)<br />
E P C ∑ P I TR S CE CE<br />
(37)<br />
In (37). the first term on the right hand side means that the government consumes only its own<br />
G<br />
goods C 13 .<br />
G<br />
I j is government investment,<br />
capital expenditures <strong>of</strong> the government realized out <strong>of</strong> <strong>Jordan</strong>.<br />
G<br />
TR denotes transfers to households.<br />
G<br />
CE F are<br />
Nominal government consumption and investment are assumed to be constant fractions <strong>of</strong><br />
government revenues such that<br />
P C = s R<br />
(38)<br />
X G G G<br />
13 13 C<br />
x G<br />
∑ PI j j<br />
ig<br />
j∈J G G<br />
= sI R .<br />
(39)<br />
Demand functions for government investment are specified as CES functions fulfilling budget<br />
identity and homogeneitiy <strong>of</strong> degree zero:<br />
I<br />
ig<br />
⎧ 0<br />
j∉J ⎪<br />
G<br />
α s R<br />
+ ρ<br />
∈ = 1<br />
G G G<br />
⎪<br />
j I ig G<br />
G ⎪<br />
G j J<br />
1<br />
j = ρ<br />
⎨ ig<br />
X G G<br />
1 G X<br />
j∈J 1<br />
( P + ρ<br />
j ) α j’ ( P + ρ<br />
⎪⎪⎪⎩ ∑ j’<br />
)<br />
ig<br />
j’ ∈J<br />
<strong>The</strong> budget restriction is, <strong>of</strong> course, simply<br />
G G<br />
R = E .<br />
( ) 1<br />
∑ α j<br />
Price identities complete the model: As <strong>Jordan</strong> fixes its exchange rate versus the US-Dollar,<br />
domestic prices <strong>of</strong> exports are derived from world market prices e<br />
p i . Similiary, domestic<br />
prices for imports are derived from world market prices m<br />
p j adjusted for customs tariffs and<br />
GST on imports.<br />
e e<br />
ik i<br />
(40)<br />
P = p<br />
(41)
( 1 )<br />
P = + c t p<br />
(42)<br />
m m m<br />
jk jk j j<br />
<strong>The</strong> trade (and services) balances <strong>of</strong> <strong>Jordan</strong> vis-à-vis each trading partner are simply<br />
∑ ∑ (43)<br />
TB = p E − p M<br />
e m<br />
k i ik j jk<br />
t<br />
i∈I t<br />
j∈I and the current account CA (the negative <strong>of</strong> foreign savings) is given by<br />
3<br />
∑<br />
k = 1<br />
k<br />
K<br />
F<br />
L<br />
F<br />
F F G<br />
F<br />
K<br />
TF . (44)<br />
CA = TB + Y + Y + TR + DEF −CE−Y which basically states that the current account is the sum <strong>of</strong> the trade (and services) balance<br />
K<br />
plus the transfer balance plus the income balance where Y TF is the capital income earned by<br />
foreign countries. Given equations (1) – (43), this equation is redundant by Walras´ law.<br />
6. <strong>The</strong> Data Base<br />
Calibration <strong>of</strong> the relevant parameters is mostly achieved by the 1998 Social Accounting<br />
Matrix (Table 11). This matrix uses national accounts, foreign trade and government budget<br />
data <strong>of</strong> 1998 provided by various <strong>Jordan</strong>ian authorities (Department <strong>of</strong> Statistics, Ministry <strong>of</strong><br />
Finance, Customs Department) and the input-output table <strong>of</strong> 1987 - which is the most recent<br />
available. 23 <strong>The</strong> usage <strong>of</strong> an outdated input-output table represents a considerable drawback<br />
for evaluating the sectoral effects <strong>of</strong> the Association Agreement. However, in order to be able<br />
to reproduce inter-sectoral effects at all, the structure <strong>of</strong> intermediate demand in the 1987<br />
input-output table has been used to construct the SAM.<br />
23 See Hosoe, 1998.<br />
30
Table 11<br />
Social Accounting Matrix for <strong>Jordan</strong><br />
1998, in 000 J.D.<br />
S1 S2 S3 S4 S5 S6 S7<br />
S Sectors<br />
S1 Agriculture<br />
S2 Mining and quarrying<br />
S3 Food, beverages, tobacco<br />
S4 Textils, apparels<br />
S5 Wood, paper, printing<br />
S6 Petroleum, chemicals<br />
S7 Non-metallic minerals<br />
S8 Metals, base & fabricated<br />
S9 Other manufactures<br />
S10 Electricity and water<br />
S11 Construction<br />
S12 Services<br />
S13 Government services<br />
C Commodities<br />
C1 Agriculture 62962 494 180937 2226 10658 106029 1287<br />
C2 Mining and quarrying 559 40418 890 2335 11198 167247 15563<br />
C3 Food, beverages, tobacco 156062 64 102870 913 1878 14060 431<br />
C4 Textils, apparels 0 2 396 45981 560 531 107<br />
C5 Wood, paper, printing 220 666 10520 547 36045 12650 6267<br />
C6 Petroleum, chemicals 29108 37809 13675 1578 10310 149460 67274<br />
C7 Non-metallic minerals 9859 1048 9988 1903 5001 54158 20171<br />
C8 Metals, base & fabricated 2209 10538 19967 1367 4855 16518 7710<br />
C9 Other manufactures 10511 17330 4167 3624 13011 104466 3261<br />
C10 Electricity and water 5676 9431 7369 1516 4084 20300 17857<br />
C11 Construction 49 226 101 8 16 219 14<br />
C12 Services 139715 49424 170750 11265 24960 100100 39133<br />
C13 Government services<br />
F Factors<br />
F1 labor 69707 68611 46305 18422 23501 70902 38637<br />
F2 capital 33595 46239 63747 14251 9613 76073 25385<br />
I Institutions<br />
I1 households<br />
I2 government<br />
I21 GST 2104 22592 85117 2320 2740 115370 19033<br />
I22 GST(MENA)<br />
I23 GST(EU)<br />
I24 GST(ROW)<br />
I25 Duties(MENA)<br />
I26 Duties(EU)<br />
I27 Duties(ROW)<br />
I28 direct taxes<br />
I29 other revenue<br />
I30 gov. Consumption<br />
I31 gov. Investment<br />
CAP Capital account<br />
CAP1 invest<br />
CAP2 stocks<br />
24610 42104 31529 8302 11366 39337 26883<br />
FOR Foreign account<br />
FOR1 MENA<br />
FOR2 EU<br />
FOR3 ROW<br />
FOR4 totfact<br />
31
Table 11 cont’d<br />
Social Accounting Matrix for <strong>Jordan</strong><br />
1998, in 000 J.D.<br />
S8 S9 S10 S11 S12 S13 C C1 C2 C3<br />
S<br />
S1 385831<br />
S2 179530<br />
S3<br />
S4<br />
S5<br />
S6<br />
S7<br />
S8<br />
S9<br />
S10<br />
S11<br />
S12<br />
S13<br />
C<br />
656391<br />
C1 18299 1944 18 4803 31465 43502<br />
C2 19270 2462 212 24297 21240 45500<br />
C3 2265 242 2 532 39018 8165<br />
C4 152 116 58 32 4632 9837<br />
C5 1664 656 651 11922 19344 12914<br />
C6 7208 6029 111007 30819 195494 37028<br />
C7 10632 35983 8 171329 27493 20727<br />
C8 21887 14325 654 125435 22801 15860<br />
C9 21282 51796 6304 28028 142037 94340<br />
C10 5677 1549 29927 5564 39152 20014<br />
C11 273 76 505 53992 28056 25476<br />
C12 24409 45621 11154 115148 445791 89675<br />
C13<br />
F<br />
126260<br />
F1 18323 42222 55367 163313 644489 877200<br />
F2<br />
I<br />
I1<br />
I2<br />
10517 37972 19763 3236 1334510<br />
I21 9044 5940 882 1629 18528 500<br />
I22 3619 13223 1582<br />
I23 3711 798 3853<br />
I24 15010 181 6847<br />
I25 8009 13562 5637<br />
I26 10039 2329 11097<br />
I27<br />
I28<br />
I29<br />
I30<br />
I31<br />
CAP<br />
15104 309 19445<br />
CAP1<br />
CAP2<br />
FOR<br />
9587 14134 41215 25104 257369 64260<br />
FOR1 65483 254951 26491<br />
FOR2 65313 13877 67136<br />
FOR3<br />
FOR4<br />
289703 3361 119591<br />
32
Table 11 cont’d<br />
Social Accounting Matrix for <strong>Jordan</strong><br />
1998, in 000 J.D.<br />
C4 C5 C6 C7 C8 C9 C10 C11 C12 C13<br />
S<br />
S1<br />
S2<br />
S3<br />
S4 34172<br />
S5 123146<br />
S6 605750<br />
S7 232556<br />
S8 141107<br />
S9 70232<br />
S10 277727<br />
S11 765182<br />
S12 2033576<br />
S13<br />
C<br />
C1<br />
C2<br />
C3<br />
C4<br />
C5<br />
C6<br />
C7<br />
C8<br />
C9<br />
C10<br />
C11<br />
C12<br />
C13<br />
F<br />
F1<br />
F2<br />
I<br />
I1<br />
I2<br />
1491260<br />
I21 44138<br />
I22 1396 457 1954 2836 1919 914<br />
I23 2318 2049 7693 3239 3084 22146<br />
I24 5696 3205 4734 4149 6566 24883<br />
I25 4091 1146 2746 3294 3885 2458<br />
I26 5997 3814 10461 7337 7540 46579<br />
I27<br />
I28<br />
I29<br />
I30<br />
I31<br />
CAP<br />
CAP1<br />
CAP2<br />
FOR<br />
17021 2899 6653 11049 11301 60499<br />
FOR1 24267 8124 36929 54290 35087 16105<br />
FOR2 41071 37799 145755 58441 55089 403138<br />
FOR3 98655 62189 89485 73215 122043 444810<br />
FOR4 896300<br />
33
Table 11 cont’d<br />
Social Accounting Matrix for <strong>Jordan</strong><br />
1998, in 000 J.D.<br />
F F1 F2 I I1 I2 I21 I22 I23 I24<br />
S<br />
S1<br />
S2<br />
S3<br />
S4<br />
S5<br />
S6<br />
S7<br />
S8<br />
S9<br />
S10<br />
S11<br />
S12<br />
S13<br />
C<br />
C1 426304<br />
C2 107741<br />
C3 593998<br />
C4 170463<br />
C5 60488<br />
C6 221781<br />
C7 80512<br />
C8 39857<br />
C9 267617<br />
C10 94797<br />
C11 810<br />
C12<br />
C13<br />
F<br />
F1<br />
F2<br />
I<br />
1625132<br />
I1<br />
I2<br />
I21<br />
I22<br />
I23<br />
I24<br />
I25<br />
I26<br />
I27<br />
2218487 1081408<br />
I28 10613 124535<br />
I29<br />
I30<br />
I31<br />
CAP<br />
371057 192516<br />
CAP1<br />
CAP2<br />
FOR<br />
FOR1<br />
FOR2<br />
FOR3<br />
526859<br />
FOR4 315500<br />
34
Table 11 cont’d<br />
Social Accounting Matrix for <strong>Jordan</strong><br />
1998, in 000 J.D.<br />
I25 I26 I27 I28 I29 I30 I31 CAP CAP1 CAP2<br />
S<br />
S1<br />
S2<br />
S3<br />
S4<br />
S5<br />
S6<br />
S7<br />
S8<br />
S9<br />
S10<br />
S11<br />
S12<br />
S13<br />
C<br />
C1 0 -29106<br />
C2 0 23189<br />
C3 0 0 -2430<br />
C4 416 1294 108<br />
C5 17242 53601 -570<br />
C6 0 0 -6419<br />
C7 576 1789 -770<br />
C8 20775 64585 -1723<br />
C9 79115 245906 -1030<br />
C10 0 14814<br />
C11 159685 496415 -739<br />
C12 10091 31369 40276<br />
C13<br />
F<br />
F1<br />
F2<br />
I<br />
1365000<br />
I1<br />
I2<br />
253600<br />
I21<br />
I22<br />
I23<br />
I24<br />
I25<br />
I26<br />
I27<br />
I28<br />
I29<br />
I30<br />
I31<br />
CAP<br />
26000<br />
CAP1<br />
CAP2<br />
FOR<br />
FOR1<br />
FOR2<br />
FOR3<br />
-310600 66340<br />
FOR4 11260<br />
35
Table 11 cont’d<br />
Social Accounting Matrix for <strong>Jordan</strong><br />
1998, in 000 J.D.<br />
FOR FOR1 FOR2 FOR3 FOR4<br />
S<br />
S1 150182 5325 5608 161115<br />
S2 38313 24117 105038 167468<br />
S3 79958 3861 8119 91937<br />
S4 26592 10516 45277 82385<br />
S5 19784 5152 21714 46650<br />
S6 174424 19523 247723 441670<br />
S7 35947 506 20002 56455<br />
S8 26843 2728 9812 39383<br />
S9<br />
S10<br />
S11<br />
111730 10212 68893 190835<br />
S12<br />
S13<br />
C<br />
C1<br />
C2<br />
C3<br />
C4<br />
C5<br />
C6<br />
C7<br />
C8<br />
C9<br />
C10<br />
C11<br />
C12<br />
C13<br />
F<br />
1237842<br />
F1 92100<br />
F2<br />
I<br />
217600<br />
I1<br />
I2<br />
I21<br />
I22<br />
I23<br />
I24<br />
I25<br />
I26<br />
I27<br />
I28<br />
855380<br />
I29<br />
I30<br />
I31<br />
CAP<br />
202479<br />
CAP1<br />
CAP2<br />
FOR<br />
FOR1<br />
FOR2<br />
FOR3<br />
52160<br />
FOR4 4280<br />
36
<strong>The</strong> LES specification (equation 28) requires the calibration <strong>of</strong> minimum consumption<br />
quantities, which then imply the demand elasticities. As the input-output table <strong>of</strong> 1987<br />
provides disaggregated consumption data, we assume that minimum consumption levels in<br />
1998 are equal to nominal consumption levels in 1987. On average, this is 44 percent <strong>of</strong><br />
today´s consumption expenditure. <strong>The</strong> precise values are found in Table 12.<br />
Table 12<br />
Minimum Consumption Levels in LES<br />
Commodities Actual Consumption Minimum consumption<br />
Agriculture 426308 186064<br />
Mining and quarrying 107742 47025<br />
Food, beverages, tobacco 594010 259259<br />
Textils, apparels 170465 74400<br />
Wood, paper, printing 60523 26416<br />
Petroleum, chemicals 221782 96798<br />
Non-metallic minerals 80510 35139<br />
Metals, base & fabricated 39786 17365<br />
Other manufactures 267633 116810<br />
Electricity and water 94797 41375<br />
Construction 810 354<br />
Services 1625132 709297<br />
Government services - -<br />
<strong>The</strong> remaining parameters to be specified are various elasticities <strong>of</strong> substitution and<br />
transformation. Elasticities <strong>of</strong> substitution between domestic products and imports and<br />
elasticities <strong>of</strong> transformation between domestic supply and exports have been estimated by<br />
various authors, see, e. g., Devarajan et al., 1999 24 . Gunter, 1995, suggests that a range from<br />
0.8 to 2.5 might be appropriate for developing countries. On this basis an elasticity <strong>of</strong><br />
transformation between domestic and exported goods <strong>of</strong> 1.5 was specified for <strong>Jordan</strong>. 25 <strong>The</strong><br />
elasticity <strong>of</strong> transformation between exports to the different regions has been set at 3.0 on the<br />
assumption that differences among export markets are less than those between export markets<br />
on the one side and the domestic market on the other side. For the elasticity <strong>of</strong> substitution a<br />
value <strong>of</strong> 1.5 was chosen as has been done by Martin, 2000 for Lebanon. 26 This specification<br />
should probably be treated as an upper limit since the average <strong>of</strong> the substitution elasticities<br />
estimated by Devarajan et al., 1999 is below 1. <strong>The</strong> value for the elasticity <strong>of</strong> substitution<br />
between imports from different sources was specified at 3.0. This seems justified as the<br />
imports to <strong>Jordan</strong> from the EU and ROW, especially in the case <strong>of</strong> machinery and vehicles,<br />
are substitutes rather than complements. <strong>The</strong>se elasticities are assumed to be equal across<br />
sectors and commodities. We performed a sensitivity analysis for the elasticity <strong>of</strong><br />
transformation and substitution with values ranging from 1 to 5. <strong>The</strong> sensitivity analysis did<br />
not report large qualitative differences in the simulation results. 27 .<br />
24<br />
For <strong>Jordan</strong>, Devarajan et al. have estimated only the elasticity <strong>of</strong> transformation. With three different<br />
estimation strategies they get elasticities <strong>of</strong> transformation between 6.1 and 7.25. <strong>The</strong>se are extremely high<br />
values compared to those obtained for other countries and those obtained by other authors. We thus refrain from<br />
using them.<br />
25<br />
This is also the value Martin, 2000 has specified as elasticity <strong>of</strong> transformation between domestic goods and<br />
exports in his CGE model for Lebanon.<br />
26<br />
Both elasticities are assumed to be equal across sectors and commodities.<br />
27<br />
Similar, Hosoe, 1998.<br />
37
<strong>The</strong> model is calibrated and solved for the benchmark and the counterfactuals using the<br />
s<strong>of</strong>tware package GAMS/MPSGE.<br />
7. Simulation Results<br />
To quantify the possible effects <strong>of</strong> the Association Agreement the following scenarios have<br />
been simulated:<br />
Scenario SC 1: 50 percent decrease in import duties on agricultural products imported from<br />
the EU.<br />
Scenario SC 2: 100 percent decrease in import duties on agricultural products imported from<br />
the EU.<br />
Scenario SC 3: 100 percent decrease in import duties on non-agricultural products imported<br />
from the EU (SC 3).<br />
Scenario SC 4: Scenario 1 and scenario 3.<br />
Scenario SC 5: Scenario 2 und scenario 3.<br />
Scenario SC 6: Scenario 5 and zero duties on all imports from other MENA countries.<br />
Scenario SC 7: Scenario 6 and zero duties on all imports from the ROW.<br />
<strong>The</strong> benchmark equilibrium is denoted as scenario SC 0. <strong>The</strong> extent <strong>of</strong> trade liberalization<br />
increases from scenario SC 1 to SC 7 with SC 7 representing a fully liberalized foreign trade<br />
regime. All prices have been normalized to one hundred in the benchmark. <strong>The</strong> consumer<br />
price index is used as numéraire such that its value is one hundred throughout all simulations.<br />
Thus the counter-factual values <strong>of</strong> prices should be interpreted as index values relative to the<br />
consumer price index. Real values have been obtained by deflating nominal values by the<br />
corresponding Laspeyres-price indices.<br />
With reduced tariffs on imports, the domestic prices <strong>of</strong> imported goods fall. As imports and<br />
domestic products are imperfect substitutes, <strong>Jordan</strong>ians switch from domestic products to<br />
imports. Imports increase and the more they compete with domestic products the more the<br />
domestic prices <strong>of</strong> domestic products fall. <strong>The</strong>refore the producers <strong>of</strong> traded goods switch<br />
from domestic supply <strong>of</strong> goods to exports. As <strong>Jordan</strong> fixes its exchange rate versus the USdollar<br />
and is treated as a small country, export prices do not change. Tables 22 and 23 show<br />
the average changes <strong>of</strong> these price variables but - as the consumer price index is numéraire -<br />
only to the extent as they differ from the movements in the consumer price index.<br />
Decreasing import and domestic prices reduce the costs <strong>of</strong> intermediates and increase demand<br />
<strong>of</strong> consumers. Thus the more trade is liberalized the stronger is the incentive to increase<br />
production. However, as the labor force and the capital stock are fixed in any given period,<br />
net domestic product at factor costs (NDPF) does not change throughout the simulations in<br />
real terms. 28 Factor prices increase on average (Table 21) and so does nominal NDPF.<br />
Real gross domestic product at market prices (GDPM) more or less stagnates in scenarios 1<br />
and 2 and decreases slightly in scenarios 3 to 7. On the one hand, real public consumption and<br />
real public investment go down because trade liberalization withdraws government revenues.<br />
In addition, the direct effect <strong>of</strong> trade liberalization on imports is larger than the indirect effect<br />
28 In the paper „ <strong>Fiscal</strong> <strong>Impact</strong> <strong>of</strong> <strong>Trade</strong> <strong>Liberalization</strong>: <strong>The</strong> <strong>Case</strong> <strong>of</strong> <strong>Jordan</strong>“ the model allowed the capital stock<br />
to increase in the same period such that liberalizing trade not only increased nominal but also real NDPF which<br />
has consequences for all other variables. This feature <strong>of</strong> the model was abandoned in order to make the results<br />
comparable with the results <strong>of</strong> trade liberalization obtained for Syria.<br />
38
on exports. <strong>The</strong>refore the trade deficit (which is already at 21 percent <strong>of</strong> GDPM in the<br />
benchmark) increases further. On the other hand, real private consumption and real private<br />
investment go up the more trade is liberalized.<br />
Tables 13 and 14 show that nominal and real effects <strong>of</strong> liberalizing only the trade with<br />
agricultural products versus the EU are negligible. This is the case because imports <strong>of</strong><br />
agricultural products from the EU are not very significant in total imports. As soon as nonagricultural<br />
products are also exempted from tariffs, the changes become significant. As<br />
almost 50 percent <strong>of</strong> <strong>Jordan</strong>‘s imports come from the ROW, including the ROW into the trade<br />
liberalization scheme has large effects.<br />
Table 13<br />
Effects <strong>of</strong> <strong>Trade</strong> <strong>Liberalization</strong> on Main Aggregates,<br />
Variables in Volume,<br />
Percentage Deviations from Benchmark in Brackets<br />
SC 0 SC 1 SC 2 SC 3 SC 4 SC 5 SC 6 SC 7<br />
NDPF 3811.9 3811.9 3811.9 3811.9 3811.9 3811.9 3811.9 3811.9<br />
(0.00) (0.00) (0.00) (0.00) (0.00) (0.00) (0.00)<br />
GDPM 5180.0 5180.9 5180.4 5171.2 5171.6 5170.9 5168.1 5170.6<br />
(0.02) (0.01) (-0.17) (-0.16) (-0.17) (-0.23) (-0.18)<br />
CPRIV 3689.5 3702.4 3718.4 3843.6 3856.6 3872.9 3953.4 4172.6<br />
(0.35) (0.78) (4.18) (4.53) (4.97) (7.15) (13.09)<br />
CPUB 1365.0 1362.7 1359.2 1299.5 1297.0 1293.2 1265.3 1187.9<br />
(-0.17) (-0.43) (-4.80) (-4.98) (-5.26) (-7.31) (-12.97)<br />
IPRIV 895.0 895.2 895.5 912.1 912.3 912.6 918.8 938.9<br />
(0.03) (0.06) (1.91) (1.94) (1.97) (2.67) (4.91)<br />
IPUB 287.9 287.4 286.6 279.6 279.1 278.2 273.3 263.0<br />
(-0.18) (-0.46) (-2.87) (-3.07) (-3.37) (-5.08) (-8.65)<br />
Imports 3608.7 3618.0 3630.5 3750.3 3759.7 3772.5 3843.8 4023.6<br />
(0.26) (0.60) (3.92) (4.18) (4.54) (6.51) (11.50)<br />
Exports 2515.7 2515.3 2515.0 2549.5 2548.9 2548.7 2563.0 2590.7<br />
(-0.02) (-0.03) (1.34) (1.32) (1.31) (1.88) (2.98)<br />
<strong>Trade</strong> -1093.0 -1102.8 -1115.5 -1200.8 -1210.8 -1223.8 -1280.8 -1432.9<br />
Balance (0.90) (2.06) (9.86) (10.78) (11.97) (17.19) (31.10)<br />
39
Table 14<br />
Effects <strong>of</strong> <strong>Trade</strong> <strong>Liberalization</strong> on Main Aggregates,<br />
Variables in Value, Mio. J.D.<br />
SC 0 SC 1 SC 2 SC 3 SC 4 SC 5 SC 6 SC 7<br />
NDPF 3811.9 3816.5 3821.9 3886.6 3891.4 3896.9 3934.4 4041.1<br />
(0.12) (0.26) (1.96) (2.08) (2.23) (3.21) (6.01)<br />
GDPM 5180.0 5181.1 5180.7 5132.5 5133.2 5132.6 5121.9 5087.7<br />
(0.02) (0.01) (-0.92) (-0.90) (-0.92) (-1.12) (-1.78)<br />
CPRIV 3689.5 3702.4 3718.4 3843.6 3856.6 3872.9 3953.4 4172.6<br />
(0.35) (0.78) (4.18) (4.53) (4.97) (7.15) (13.09)<br />
CPUB 1365.0 1362.8 1359.1 1292.1 1289.6 1285.8 1256.4 1176.0<br />
(-0.16) (-0.43) (-5.34) (-5.52) (-5.80) (-7.95) (-13.85)<br />
IPRIV 895.0 895.4 895.8 888.9 889.2 889.7 891.1 885.5<br />
(0.04) (0.09) (-0.68) (-0.64) (-0.59) (-0.43) (-1.05)<br />
IPUB 287.9 287.4 286.7 272.5 272.0 271.2 265.0 248.0<br />
(-0.16) (-0.43) (-5.34) (-5.52) (-5.80) (-7.95) (-13.85)<br />
Imports 3608.7 3618.0 3630.5 3750.3 3759.7 3772.5 3843.8 4023.6<br />
(0.26) (0.60) (3.92) (4.18) (4.54) (6.51) (11.50)<br />
Exports 2515.7 2515.3 2515.0 2549.5 2548.9 2548.7 2563.0 2590.7<br />
(-0.02) (-0.03) (1.34) (1.32) (1.31) (1.88) (2.98)<br />
<strong>Trade</strong> -1093.0 -1102.8 -1115.5 -1200.8 -1210.8 -1223.8 -1280.8 -1432.9<br />
Balance (0.90) (2.06) (9.86) (10.78) (11.97) (17.19) (31.10)<br />
Table 15<br />
Effects <strong>of</strong> <strong>Trade</strong> <strong>Liberalization</strong> on Government Budget and Capital Accumulation,<br />
Variables in Value, Mio. J.D.<br />
SC 0 SC 1 SC 2 SC 3 SC 4 SC 5 SC 6 SC 7<br />
Tariff<br />
294.3 289.8 283.3 184.3 179.7 172.9 127.3 0.0<br />
Revenue (-1.52) (-3.73) (-37.38) (-38.95) (-41.24) (-56.75) (-100.0)<br />
Sales tax 285.8 286.0 286.3 284.6 284.8 285.1 284.2 284.2<br />
domest. (0.08) (0.19) (-0.42) (-0.34) (-0.24) (-0.56) (-0.57)<br />
Sales tax 192.2 192.4 192.7 193.8 194.0 194.3 195.6 198.1<br />
imports (0.12) (0.28) (0.81) (0.93) (1.09) (1.74) (3.09)<br />
Ind.taxes 772.3 768.3 762.4 662.7 658.5 652.3 607.0 482.3<br />
total (-0.52) (-1.28) (-14.20) (-14.74) (-15.53) (-21.40) (-37.55)<br />
Direct<br />
135.2 135.4 135.8 139.9 140.1 140.5 142.7 148.9<br />
taxes (0.20) (0.45) (3.49) (3.70) (3.95) (5.58) (10.18)<br />
All taxes 907.5 903.7 898.2 802.5 798.6 792.8 749.7 631.2<br />
(-0.41) (-1.02) (-11.56) (-11.99) (-12.63) (-17.38) (-30.44)<br />
Govern. 1699.5 1696.7 1692.1 1608.8 1605.7 1600.9 1564.3 1464.2<br />
Revenue (-0.17) (-0.44) (-5.35) (-5.53) (-5.81) (-7.96) (-13.86)<br />
Govern. 310.6 310.7 310.8 313.1 313.2 313.3 314.3 317.1<br />
deficit (0.00) (0.00) (0.01) (0.01) (0.01) (0.01) (0.02)<br />
Househ. 526.9 527.6 528.5 536.9 537.7 538.5 543.9 558.9<br />
savings (0.15) (0.31) (1.91) (2.05) (2.21) (3.24) (6.07)<br />
Current -52.2 -62.6 -76.2 -171.9 -182.6 -196.4 -259.0 -426.7<br />
account (20.10) (46.11) (229.53) (250.06) (276.59) (396.63) (717.98)<br />
40
Table 15 shows that the losses in tariff revenues are also small as long as only the tariffs on<br />
agricultural products from the EU are abolished. <strong>The</strong> low import share outweighs the high<br />
tariff rates that agricultural products from the EU bear.<br />
<strong>The</strong> GST does not refer to nominal value added but to domestic sales <strong>of</strong> domestically<br />
produced goods. In scenarios 3 to 7 the positive effect <strong>of</strong> the increased nominal NDPF on<br />
GST revenues is more than <strong>of</strong>fset by the negative effect which is caused as producers switch<br />
from domestic sales to exports. Thus, altogether GST revenues on domestic sales fall.<br />
GST revenues on imports go up because <strong>of</strong> the increasing import values. Direct taxes go up<br />
because <strong>of</strong> the increased compensation <strong>of</strong> production factors. All in all, tax revenues decrease<br />
by 30 percent in the case <strong>of</strong> full trade liberalization. <strong>The</strong> variable which is more decisive for<br />
the government´s scope <strong>of</strong> action is the government revenue. This is only reduced by 14<br />
percent in the case <strong>of</strong> full trade liberalization because the government´s capital income<br />
increases with trade liberalization. <strong>The</strong> government deficit stays almost constant because<br />
government consumption and investment are cut proportionally to the fall <strong>of</strong> government<br />
revenue.<br />
<strong>The</strong> rise in the current account deficit reflects mainly the rise in the trade deficit. Even though<br />
its enormous percentage increase is qualified by the almost balanced current account <strong>of</strong> the<br />
benchmark period it has to be judged as negative that <strong>Jordan</strong>ians use the cheaper imports far<br />
more for additional private consumption than investment. In the case <strong>of</strong> full trade<br />
liberalization the current account deficit would amount to about 8 percent <strong>of</strong> nominal GDPM.<br />
With the opening <strong>of</strong> <strong>Jordan</strong>´s capital market to foreigners it is at least possible to finance this<br />
current account deficit by private capital imports.<br />
41
Table 16<br />
Imports by Product and Origin<br />
Variables in Volume and Value (CIF, Mio. J.D.)<br />
Commodities SC 0 SC 1 SC 2 SC 3 SC 4 SC 5 SC 6 SC 7<br />
Imports by product group<br />
Agriculture 420.5 423.6 428.4 428.5 431.6 436.5 445.6 464.3<br />
(0.73) (1.87) (1.89) (2.63) (3.79) (5.98) (10.41)<br />
Mining 272.2 272.6 273.2 275.8 276.3 276.8 284.4 289.6<br />
(0.17) (0.37) (1.33) (1.50) (1.71) (4.50) (6.39)<br />
Food<br />
213.2 213.1 213.0 233.7 233.6 233.5 242.1 267.2<br />
(-0.05) (-0.09) (9.61) (9.55) (9.50) (13.54) (25.34)<br />
Textiles 164.0 164.4 164.9 171.2 171.5 172.0 175.6 183.7<br />
(0.23) (0.52) (4.37) (4.60) (4.90) (7.07) (12.01)<br />
Wood<br />
108.1 108.2 108.3 111.0 111.1 111.2 112.3 114.5<br />
(0.09) (0.20) (2.67) (2.77) (2.88) (3.88) (5.95)<br />
Chemicals 272.2 272.3 272.5 282.3 282.4 282.6 284.3 291.6<br />
(0.05) (0.11) (3.72) (3.77) (3.84) (4.44) (7.15)<br />
Rubber 186.0 186.1 186.2 191.9 192.0 192.2 195.0 202.1<br />
(0.08) (0.16) (3.18) (3.25) (3.34) (4.87) (8.68)<br />
Metals 212.2 212.2 212.3 216.3 216.3 216.3 218.4 222.7<br />
(0.01) (0.02) (1.91) (1.92) (1.92) (2.92) (4.92)<br />
Other<br />
864.1 864.8 865.6 889.0 889.8 890.6 895.5 916.4<br />
(0.09) (0.18) (2.89) (2.98) (3.07) (3.64) (6.06)<br />
Services 896.3 900.7 906.1 950.7 955.2 960.7 990.5 1071.5<br />
(0.49) (1.09) (6.07) (6.57) (7.19) (10.51) (19.54)<br />
Imports by country <strong>of</strong> origin<br />
MENA 521.7 520.5 519.1 501.4 500.1 498.6 596.1 567.3<br />
(-0.24) (-0.51) (-3.90) (-4.15) (-4.44) (14.26) (8.73)<br />
EU15<br />
887.6 901.0 917.9 1092.8 1106.6 1123.9 1099.1 975.4<br />
(1.51) (3.41) (23.12) (24.67) (26.62) (23.82) (9.89)<br />
ROW 1303.1 1295.8 1287.4 1205.4 1197.9 1189.2 1158.1 1409.4<br />
(-0.55) (-1.20) (-7.49) (-8.07) (-8.74) (-11.13) (8.16)<br />
Let us have a closer look at the foreign trade effects <strong>of</strong> trade liberalization. Two different<br />
effects must be distinguished, trade creation and trade diversion.<br />
<strong>Trade</strong> creation measures the total increase <strong>of</strong> imports after tariffs have been lowered. This<br />
effect depends on the elasticities <strong>of</strong> substitiution between domestic products and imports and<br />
on the distribution parameters in the sectoral CES functions. Given the elasticity <strong>of</strong><br />
substiution, the distribution parameter in the CES-function, M<br />
α j , is the higher the smaller is<br />
the import share in a commodity aggregate. This has two effects working in opposite<br />
directions. On the one hand, the higher M<br />
α j , the less domestic goods are replaced by imports<br />
given a certain reduction in import prices. On the other hand, the smaller M<br />
α j , the more the<br />
domestic price <strong>of</strong> the domestically produced supply adapts to the domestic price <strong>of</strong> imports<br />
and thereby reduces the incentive to switch from domestically produced goods to imports.<br />
As shown in Table 9 in section 3.1, imports <strong>of</strong> food products and textiles bear on average the<br />
highest tariff rates. Thus with trade liberalization their domestic prices fall the most. Products<br />
42
<strong>of</strong> the food industry have among all sectors the highest M<br />
α j . However, the effect <strong>of</strong> the fall in<br />
import prices outweighs the effect <strong>of</strong> the high M<br />
α j such that imports <strong>of</strong> food products increase<br />
by 25 percent in scenario 7. This is different for textiles. Here the share <strong>of</strong> domestically<br />
produced goods in total domestic supply is small such that M<br />
α j is close to zero. Domestic<br />
prices <strong>of</strong> domestically produced textiles adapt much more to the domestic prices <strong>of</strong> imported<br />
textiles so that the increase in imports is lower than in the case <strong>of</strong> food. This effect <strong>of</strong> an<br />
M<br />
α j close to zero is also working in the commodity aggregate „other“. Although the tariff rate<br />
is about average in the status quo, the increase <strong>of</strong> imports is far below average when trade is<br />
liberalized.<br />
At first glance, the strong increase <strong>of</strong> imports <strong>of</strong> services is surprising as imports <strong>of</strong> services<br />
are already now exempted from tariffs. However factor costs increase in the domestic service<br />
sector so that the domestic price <strong>of</strong> domestic services increases. Thus consumers switch to<br />
imported services.<br />
<strong>Trade</strong> diversion measures the changes in the import structure across trading partners as<br />
<strong>Jordan</strong>ians substitute imports from other regions with imports for which trade has been<br />
liberalized. <strong>The</strong> trade diversion effect is presented for total imports in Table 16 and in Table<br />
17 disaggregated for each import category.<br />
43
Table 17<br />
<strong>Trade</strong> Diversion <strong>of</strong> <strong>Jordan</strong>ian Imports<br />
Percentage Changes <strong>of</strong> Imports in Scenario SC 1<br />
Agricult. Mining Food Textiles Wood Chem. Rubber Metals Other<br />
MENA -2.74 0.17 -0.05 0.23 0.09 0.05 0.08 0.01 0.09<br />
EU15 19.60 0.17 -0.05 0.23 0.09 0.05 0.08 0.01 0.09<br />
ROW -2.74 0.17 -0.05 0.23 0.09 0.05 0.08 0.01 0.09<br />
Percentage Changes <strong>of</strong> Imports in Scenario SC 2<br />
MENA -5.95 0.37 -0.09 0.52 0.20 0.11 0.16 0.02 0.18<br />
EU15 44.42 0.37 -0.09 0.52 0.20 0.11 0.16 0.02 0.18<br />
ROW -5.95 0.37 -0.09 0.52 0.20 0.11 0.16 0.02 0.18<br />
Percentage Changes <strong>of</strong> Imports in Scenario SC 3<br />
MENA 1.89 -1.64 -7.38 -7.35 -8.07 -7.70 -9.00 -9.16 -12.89<br />
EU15 1.89 56.66 46.56 39.44 22.66 13.63 29.75 33.48 20.93<br />
ROW 1.89 -1.64 -7.38 -7.35 -8.07 -7.70 -9.00 -9.16 -12.89<br />
Percentage Changes <strong>of</strong> Imports in Scenario SC 4<br />
MENA -0.91 -1.47 -7.42 -7.14 -7.98 -7.66 -8.94 -9.15 -12.82<br />
EU15 21.86 56.93 46.49 39.76 22.77 13.69 29.85 33.49 21.03<br />
ROW -0.91 -1.47 -7.42 -7.14 -7.98 -7.66 -8.94 -9.15 -12.82<br />
Percentage Changes <strong>of</strong> Imports in Scenario SC 5<br />
MENA -4.18 -1.27 -7.47 -6.88 -7.89 -7.60 -8.86 -9.15 -12.73<br />
EU15 47.15 57.24 46.42 40.16 22.90 13.76 29.95 33.50 21.15<br />
ROW -4.18 -1.27 -7.47 -6.88 -7.89 -7.60 -8.86 -9.15 -12.73<br />
Percentage Changes <strong>of</strong> Imports in Scenario SC 6<br />
MENA 30.55 2.78 58.14 40.67 33.83 12.00 5.13 19.21 33.26<br />
EU15 41.81 40.13 40.27 32.68 20.17 11.20 25.63 27.83 20.80<br />
ROW -7.65 -12.02 -11.35 -11.85 -9.93 -9.68 -11.90 -13.01 -12.98<br />
<strong>Trade</strong> diversion brings about that the percentage fall <strong>of</strong> tariff revenues is larger than the share<br />
<strong>of</strong> benchmark duties <strong>of</strong> the region with which trade is going to be liberalized in total tariff<br />
revenues. In scenarios 1 and 2, however, this effect is negligible. In scenarios 3 to 6 it is about<br />
5 percent.<br />
<strong>The</strong> changes in exports by sectors caused by trade liberalization are given in Table 17. <strong>The</strong>y<br />
increase the stronger domestic prices <strong>of</strong> domestically produced goods fall. How much<br />
E<br />
changes in the domestic prices affect exports depends on the distribution parameter α i <strong>of</strong> the<br />
E<br />
CET-function in equation (20). α i is higher the larger is the share <strong>of</strong> exports in that sector‘s<br />
E<br />
total supply. <strong>The</strong> larger α i , the stronger is the effect <strong>of</strong> a given change in domestic prices on<br />
exports. <strong>The</strong> highest E<br />
α i is found in the sectors „manufacturing <strong>of</strong> textiles“ and „other<br />
manufacturing“ followed by mining and the chemical industry. Exports <strong>of</strong> „manufacturing <strong>of</strong><br />
textiles“ would increase by 20 percent with fully liberalized trade. Thus, trade liberalization<br />
44
causes a restructuring <strong>of</strong> exports such that they rely on a broader industrial basis. Exports <strong>of</strong><br />
services decrease because the domestic price <strong>of</strong> domestically supplied services increases.<br />
<strong>The</strong> additional exports are distributed proportionally among the regions <strong>of</strong> destination as it is<br />
assumed that world market prices are equal for all countries.<br />
Agriculture<br />
Mining<br />
Food<br />
Textiles<br />
Wood<br />
Chemicals<br />
Rubber<br />
Metals<br />
Other<br />
Services<br />
MENA<br />
EU15<br />
ROW<br />
Table 18<br />
Exports by Activity and Destination<br />
Variables in Volume and Value (FOB, Mio. J.D.)<br />
SC 0 SC 1 SC 2 SC 3 SC 4 SC 5 SC 6 SC 7<br />
Exports by activity<br />
161.1 160.5 159.8 166.0 165.4 164.6 165.5 169.0<br />
(-0.39) (-0.84) (3.06) (2.66) (2.19) (2.70) (4.92)<br />
167.5 167.4 167.4 171.9 171.8 171.7 172.1 175.3<br />
(-0.03) (-0.05) (2.62) (2.58) (2.56) (2.77) (4.66)<br />
91.9 92.3 92.8 92.7 93.1 93.6 94.3 95.6<br />
(0.42) (0.94) (0.85) (1.26) (1.79) (2.57 (3.95)<br />
82.4 82.4 82.4 87.2 87.2 87.2 89.9 99.3<br />
(0.01) (0.05) (5.86) (5.86) (5.89) (9.09) (20.50)<br />
46.7 46.7 46.8 47.9 48.0 48.1 48.8 50.2<br />
(0.16) (0.35) (2.69) (2.84) (3.05) (4.67) (7.60)<br />
441.7 442.8 444.2 458.5 459.6 461.1 475.1 494.4<br />
(0.25) (0.57) (3.81) (4.07) (4.40) (7.58) (11.94)<br />
56.5 56.5 56.5 57.3 57.3 57.3 57.9 57.9<br />
(0.00) (0.01) (1.57) (1.56) (1.57) (2.57) (2.48)<br />
39.4 39.5 39.6 40.1 40.2 40.3 40.8 41.5<br />
(0.19) (0.43) (1.84) (2.03) (2.28) (3.64) (5.31)<br />
190.8 190.7 190.6 198.1 197.9 197.8 198.9 205.8<br />
(-0.07) (-0.14) (3.81) (3.72) (3.65) (4.21) (7.83)<br />
1237.8 1236.5 1235.0 1229.7 1228.4 1226.9 1219.7 1201.8<br />
(-0.11) (-0.23) (-0.65) (-0.77) (-0.89) (-1.47) (-2.91)<br />
Exports <strong>of</strong> goods by country <strong>of</strong> destination<br />
663.8 664.0 664.3 684.1 684.2 684.6 694.1 715.0<br />
(0.03) (0.08) (3.06) (3.08) (3.13) (4.57) (7.71)<br />
81.9 82.0 82.1 84.7 84.8 84.8 86.1 89.3<br />
(0.05) (0.14) (3.38) (3.43) (3.52) (5.04) (9.00)<br />
532.2 532.8 533.6 551.0 551.6 552.4 563.1 584.6<br />
(0.12) (0.27) (3.53) (3.64) (3.80) (5.81) (9.85)<br />
45
Table 19<br />
Value Added by Activity<br />
Variables in Volume<br />
SC 0 SC 1 SC 2 SC 3 SC 4 SC 5 SC 6 SC 7<br />
Agriculture 103.3 102.7 102.0 106.0 105.4 104.7 104.7 106.0<br />
(-0.59) (-1.29) (2.63) (2.03) (1.32) (1.38) (2.59)<br />
Mining 114.9 114.9 114.9 117.1 117.1 117.1 116.1 118.2<br />
(0.01) (0.05) (1.94) (1.95) (1.98) (1.09) (2.88)<br />
Food<br />
110.1 110.3 110.6 110.7 111.0 111.3 111.6 112.0<br />
(0.22) (0.49) (0.61) (0.83) (1.10) (1.40) (1.80)<br />
Textiles 32.7 32.7 32.7 34.2 34.2 34.2 35.0 37.6<br />
(0.04) (0.11) (4.66) (4.69) (4.75) (7.13) (14.96)<br />
Wood<br />
33.1 33.2 33.2 33.3 33.4 33.4 33.7 34.1<br />
(0.13) (0.30) (0.66) (0.79) (0.96) (1.77) (3.04)<br />
Chemicals 147.0 147.3 147.6 150.2 150.5 150.8 153.8 157.9<br />
(0.20) (0.45) (2.17) (2.37) (2.62) (4.64) (7.43)<br />
Rubber<br />
64.0 64.0 64.1 63.8 63.8 63.8 63.9 62.9<br />
(0.03) (0.07) (-0.37) (-0.35) (-0.31) (-0.12) (-1.75)<br />
Metals<br />
28.8 28.9 28.9 28.7 28.8 28.8 28.9 28.6<br />
(0.12) (0.27) (-0.40) (-0.28) (-0.13) (0.05) (-0.76<br />
Other<br />
80.2 80.2 80.1 82.3 82.2 82.2 82.6 84.4<br />
(-0.05) (-0.10) (2.58) (2.52) (2.47) (2.96) (5.23)<br />
Electricity, 75.1 75.2 75.3 76.3 76.4 76.5 77.1 78.6<br />
water (0.13) (0.29) (1.52) (1.65) (1.80) (2.64) (4.63)<br />
Construction 166.5 166.5 166.4 165.8 165.7 165.6 165.8 164.7<br />
(-0.03) (-0.08) (-0.47) (-0.50) (-0.56) (-0.47) (-1.11)<br />
Services 1979.0 1980.5 1982.5 2006.3 2007.8 2009.7 2020.8 2050.7<br />
(0.08) (0.18) (1.38) (1.45) (1.55) (2.11) (3.62)<br />
Government 877.2 875.6 873.5 836.2 834.7 832.4 815.4 768.4<br />
services (-0.18) (-0.43) (-4.68) (-4.85) (-5.10) (-7.05) (-12.41)<br />
Table 19 shows that even though the aggregate NDPF does not change in real terms when<br />
trade is liberalized, the sectors´ real value added changes considerably. Value added <strong>of</strong><br />
government services goes down as government consumption is cut proportionally to the<br />
decline in government revenue. Value added decreases also in construction. On the one hand<br />
this is due to the reduction in government investment. On the other hand real private<br />
investment in construction grows below average because the market prices in construction are<br />
not affected by trade liberalization in contrast to the prices <strong>of</strong> most other investment goods.<br />
As the sectors „manufacturing <strong>of</strong> rubber and other non metallic minerals“ and „manufacturing<br />
<strong>of</strong> base metals and fabricated metal“ depend heavily on the demand <strong>of</strong> the construction sector,<br />
value added <strong>of</strong> those declines as well. 29<br />
Real value added increases most in the textile and the chemical industry as their exports grow<br />
significantly and the domestic demand increases as well due to the sharp fall in domestic<br />
prices.<br />
29 Similar are the results <strong>of</strong> Hosoe, 1998.<br />
46
Table 20<br />
Value Added by Activity<br />
Variables in Value (Mio. J.D.)<br />
Sectors SC 0 SC 1 SC 2 SC 3 SC 4 SC 5 SC 6 SC 7<br />
Agriculture 103.3 102.4 101.4 107.5 106.6 105.5 105.8 108.4<br />
(-0.85) (-1.86) (4.11) (3.22) (2.17) (2.47) (4.94)<br />
Mining 114.9 114.9 115.0 118.8 118.9 118.9 117.4 121.7<br />
(0.05) (0.13) (3.44) (3.49 (3.56) (2.24) (5.98)<br />
Food<br />
110.1 110.7 111.4 111.8 112.4 113.2 114.2 116.0<br />
(0.55) (1.22) (1.62 (2.18) (2.85) (3.81) (5.44)<br />
Textiles 32.7 32.7 32.8 35.5 35.6 35.6 37.2 42.9<br />
(0.10) (0.25) (8.73) (8.82) (8.97) (13.83) (31.33)<br />
Wood<br />
33.1 33.2 33.3 33.5 33.5 33.6 34.1 34.9<br />
(0.22) (0.47) (1.08) (1.30) (1.55) (2.91) (5.39)<br />
Chemicals 147.0 147.6 148.4 154.0 154.7 155.5 162.5 173.3<br />
(0.44) (0.99) (4.77) (5.23) (5.80) (10.55) (17.92)<br />
Rubber<br />
64.0 64.1 64.1 63.7 63.8 63.8 64.1 62.8<br />
(0.08) (0.16) (-0.47) (-0.40) (-0.32) (0.20) (-1.89)<br />
Metals<br />
28.8 28.9 29.0 28.7 28.8 28.8 29.0 28.8<br />
(0.22) (0.47) (-0.47) (-0.26) (-0.01) (0.48) (-0.20)<br />
Other<br />
80.2 80.1 80.1 84.3 84.3 84.2 85.2 89.4<br />
(-0.07) (-0.15) (5.17) (5.08) (4.99) (6.19) (11.54)<br />
Electricity. 75.1 75.3 75.5 76.8 77.0 77.1 78.2 80.7<br />
water (0.20) (0.43) (2.22) (2.43) (2.66) (4.02) (7.47)<br />
Construction 166.5 166.5 166.5 166.0 166.0 165.9 166.4 166.3<br />
(0.00) (-0.04) (-0.33) (-0.34) (-0.38) (-0.08) (-0.13)<br />
Services 1979.0 1984.2 1990.8 2068.4 2073.8 2080.5 2121.7 2239.5<br />
(0.26) (0.59) (4.52) (4.79) (5.13) (7.21) (13.16)<br />
Government 877.2 875.9 873.8 837.4 836.2 834.1 818.6 776.2<br />
services (-0.15) (-0.38) (-4.54) (-4.68) (-4.92) (-6.68) (-11.52)<br />
47
Table 21<br />
Compensation <strong>of</strong> Production Factors,<br />
Indices<br />
SC 0 SC 1 SC 2 SC 3<br />
Wage rate<br />
SC 4 SC 5 SC 6 SC 7<br />
All sectors 100.00 100.03 100.04 100.15 100.18 100.20 100.40 101.01<br />
Gross return to capital<br />
Agriculture 100.00 99.15 98.14 104.11 103.22 102.17 102.47 104.94<br />
Mining 100.00 100.05 100.13 103.44 103.49 103.56 102.24 105.98<br />
Food 100.00 100.55 101.22 101.62 102.18 102.85 103.81 105.44<br />
Textiles 100.01 100.10 100.25 108.73 108.82 108.97 113.83 131.33<br />
Wood 100.00 100.22 100.47 101.08 101.30 101.55 102.91 105.39<br />
Chemicals 100.00 100.44 100.99 104.77 105.23 105.80 110.55 117.92<br />
Rubber 100.00 100.08 100.16 99.53 99.60 99.68 100.20 98.11<br />
Metals 100.00 100.22 100.47 99.53 99.74 99.99 100.48 99.80<br />
Other<br />
manufactures<br />
100.01 99.93 99.85 105.17 105.08 104.99 106.19 111.54<br />
Electricity.<br />
water<br />
100.00 100.20 100.43 102.22 102.43 102.66 104.02 107.47<br />
Construction 100.00 100.00 99.96 99.67 99.66 99.62 99.92 99.87<br />
Services 100.01 100.26 100.59 104.52 104.79 105.13 107.21 113.16<br />
Government<br />
services<br />
0 0 0 0 0 0 0 0<br />
48
Table 22<br />
Prices <strong>of</strong> Domestically Produced Goods,<br />
Indices<br />
SC 0 SC 1 SC 2 SC 3<br />
by factor costs<br />
SC 4 SC 5 SC 6 SC 7<br />
Average 100.00 99.99 99.97 99.42 99.41 99.39 99.09 98.65<br />
Agriculture 100.00 99.81 99.58 99.62 99.43 99.20 98.78 97.89<br />
Mining 100.00 100.07 100.14 99.10 99.17 99.24 97.73 97.67<br />
Food 100.00 99.85 99.66 99.82 99.67 99.48 99.13 98.41<br />
Textiles 100.00 100.07 100.16 97.45 97.52 97.60 96.06 90.41<br />
Wood 100.00 99.98 99.95 98.16 98.14 98.11 97.41 96.04<br />
Chemicals 100.00 99.93 99.85 98.02 97.95 97.87 96.62 95.14<br />
Rubber 100.00 100.02 100.05 98.38 98.41 98.43 97.77 96.48<br />
Metals 100.00 99.94 99.86 98.09 98.03 97.95 96.97 94.92<br />
Other<br />
manufactures<br />
100.00 100.05 100.11 96.88 96.93 96.99 96.86 93.69<br />
Electricity.<br />
water<br />
100.00 100.01 100.02 98.54 98.55 98.56 98.14 97.27<br />
Construction 100.00 100.02 100.04 98.57 98.60 98.62 98.07 96.71<br />
Services 100.00 100.20 100.44 102.21 102.40 102.65 103.90 107.18<br />
Government<br />
services<br />
100.00 100.00 100.00 99.43 99.44 99.43 99.30 99.00<br />
by market prices<br />
Average 100.00 99.97 99.93 98.93 98.90 98.86 98.42 97.30<br />
Agriculture 100.00 99.25 98.34 99.83 99.08 98.18 96.93 94.85<br />
Mining 100.00 100.03 100.05 99.03 99.06 99.08 95.62 95.53<br />
Food 100.00 99.89 99.76 98.36 98.25 98.12 97.12 94.44<br />
Textiles 100.00 100.01 100.02 96.51 96.52 96.53 94.31 86.45<br />
Wood 100.00 99.99 99.97 97.28 97.27 97.26 96.37 94.56<br />
Chemicals 100.00 99.95 99.90 97.42 97.37 97.32 96.19 94.48<br />
Rubber 100.00 100.01 100.03 97.23 97.24 97.25 96.18 92.96<br />
Metals 100.00 99.98 99.95 96.95 96.93 96.91 95.47 91.93<br />
Other<br />
manufactures<br />
100.00 100.00 100.01 94.92 94.93 94.93 94.67 89.04<br />
Electricity,<br />
water<br />
100.00 100.01 100.02 98.54 98.55 98.56 98.14 97.27<br />
Construction 100.00 100.02 100.04 98.57 98.60 98.62 98.07 96.71<br />
Services 100.00 100.14 100.30 101.50 101.63 101.80 102.64 104.83<br />
Government<br />
services<br />
100.00 100.00 100.00 99.43 99.44 99.43 99.30 99.00<br />
49
Table 23<br />
Domestic Prices <strong>of</strong> Imports by Commodity Group,<br />
Indices<br />
SC 0 SC 1 SC 2 SC 3 SC 4 SC 5 SC 6 SC 7<br />
Average 100.00 99.87 99.74 97.56 97.43 97.30 96.16 92.46<br />
Agriculture 100.00 98.89 97.79 100.00 98.89 97.79 96.02 92.69<br />
Mining 100.00 100.00 100.00 99.19 99.19 99.19 94.49 94.38<br />
Food 100.00 100.00 100.00 95.55 95.55 95.55 93.29 85.49<br />
Textiles 100.00 100.00 100.00 96.86 96.86 96.86 94.72 85.81<br />
Wood 100.00 100.00 100.00 96.71 96.71 96.71 95.72 93.22<br />
Chemicals 100.00 100.00 100.00 96.42 96.42 96.42 95.48 93.20<br />
Rubber 100.00 100.00 100.00 96.47 96.47 96.47 94.88 89.56<br />
Metals 100.00 100.00 100.00 96.79 96.79 96.79 95.14 90.33<br />
Other 100.00 100.00 100.00 95.22 95.22 95.22 94.96 88.75<br />
manufactures<br />
Services 100.00 100.00 100.00 100.00 100.00 100.00 100.00 100.00<br />
Table 22 shows that domestic prices <strong>of</strong> domestically produced goods (that is prices <strong>of</strong><br />
domestically produced goods at factor costs) fall on average and in almost all sectors except<br />
for the service sector. <strong>The</strong> price increasing effect <strong>of</strong> higher factor costs is thus in most sectors<br />
<strong>of</strong>fset by the price lowering effects <strong>of</strong> cheaper intermediate inputs and the stronger<br />
competition between imports and domestic goods. <strong>The</strong> prices <strong>of</strong> domestically produced goods<br />
at market prices are the prices <strong>of</strong> the Armington aggregates by sector and thus are a weighted<br />
average <strong>of</strong> the domestic prices <strong>of</strong> imports presented in Table 23 and <strong>of</strong> domestically produced<br />
goods at factor costs.<br />
50
Part II<br />
What fiscal budget modification can be performed to overcome the loss <strong>of</strong> tariff<br />
revenues?<br />
<strong>Jordan</strong>´s recent reforms show that it is serious in liberalizing foreign trade and its economic<br />
system in general. It expects that the thereby caused restructuring <strong>of</strong> the economy increases<br />
<strong>Jordan</strong>´s international competitiveness in the medium and long run and thus real growth <strong>of</strong><br />
GDP. Our simulation result that trade liberalization gives no impulse to GDP growth does not<br />
conflict with this view. <strong>The</strong> simulation result has to be understood as cautious forecast <strong>of</strong> the<br />
short run effects in a model where production factors are essentially given. More cause for<br />
concern are the short run consequences <strong>of</strong> trade liberalization on the <strong>Jordan</strong>´s fiscal budget.<br />
We will now discuss how the challenges <strong>of</strong> the Association Agreement in this area can be<br />
addressed.<br />
<strong>The</strong> Association Agreement signed by the EU and <strong>Jordan</strong> comes closest to scenario 3 where<br />
non-agricultural products can enter <strong>Jordan</strong> without duties. According to the results for<br />
scenario 3, the Association Agreement would cause a fall in tariff revenues <strong>of</strong> 37 percent.<br />
However, revenue from all variable taxes together falls by only 12 percent and government<br />
revenue by 5 percent.<br />
Abed (1998) from the <strong>Fiscal</strong> Affairs Department <strong>of</strong> the International Monetary Fund has<br />
listed key tax and tariff policy features <strong>of</strong> a modern tax system. <strong>The</strong>y can be used as<br />
guidelines for the evaluation <strong>of</strong> fiscal policy responses to reduced tariff revenues.<br />
Summarized they are the following:<br />
1. <strong>The</strong> introduction <strong>of</strong> a broad-based, modern Value Added Tax (VAT), preferably with a<br />
single rate and minimal exemptions, applicable equally to domestic products and imports.<br />
2. <strong>The</strong> reform <strong>of</strong> excises through the introduction <strong>of</strong> ad valorem rates or other proper<br />
adjustment for inflation in order to protect real revenue. Excises should be restricted to a<br />
limited set <strong>of</strong> products, principally petroleum products, alcohol, tobacco, and some luxury<br />
items and should as well be applied equally to domestic products and imports.<br />
3. Import tariffs should have a moderate to low average rate and, most importantly, a limited<br />
dispersion <strong>of</strong> rates. Tariff reforms should be generalized to non-EU countries to minimize<br />
the risks <strong>of</strong> trade diversion.<br />
4. Simplification <strong>of</strong> the business pr<strong>of</strong>its tax through the adoption <strong>of</strong> a single rate in the<br />
neighborhood <strong>of</strong> 35 percent and the elimination <strong>of</strong> special tax exemptions.<br />
5. Adjusting the top marginal rates for personal income tax to a level comparable to the<br />
business pr<strong>of</strong>its tax rate and limiting the number <strong>of</strong> deductions and exemptions.<br />
6. Nontax revenue (to the extent that it reflects the extraction <strong>of</strong> surpluses from parastatals or<br />
pr<strong>of</strong>its from central banks), should decline with the development <strong>of</strong> the economy and<br />
especially with the devolution <strong>of</strong> the state´s role in productive activities.<br />
As <strong>Jordan</strong> has already cut its import tariffs in the last years, some measures to compensate for<br />
the loss <strong>of</strong> tariffs have actually been implemented. Furthermore, the <strong>Jordan</strong>ian government<br />
has thought on fiscal responses to the losses <strong>of</strong> tariff revenues still ahead going hand in hand<br />
51
with their structural reforms. We will analyse in the following in how far these measures<br />
conform to the list <strong>of</strong> key tax and tariff reforms presented above.<br />
Ad 1. <strong>The</strong> introduction <strong>of</strong> the supplementary sales tax on imports in 1999 is just a substiute<br />
for abolished tariffs and thus does not conform to the requirement <strong>of</strong> equal treatment <strong>of</strong><br />
domestic products and imports. However, the supplementary sales tax is going to be abolished<br />
in 2001 and thus has only been introduced as a transitory measure to postpone the<br />
consequences <strong>of</strong> the tariff reform and to gain time to reform the fiscal budget. In contrast, the<br />
general raise <strong>of</strong> the GST rate in 1999 from 10 to 13 percent has no distortionary consequences<br />
between imports and home products and does compensate for tariff losses. With a general rate<br />
<strong>of</strong> 13 percent, the GST is still at the lower bound <strong>of</strong> sales taxes in an international comparison<br />
and thus opens scope for a further general increase.<br />
<strong>The</strong> fiscal reforms intended by the <strong>Jordan</strong>ian government include the conversion <strong>of</strong> the GST<br />
into a full-fledged value added tax by 2001. According to these plans the list <strong>of</strong> exemptions<br />
under the GST will be reduced substantially. This is not only sensible for fiscal reasons but<br />
also promotes the restructuring process <strong>of</strong> the local industry which is initiated by trade<br />
liberalization.<br />
Ad 2. Excises in <strong>Jordan</strong> are not ad valorem and there is no adjustment for inflation. <strong>The</strong>y are<br />
restricted to a rather small number <strong>of</strong> goods. However, locally produced goods and imports<br />
are in many cases not treated equally. To our knowledge there are so far no plans to reform<br />
the Specific Sales Tax. It thus seems sensible to us to include a reform <strong>of</strong> excises in the<br />
revenue stabilizing fiscal reform.<br />
Ad 3. As <strong>Jordan</strong> has reformed its tariff schedule such that it will fulfill the criteria for WTO<br />
membership and is establishing Free <strong>Trade</strong> Areas with the MENA countries, the USA and the<br />
EU, <strong>Jordan</strong> has taken the right steps to minimize trade diversion and encourage efficiency<br />
gains from international trade.<br />
Ad 4. and 5. <strong>The</strong> <strong>Jordan</strong>ian government plans to reform the income tax law by 2001. <strong>The</strong><br />
purpose is to rationalize the income tax system by harmonizing and simplifying tax rates and<br />
broadening the tax base. 30<br />
Ad 6. <strong>Jordan</strong> has already privatized and continues to privatize state enterprises. <strong>The</strong><br />
government regards privatization as one <strong>of</strong> the centerpieces <strong>of</strong> its structural policy agenda 31<br />
which is desirable for efficiency reasons. Privatization has effects on the fiscal budget<br />
working in opposite directions. On the one hand the share <strong>of</strong> non-tax revenues in total<br />
government revenue will shrink in the coming years. This will put further strain on the fiscal<br />
budget and calls for compensating measures. On the other hand the bulk <strong>of</strong> privatization<br />
proceeds is planned to be invested in financial assets or used to retire public debt. 32 <strong>The</strong>se<br />
usages enlarge the government‘s fiscal scope.<br />
<strong>The</strong> comparison shows that the tax and tariff reforms planned or already translated into action<br />
by the <strong>Jordan</strong>ian government essentially conform to a modern tax system. <strong>The</strong>y will increase<br />
tax revenues and even leave some scope for a further increase <strong>of</strong> tax revenues. Together with<br />
the privatization <strong>of</strong> public enterprises they will increase the efficiency and competitiveness <strong>of</strong><br />
30 Ministry <strong>of</strong> Finance 2000.<br />
31 Ministry <strong>of</strong> Finance 2000.<br />
32 Ministry <strong>of</strong> Finance 2000.<br />
52
the <strong>Jordan</strong>ian industry and thus they are suitable to address the challenges <strong>of</strong> the association<br />
agreement with the EU.<br />
As the simulation results show, the loss in tariff revenues can be compensated by cutting real<br />
government consumption by about 5 percent and real public investment by about 3 percent.<br />
<strong>The</strong> Ministry <strong>of</strong> Finance mentions several areas in which it sees potential for reducing public<br />
spending. Firstly, the pubic pension system poses a steadily increasing burden on the budget<br />
and thus a reform <strong>of</strong> it is planned. Besides, the Ministry <strong>of</strong> Finance aims at improving the<br />
delivery <strong>of</strong> public services especially in the areas <strong>of</strong> health and education. Finally, last year‘s<br />
fluctuations in oil prices and its negative consequences on the budget have convinced the<br />
government to adopt a strategy <strong>of</strong> relating the domestic prices <strong>of</strong> petroleum products to<br />
petroleum import prices.<br />
<strong>The</strong>se plans <strong>of</strong> <strong>Jordan</strong>´s government do also show suitable starting points to compensate for<br />
the loss <strong>of</strong> tariff revenues on the expenditure side. As they are oriented towards a<br />
strengthening <strong>of</strong> market economy mechanisms, they are in accord with trade liberalization.<br />
<strong>The</strong>refore, imbedding the Association Agreement with the EU in a comprehensive reform<br />
strategy, will most likely enable <strong>Jordan</strong> to overcome possible negative short run effects <strong>of</strong> the<br />
Association Agreement on its fiscal budget.<br />
53
References<br />
Abed, George T. 1998. <strong>Trade</strong> <strong>Liberalization</strong> and Tax Reform in the Southern Mediterranean<br />
Region, International Monetary Fund Working Paper WP/98/49, Washington, D.C.<br />
Budget Department, <strong>Jordan</strong> 2000. Budget Law for the <strong>Fiscal</strong> Year 2000.<br />
Customs Department, <strong>Jordan</strong>. <strong>The</strong> <strong>Jordan</strong>ian Customs Tariff.<br />
Http://www.customs.gov.jo/Customs/guide.html (23 March 2000)<br />
Customs Department, <strong>Jordan</strong>. GST application and Imposition, chapter 2, article 6.<br />
Http://www.customs.gov.jo.gst/law02.html (23 March 2000)<br />
Department <strong>of</strong> Statistics, <strong>Jordan</strong> 2001.<br />
Dervis, Kemal et al. 1982. General equilibrium models for development policy, Cambridge:<br />
Cambridge University Press.<br />
Devarajan, Shantayanan et al. 1999. „Quantifying the fiscal effects <strong>of</strong> trade reform: A general<br />
equilibrium model estimated for 60 countries.“ Mimeo, World Bank.<br />
EIA 2000. „<strong>Jordan</strong>.“ United States Energy Information Administration.<br />
Http://www.eia.doc.gov/emeu/cabs/jordan.html (8 September 2000)<br />
Gunter, Bernhard 1995. „Survey on supply elasticities.“ Mimeo, Economic Development<br />
Institute, World Bank.<br />
Hoekman, Bernhard, Simeon Djankov 1997. „Effective Protection and Investment Incentives<br />
in Egypt and <strong>Jordan</strong> During the Transition to Free <strong>Trade</strong> With Europe.“ World Development,<br />
Vol 25, No. 2: pp. 281-291.<br />
Hosoe, Nobuhiro 1998. „A General Equilibrium Analysis <strong>of</strong> <strong>Jordan</strong>´s <strong>Trade</strong> <strong>Liberalization</strong>.“<br />
Mimeo, Osaka University.<br />
International Monetary Fund 1999. „<strong>Jordan</strong>, Statistical Appendix.“ Washington , D.C.<br />
Martin,Will 2000. „ Assessing the Implications for Lebanon <strong>of</strong> Free <strong>Trade</strong> with the European<br />
Union.“ Mimeo, World Bank.<br />
Ministry <strong>of</strong> Finance, 2000. „Government Finance Bulletin“, Vol.2-No. 8, Amman September<br />
2000.<br />
Ministry <strong>of</strong> Planning, 2000. „Structural Reform: Investment Promotion Law.“ <strong>Jordan</strong> 2000.<br />
Ruebner, Joshua, 2000. „U.S.-<strong>Jordan</strong> Free <strong>Trade</strong> Agreement“, CRS Report for Congress, RL<br />
30652, Washington 2000.<br />
World Bank 1999. „1999 World Development Indicators CD-ROM, World Bank.<br />
Customs Department, <strong>Jordan</strong>. <strong>The</strong> <strong>Jordan</strong>ian Customs Tariff.<br />
Http://www.customs.gov.jo/Customs/guide.html (23 March 2000)<br />
54
Final Report<br />
<strong>Fiscal</strong> <strong>Impact</strong> <strong>of</strong> <strong>Trade</strong> <strong>Liberalization</strong>: <strong>The</strong> <strong>Case</strong> <strong>of</strong> Syria 1<br />
by<br />
Bernd Lucke<br />
University <strong>of</strong> Hamburg<br />
von-Melle-Park 5<br />
D-20146 Hamburg<br />
Germany<br />
email: lucke@hermes1.econ.uni-hamburg.de<br />
April 2001<br />
Research Team:<br />
Pr<strong>of</strong>. Dr. Bernd Lucke, University <strong>of</strong> Hamburg, Germany,<br />
Pr<strong>of</strong>. Dr. Mamdouh Alkhatib Alkswani, King Saud University, Riyad, Saudi Arabia,<br />
Dr. Dorothea Lucke, Lucke Consult, Winsen, Germany,<br />
Dipl.-Ing. agr. Ferdinand Pavel, Humboldt University, Berlin, Germany<br />
Anbara Abu-Ayyash, University <strong>of</strong> Hamburg, Germany.<br />
1<br />
This work has benefited from a financial grant from the Commission <strong>of</strong> the European Communities within the<br />
context <strong>of</strong> the FEMISE program. <strong>The</strong> views expressed are those <strong>of</strong> the beneficiary and therefore in no way<br />
reflect the <strong>of</strong>ficial opinion <strong>of</strong> the Commission. An abbreviated version <strong>of</strong> the full report was presented at the<br />
second FEMISE conference in Marseille, March 29 – March 30, 2001.<br />
55
Part I 2<br />
Section I: Brief description <strong>of</strong> Syria‘s structural features<br />
<strong>The</strong> Syrian Arab Republic is a developing state with a population <strong>of</strong> currently approximately<br />
16.3 million people 3 , growing at the rapid pace <strong>of</strong> about 2.7 percent p. a. Its GDP per head<br />
(converted to US-dollar at the Beirut free market exchange rate) was 988 $ in 1999,<br />
significantly below comparable values <strong>of</strong> 1,565 $ for <strong>Jordan</strong>, 4,042 $ for Lebanon and<br />
16,570 $ for Israel.<br />
However, Syria’s physical conditions are more favorable than this apparent backwardness<br />
might suggest: 32 percent <strong>of</strong> the state territory is classified as cultivable land, with some very<br />
fertile soils especially in the western and north-eastern regions. About 74 percent <strong>of</strong> the land<br />
under crops does not require artificial irrigation. <strong>The</strong> water balance, though deficient, is<br />
supported from significant precipitation in the coastal and mountainous regions as well as<br />
from rivers, in particular the Euphrates. Syria’s proven oil reserves amount to 2.5 billion<br />
barrel; production is sufficient to cover domestic demand plus an export <strong>of</strong> about the same<br />
order <strong>of</strong> magnitude. Natural gas reserves are estimated at 238 billion cubic meters (U.S.<br />
Energy Information Administration, 2000). Thus, while natural resources are far from<br />
abundant, physical conditions are much more favorable than, say, in neighboring <strong>Jordan</strong>.<br />
As far as infrastructure is concerned, Syria’s standards approximately match those <strong>of</strong> other<br />
Arabic countries. Three large ports are located along the Mediterranean coast (Banias,<br />
Latakia, Tartous). <strong>The</strong> country operates five major airports, the most important being<br />
Damascus and Aleppo. <strong>The</strong> length <strong>of</strong> the road net (per 1000 inhabitants) is far larger than in<br />
<strong>Jordan</strong> (2.3 km versus 1.4 km), the same is true for railways. About 75 percent <strong>of</strong> the roads<br />
are asphalted. However, Syria trails <strong>Jordan</strong> in terms motor vehicles per head and in terms <strong>of</strong><br />
telecommunication facilities. <strong>The</strong> installed power generating capacities are comparable to<br />
<strong>Jordan</strong>’s, but production far exceeds sales due to large losses in the network. Similar<br />
conditions prevail in the production and distribution <strong>of</strong> potable water (Central Bureau <strong>of</strong><br />
Statistics, 2000). Illiteracy is still prevalent especially in parts <strong>of</strong> the female rural population,<br />
but school attendance rates are similar to <strong>Jordan</strong>’s at all levels <strong>of</strong> the educational system. <strong>The</strong><br />
Syrian health system also has comparable standards.<br />
About 24 percent <strong>of</strong> gross domestic product (GDP) are produced in the agricultural sector,<br />
another 16 percent are due to mining and quarrying activities, mostly oil production. A rather<br />
large share <strong>of</strong> GDP (19 percent) is attributable to wholesale and retail trade, since this sector<br />
carries the major burden <strong>of</strong> indirect taxation, which relies on excises rather than a value added<br />
tax 4 . Transport, storage and communication accounts for 13 percent <strong>of</strong> GDP, partially because<br />
this sector contains the value added <strong>of</strong> the Syrian Company for Oil Transport (SCOT). <strong>The</strong><br />
manufacturing sector (excluding utilities) is rather small, contributing slightly less than 10<br />
percent to GDP. This sector, rather than being taxed, receives net subsidies from the<br />
2 Note: This report discusses counterfactual simulation results and policy conclusions derived from data <strong>of</strong> 1999,<br />
which was the latest available set <strong>of</strong> Syrian data at the time <strong>of</strong> compilation. <strong>The</strong>refore, all information provided<br />
below relates to 1999, unless otherwise specified. If relevant, we explicitly mention minor changes that occured<br />
in 2000. However, the apparent determination <strong>of</strong> the President Bashar al-Assad to push for economic reforms<br />
may lead to major changes in economic policies, regulations and institutions in 2001 or thereafter. <strong>The</strong> reader<br />
should check if, at the time <strong>of</strong> reading, the information provided in this report is still accurate, as some important<br />
reform measures are currently under discussion in the Syrian parliament.<br />
3 Excluding Palestinian refugees.<br />
4 Note that net domestic product (NDP) at factor cost <strong>of</strong> this sector is only 63 percent <strong>of</strong> its GDP.<br />
56<br />
2
government, so that its share in NDP at factor cost is almost 12 percent. <strong>The</strong> share <strong>of</strong><br />
government services in GDP is about 8 percent, with other activities being <strong>of</strong> minor<br />
importance.<br />
Since the early 1990‘s, Syria has taken gradual steps to transform the country‘s then dominant<br />
economic system <strong>of</strong> central planning to a more market oriented economy. Strong fiscal<br />
incentives to private investors, both foreign and domestic, were provided by Investment Law<br />
No. 10 <strong>of</strong> 1991, basically exempting investment projects from all relevant taxes and customs<br />
duties for five to seven years. In later years, the system <strong>of</strong> multiple exchange rates was<br />
simplified and <strong>of</strong>ficial rates were moved closer to black market rates. Simulateneously, some<br />
<strong>of</strong> the tight import controls relevant for the private sector were relaxed. In response to these<br />
measures, the private sector expanded significantly and real GDP growth averaged 8 percent<br />
from 1991 to 1995 and 5.9 percent from 1991 to 1999. According to estimates by the<br />
International Monetary Fund (IMF), „the private sector accounted for 51 percent <strong>of</strong> GDP, 72<br />
percent <strong>of</strong> total employment, 57 percent <strong>of</strong> gross capital formation, 69 percent <strong>of</strong> non-oil<br />
exports, and 58 percent <strong>of</strong> imports“ over 1992-1997, cf. International Monetary Fund, 1999a,<br />
Box 1.<br />
However, the state’s production activities remain substantial: Oil and natural gas activities,<br />
including refining, are predominantly government-owned, with minority shares <strong>of</strong> foreign<br />
companies 5 only. Utilities (electricity and water plants) are almost exclusively operated by the<br />
government, and the same is true for the air transport industry and all financial institutions.<br />
<strong>The</strong> telecommunications industry is also dominated by the state, but apparently opening up<br />
with recent contracts by the Syrian Telecommunications Establishment (STE) awarded to<br />
selected foreign firms 6 . „Strategic industries“ in manufacturing (some basic foods, alcohol,<br />
tobacco, yarns and cotton textiles, cement, fertilizers, serums, tractors, TV sets and electrical<br />
equipment, ceramics) are dominated or monopolized by the state. Roughly 50 percent <strong>of</strong> the<br />
construction sector and much <strong>of</strong> trade and marketing activities is also in state hands. <strong>The</strong>re<br />
has been no significant privatization <strong>of</strong> public enterprises so far.<br />
Government absorption <strong>of</strong> goods and services (excluding the Price Stabilization Fund (PSF))<br />
accounts for about 28 percent <strong>of</strong> GDP, where 11 percent is classified as government<br />
consumption and 17 percent as „development expenditure“, i. e. government investment. <strong>The</strong><br />
latter includes investment by state-owned companies. <strong>The</strong> largest part <strong>of</strong> government<br />
consumption are wages and salaries (<strong>of</strong> which 57 percent is spent for military and security).<br />
Nevertheless, wages in the public sector are at a demotivatingly low level, giving rise to<br />
widespread corruption. <strong>The</strong> low public sector wages also depress wages in the private sector<br />
(US Department <strong>of</strong> State, 2000). National Accounts Data do not contain information on the<br />
distribution <strong>of</strong> income, but in<strong>of</strong>ficial estimates suggest that the capital share in national<br />
income is up to three times as high as the labor share, cf. Augier and Gasiorek (2000).<br />
<strong>The</strong> basic sources <strong>of</strong> government revenues are oil-related proceeds, non-oil taxes and duties,<br />
and non-oil public enterprise surpluses. Oil-related revenues constitute a share <strong>of</strong> about 38<br />
percent <strong>of</strong> total revenues (depending on world market prices), while the share <strong>of</strong> non-oil taxes<br />
including duties is around 48 percent. Non-oil public enterprises contribute approximately 12<br />
percent to total revenues, which is only slightly larger than the surplus <strong>of</strong> the Syrian<br />
Petroleum Company (SPC) and associated firms. <strong>The</strong> state budget deficit (excluding PSF<br />
deficit, but including reduced reserves) amounts to 32 percent <strong>of</strong> total expenditures for the<br />
1999 budget or 9.9 percent <strong>of</strong> GDP.<br />
5 Deminex, Shell, Conoco, Elf Aquitaine, Marathon.<br />
6 Bosch, Samsung, Siemens, and, most notably, Ericsson with a contract volume <strong>of</strong> approximately $110 million.<br />
57<br />
3
<strong>The</strong> Price Stabilization Fund (PSF) is not consolidated in the government budget. Under the<br />
PSF system, a general wheat subsidy is enforced, which makes bread cheaply available. In<br />
addition, each Syrian citizen is entitled to purchase a limited amount <strong>of</strong> basic foodstuffs like<br />
sugar and rice at less than the market price, cf. International Monetary Fund, 1999b. Despite<br />
own revenues from price surcharges and budgetary transfers, PSF operations cause a large<br />
deficit which increases the consolidated government sector deficit to 12.2 percent <strong>of</strong> GDP.<br />
Investment expenditures (both public and private) benefit from extremely low import tariffs<br />
on capital goods. Similarly, raw materials for industrial use can be imported virtually at world<br />
market prices. On the other hand, consumer goods <strong>of</strong>ten have rather high tariff rates in accord<br />
with traditional import substitution policies. For details <strong>of</strong> the foreign trade and multiple<br />
exchange rate system, see below.<br />
Finally, the financial sector in Syria is clearly underdeveloped, both in terms <strong>of</strong> competition<br />
and product differentiation. <strong>The</strong> Commercial Bank <strong>of</strong> Syria is the dominant player, serving<br />
mainly the government and the public enterprises. <strong>The</strong> volume <strong>of</strong> credit to private enterprises<br />
is small and an unregulated market for foreign exchange does not exist. <strong>The</strong> savings rate <strong>of</strong><br />
private households is low (6.4 percent in 1999), thus forcing the government to finance large<br />
parts <strong>of</strong> its deficit externally. <strong>The</strong> <strong>of</strong>ficially acknowledged external debt was about $4.9<br />
billion at end-1998 with an undisclosed ruble debt <strong>of</strong> possibly the same order <strong>of</strong> magnitude<br />
according to IMF estimates, totaling to about 58 percent <strong>of</strong> GDP.<br />
58<br />
4
Section II: External <strong>Trade</strong> Flows by product, origin, and destination<br />
<strong>The</strong> material documented in this section is taken from Syria’s Foreign <strong>Trade</strong> Statistics<br />
(Central Bureau <strong>of</strong> Statistics, 1999) and the Statistical Abstract (Central Bureau <strong>of</strong> Statistics,<br />
2000).<br />
II.1 Syria’s 1999 foreign trade by product groups<br />
Syria’s export structure (disaggregated according to the 5-digit Standard International <strong>Trade</strong><br />
Classification (SITC)) is dominated by crude oils from petroleum or bituminous minerals<br />
(SITC333.00), which accounts for 63 percent <strong>of</strong> the total export value. <strong>The</strong> second-most<br />
important export group is cotton (not carded or combed, SITC263.10), which has a share <strong>of</strong><br />
4.5 percent in total exports. <strong>The</strong>re are six more commodity groups, whose share in total export<br />
value exceeds one percent, cf. Table 1:<br />
Table 1<br />
Most Important Exports by Product Groups, 1999<br />
Product group SITC code Export value, Share in total<br />
(million US $) export value<br />
CRUDE OIL FROM PETROLEUM OR<br />
BITUMINOUS MINERALS<br />
333.00 2,185 0.629<br />
COTTON (OTHER THAN LINTERS), NOT<br />
CARDED OR COMBED<br />
263.10 156 0.045<br />
TOMATOES, FRESH OR CHILLED 54.40 95 0.027<br />
FUEL OILS, N.E.S. 334.40 84 0.024<br />
SHAWLS, SCARVES, MUFFLERS, MANTILLAS<br />
ETC, KNIT/CRO<br />
846.93 55 0.016<br />
SHEEP, LIVE 1.21 55 0.016<br />
GASOLINE INCLUDING AVIATION (EXCEPT JET)<br />
FUEL<br />
334.11 48 0.014<br />
STONE FRUIT, N.E.S., FRESH 57.93 37 0.011<br />
Three out <strong>of</strong> the eight most important export groups are oil-related, four are agricultural. <strong>The</strong><br />
figures thus hint at a rather uncompetitive manufacturing sector – besides from suggesting<br />
that Syria may run into serious problems <strong>of</strong> external imbalance when domestic oil supplies are<br />
depleted. According to some estimates (cf. U.S. Energy Information Administration, 2000)<br />
proven oil reserves last for only about ten more years, so that Syria may become a net<br />
importer <strong>of</strong> oil within the next decade. This not completely unfamiliar perspective (the last<br />
time Syria was a net oil importer was 1987) underscores the necessity <strong>of</strong> immediate economic<br />
reform and trade liberalization.<br />
This impression is reinforced by a look at total exports by one-digit SITC classification, cf.<br />
Table 2. Food, live animals, and crude materials are the main source <strong>of</strong> export revenues for<br />
the Syrian economy with export proceeds from these sources summing to 89 percent <strong>of</strong> total<br />
exports.<br />
59<br />
5
Table 2<br />
Exports by Product Groups, 1999<br />
Product group SITC code Export value, Share in total<br />
(million US $) export value<br />
FOOD & LIVE ANIMALS 0 549 0.158<br />
BEVERAGES & TOBACCO 1 5 0.002<br />
INEDIBLE CRUDE MATERIALS EXCEPT FUELS 2 221 0.064<br />
MINERAL FUELS, LUBRICANTS & RELATED<br />
3 2,332 0.672<br />
MATERIAL<br />
ANIMAL & VEGETABLE OILS, FATS AND WAXES 4 16 0.005<br />
CHEMICALS AND RELATED PRODUCTS 5 30 0.009<br />
MANUFACTURED GOODS CLASSIFIED CHIEFLY 6 135 0.039<br />
BY MATERIAL<br />
MACHINERY &TRANSPORT EQUIPMENT 7 8 0.002<br />
MISCELLANEOUS ARTICLES 8 175 0.051<br />
COMMODITIES AND TRANSACTIONS N.E.S. 9 0 0.000<br />
Total 3,471 1.000<br />
Focusing on export <strong>of</strong> manufactures only, Table 3 shows the most important export activities<br />
by the Economic Activity Classification (EAC). We can identify twelve activities whose share<br />
in total export proceeds from manufactures exceeds one percent. <strong>The</strong>se activities contribute<br />
89 percent <strong>of</strong> total export proceeds from manufactures. Again, oil related activities<br />
(manufacture <strong>of</strong> refined petroleum) lead the list with a large share <strong>of</strong> 22 percent. However, the<br />
shares <strong>of</strong> four textile activities sum to 31 percent and much <strong>of</strong> the remaining shares is related<br />
to garment, leather or food processing. Exports <strong>of</strong> chemicals have some importance for<br />
fertilizers and products for personal needs.<br />
Table 3<br />
Most Important Manufactured Exports by Economic Activity, 1999<br />
Economic Activity EAC code Export value,<br />
(million US $)<br />
60<br />
6<br />
Share in total<br />
value <strong>of</strong> exported<br />
manufactures<br />
MANUFACTURE OF REFINED PETROLEUM 2320 142 0.217<br />
MANUF OF KNITTED AND CROCH. FABRICS 1730 117 0.180<br />
PROCESSING AND PRESERVING OF FRUIT<br />
AND VEGETABLES<br />
1513 93 0.143<br />
MANUF. OF WEARING APPAREL EXCEPT FUR 1810 48 0.073<br />
MANUFACTURE OF MADE-UP TEXTILE<br />
ARTICLES, EXCEPT APPAREL<br />
1721 39 0.060<br />
PREPARATION AND SPINNING OF TEXTILE<br />
FIBRES<br />
1711 38 0.058<br />
MANUF. OF FERTILIZERS & NITR. COMP. 2412 31 0.048<br />
MANUFACTUR OF SOAP & DETERGENTS<br />
PERFUMES<br />
2424 22 0.034<br />
MANUFACTURE OF FOODWEAR 1920 20 0.030<br />
MANUF. OF VEGET. & ANIMAL OILS AND FATS 1514 16 0.025<br />
TANNING AND DRESSING OF LEATHER 1911 8 0.012<br />
MANUFACTURE OF OTHER TEXTILES 1729 7 0.011
Turning to imports; Table 4 shows the imported product groups with a share in total import<br />
value exceeding 1 percent. <strong>The</strong>se are 23 commodity groups which account fo 45 percent <strong>of</strong><br />
total imports. Only two <strong>of</strong> these are capital goods, namely motor vehicles for the transport <strong>of</strong><br />
goods and milling machinery, with a consolidated import share <strong>of</strong> 6.6 percent. Most <strong>of</strong> the<br />
other main import products must be classified either as food or as material inputs. Finished<br />
goods (other than food or capital goods) are apparently <strong>of</strong> minor importance in Syria’s import<br />
structure – a particlarity due to Syria’s customs system, see below.<br />
Table 4<br />
Most Important Imports by Product Groups, 1999<br />
Product group SITC Export value, Share in total<br />
code (million US $) export value<br />
MOTOR VEHICLES FOR THE TRANSPORT OF<br />
GOODS<br />
782.10 184 0.050<br />
OTHER SUGARS 61.29 152 0.041<br />
SYNTHETIC FILAMENT YARN NOT PUT UP FOR<br />
RETAIL SALE<br />
651.50 131 0.035<br />
IRON AND STEEL BARS; RODS; ANGLES; SHAPES<br />
AND SECTIONS (INCLUDING SHEET PILING)<br />
676.00 116 0.031<br />
FLAT ROLLED PRODUCTS OF IRON OR NON ALLOY<br />
STEEL; NOT CLAD; PLATED OR COATED NES<br />
673.50 109 0.029<br />
OTHER SYNTHETIC FILAMENT YARN (NO SEWING<br />
THREAD)<br />
651.59 85 0.023<br />
MAIZE (NOT INCLUDING SWEET CORN) UNMILLED,<br />
NO SEED<br />
44.90 75 0.020<br />
ALLOY STEEL (EXCEPT STAINLESS) WIRE 678.29 69 0.019<br />
CONIFEROUS WOOD SAWN OR CHIPPED<br />
LENGTHWISE SLICED OR PEELED OVER 6MM<br />
248.20 66 0.018<br />
BARLEY, UNMILLED 43.00 60 0.016<br />
MACHINERY USED IN THE MILLING INDUSTRY OR<br />
FOR THE WORKING OF CEREALS OR DRIED<br />
LEGUMINOUS VEGETABLES<br />
727.10 58 0.016<br />
OTHER TUBES AND PIPES 679.30 56 0.015<br />
PETROLEUM GASES AND OTHER GASEOUS<br />
HYDROCARBONS NES<br />
344.00 53 0.014<br />
RICE HUSKED NOT FURTHER PREPARED (CARGO<br />
OR BROWN RICE)<br />
42.20 50 0.014<br />
FISH, PREPARED OR PRESERVED, N.E.S. 37.16 50 0.013<br />
WOVEN FABRICS OF SYNTHETIC FILAMENT YARN;<br />
OTHER THAN PILE AND CHENILLE FABRICS<br />
653.10 49 0.013<br />
TEA 74.10 45 0.012<br />
MILK, IN SOLID FORM, FAT CONTENT, BY<br />
WEIGHTGT, NOT OVER 1.5%<br />
22.21 43 0.012<br />
POLYETHYLENE 571.10 42 0.011<br />
CHEMICAL ELEMENTS & COMPOUNDS DOPED TO<br />
USE IN ELECTRONICS<br />
598.50 41 0.011<br />
LARD; PIG FAT NES AND POULTRY FAT,<br />
RENDERED<br />
411.20 41 0.011<br />
OIL-CAKE, ETC FROM OIL SEEDS & OLEAGINOUS<br />
FRUITS<br />
81.30 41 0.011<br />
FLAT ROLLED PRODUCTS OF IRON OR NON_ALLOY<br />
STEEL; PLATED OR COATED WITH ZINC<br />
674.10 39 0.010<br />
61<br />
7
Looking at total imports, the picture changes slightly. Capital goods (mostly SITC7 1 ) now<br />
show an increased import share <strong>of</strong> about 22 percent. <strong>The</strong> largest import group, however, are<br />
manufactures classified chiefly by material (SITC6), many <strong>of</strong> which, as Table 4 suggests, are<br />
semi-finished goods. <strong>The</strong> import <strong>of</strong> food and live animals with an import share <strong>of</strong> 18 percent<br />
is larger in value than the respective exports, although the latter is the most important non-oil<br />
export activity in the one digit SITC classification. <strong>Trade</strong> in chemicals (with an import share<br />
<strong>of</strong> 13 percent) is also deficient. Thus, apart from crude materials, Syria’s trade balance by<br />
one-digit SITC classification is negative everywhere except for the rather small position <strong>of</strong><br />
miscellaneous articles (SITC8).<br />
Table 5<br />
Imports by Product Groups, 1999<br />
Product group SITC code Import value, Share in total<br />
(million US $) import value<br />
FOOD & LIVE ANIMALS 0 708 0.184<br />
BEVERAGES & TOBACCO 1 11 0.003<br />
INEDIBLE CRUDE MATERIALS EXCEPT FUELS 2 180 0.047<br />
MINERAL FUELS, LUBRICANTS & RELATED<br />
3 108 0.028<br />
MATERIAL<br />
ANIMAL & VEGETABLE OILS, FATS AND WAXES 4 109 0.028<br />
CHEMICALS AND RELATED PRODUCTS 5 482 0.125<br />
MANUFACTURED GOODS CLASSIFIED CHIEFLY 6 1,220 0.318<br />
BY MATERIAL<br />
MACHINERY &TRANSPORT EQUIPMENT 7 846 0.220<br />
MISCELLANEOUS ARTICLES 8 78 0.020<br />
COMMODITIES AND TRANSACTIONS N.E.S. 9 99 0.026<br />
Total 3,840 1.000<br />
It may be useful to conclude this section by looking at the foreign trade shares <strong>of</strong> Syria’s<br />
public and private sectors, sorted by nature or utilization <strong>of</strong> commodities, cf. Table 6. Export<br />
data are given merely for completeness, their structure does hardly reveal new insights but<br />
basically reflects the importance <strong>of</strong> oil exports. For import data, however, we note that private<br />
sector production requires relatively more raw materials and relatively less semi-finished<br />
goods than public sector production. This is in line with the fact that the state still controls<br />
much <strong>of</strong> the technologically advanced industries, whereas the private sector is characterized<br />
by more basic productive activities. Moreover, the private sector does not necessarily catch up<br />
with the public sector, since the ratio <strong>of</strong> imported capital goods to intermediates is much less<br />
favorable for the private sector than for the government sector.<br />
1 87 percent <strong>of</strong> Syrian capital goods imports are from SITC7, 10 percent from SITC6, and 3 percent from SITC8.<br />
Capital goods imports from SITC0 and SITC5 are negligible.<br />
62<br />
8
Table 6<br />
Foreign <strong>Trade</strong> by Nature and Utilization <strong>of</strong> Item, 1999<br />
Nature <strong>of</strong> item Total export<br />
value (million<br />
US $)<br />
Public<br />
share<br />
63<br />
9<br />
Private<br />
share<br />
Total import<br />
value (million<br />
US $)<br />
Public<br />
share<br />
Private<br />
share<br />
Raw materials 2,903 0.824 0.176 437 0.076 0.924<br />
Semi-finished 417 0.340 0.660 1,559 0.289 0.711<br />
Finished 152 0.183 0.817 1,827 0.141 0.859<br />
Total 3,471 0.738 0.262 3,823 0.194 0.806<br />
Utilization <strong>of</strong> item<br />
Final consumption 680 0.005 0.995 638 0.118 0.882<br />
Intermediate<br />
consumption<br />
2,783 0.919 0.081 2,261 0.168 0.832<br />
Capital 8 0.022 0.978 924 0.308 0.692<br />
Total 3,471 0.738 0.262 3,823 0.194 0.806<br />
II.2 Syria’s 1999 exports by destination<br />
<strong>The</strong> following analysis disaggregates Syria’s 1999 exports by one digit SITC classification<br />
(without SITC9, which is zero) and eight major trading partners:<br />
Arabic States (Arab)<br />
(Algeria, Bahrein, Egypt, Iraq, <strong>Jordan</strong>, Kuwait, Lebanon, Libya, Morocco, Mouritania, Saudi<br />
Arabia, Somalia, Sudan, Tunisia, United Arab Emirates, Yemen),<br />
European Union (EU 15)<br />
(Austria, Belgium, Denmark, Finland, France, Germany, Greece, Ireland, Italy, Luxemburg,<br />
Netherlands, Portugal, Spain, Sweden, United Kingdom),<br />
Formerly socialist countries (Ex-Soc.)<br />
(Bulgaria, Byelorussia, China, Cuba, Czech Republic, Hungary, Poland, Rumania, Russia,<br />
Serbia, Ukraine),<br />
United States <strong>of</strong> America (USA) ,<br />
Argentina, Brasil, Chile (ABC),<br />
Turkey,<br />
Japan,<br />
and the rest <strong>of</strong> the world (ROW).
Table 7<br />
Exports by product group and destination, 1999<br />
(million US $)<br />
SITC0 SITC1 SITC2 SITC3 SITC4 SITC5 SITC6 SITC7 SITC8 Total<br />
Arab 412 5 44 75 11 11 73 6 91 728<br />
EU 15 33 0 70 1.930 1 1 42 0 37 2113<br />
Ex-Soc. 19 0 7 0 0 2 8 0 31 68<br />
USA 5 0 12 18 0 0 1 0 8 45<br />
ABC 4 0 0 8 0 0 0 0 1 13<br />
Turkey 34 0 16 265 3 1 2 0 1 321<br />
Japan 0 0 10 0 0 0 0 0 0 10<br />
ROW 42 0 62 36 0 15 9 1 7 172<br />
Total 549 5 221 2332 16 30 135 8 175 3471<br />
Table 7 shows the distribution <strong>of</strong> exports across product groups and trading partners. Major<br />
destinations are the Arab countries (mostly for food and live animals), the European Union<br />
(mostly for oil-related exports), and Turkey (also mostly for oil exports).<br />
Table 8<br />
Export shares <strong>of</strong> product groups by trading partner, 1999<br />
SITC0 SITC1 SITC2 SITC3 SITC4 SITC5 SITC6 SITC7 SITC8 Total<br />
Arab 0.566 0.007 0.060 0.103 0.016 0.015 0.100 0.009 0.125 1.000<br />
EU 15 0.015 0.000 0.033 0.913 0.001 0.000 0.020 0.000 0.017 1.000<br />
Ex-Soc. 0.285 0.001 0.105 0.003 0.001 0.028 0.123 0.004 0.450 1.000<br />
USA 0.113 0.001 0.262 0.405 0.009 0.001 0.024 0.001 0.185 1.000<br />
ABC 0.307 0.000 0.000 0.603 0.005 0.004 0.019 0.000 0.061 1.000<br />
Turkey 0.106 0.001 0.049 0.823 0.008 0.004 0.006 0.001 0.004 1.000<br />
Japan 0.000 0.000 0.975 0.000 0.000 0.024 0.000 0.001 0.000 1.000<br />
ROW 0.245 0.000 0.363 0.208 0.002 0.087 0.051 0.005 0.039 1.000<br />
Table 8 presents the shares <strong>of</strong> each product group for exports directed at a specific trading<br />
partner. Thus, 57 percent <strong>of</strong> exports to other Arab countries belong to SITC0, 6 percent are<br />
non-oil raw materials, and 10 percent are fuels. In addition, a substantial share <strong>of</strong> 23 percent<br />
<strong>of</strong> these exports are manufactures (SITC6, 7, and 8). For the European Union, on the other<br />
hand, all product groups but raw materials are relatively unimportant – and most <strong>of</strong> the raw<br />
materials is oil. Turkey’s structure is slightly different from the EU’s in that besides oil and<br />
other raw materials there is also an 11 percent share <strong>of</strong> food and live animals. All other<br />
trading blocks, as shown above, have only minor importance as destination for Syrian<br />
products.<br />
64<br />
10
Table 9<br />
Export shares <strong>of</strong> trading partners by product group, 1999<br />
SITC0 SITC1 SITC2 SITC3 SITC4 SITC5 SITC6 SITC7 SITC8<br />
Arab 0.750 0.943 0.198 0.032 0.699 0.366 0.540 0.780 0.518<br />
EU 15 0.059 0.002 0.317 0.828 0.084 0.030 0.310 0.041 0.209<br />
Ex-Soc. 0.035 0.012 0.033 0.000 0.003 0.062 0.062 0.032 0.175<br />
USA 0.009 0.005 0.053 0.008 0.025 0.001 0.008 0.006 0.047<br />
ABC 0.007 0.000 0.000 0.003 0.004 0.002 0.002 0.000 0.005<br />
Turkey 0.062 0.033 0.071 0.113 0.160 0.039 0.014 0.026 0.007<br />
Japan 0.000 0.000 0.046 0.000 0.000 0.008 0.000 0.001 0.000<br />
ROW 0.077 0.005 0.283 0.015 0.024 0.493 0.065 0.113 0.038<br />
Total 1.000 1.000 1.000 1.000 1.000 1.000 1.000 1.000 1.000<br />
<strong>The</strong> share <strong>of</strong> each trading partner by product group is given in Table 9. From this, we infer<br />
that 75 % <strong>of</strong> food and live animal exports go to Arab countries, with minor shares <strong>of</strong> around<br />
five percent sold to the EU, formerly scialist countries, Turkey and the rest <strong>of</strong> the world.<br />
American countries buy virtually nothing from this product group. Beverages and tobaccos<br />
(SITC1) are also predominantly exported to Arab countries. <strong>The</strong> EU is the largest buyer <strong>of</strong><br />
non-oil raw materials (SITC2) with a share <strong>of</strong> 32 percent, while Arab countries account for 20<br />
percent. <strong>The</strong> remaining sales <strong>of</strong> this product group go to various countries across the world,<br />
mostly in minor shares. A large share <strong>of</strong> 83 percent <strong>of</strong> the oil-related raw materials (SITC3) is<br />
exported to the European Union, another 11 percent to Turkey. Animals and vegetables fats<br />
(SITC4) are mostly sold to Arab countries (70 percent) and Turkey (16 percent), the EU’s<br />
share is 8 percent. Chemicals (SITC5) go to Arab (37 percent) and various other countries (50<br />
percent), they are apparently bought in only very small quantities by developed countries.<br />
However, the European Union holds a significant share <strong>of</strong> 31 percent <strong>of</strong> Syria’s exports <strong>of</strong><br />
certain manufactures classified primarily by material (SITC6), only dominated by Arab<br />
countries (54 percent). For capital goods (SITC7), demand is again largest from Arab<br />
countries (78 percent), the EU buys four percent and the rest goes to various other countries.<br />
Syria’s export structure for miscellaneous manufactures collected in SITC8 looks similar to<br />
the structure for SITC6 with a smaller, but still substantial EU-share <strong>of</strong> 21 percent.<br />
Turning to imports, Table 10 gives Syrian imports 1999 by product group and origin. A<br />
particularity <strong>of</strong> the Syrian import statistics is the existence <strong>of</strong> „suitcase imports“, which are<br />
imported by passengers without proper classfication. <strong>The</strong>se imports are not negligible (an<br />
estimated import volume <strong>of</strong> 98 million US $ for 1999), but they are mechanically listed under<br />
imports from the rest <strong>of</strong> the world in SITC9 (commodities and transactions not listed<br />
elsewhere). Since SITC9 is economically uninformative and zero for all other trading blocks,<br />
it is not shown in Tables 10, 11, and 12 below. Consequently, however, the import total for<br />
the rest <strong>of</strong> the world is not equal to the sum <strong>of</strong> the column entries in Table 10 and the sum <strong>of</strong><br />
the import shares in Table 11 does not yield unity in Table 11.<br />
65<br />
11
Table 10<br />
Imports by product group and origin, 1999<br />
(million US $)<br />
SITC0 SITC1 SITC2 SITC3 SITC4 SITC5 SITC6 SITC7 SITC8 Total<br />
Arab 54 1 28 16 23 107 66 20 3 317<br />
EU 15 230 4 31 58 7 232 237 342 26 1167<br />
Ex-Soc. 76 0 65 14 0 37 377 66 16 651<br />
USA 54 5 15 0 0 16 43 35 6 175<br />
ABC 100 0 12 0 0 4 18 6 0 139<br />
Turkey 34 0 2 7 38 13 77 18 1 190<br />
Japan 0 1 1 0 0 5 35 107 7 156<br />
ROW 157 0 26 13 40 67 361 248 17 1028<br />
Total 705 11 179 108 108 479 1215 842 78 3823<br />
Most <strong>of</strong> Syria’s imports originate from the European Union, but imports from formerly<br />
socialist countries are also considerable. Arab countries rank third and lots <strong>of</strong> the imports is<br />
scattered through various other countries. Almost 30 percent <strong>of</strong> imports from the EU are<br />
capital goods, around 20 percent each are agricultural products, chemicals, and manufactures.<br />
By contrast, only 10 percent <strong>of</strong> the imports from formerly socialist countries are capital goods<br />
and only six percent are chemicals. Instead, lots <strong>of</strong> non-capital manufactures (about 60<br />
percent <strong>of</strong> the import value in SITC6 and SITC8) are imported from this group <strong>of</strong> countries,<br />
along with about 12 percent for food and live animals and 10 percent <strong>of</strong> non-oil raw materials<br />
(SITC0 and SITC2, respectively).<br />
Chemicals (SITC5) are the most important products imported from other Arab countries (34<br />
percent share), followed by non-capital manufactures (22 percent) and agricultural products<br />
(17 percent). <strong>The</strong> main imports from the United States are food (31 percent), non-capital<br />
manufactures (25 percent), and capital goods (20 percent), while from the ABC countries it is<br />
primarily food (72 percent). Imports from Japan are very strongly capital oriented (69<br />
percent) and almost all <strong>of</strong> the remaining imports is manufatures. Turkey, finally, is important<br />
as a supplier <strong>of</strong> manufactures (41 percent) and agricultural products (38 percent for SITC0<br />
and SITC4).<br />
Table 11<br />
Import shares <strong>of</strong> product groups by trading partner, 1999<br />
SITC0 SITC1 SITC2 SITC3 SITC4 SITC5 SITC6 SITC7 SITC8 Total<br />
Arab 0.171 0.002 0.087 0.051 0.071 0.336 0.208 0.064 0.009 1.000<br />
EU 15 0.197 0.003 0.027 0.049 0.006 0.199 0.203 0.293 0.023 1.000<br />
Ex-Soc. 0.117 0.000 0.100 0.021 0.000 0.056 0.579 0.101 0.025 1.000<br />
USA 0.307 0.029 0.085 0.000 0.000 0.092 0.246 0.203 0.037 1.000<br />
ABC 0.717 0.000 0.084 0.000 0.001 0.027 0.128 0.040 0.003 1.000<br />
Turkey 0.181 0.000 0.009 0.038 0.203 0.066 0.405 0.094 0.005 1.000<br />
Japan 0.001 0.003 0.003 0.000 0.000 0.030 0.227 0.688 0.047 1.000<br />
ROW 0.153 0.000 0.025 0.013 0.039 0.065 0.351 0.242 0.017 0.905<br />
66<br />
12
Looking at import shares <strong>of</strong> trading partners disaggregated by product groups, cf. Table 12,<br />
we find the European Union as the largest supplier <strong>of</strong> food products (32 percent <strong>of</strong> all such<br />
imports, followed by the ABC countries (14 percent), formerly socialist countries (11<br />
percent). A substantial share <strong>of</strong> 22 percent is scattered throughout the rest <strong>of</strong> the world. <strong>The</strong><br />
United States are the leading supplier for tobaccos and beverages (48 percent), followed by<br />
the EU (37 percent). Non-mineral raw materials are mostly imported from formerly socialist<br />
states (37 percent), next come the EU with a share <strong>of</strong> 17 percent and Arab countries with a<br />
share <strong>of</strong> 15 percent in this product category. For mineral fuels, the EU is even the largest<br />
supplier (53 percent or a volume <strong>of</strong> 58 million US $). Turkey is the largest single supplier <strong>of</strong><br />
animal and vegetable fats(36 percent), followed by Arab countries (21 percent). Chemicals<br />
are to a large part imported from the EU (48 percent import share), Arab countries are second<br />
with 22 percent. Here, surprisingly, the share <strong>of</strong> other developed countries is small.<br />
Manufactures classified in SITC6 are mostly imported from formerly socialist countries (31<br />
percent), while the EU’s share is only 20 percent. (<strong>The</strong> situation is slightly more favorable for<br />
the EU in SITC8, but note that the volume in the latter category is very low). For capital<br />
goods, finally, the EU is the predominant supplier with a share <strong>of</strong> 41 percent, followed by<br />
Japan with 13 percent and formerly socialist countries with 8 percent. <strong>The</strong> rest <strong>of</strong> capital<br />
goods imports is scattered throughout the world.<br />
Table 12<br />
Import shares <strong>of</strong> trading partners by product group, 1999<br />
SITC0 SITC1 SITC2 SITC3 SITC4 SITC5 SITC6 SITC7 SITC8<br />
Arab 0.077 0.069 0.154 0.151 0.209 0.223 0.054 0.024 0.038<br />
EU 15 0.326 0.372 0.174 0.534 0.064 0.484 0.195 0.406 0.339<br />
Ex-Soc. 0.108 0.001 0.365 0.128 0.000 0.077 0.310 0.078 0.208<br />
USA 0.076 0.476 0.083 0.000 0.000 0.034 0.035 0.042 0.083<br />
ABC 0.142 0.000 0.066 0.000 0.002 0.008 0.015 0.007 0.006<br />
Turkey 0.049 0.000 0.010 0.067 0.356 0.026 0.063 0.021 0.011<br />
Japan 0.000 0.049 0.003 0.001 0.000 0.010 0.029 0.127 0.094<br />
ROW 0.223 0.032 0.145 0.119 0.368 0.140 0.297 0.295 0.222<br />
Total 1.000 1.000 1.000 1.000 1.000 1.000 1.000 1.000 1.000<br />
67<br />
13
Section III: Indirect taxes<br />
<strong>The</strong> tax system in the Syrian Arab Republic is difficult to structure, since the distinction<br />
between direct and indirect taxes for instance in the government budget plan (cf. Central<br />
Bureau <strong>of</strong> Statistics, 2000) does not follow internationally established standards. See, e. g.<br />
Corm, 1997, who also deplores this fact. Moreover, the classification used in the government<br />
budget is inconsistent with the classification <strong>of</strong> indirect taxes in the system <strong>of</strong> national<br />
accounts.<br />
In the government budget plan, position 62 lists the expected revenue <strong>of</strong> Syria’s indirect<br />
taxes. For 1999, this position amounts to 23.4 billion Syrian Pounds (LS). In the system <strong>of</strong><br />
national accounts, however, 1999 indirect taxes (net <strong>of</strong> subsidies!) are shown as 40.6 billion<br />
LS, i. e. indirect taxes (gross <strong>of</strong> sbsidies) are even larger. In fact, a detailed analysis <strong>of</strong> the<br />
government budget shows the existence <strong>of</strong> various revenues outside <strong>of</strong> position 62 with<br />
economic designs similar or equivalent to indirect taxes. Table 13 gives an overview over<br />
indirect taxes as listed in the government budget and identifies revenues not listed under<br />
position 62, although there economic effect is similar.<br />
Table 13<br />
Indirect Taxes according to Budget Plan, 1999<br />
Budget Type <strong>of</strong> revenue Revenue<br />
position<br />
in billion LS<br />
61.08 Tax on television sets 0.020<br />
61.09 Tax on Arms‘ permits 0.007<br />
61.10 Exit duty 1.100<br />
61.11 Fees on sale, transfer, and registration <strong>of</strong> property 0.500<br />
61.12 Taxes on motor vehicles 1.800<br />
61.13 Irrigation fees 0.120<br />
61.14 Tax on general securities 0.230<br />
61.15 Tax on luxury consumption 1.150<br />
61.16 Tax on emigrants 0.150<br />
62.01 Excise on cement 0.110<br />
62.02 Excise on fuels 0.075<br />
62.03 Excise on electricity consumption 0.475<br />
62.04 Excise on sugar 0.100<br />
62.05 Excise on alcoholic beverages 0.200<br />
62.06 Excise on tobacco 0.800<br />
62.07 Excise on salt 0.015<br />
62.08 Tax on entertainments 0.040<br />
62.09 Tax on agricultural production 0.900<br />
62.10 Tax on cotton exportation 1.000<br />
62.11 Fees on the notary public 0.012<br />
62.12 Customs duties 11.100<br />
62.13 Statistics fees 2.100<br />
62.14 Foreign trade fees 1.150<br />
62.15 Duties on import <strong>of</strong> radio sets 0.095<br />
62.16 Stamp fees 4.000<br />
68<br />
14
62.17 Excise on hunting, fishing, and vessels 0.002<br />
62.18 Excise on mines and quarries 0.007<br />
62.19 Consular fees 0.920<br />
62.20 Duties on antiquities trade -<br />
62.21 Taxes on commercial and industrial property protection 0.003<br />
62.22 Justicial fees 0.300<br />
71.05 Additions to taxes and duties for teaching buildings 1.000<br />
73 Government royalties <strong>of</strong> joint oil fields 17.235<br />
81.02 Transit duties 0.400<br />
82.07 Different revenues 19.000<br />
Total 66.116<br />
<strong>The</strong>se are 35 sorts <strong>of</strong> indirect taxes, many <strong>of</strong> which are insignificant in terms <strong>of</strong> revenue and<br />
possibly inefficient in terms <strong>of</strong> administrative costs. Some <strong>of</strong> these positions may actually be<br />
fees in the sense that they represent the compensation paid by individuals for certain<br />
government services. It is, however, not clear, whether this compensation is appropriate in<br />
terms <strong>of</strong> the value <strong>of</strong> the delivered service. It may contain a significant tax load if the fee<br />
charged is higher than the value <strong>of</strong> the service delivered. This, in particular, seems likely for<br />
the „fees“ raised on foreign trade, namely the statistics fees (62.13) and the foreign trade fees<br />
(62.14), which, e. g. include a license fee for most imports at an ad valorem cost <strong>of</strong> about 2<br />
percent <strong>of</strong> the import value. Since such fees have equivalent effects to customs tariffs, the<br />
Syrian budget accounting practice <strong>of</strong> listing them under indirect taxes seems justified 1 .<br />
Syria does not have a value added tax (VAT), rather, excises are raised on various selected<br />
products. Typically, these excises refer to goods for which the government controls the<br />
market. For instance, the government has a monopoly-like position for the production and/or<br />
marketing <strong>of</strong> cement, salt, sugar, tobacco, petroleum products, and electricity, mirrored by<br />
respective excises. (However, both private and public sector produce and import alcoholic<br />
beverages). Clearly, the overwhelming majority <strong>of</strong> products on Syrian markets is not subject<br />
to excises.<br />
Foreign oil companies have to pay substantial royalties for the exploitation <strong>of</strong> joint oil fields.<br />
<strong>The</strong>se royalties are not listed as taxes in the Syrian government budget, but are classified as<br />
„state property revenues“. At first sight, this is not unreasonable, since the royalties may be<br />
viewed as compensation for the usage <strong>of</strong> the production factor land. However, these<br />
obligations are linked to extraction, so that their economic effect is similar to a production tax.<br />
<strong>The</strong> other important source <strong>of</strong> revenue not <strong>of</strong>ficially listed under indirect taxes, but having<br />
equivalent effects, are price surcharges. <strong>The</strong>se are hidden under the heading <strong>of</strong> „different<br />
revenues“ (82.07). Such price surcharges are valid for selected consumption goods, petroleum<br />
products, and construction materials. <strong>The</strong>y are not classified as taxes since they originate from<br />
the conversion <strong>of</strong> commoditiy values at different exchange rates under the multiple exchange<br />
rate system 2 . As such, these revenues tend to decrease as the Syrian government proceeds<br />
with a stepwise unification <strong>of</strong> applicable exchange rates. For instance, prior to the last major<br />
1 It should be noted that the Syrian authorities distinguish between fees listed under budget position 6 (Taxes and<br />
Duties) and fees listed under budget position 71 (Service Commutations). This distinction might indicate the true<br />
economic character <strong>of</strong> the respective fees.<br />
2 For details <strong>of</strong> the multiple exchange rate system, see the description below.<br />
69<br />
15
exchange rate reform, which became effective January 1, 1998, „different revenues“ <strong>of</strong><br />
position 82.07 were much higher: <strong>The</strong> 1996 budget plan shows 31.8 million LS.<br />
<strong>The</strong> government budget plan consolidates lower administrative units like municipalities.<br />
Nevertheless, it does not give a complete account <strong>of</strong> the indirect tax structure, since it<br />
excludes operations <strong>of</strong> the Price Stabilization Fund (PSF) 3 . <strong>The</strong> apparent reason for this<br />
design is the government’s intention to separate the volume <strong>of</strong> subsidies aimed at supporting a<br />
subsistence level for the population at large from other fiscal measures. For possibly the same<br />
reason, revenues and expenditures <strong>of</strong> the PSF are not publicly disclosed. Currently, the PSF<br />
obtains revenues from price surcharges (beyond those consolidated in the <strong>of</strong>ficial government<br />
budget) <strong>of</strong> approximately 6 billion LS. In addition, the PSF receives budgetary transfers from<br />
the central government <strong>of</strong> about 4.5 billion LS. <strong>The</strong>se resources, however, are by far<br />
insufficient to cover expenditures on food subsidies, whose volume amounts to approximately<br />
24 billion LS for wheat and wheat products, 5 billion LS for sugar and 1 billion LS for<br />
(imported) rice. <strong>The</strong>refore, the PSF operations result in a current deficit <strong>of</strong> 19.5 billion LS.<br />
Adding the indirect tax equivalent PSF revenues to total indirect tax collections shown in<br />
Table 13 and subtracting the food subsidies yields an indirect tax load (net <strong>of</strong> sbsidies) <strong>of</strong><br />
about 42.1 billion LS for 1999. This is fairly close to the figure <strong>of</strong> 40.6 billion LS obtained<br />
from the 1999 system <strong>of</strong> national accounts 4 .<br />
However, these calculations do still not account for the true amount <strong>of</strong> subsidies. Besides<br />
food, the prices <strong>of</strong> fuel oil, water and electricity are at artificially low levels. As these goods<br />
are overwhelmingly supplied by state-owned enterprises, their subsidies simply reduce the<br />
respective operating surplus 5 . Due to the monopolistic market structure for utilities and fuel<br />
oil, such subsidies are not visible (and technically not counted) as negative indirect taxes. It is<br />
therefore extremely difficult to estimate the volume <strong>of</strong> these hidden subsidies. Using data for<br />
1996, the study <strong>of</strong> Corm, 1997b, suggests that these subsidies amount to about 55 million LS.<br />
If these figures were true, an adequate accounting <strong>of</strong> net indirect taxes in the Syrian Arab<br />
Republic would result in a negative value (i. e. a net subsidy) <strong>of</strong> about 15 million LS.<br />
Taxes on foreign trade are at the center <strong>of</strong> this research project. Foreign trade regulations are<br />
extremely complicated and badly documented, see below. <strong>The</strong> Syrian customs tariff follows<br />
the 1950 Brussel’s Customs Cooperation Council’s nomenclature (CCCN), an update to the<br />
Harmonized System (HS) is intended but not yet implemented. Currently, 2,622 items are<br />
listed under this classification, many <strong>of</strong> which result from a disaggregation <strong>of</strong> CCCN<br />
positions according to either specific properties or usage, see Ministry <strong>of</strong> Finance, 1989. Most<br />
<strong>of</strong> the customs rates, henceforth referred to as „basic rates“, are ad valorem and range between<br />
0 and 200 percent. In addition to the basic rates, a surcharge is levied, called the „unified tax<br />
on imports“, cf. Syrian Arab Republic, 1980. <strong>The</strong> load <strong>of</strong> the surcharge is directly related to<br />
the basic rates, as shown in Table 14. <strong>The</strong> sum <strong>of</strong> the basic rate and the unified tax rate is<br />
referred to as „combined rate“.<br />
3 <strong>The</strong> relative autonomy <strong>of</strong> this fund is also emphasized by the fact that the PSF operates under the control <strong>of</strong> the<br />
Ministry <strong>of</strong> Supply and Internal <strong>Trade</strong> rather than under the auspices <strong>of</strong> the Ministry <strong>of</strong> Finance.<br />
4 Observe that budget data are planned revenues, whereas the national accounts data give the actual figures. In<br />
addition, PSF receipts and outlays are estimated from information that refers to 1998.<br />
5 Estimating the rates <strong>of</strong> return to capital (net <strong>of</strong> depreciation, but gross <strong>of</strong> income taxes) for a sectoral breakup <strong>of</strong><br />
the Syrian economy yields merely 4 percent for utilities, while the average value for the total manufacturing<br />
sector is 6.9 percent. This may be taken as evidence for artificially low prices in utilities. Public mining<br />
activities, however, are highly pr<strong>of</strong>itable despite the implicit subsidy for domestic fuel; the net rate <strong>of</strong> return is<br />
estimated at 160 percent.<br />
70<br />
16
Table 14<br />
Customs Rates, 1999<br />
Basic Rate Unified Tax Rate<br />
(Surcharge)<br />
Combined Rate<br />
0% 6% 6%<br />
1% 6% 7%<br />
7% 13% 20%<br />
15% 14% 29%<br />
30% 17% 47%<br />
50% 21% 71%<br />
75% 27% 102%<br />
100% 32% 132%<br />
150% 33% 183%<br />
200% 33% 233%<br />
In addition to the customs rate as given by the combined rate, importers must obtain an import<br />
license from the Ministry <strong>of</strong> Economy and Foreign <strong>Trade</strong>. <strong>The</strong>re is an associated fee for the<br />
import license which is degressively structured with the cif-value <strong>of</strong> imports 6 . Also, imports<br />
are subject to statistics fees <strong>of</strong> approximately 4 percent ad valorem 7 . Various exemptions<br />
apply to both the license fee and the statistics fee and in some cases these exemptions also<br />
carry over to (minor) reductions <strong>of</strong> the unified import tax.<br />
<strong>The</strong> above account <strong>of</strong> foreign trade taxes suggest that Syria imposes very high effective tariff<br />
rates. This perception is, in fact, widespread (see e. g. MEDA-Team, 2000, p. 13, US<br />
Department <strong>of</strong> State, 1996), but it is nevertheless incorrect. <strong>The</strong> reason is that many tariff<br />
rates apply to artificially low import values, which result from a conversion <strong>of</strong> world market<br />
prices at overvalued exchange rates. Specifically, most imports <strong>of</strong> basic goods are evaluated at<br />
the customs exchange rate <strong>of</strong> 11.25 LS/$, while the free market exchange rate in Beirut is<br />
rather stable at about 51 LS/$. Effectively, the usage <strong>of</strong> such an overvalued exchange rate<br />
reduces the tariff rates to slightly more than one-fifth <strong>of</strong> their nominal level.<br />
<strong>The</strong> Syrian customs authorities apply three different exchange rates in order to convert cif<br />
import values into Syrian pounds: Imports subject to a basic rate <strong>of</strong> not more than 15 percent<br />
are converted at 11.25 LS/$, imports with higher basic rate than 15 percent are converted at<br />
23 LS/$. An exception from this rule are goods whose import has been liberalized since the<br />
early 1990s, these goods are currently converted at an exchange rate <strong>of</strong> 46.5 LS/$. In addition<br />
to the tariff depreciation achieved by applying various overvalued exchange rates, Investment<br />
Law No. 10 <strong>of</strong> 1991 allows for the duty-free import <strong>of</strong> machinery, capital equipment and<br />
other essential materials for projects benefiting from the provisions <strong>of</strong> this law. Moreover,<br />
such imports are exempted from all other taxes and duties both on the state and the municipal<br />
level.<br />
6 About 20 percent <strong>of</strong> imported goods (552 items <strong>of</strong> the tariff nomenclature) are exempted from the license fee.<br />
7 <strong>The</strong> value refers to the world market price converted into Syrian pounds at the applicable customs exchange<br />
rate. This is <strong>of</strong>ten less than one-fourth <strong>of</strong> the true value.<br />
71<br />
17
Unfortunately, the Syrian authorities were unable to provide a list <strong>of</strong> those imported goods<br />
whose value is converted at the rate <strong>of</strong> 46.5 LS/$ - and we have not been able to obtain<br />
accurate information on that topic from anywhere else. IMF estimates for 1995 suggest that<br />
less than 2 percent <strong>of</strong> the total import value has been converted at this exchange rate. For<br />
1999, however, this share will be higher, since more imports have been liberalized. However,<br />
even the IMF does not know about the correct value today.<br />
Despite these informational shortcomings, note that for the purpose <strong>of</strong> this study we merely<br />
need a weighted average <strong>of</strong> the effective tariff rates for each SITC one-digit product group.<br />
To calculate these weighted rates we proceed as follows. For each one-digit SITC group we<br />
identify the most important imported commodities disaggregated to the five-digit level. We<br />
use as many five-digit groups as are necessary to capture at least 90 percent <strong>of</strong> the total import<br />
volume for the respective one-digit level. Next, we identify the applicable tariff rates for each<br />
five-digit product from the <strong>of</strong>ficial tariff schedule (Ministry <strong>of</strong> Finance, 1989). In many cases,<br />
the tariff rate is not unique on the five-digit SITC-level. In these cases we consider both the<br />
minimum and the maximum tariff rates applicable for products from this group.<br />
In both cases we add the applicable surcharge rate to obtain the combined rate. for the<br />
minimum rates, we then convert the import value at the applicable exchange rate, either 11.25<br />
LS/$ or 23 LS/$. For the maximum rates, we convert at 46.5 LS/$ in order to obtain an upper<br />
bound for the tariffs levied by the Syrian Customs Department. We then compute minimum<br />
and maximum tariff revenues accordingly. Dividing these revenues through the import<br />
volume evaluated at the free market exchange rate <strong>of</strong> 51 LS/$ then gives minimum and<br />
maximum tariff revenues for each product in the five-digit SITC classification.<br />
Clearly, the sum <strong>of</strong> all minimum tariff revenues is smaller and the sum <strong>of</strong> all maximum tariff<br />
revenues larger then total actual tariff revenues <strong>of</strong> the Syrian government, which must be a<br />
weighted average <strong>of</strong> these ficticious revenues. We determine the appropriate weight and apply<br />
this to the minimum and maximum tariff revenues <strong>of</strong> each one-digit SITC product group to<br />
determine what we will call the average effective tariff rates. Note that these average effective<br />
rates apply to import values converted at the Beirut free market rate.<br />
Tables 15 through .... give the corresponding results. As can be seen from Table 15, most<br />
minimum effective rates are very low, with the exception <strong>of</strong> bananas and c<strong>of</strong>fee. Even the<br />
maximum rates are <strong>of</strong>ten at reasonable levels and, while significantly higher, usually not<br />
excessive.<br />
72<br />
18
Table 15<br />
Minimum and Maximum Effective Tariff Rates<br />
for Most Important Products from SITC0<br />
73<br />
19<br />
SITC<br />
code<br />
Imports at<br />
51 LS/$<br />
in million<br />
Minimum<br />
effective<br />
rate<br />
Maximum<br />
effective<br />
rate<br />
CANE/BEET SUGAR/CHEM PURE<br />
SUCROSE, SOLID FORM, NES<br />
6129 7731 6.40% 26.44%<br />
MAIZE (NOT INCLUDING SWEET CORN)<br />
UNMILLED, NO SEED<br />
4490 3813 1.54% 6.38%<br />
BARLEY, UNMILLED 4300 3051 1.54% 6.38%<br />
RICE HUSKED NOT FURTHER PREP<br />
(CARGO OR BROWN RICE)<br />
4220 2557 4.41% 18.24%<br />
FISH, PREPARED OR PRESERVED, N.E.S. 3716 2539 1.54% 6.38%<br />
TEA 7410 2303 4.41% 18.24%<br />
MILK, SOLID FORM, FAT CNTNT, BY WGT,<br />
NOT OVER 1.5%<br />
2221 2190 4.41% 18.24%<br />
OIL-CAKE & OTHER SOLID RESIDUE (NOT<br />
DREGS)<br />
8130 2076 1.54% 6.38%<br />
COFFEE, NOT ROASTED 7110 1434 21.20% 42.85%<br />
BANANAS (INCLUDING PLANTAINS),<br />
FRESH OR DRIED<br />
5730 1230 21.20% 42.85%<br />
SHEEP, LIVE 121 1053 1.54% 6.38%<br />
MATE 7431 731 4.41% 42.85%<br />
PISTACHIOS FRESH OR DRIED, WHETHER<br />
SHELLED/PEELED<br />
5778 623 6.40% 26.44%<br />
BUTTER AND OTHER FATS AND OILS<br />
DERIVED FROM MILK<br />
2300 602 4.41% 26.44%<br />
FOOD PREPARATIONS, N.E.S. 9899 518 6.40% 26.44%<br />
Total 32450 5.23% 18.63%
Table 16<br />
Minimum and Maximum Effective Tariff Rates<br />
for Most Important Products from SITC1<br />
74<br />
20<br />
SITC<br />
code<br />
Imports at<br />
51 LS/$<br />
in million<br />
Minimum<br />
effective<br />
rate<br />
Maximum<br />
effective<br />
rate<br />
CIGARETTES CONTAINING TOBACCO 12220 420 21.20% 42.85%<br />
SPIRITS OBTAINED BY DISTILLING GRAPE<br />
WINE OR MARC<br />
11242 63 21.20% 166.85%<br />
Total 483 21.20% 59.08%<br />
Quite a different picture emerges from Table 16. Beverages and tobacco carry rather high<br />
tariff rates, which can become prohibitive in the case <strong>of</strong> alcoholic beverages. Not surprisingly,<br />
these imports are rather low in value.<br />
Table 17<br />
Minimum and Maximum Effective Tariff Rates<br />
for Most Important Products from SITC2<br />
SITC<br />
code<br />
Imports at<br />
51 LS/$<br />
in million<br />
Minimum<br />
effective<br />
rate<br />
Maximum<br />
effective<br />
rate<br />
CONIF WOOD SAWN/CHIPPED<br />
LENGTHWISE SLICE/PEEL OV 6MM<br />
24820 3348 1.54% 18.24%<br />
SEEDS OF FORAGE PLANTS, OTHER THAN<br />
BEET SEED<br />
29252 769 1.54% 6.38%<br />
ALUMINUM WASTE AND SCRAP 28823 763 1.54% 6.38%<br />
SOYBEANS 22220 678 1.54% 6.38%<br />
SESAME (SESAMUM) SEEDS 22250 662 1.54% 6.38%<br />
PULPS OF FIBR CELLULOS MAT, EXC<br />
SEMICHEM WOOD PULP<br />
25192 426 1.54% 6.38%<br />
SYNTHETIC STAPLE FIBERS, PROCESSED 26670 269 1.54% 6.38%<br />
SULPHUR OF ALL KINDS (OTHER THAN<br />
SUBLIMED, PRECIPITATED OR<br />
COLLOIDAL SULPHUR)<br />
27410 259 1.54% 6.38%<br />
SYNTHETIC FILAMENT TOW 26660 240 1.54% 6.38%<br />
SYNTHETIC STAPLE FIBERS, NOT<br />
PROCESSED<br />
26650 191 1.54% 6.38%<br />
SUNFLOWER SEEDS 22240 137 4.41% 18.24%<br />
ART STAPLE FIBERS, PROCESSED FOR<br />
SPINNING<br />
26713 131 1.54% 6.38%<br />
WOOD IN ROUGH OR ROUGHLY SQRD<br />
TREATED WITH PAINT, STAIN ETC<br />
24730 118 4.41% 18.24%<br />
KAOLIN & OTHER KAOLINIC CLAYS,<br />
CALCINED OR NOT<br />
27826 95 6.40% 26.44%<br />
Total 8087 1.69% 11.90%
Non-mineral raw materials have almost negligible minimum tariff rates. Even if the most<br />
unfavorable rates are applied the average rate for SITC2 is merely 12 percent. Clearly, most<br />
raw materials enjoy much cheaper customs rate. For SITC3 (fuels) and SITC4 (agricultural<br />
raw materials) the picture is qualitatively similar although the rates are somewhat higher, cf.<br />
Table 18 and Table 19. For chemicals (SITC5) minimum rates are again very low, on average<br />
below 2 percent. Maximum rates average at 17 percent, which is certainly not prohibitive.<br />
Table 18<br />
Minimum and Maximum Effective Tariff Rates<br />
for Most Important Products from SITC3<br />
75<br />
21<br />
SITC<br />
code<br />
Imports at<br />
51 LS/$<br />
in million<br />
Minimum<br />
effective<br />
rate<br />
Maximum<br />
effective<br />
rate<br />
GASEOUS HYDROCARBONS 34400 2691 4.41% 26.44%<br />
GAS OILS 33430 1659 4.41% 18.24%<br />
MEDIUM OILS FROM PETROL & BITUM<br />
MINERALS NES ETC<br />
33429 535 6.40% 26.44%<br />
LUBRICATING PETROLEUM OILS AND<br />
OILS OBTAINED FROM BITUMINOUS<br />
MINERALS; OTHER HEAVY PETROLEUM<br />
OILS OR OILS OBTAINED FROM<br />
BITUMINOUS MINERALS<br />
33450 486 4.41% 18.24%<br />
5371 4.61% 23.16%<br />
Table 19<br />
Minimum and Maximum Effective Tariff Rates<br />
for Most Important Products from SITC4<br />
SITC<br />
code<br />
Imports at<br />
51 LS/$<br />
in million<br />
Minimum<br />
effective<br />
rate<br />
Maximum<br />
effective<br />
rate<br />
LARD; PIG FAT NES AND POULTRY FAT,<br />
RENDERED<br />
41120 2100 4.41% 26.44%<br />
COTTONSEED OIL, CRUDE 42121 1281 4.41% 18.24%<br />
SOYBEAN OIL 42110 1255 4.41% 18.24%<br />
FATTY ACIDS, ACID OILS FROM ANIMAL<br />
OR VEG FATS ETC<br />
43131 552 1.54% 18.24%<br />
Total 5187 4.11% 21.56%
Table 20<br />
Minimum and Maximum Effective Tariff Rates<br />
for Most Important Products from SITC5<br />
76<br />
22<br />
SITC<br />
code<br />
Imports at<br />
51 LS/$<br />
in million<br />
Minimum<br />
effective<br />
rate<br />
Maximum<br />
effective<br />
rate<br />
POLYETHYLENE 57110 2144 1.54% 6.38%<br />
CHEM ELEMENTS & COMPDS DOPED TO<br />
USE IN ELECTRONICS<br />
59850 2106 1.54% 26.44%<br />
HERBICIDES, ANTISPROUTING ETC<br />
PRODUCTS, RETAIL ETC<br />
59130 1487 1.54% 18.24%<br />
POLYPROPYLENE, IN PRIMARY FORMS 57511 1310 1.54% 6.38%<br />
PLATES, SHEETS, FILM ETC OF PLASTICS<br />
NES<br />
58290 1240 1.54% 42.85%<br />
POLYACETALS, OTHER POLYETHERS<br />
AND EPOXIDE RESINS, IN PRIMARY<br />
FORMS; POLYCARBONATES, ALKYD<br />
RESINS, POLYALLYL ESTERS AND OTHER<br />
POLYESTERS, IN PRIMARY FORMS<br />
57400 1147 1.54% 42.85%<br />
AMIDES 51470 1047 1.54% 6.38%<br />
PHOSPHINATES AND PHOSPHONATES<br />
AND SIMILARS<br />
52360 827 1.54% 6.38%<br />
POLYVINYL CHLORIDE 57310 671 1.54% 18.24%<br />
ANTIBIOTICS; NOT PUT UP AS<br />
MEDICAMENTS OF HEADING 542<br />
54130 653 1.54% 6.38%<br />
SYNTH ORGANIC FLUORESCENT<br />
BRIGHTENING AGENTS<br />
53121 539 1.54% 6.38%<br />
NITROGEN-FUNCTION COMPOUNDS N.E.S. 51489 487 1.54% 6.38%<br />
LACTAMS; HETEROCYCLIC COMPOUNDS<br />
WITH OXYGEN HETERO_ATOMS ONLY<br />
51560 461 1.54% 6.38%<br />
POLYSTYRENE IN PRIMARY FORMS 57210 457 1.54% 6.38%<br />
MINERAL OR CHEMICAL FERTILIZERS 56220 441 1.54% 6.38%<br />
MIXTURES, ODORIFEROUS FOR FOOD OR<br />
DRINK INDUSTRIES<br />
55141 430 1.54% 18.24%<br />
ORGANIC SURF-ACT AGENTS NES FOR<br />
RETAIL SALE OR NOT<br />
55421 389 1.54% 42.85%<br />
TITANIUM DIOXIDE PIGMENTS AND<br />
PREPARATIONS<br />
53311 379 1.54% 6.38%<br />
FERTILIZERS, N.E.S. 56299 332 1.54% 6.38%<br />
BORATES; PEROXOBORATES<br />
(PERBORATES)<br />
52384 327 1.54% 6.38%<br />
SODIUM HYDROXIDE (CAUSTIC SODA),<br />
SOLID<br />
52262 322 1.54% 6.38%<br />
PIGMENT, OPACIFIER & COLOR PREP FOR<br />
CERAMICS ETC<br />
53351 290 1.54% 26.44%<br />
CELLULOSE & ITS CHEMICAL<br />
DERIVATIVES NES, PR FORMS<br />
57559 274 1.54% 42.85%<br />
ADDITIVES FOR LIQUIDS SUBSTITUTING<br />
FOR MIN OIL<br />
59720 272 1.54% 26.44%<br />
MEDICAMENTS 54290 262 1.54% 6.38%<br />
POLYVINYL CHLORIDE 57300 238 1.54% 18.24%
Table 20 cont‘d<br />
Minimum and Maximum Effective Tariff Rates<br />
for Most Important Products from SITC5<br />
77<br />
23<br />
SITC<br />
code<br />
Imports at<br />
51 LS/$<br />
in million<br />
Minimum<br />
effective<br />
rate<br />
Maximum<br />
effective<br />
rate<br />
UNSATURATED ACYCLIC<br />
MONOCARBOXYLIC ACIDS NES ETC<br />
51379 222 1.54% 6.38%<br />
DEPILATORIES, PERFUMERY, COSMETIC<br />
ETC PREPS<br />
55350 222 21.20% 64.74%<br />
ORGANO-SULFUR COMPOUNDS 51540 211 1.54% 6.38%<br />
PROVITAMIN AND VITAMINS 54110 204 1.54% 6.38%<br />
MINERAL OR CHEMICAL FERTILIZERS,<br />
NITROGENOUS<br />
56210 200 1.54% 6.38%<br />
ANTISERA & OTHER BLOOD FRACTIONS;<br />
VACCINES<br />
54163 195 1.54% 6.38%<br />
PAINTS & VARNISHES, WATER PIGMENTS<br />
FOR LEATHER<br />
53340 189 1.54% 26.44%<br />
POLYCARBOXYLIC ACIDS; ANHYDRIDES,<br />
HALIDES ETC<br />
51380 183 1.54% 6.38%<br />
MINERAL OR CHEMICAL FERTILIZERS,<br />
POTASSIC N.E.S.<br />
56230 176 1.54% 6.38%<br />
AMINO-ALCOHOLS, ETHERS ETC; SALTS<br />
THEREOF<br />
51460 172 1.54% 6.38%<br />
NEUTRAL SODIUM CARBONATE<br />
(DISODIUM CARBONATE)<br />
52372 151 1.54% 6.38%<br />
FLUORINATED ETC DERIVATIVES OF<br />
ACYCLIC HYDROCARBNS<br />
51137 128 1.54% 6.38%<br />
ALGINIC ACID, ITS SALTS AND ESTERS,<br />
PRIMARY FORMS<br />
57594 122 1.54% 42.85%<br />
LACTIC, TARTARIC, CITRIC ACIDS &<br />
SALTS & ESTERS<br />
51391 121 1.54% 6.38%<br />
PRINTING INK 53320 118 4.41% 18.24%<br />
HYDROGEN CHLORIDE;<br />
CHLOROSULFURIC ACID<br />
52231 115 1.54% 6.38%<br />
MONOHYDRIC ALCOHOLS, N.E.S. 51219 112 1.54% 26.44%<br />
PREPARED GLUES & ADHESIVES NES;<br />
RETAIL PKGES ETC<br />
59229 111 6.40% 42.85%<br />
ACYCLIC HYDROCARBONS, N.E.S. 51119 106 1.54% 26.44%<br />
SYNTH ORGANIC COLORING MATTER<br />
NES AND PREPARATIONS<br />
53119 98 1.54% 6.38%<br />
SODIUM SULFATES 52345 95 1.54% 6.38%<br />
SOAP & SURF-ACT PREPS IN BARS ETC<br />
FOR TOILET USE<br />
55411 94 21.20% 42.85%<br />
COLORING MATTER AND COLORING<br />
PREPARATIONS NES<br />
53317 93 1.54% 6.38%<br />
NATURAL POLYMERS & MODIFIED<br />
NATURAL POLYMERS, NES<br />
57595 85 1.54% 42.85%<br />
Total 22058 1.87% 17.07%
For SITC6 (manufactures chiefly classified by material) tariff rates are very heterogenous,<br />
ranging between minimum rates <strong>of</strong> 1.5 percent for many material inputs up to maximum<br />
effective (!) rates <strong>of</strong> 120 percent for domestic cooking appliances. But the average maximum<br />
rate is still below 25 percent and the average minimum rate is a mere 5 percent for this<br />
product group.<br />
Table 21<br />
Minimum and Maximum Effective Tariff Rates<br />
for Most Important Products from SITC6<br />
78<br />
24<br />
SITC<br />
code<br />
Imports at<br />
51 LS/$<br />
in million<br />
Minimum<br />
effective<br />
rate<br />
Maximum<br />
effective<br />
rate<br />
SYNTHETIC FILAMENT YARN, NOT PUT<br />
UP FOR RETAIL SALE<br />
65150 6663 1.54% 6.38%<br />
BARS AND RODS, OF IRON OR NON-<br />
ALLOY STEEL<br />
67600 5896 4.41% 18.24%<br />
IRON & NA STEEL FL-RL NC, NES 67350 5535 1.54% 26.44%<br />
SYNTH FILAMENT YARN (NO SEW THR)<br />
TEX NES NO RETAIL<br />
65159 4332 1.54% 6.38%<br />
ALLOY STEEL (EXCEPT STAINLESS) WIRE 67829 3519 4.41% 18.24%<br />
OTHER TUBES AND PIPES 67930 2863 1.54% 26.44%<br />
WOVEN FABRICS, SYNTHETIC<br />
FILAMENTS<br />
65310 2498 21.20% 42.85%<br />
IRON & NA STEEL FL-RL, ZINC 67410 1966 1.54% 26.44%<br />
PAPER & PAPERBD, WRITING 64130 1433 6.40% 26.44%<br />
NEW PNEUMATIC RUBBER TIRES FOR<br />
AIRCRAFT<br />
62530 1326 6.40% 26.44%<br />
STRUCTURES OF IRON OR STEEL 69110 1301 21.20% 64.74%<br />
TEXT FAB IMPREG, COATED ETC WITH<br />
PLASTIC (NO T CD)<br />
65732 1135 21.20% 42.85%<br />
NEW PNEUMATIC RUBBER TIRES FOR<br />
BUSES AND TRUCKS<br />
62520 1007 4.41% 18.24%<br />
METAL TANKS ETC OVER 300 LITERS OF<br />
IRON OR STEEL<br />
69211 960 1.54% 42.85%<br />
PAPER & PRBD NES, UN 40G/M2 SPEC<br />
PROC, UNC, ROL SH<br />
64125 826 1.54% 26.44%<br />
WIRE OF IRON OR NON-ALLOY STEEL 67810 782 1.54% 42.85%<br />
COPPER BARS, RODS AND PROFILES 68230 741 1.54% 26.44%<br />
WOV FABRIC, SYN ST FIB, UNDER 85% 65340 671 21.20% 42.85%<br />
IRON AND NON-ALLOY STEEL IN INGOTS<br />
OR OTHER PRIMARY FORMS,SEMI-<br />
FINISHED PRODUCTS OF IRON OR NON-<br />
ALLOY STEEL<br />
67200 663 1.54% 18.24%<br />
ALUMINOUS CEMENT 66123 621 6.40% 26.44%<br />
STAINLESS STEEL WIRE 67821 609 4.41% 18.24%<br />
IRON & NA STEEL FL-RL, PT VARN PLA<br />
COAT<br />
67430 575 1.54% 26.44%<br />
TOILET PAPER, CUT TO SIZE, IN ROLLS OR<br />
SHEETS<br />
64243 544 6.40% 26.44%<br />
IRON & NA STEEL FL-RL, OTHER METALS 67440 497 4.41% 18.24%
Table 21 cont‘d<br />
Minimum and Maximum Effective Tariff Rates<br />
for Most Important Products from SITC6<br />
79<br />
25<br />
SITC<br />
code<br />
Imports at<br />
51 LS/$<br />
in million<br />
Minimum<br />
effective<br />
rate<br />
Maximum<br />
effective<br />
rate<br />
METAL TANKS ETC NOT OV 300 LITERS,<br />
ALUMINUM<br />
69242 482 4.41% 26.44%<br />
KNITTED OR CROCHETED FABRICS, N.E.S. 65529 424 6.40% 64.74%<br />
KRAFT SACK PAPER, UNCOATED, IN<br />
ROLLS OR SHEETS<br />
64142 411 1.54% 6.38%<br />
TUBES AND PIPES OF HOLLOW PROFILES,<br />
SEAMLESS OF IRON OR STEEL<br />
67910 402 4.41% 18.24%<br />
NONWOVENS, WHETHER OR NOT<br />
IMPREGNATED, ETC. N.E.S.<br />
65720 345 6.40% 42.85%<br />
TUBE OR PIPE FITTINGS 67950 332 6.40% 26.44%<br />
MOUNT, FIT ETC NES, HAT RACKS ETC,<br />
DR CLOS BA METL<br />
69919 308 6.40% 26.44%<br />
ARTIFICIAL FILAMENT YARN (NO SEW<br />
THREAD), FOR RETAIL SALE<br />
65171 304 1.54% 6.38%<br />
KRAFT PAPER, UNCOATED N.E.S. ROLLS<br />
OR SHEETS<br />
64141 297 4.41% 18.24%<br />
WALLPAPER BASE, UNCOATED, IN ROLLS<br />
OR SHEETS<br />
64124 290 6.40% 26.44%<br />
SAW BLADES 69550 282 1.54% 26.44%<br />
ALUMINUM & ALUMINUM ALLOY PLATE,<br />
ETC OV .2MM THICK<br />
68423 276 1.54% 26.44%<br />
GLASS PACKING CONTAINERS,<br />
STOPPERS, LIDS ETC<br />
66511 264 1.54% 26.44%<br />
PADLOCKS & LOCKS, CLASPS W LOCKS,<br />
& KEYS BASE METL<br />
69911 246 1.54% 26.44%<br />
GUMMED OR ADHESIVE PAPER, IN STRIPS<br />
OR ROLLS<br />
64244 244 1.54% 26.44%<br />
CLASPS, HOOKS, BUCKLES, BEADS ETC<br />
OF BASE METAL<br />
69933 244 4.41% 18.24%<br />
ARTICLES OF IRON OR STEEL, FORGED<br />
OR STAMPED, NES<br />
69965 235 4.41% 18.24%<br />
GLASS SHEETS (FLOAT, SURF GROUND<br />
ETC GLASS)<br />
66440 221 6.40% 93.00%<br />
PLYWOOD NES, VENEERED PANELS &<br />
SIM LAMIN WOOD NES<br />
63449 214 6.40% 26.44%<br />
DOMEST COOK APPLIANCES,<br />
NONELECTRIC, IRON OR STEEL<br />
69731 203 21.20% 120.35%<br />
BASE METAL WIRE, RODS ETC FLUX<br />
COAT FOR SOLDER ETC<br />
69955 202 4.41% 18.24%<br />
WOVEN FABRICS OF ARTIFICIAL<br />
FILAMENT YARN<br />
65350 183 21.20% 42.85%<br />
FILTER PAPER AND PAPERBOARD 64245 179 6.40% 26.44%<br />
FLAT-ROLLED PRODUCTS OF IRON OR<br />
NON- ALLOY STEEL, NOT CLAD, PLATED<br />
OR COATED<br />
67320 173 4.41% 18.24%
ALUMINUM & ALUMINUM ALLOY PLATE,<br />
ETC OV .2MM THICK<br />
HOUSEHOLD ARTICLES & PARTS NES, OF<br />
IRON OR STEEL<br />
CONVEYOR OR TRANSMISSION BELTS OR<br />
BELTING, OF VULCANISED RUBBER<br />
NARROW WOVEN FABRICS NES WITH<br />
NUN 5% ELAST YN ETC<br />
REFRACTORY BRICKS ETC (NOT<br />
SILICEOUS) CON MATERIAL<br />
Table 21 cont‘d<br />
Minimum and Maximum Effective Tariff Rates<br />
for Most Important Products from SITC6<br />
80<br />
26<br />
SITC<br />
code<br />
Imports at<br />
51 LS/$<br />
in million<br />
Minimum<br />
effective<br />
rate<br />
Maximum<br />
effective<br />
rate<br />
68421 171 1.54% 26.44%<br />
69741 163 6.40% 42.85%<br />
62920 161 4.41% 18.24%<br />
65612 159 6.40% 42.85%<br />
66232 158 1.54% 6.38%<br />
54534 5.01% 23.89%<br />
For capital goods, SITC7, the general picture seems to be that most machinery carries low<br />
tariff rates, while spare parts are taxed somewhat more heavily and rather high rates are levied<br />
on motor vehicles if these are primarily for the use <strong>of</strong> private households. (For the latter, see<br />
for instance the difference between motor vehicles for the transport <strong>of</strong> goods in line 1 <strong>of</strong> Table<br />
22 ande motor vehicles for the transport <strong>of</strong> persons, line five <strong>of</strong> Table 22. For the latter,<br />
effective tariff rates can come close to 200 percent, while for the former they may be as low<br />
as 6.4 percent. <strong>The</strong> average effective rates (a minimum effective rate <strong>of</strong> 11 percent and a<br />
maximum effective rate <strong>of</strong> 44 percent) may hence be somewhat misleading, since it seems<br />
that they overstate the tariff load <strong>of</strong> goods imported for industrial purposes (and understate the<br />
rates <strong>of</strong> durable consumption goods, particularly cars). Moreover, exemptions for capital good<br />
imports according to Investment Law No. 10 apply.
Table 22<br />
Minimum and Maximum Effective Tariff Rates<br />
for Most Important Products from SITC7<br />
81<br />
27<br />
SITC<br />
code<br />
Imports at<br />
51 LS/$<br />
in million<br />
Minimum<br />
effective<br />
rate<br />
Maximum<br />
effective<br />
rate<br />
MOTOR VEHICLES FOR THE TRANSPORT<br />
OF GDS, N.E.S.<br />
78210 9337 6.40% 26.44%<br />
MACHRY USED IN THE GRAIN MILLING<br />
IND (NOT FARM TP), PARTS FOR GRAIN<br />
MILLING & CEREAL WORKING<br />
MACHINERY<br />
72710 2962 1.54% 6.38%<br />
VEHICLES SPEC DESGND FOR TRAV ON<br />
SNOW, ETC 8<br />
78110 1759 82.53% 197.85%<br />
MACHRY HAVNG INDIVIDUAL<br />
FUNCTIONS, N.E.S.<br />
72849 1567 1.54% 26.44%<br />
MOTOR VEHICLES FOR THE TRANSPORT<br />
OF PERSONS, NES<br />
78120 1144 59.53% 197.85%<br />
AIR OR VACUUM PUMPS 74310 1059 4.41% 26.44%<br />
TAPS, COCKS, VALVES AND SIM<br />
APPLIANCES, PARTS THEREOF<br />
74700 991 6.40% 64.74%<br />
RAILWAY OR TRAMWAY GDS VANS &<br />
WAGONS, NT SELF-PROP<br />
79182 982 6.40% 26.44%<br />
RECIPROCATNG PIST ENGS, CYL CAP,<br />
COMPRESSION-IGNITN ENGS (DIESEL OR<br />
SEMI-DIESEL)<br />
71320 843 1.54% 42.85%<br />
ELECTRIC TRANSFORMERS 77110 765 1.54% 42.85%<br />
PULLEY TACKLE & HOISTS, WINCHES,<br />
CAPSTANS<br />
74420 754 4.41% 18.24%<br />
BRAKES & SERVO-BRAKES & PTS FOR<br />
MOTOR VEHICLES ETC<br />
78433 703 21.20% 42.85%<br />
ROAD TRACTORS FOR SEMI-TRAILERS 78320 702 6.40% 26.44%<br />
PUMPS FOR LIQUIDS, N.E.S. LIQUID<br />
ELEVATORS<br />
74270 648 1.54% 42.85%<br />
PTS OF AIRPLANES OR HELICOPTERS, PTS<br />
OF SPACECRAF & ASSOC EQUIP, LAUNCH<br />
VEH<br />
79290 643 1.54% 6.38%<br />
PARTS OF PUMPS FOR LIQUIDS, PARTS OF<br />
LIQUID ELEVATORS<br />
74290 600 1.54% 42.85%<br />
ELECTRIC MOTORS EXCEEDING 37.5 W,<br />
AC, ELECTRIC GENERATORS, AC<br />
71630 556 1.54% 26.44%<br />
AIR CONDITIONING MACHINES NES 74155 554 1.54% 120.35%<br />
AUTOMIC CIRCT BRAKS FR A VOLTAGE<br />
NOT EXCDNG 1000 V<br />
77252 533 6.40% 26.44%<br />
DATA PROCESSING EQUIPMENT 75200 530 6.40% 26.44%<br />
BUMPERS AND PARTS THEREOF FOR<br />
MOTOR VEHICLES ETC.<br />
78431 473 21.20% 42.85%<br />
CENTRIFUGES 74350 470 1.54% 26.44%<br />
8 I would very much welcome any suggestion why Syria has a large import volume for vehicles designed for the<br />
travel on snow. However, this is what the statistics show.
Table 22 cont‘d<br />
Minimum and Maximum Effective Tariff Rates<br />
for Most Important Products from SITC7<br />
82<br />
28<br />
SITC<br />
code<br />
Imports at<br />
51 LS/$<br />
in million<br />
Minimum<br />
effective<br />
rate<br />
Maximum<br />
effective<br />
rate<br />
ELECTRCL APP FOR SWITCH OR PROTECT<br />
NES NT EX 1000<br />
77259 465 6.40% 26.44%<br />
EL MOTORS EXCEEDING 37.5 W &<br />
GENERATORS, DC<br />
71620 465 1.54% 18.24%<br />
PARTS, N.E.S. SUITBL FOR USE WT SPK-IG<br />
INT COM ENG OR COMPRSS-IGNIT ENGS<br />
71390 458 1.54% 42.85%<br />
ELECTRIC, LASER OR OTHER LIGHT OR<br />
PHOTON BEAM, ULTRASONIC, ELECTRON<br />
BEAM, MAGNETIC PULSE OR PLASMA<br />
ARC SOLDERING, BRAZING OR WELDING<br />
MACHINES AND APPARATUS, WHETHER<br />
OR NOT CAPABLE OF CUTTING ELECTRIC<br />
MACHINES AND APPAR<br />
73730 379 1.54% 42.85%<br />
SWITCHES FOR ELECT APPARATUS NES,<br />
NT EXC 1000 VOLT<br />
77255 358 6.40% 26.44%<br />
CHASSIS FITTD WTH ENGS FOR MOTOR<br />
VEHICLES, ETC<br />
78410 351 21.20% 64.74%<br />
PTS & ACCESS OF TRACTOR, MTR VEH,<br />
SPEC PURPSE, NES<br />
78439 325 21.20% 42.85%<br />
LIFTNG, HANDLNG, LOADNG OR<br />
UNLOADNG MACHRY<br />
74480 305 4.41% 18.24%<br />
AUXILIARY PLANT FOR USE WTH<br />
BOILERS, CONDENSERS FOR STEAM OR<br />
OTH VAPOR POWER UNITS<br />
71120 284 1.54% 6.38%<br />
ELECTRIC MOTORS OF AN OUTPUT NT<br />
EXCEEDNG 37.5 W<br />
71610 283 6.40% 26.44%<br />
INSULATED ELECTRIC WINDING WIRE,<br />
COAXIAL CABLE AND OTHER ELECT<br />
COAXIAL CONDUCTORS, IGNITION<br />
WIRNG STS, ETC, KND USED IN VEHICLS,<br />
ELEC CONDUCTORS, OPTICAL FIBER<br />
CABLES<br />
77310 275 6.40% 26.44%<br />
RADIOBROADCAST RECEIVERS 76220 271 21.20% 42.85%<br />
PARTS OF REFRIGERATORS, FREEZERS,<br />
EQUIPMT, ETC<br />
74149 270 1.54% 120.35%<br />
OTHER PRINTING MACHINERY 72660 266 1.54% 6.38%<br />
DRY-CLEANING MACHINES FOR<br />
TEXTILES<br />
72472 262 1.54% 93.00%<br />
SHIPS’ OR BOATS’ PROPELLERS AND<br />
BLADES THEREFOR<br />
74991 257 6.40% 26.44%<br />
DISCHARGE LAMPS (OTH THAN<br />
ULTRAVIOLET LAMPS)<br />
77822 254 21.20% 42.85%<br />
PHOTOCOPYING APP 75130 246 21.20% 42.85%<br />
INSULATNG FITTNGS FOR ELEC MACHS,<br />
CERAMICS<br />
77326 246 6.40% 26.44%
Table 22 cont‘d<br />
Minimum and Maximum Effective Tariff Rates<br />
for Most Important Products from SITC7<br />
83<br />
29<br />
SITC<br />
code<br />
Imports at<br />
51 LS/$<br />
in million<br />
Minimum<br />
effective<br />
rate<br />
Maximum<br />
effective<br />
rate<br />
PARTS OF ELECTRICAL APPARATUS ETC.<br />
FOR LINE TELEPHONIE<br />
76491 246 1.54% 26.44%<br />
SPECIAL PURPOSE MOTOR VEHICLES 78220 245 6.40% 26.44%<br />
WEAVING MACHINES (LOOMS) 72451 240 1.54% 6.38%<br />
DRYERS FOR AGRICULTURAL PRODUCTS 74184 232 1.54% 6.38%<br />
TEXTILE MACHINES 72440 227 1.54% 6.38%<br />
MACHRY FOR SORTNG, SCREENING,<br />
WASHNG,ETC ORES, ETC, FOR CRUSHNG,<br />
GRINDNG EARTH, STONE, ETC, FOR<br />
MIXNG OR KNEADNG EARTH, STONE,<br />
FOR AGGLOMERATNG, SHAPNG OR<br />
MOLDNG, PARTS OF MINERAL WASH,<br />
GRIND, SHAPING ETC MACHINRY<br />
72830 217 1.54% 6.38%<br />
TEXTILE MACH FOR WASHING, DYENG,<br />
PRESSNG ETC<br />
72474 196 1.54% 93.00%<br />
FURNACES AND OVENS FOR THE<br />
ROASTNG, ETC, OF METALS<br />
74136 193 1.54% 26.44%<br />
FILAMENT LAMPS (OTH THN FLSHBULBS,<br />
INFRARED, ETC.)<br />
77821 186 21.20% 42.85%<br />
INDUCTION OR DIELECTRIC FURNACES<br />
AND OVENS<br />
74132 186 1.54% 26.44%<br />
ELECTRICAL IGNITION OR STARTNG<br />
EQUIPMT<br />
77831 184 6.40% 42.85%<br />
GEARS AND GEARING; BALL SCREWS;<br />
GEAR BOXES, ETC<br />
74840 180 1.54% 42.85%<br />
MOLDS FOR RUBBER OR PLASTICS 74910 179 6.40% 26.44%<br />
ELECTRICAL PTS OF MACHRY OR<br />
APPARATUS, N.E.S.<br />
77889 178 6.40% 26.44%<br />
PACKING OR WRAPPING MACHINERY<br />
NES<br />
74527 155 1.54% 93.00%<br />
GASKETS & SIMILAR JOINTS OF METL<br />
SHEETING<br />
74920 155 6.40% 64.74%<br />
KNITTING AND STITCH-BONDING<br />
MACHINES<br />
72452 154 1.54% 6.38%<br />
AUXILIARY TEXTILE MACHINERY MFR<br />
FIBER, YN & FABRIC, PARTS & ACCESS<br />
72460 150 1.54% 6.38%<br />
ELECTRIC SOUND AMPLIFIER SETS 76420 148 6.40% 42.85%<br />
MACHRY, N.E.S. FOR THE INDUSTL PREP<br />
OF FOOD/DRINK<br />
72722 144 1.54% 6.38%<br />
MACHRY PTS, NT CONTAINING ELEC<br />
CONNECTORS, ETC NES<br />
74999 144 6.40% 26.44%<br />
SPARK-IGNITN RECIP OR ROTRY INT COM<br />
PIST ENGINE NE, COMPRESSION-IGNITIN<br />
INTRN COM PIST ENGINES, NES<br />
71380 130 1.54% 42.85%<br />
Total 38662 10.56% 43.55%
Finally, commodities classified under SITC8 (miscellaneous manufactures) are also<br />
characterized by a wide variety <strong>of</strong> applicable effective tariff rates – and the systematic<br />
reasonings behind this are not always apparent. On average, minimum rates are at a level <strong>of</strong> 6<br />
percent, while maximum rates are at 31 percent. Clearly, lower as well as much higher<br />
effective rates may also be observed under particular instances.<br />
INST & APPTS NES FOR MEAS/CHEKING<br />
FLOW, LEVEL ETC, PARTS & ACCESS FOR<br />
MEAS/CHEK VAR LIQ OR GAS NES<br />
FLOOR COVERINGS, PLASTIC, SELF-<br />
ADHESIVE OR NOT<br />
Table 23<br />
Minimum and Maximum Effective Tariff Rates<br />
for Most Important Products from SITC8<br />
84<br />
30<br />
SITC<br />
code<br />
Imports at<br />
51 LS/$<br />
in million<br />
Minimum<br />
effective<br />
rate<br />
Maximum<br />
effective<br />
rate<br />
87430 701 1.54% 18.24%<br />
89331 299 1.54% 42.85%<br />
Watches 88540 260 6.40% 26.44%<br />
RECORDED MEDIA NES, SOUND ETC 89879 244 1.54% 42.85%<br />
INST & APPTS, MEAS/CHECK ELEC<br />
QUANTITIES, PTS & ACCESS FOR INST &<br />
APPTS MEAS/CK ELECT ETC.<br />
87470 221 6.40% 26.44%<br />
PRESS-FASTENERS, SNAP-FASTENERS<br />
ETC, PTS; BUTTONS<br />
89983 173 6.40% 26.44%<br />
SLIDE FASTENERS 89985 161 21.20% 42.85%<br />
PHOTO PLATES & FILM, SENSITISED,<br />
UNEXPOSED<br />
88220 159 4.41% 26.44%<br />
THERMOSTATS, PRESSURE REGULATORS<br />
AND CONTROLLERS (MONOSTATS),<br />
REGULATING & CONTROLLING INST &<br />
APPTS NES, PTS & ACCESS FOR AUTO<br />
REGULATING/CONTR INST & APPT<br />
87460 132 1.54% 26.44%<br />
BROOMS, BRUSHES, FEATH DUSTERS,<br />
MOPS, PAINT PD ETC<br />
89972 128 6.40% 26.44%<br />
GAS, LIQ/ELECTRICITY METERS, PARTS &<br />
ACCESSORIES OF GAS, LIQ/ELECTRICITY<br />
METERS<br />
87310 110 6.40% 26.44%<br />
PHOTOGRAPH PAPER, PAPERBOARD &<br />
TEXTIL, SENS, UNEXP<br />
88240 103 6.40% 26.44%<br />
SPORTS GOODS, N.E.S. 89479 94 6.40% 26.44%<br />
BALL POINT PENS, FOUNTAIN PENS ETC. 89521 88 6.40% 26.44%<br />
PHOTO FILM, ROLLS, SENSITISED,<br />
UNEXPOSED EXC PAPER<br />
88230 85 6.40% 26.44%<br />
FRAMES & MOUNTING FOR SPECTACLES,<br />
GOGGLES, ETC.<br />
88421 54 6.40% 26.44%
DRAFTING TABLES & MACH,<br />
WHETHER/NOT AUTOMATIC, ETC, INST<br />
FOR MEASURING LENGTH, FOR USE IN<br />
HAND, NES, PART & ACCESS FOR<br />
DRAFTING & LENGTH MEAS INSTRMNTS,<br />
MEAS/CHECKING INST, APPLN & MACH<br />
NES; PROFILE PROJ, PARTS AND ACCESS<br />
FOR MEAS/CHECK INST NES & PROF PR<br />
WORKED IVORY, BONE, HORN, CORAL<br />
ETC<br />
SPECTACLES, GOGGLES ETC,<br />
CORRECTIVE, PROTECT ETC<br />
Table 23 cont‘d<br />
Minimum and Maximum Effective Tariff Rates<br />
for Most Important Products from SITC8<br />
85<br />
31<br />
SITC<br />
code<br />
Imports at<br />
51 LS/$<br />
in million<br />
Minimum<br />
effective<br />
rate<br />
Maximum<br />
effective<br />
rate<br />
87420 52 6.40% 26.44%<br />
89911 52 32.02% 64.74%<br />
88423 48 6.40% 26.44%<br />
FURNITURE, NES, OF WOOD 82150 36 6.40% 64.74%<br />
FURNITURE, NES 82170 32 32.02% 64.74%<br />
TABLEWARE, KITCHENWARE, OTH<br />
HSEHOLD ART OF PLASTIC<br />
89332 31 1.54% 64.74%<br />
WRITING OR DRAWING INK & OTH INK<br />
(EX PRINTING INK)<br />
89591 30 4.41% 18.24%<br />
INST, APPTS/MODELS, DESIGNED FOR<br />
DEMONSTRATIONS<br />
87452 29 4.41% 18.24%<br />
CLOCK MOVEMENTS, COMPLETE AND<br />
ASSEMBLED<br />
88596 28 6.40% 26.44%<br />
APPLIANCES, WORN, CARRIED OR<br />
IMPLANTED IN BODY<br />
89960 28 4.41% 18.24%<br />
PORTABLE ELEC LAMPS FUNCTION BY<br />
OWN ENERGY SOURCE<br />
81312 24 46.00% 93.00%<br />
TOYS, N.E.S. 89429 23 1.32% 5.47%<br />
CIGARETTE LIGHTERS & OTH LIGHTERS,<br />
MECH/ELEC OR NT<br />
89933 23 59.53% 120.35%<br />
CERAMIC SINKS, WASH BASINS ETC 81220 22 21.20% 42.85%<br />
OPT FIBER & OPT FIBER BUNDLES &<br />
CABLE UNMOUNT, NES<br />
88419 21 1.54% 26.44%<br />
FITTINGS FOR LOOSELEAF BINDERS, ETC,<br />
OF BASE METAL<br />
89512 21 6.40% 26.44%<br />
CLOCKS (CLOCK MVT) NES, BATTERY, OR<br />
AC POWERED<br />
88578 20 6.40% 26.44%<br />
SCENT SPRAYS & SIMILAR TOILET<br />
SPRAYS ETC<br />
89987 20 32.02% 64.74%<br />
MECHANO-THERAPY APPLNS, MASSAGE<br />
APPTS,OZONE/OXYGEN THERAPY/OTH<br />
THERAPEUTIC RESPIRAT APPT,<br />
BREATHING APPL & GAS MASKS NES<br />
87230 19 4.41% 18.24%<br />
Total 3571 6.39% 30.67%
Applying minimum effective tariff rates yields tariff revenue <strong>of</strong> 9.845 billion LS, applying<br />
maximum effective rates yields 44.381 billion LS. <strong>The</strong> actual tariff revenue for 1999<br />
(excluding taxes on the import and export <strong>of</strong> services) is 14.440 billion LS. From this we infer<br />
that a reasonable estimate for weighted average tariff rates can be obtained by averaging<br />
minimum and maximum effective rates with weights 0.87 and 0.13, respectively. We thus<br />
obtain the following average effective tariff rates for one-digit SITC groups, which are<br />
subsequently used in the numerical simulation exercises, cf. Table 24.<br />
Table 24<br />
Average Effective Tariff Rates for One-Digit SITC Groups<br />
SITC0 SITC1 SITC2 SITC3 SITC4 SITC5 SITC6 SITC7 SITC8<br />
7.01% 26.23% 3.05% 7.08% 6.43% 3.89% 7.52% 14.95% 9.62%<br />
<strong>The</strong> above analysis shows that formal tariff barriers are probably not a decisive impediment to<br />
international trade. However, various quantitative restrictions and other non-tariff barriers to<br />
trade exist 9 . Import regulations require that the import <strong>of</strong> certain goods (including medicines,<br />
automobiles, oil, wheat, and cotton) be reserved for the public sector; these goods are<br />
collected in a so-called „restricted list“. A second list, the „negative list“ specifies prohibited<br />
imports, intended either to protect domestic industries (i. e. in the case <strong>of</strong> finished clothing,<br />
shoes, and various electric appliances) or for security, health or religious reasons. Finally, a<br />
„permitted list“ defines goods that may legally be imported even by the private sector. This<br />
last list has gradually been expanded in recent years. It does not, however, refer to broad<br />
categories <strong>of</strong> goods, which is why the permitted list presently comprises more than 10,000<br />
narrowly defined items.<br />
Imports from the permitted list must be distinguished by the applicable method <strong>of</strong> financing.<br />
For goods on the „unrestricted payments list“, foreign traders can, in principle, use any<br />
privately owned foreign exchange resources, but must obtain appropriate registration,<br />
certification and licenses from various authorities. For goods on the „export proceeds payment<br />
list“ the importer has to prove that the required foreign exchange originates from export<br />
proceeds. Since these are short in supply, private exporters (who have to surrender parts <strong>of</strong><br />
their export proceeds to the government at the overvalued rate <strong>of</strong> 46.45 LS/$) are able to sell<br />
the retained part <strong>of</strong> their export proceeds to importers at a rate <strong>of</strong> currently about 56 LS/$.<br />
Finally, the import <strong>of</strong> a third group <strong>of</strong> commodities must be financed through worker’s<br />
remittances („workers remittances payment list“), for which certification <strong>of</strong> the Commercial<br />
Bank <strong>of</strong> Syria (CoBS) is required.<br />
It is important to note that these regulations <strong>of</strong> the multiple exchange rate system (MERS)<br />
have economic effects equivalent to a combination <strong>of</strong> import taxes and export subsidies. To<br />
begin with, private exporters <strong>of</strong> non-agricultural products have do surrender 25 percent <strong>of</strong><br />
their export proceeds to the Commercial Bank <strong>of</strong> Syria at the rate <strong>of</strong> 46.45 LS/$. Since the<br />
Beirut free market rate is approximately 51 LS/$ and since the CoBS is owned by the<br />
government, this surrender requirement has equivalent effects to a tax on exports.<br />
Nevertheless, exporters benefit on average from the multiple exchange rate system, since they<br />
are allowed to sell the retained part <strong>of</strong> their exports proceeds to importers <strong>of</strong> goods on the<br />
9 <strong>The</strong> following account borrows heavily from information provided by the International Monetary Fund.<br />
86<br />
32
export proceeds list. Since the exchange rate on this „exports proceeds market“ is around 56<br />
LS/$, the economic effects <strong>of</strong> the MERS on exporters <strong>of</strong> non-agricultural goods are<br />
approximately equal to a 10 percent tax on 25 percent <strong>of</strong> the export value in US dollars plus a<br />
10 percent subsidy on 75 percent <strong>of</strong> the export value in US dollars. <strong>The</strong> net effect is hence a<br />
five percent export subsidy. For exporters <strong>of</strong> agricultural products, who are exempted from<br />
the surrender requirement, the subsidy equivalent <strong>of</strong> the MERS is approximately 10 percent <strong>of</strong><br />
the true $-value.<br />
For importers <strong>of</strong> goods on the export proceeds list, the MERS is equivalent to an<br />
approximately ten percent ad valorem tax. This „tax“ however, does not show up in the<br />
government budget plan, rather, it immediately benefits the exporters, whose „subsidy“ is also<br />
invisible in the government budget. Note that the MERS import tax equivalent not only drives<br />
a wedge between private imports from the exports proceeds list and imports from the<br />
unrestricted payments list, it also drives a wedge between the former and public sector<br />
importers <strong>of</strong> similar goods. Since almost all public sector transactions take place at the rate <strong>of</strong><br />
46.5 LS/$, public sector importers <strong>of</strong> goods that compete with goods on the export proceeds<br />
list have a 20 percent price advantage from the MERS – a major impediment to private sector<br />
economic activity 10 .<br />
Other non-tariff barriers to trade exist. For instance, imports from countries other than the<br />
country <strong>of</strong> origin are prohibited, as are imports from Israel 11 . Compliance to these rules has to<br />
be certified by the Ministry <strong>of</strong> Economy and Foreign <strong>Trade</strong>. Required quality standards are<br />
<strong>of</strong>ten incompatible with, say, European standards. In general, foreign trade regulations are<br />
extremely complicated, compliance is cumbersome and takes lots <strong>of</strong> time. Changes in the<br />
regulations are very frequent and foreign traders complain that even the bureaucracy can<br />
hardly keep up with the necessary modifications. Information about the current state <strong>of</strong><br />
regulations is difficult to obtain: <strong>The</strong>re is no internet documentation and the last published<br />
paper version dates back to 1995. Neither Syrian diplomatic representations nor European<br />
institutions specialised on foreign trade information can supply potential traders with the<br />
relevant information. Corruption, while illegal, is endemic in the Customs Administration<br />
whose <strong>of</strong>ficials have the difficult task <strong>of</strong> determining the correct tariff load <strong>of</strong> imports in an<br />
environment <strong>of</strong> intransparent and frequently changing case-by-case regulations, cf. MEDA-<br />
Team, 2000.<br />
10 <strong>The</strong> share <strong>of</strong> imports from the export proceeds list is modest, but not insignificant: Estimates range around 20<br />
percent <strong>of</strong> total import value. <strong>The</strong> share <strong>of</strong> imports from the workers remittance list is much smaller, currently<br />
around 5 percent.<br />
11 Moreover, there is a blacklist <strong>of</strong> third country enterprises suspected to have commercial ties with Israel. In<br />
principle, even third country enterprises which cooperate with black listed companies would be denied business<br />
activities in Syria. However, it seems that Syria does not take its commitments under these advanced levels <strong>of</strong><br />
Arab league boycott <strong>of</strong> Israel very seriously (Royal Dutch Embassy, undated.)<br />
87<br />
33
Section IV: Nonmathematical description <strong>of</strong> the CGE Model 1<br />
<strong>The</strong> following model is used in the simulations: <strong>The</strong> Syrian economy is decomposed into<br />
eleven activities: Agriculture, mining, public manufacturing, private manufacturing, utilities,<br />
construction, wholesale and retail trade, transport and communication, finance and insurance,<br />
social and personal services 2 , government services. Real net value added at factor cost is<br />
produced under constant elasticity <strong>of</strong> substitution (CES) productions functions, where<br />
agriculture uses three inputs (land, labor, capital), while all other activities use only labor and<br />
capital.<br />
Assuming competitive factor markets, pr<strong>of</strong>it maximization implies the equality between<br />
nominal factor prices and marginal products. <strong>The</strong> specification allows for heterogenous rates<br />
<strong>of</strong> return to capital across sectors – which seems appropriate given the observed heterogeneity<br />
<strong>of</strong> gross rates <strong>of</strong> return (estimates range between 2 percent for construction to 166 percent for<br />
mining). <strong>The</strong> existence <strong>of</strong> such large differences is, <strong>of</strong> course, due to tight government control<br />
and associated monopolisitic structures in some sectors <strong>of</strong> the Syrian economy. Note that the<br />
constant returns property <strong>of</strong> the production function implies zero economic pr<strong>of</strong>its for all<br />
activities.<br />
We distinguish nine commodity categories associated with the one-digit SITC classification,<br />
construction, and services. Due to limitations in the structure <strong>of</strong> the input-output matrix it was<br />
not possible to treat SITC 0 (food and live animals) and SITC 4 (animal and vegetable fats,<br />
oils and waxes) as different goods, so that the first commodity group is the aggregate <strong>of</strong> SITC<br />
0 and SITC 4. <strong>The</strong> other groups are SITC 1 (beverages and tobacco), SITC 2 (raw materials),<br />
SITC 3(mineral fuels), SITC 5 (chemicals), SITC 6 (manufactures classified chiefly by<br />
material), SITC 7 (machines and transport equipment), and SITC 8 (miscellaneous<br />
manufactures), respectively. Finally, the last group collects SITC 9 (commodities not<br />
elsewhere specified), construction, and services (trade, transport, finance, social and personal<br />
services, and government services).<br />
For each product category, a composite commodity, the so-called Armington good, is<br />
produced using the inputs domestic supply and imports <strong>of</strong> the respective product group in a<br />
CES-production function. <strong>The</strong> cost minimizing combination describes trade creation as a<br />
function <strong>of</strong> the relative price between domestic and imported goods. To model trade<br />
diversion, we assume that for a given import volume <strong>of</strong> the commodity group Syria<br />
minimizes the costs <strong>of</strong> imports over trading partners under a CES technology, where trading<br />
partners are given by the following countries or trading blocks:<br />
Arabic states (Arab)<br />
(Algeria, Bahrein, Egypt, Iraq, <strong>Jordan</strong>, Kuwait, Lebanon, Libya, Morocco, Mouritania, Saudi<br />
Arabia, Somalia, Sudan, Tunisia, United Arab Emirates, Yemen),<br />
European Union (EU 15)<br />
(Austria, Belgium, Denmark, Finland, France, Germany, Greece, Ireland, Italy, Luxemburg,<br />
Netherlands, Portugal, Spain, Sweden, United Kingdom),<br />
Formerly socialist countries (Ex-Soc.)<br />
1<br />
Some information given in this section is repeated in section V. This has the advantage that the reader may skip<br />
either section without loss <strong>of</strong> information.<br />
2<br />
Including private non-pr<strong>of</strong>it services.<br />
88<br />
34
(Bulgaria, Byelorussia, China, Cuba, Czech Republic, Hungary, Poland, Rumania, Russia,<br />
Serbia, Ukraine),<br />
United States <strong>of</strong> America (USA) ,<br />
Argentina, Brasil, Chile (ABC),<br />
Turkey,<br />
Japan,<br />
and the rest <strong>of</strong> the world (ROW).<br />
Intermediate demand for a commodity produced in a certain sector is assumed to depend<br />
linearly on gross output <strong>of</strong> this sector. Similarly, depreciation per sector depends linearly on<br />
its capital stock. Exports, as ahother component <strong>of</strong> aggregate demand, are modeled<br />
completely analogous to imports, i. e. for a given level <strong>of</strong> real gross output per sector<br />
producers maximize its value subject to a constant elasticity <strong>of</strong> transformation (CET) choice<br />
between sales on the domestic market and exports. Further, for a given aggregate export<br />
volume, export revenue is maximized over sales to trading partners under a CETtransformation<br />
function, where we assume that world market prices are equal for all countries.<br />
Nominal household income consists <strong>of</strong> disposable factor incomes plus exogenous transfers<br />
from the government and abroad. Nominal household savings are assumed to be a constant<br />
fraction <strong>of</strong> household income, while (real) household consumption is derived from<br />
maximizing the utility function <strong>of</strong> a Stone-Geary linear expenditure system (LES) subject to a<br />
budget constraint. Development expenditures (government investment) and total government<br />
consumption are assumed to be constant fractions <strong>of</strong> government revenues. Demand functions<br />
for government consumption are specified as CES functions fulfilling budget identity and<br />
homogeneity <strong>of</strong> degree zero.<br />
<strong>The</strong> capital market is modeled as an institution with revenues (supply) and expenditures<br />
(demand). Capital market revenues are defined as depreciation plus private and government<br />
savings plus debt service plus foreign loans. Capital market expenditures are given by CESinvestment<br />
demand (both public and private), deficits <strong>of</strong> the government (excluding PSF)<br />
financed by domestic or by foreign loans, PSF-deficit, and exogenous taxes on wealth. Capital<br />
market equilibrium requires that the current account be equal to the gap between revenues and<br />
expenditures. Assuming that total investment is a constant fraction <strong>of</strong> capital market revenues<br />
makes it possible to treat the current account deficit CA as an endogenous variable. An<br />
overview <strong>of</strong> the commodity market is given in Figure 1.<br />
89<br />
35
90<br />
Figure 1: <strong>The</strong> Commodity Markets<br />
Land Labor Capital<br />
Domestic output<br />
Inputs<br />
CET<br />
Exports<br />
Domestic use<br />
Composite goods<br />
(Armington)<br />
36<br />
CES<br />
Imports<br />
Trading partners<br />
Private consumption<br />
Investment<br />
Government<br />
consumption
91<br />
Figure 2: Government finance<br />
savings<br />
Capital market<br />
Households<br />
Factors<br />
(Land, labor, capital)<br />
Activities<br />
direct taxes<br />
transfers<br />
Current account<br />
debt service, development. expenditure<br />
government deficit<br />
indirect taxes<br />
subsidies<br />
surcharges<br />
37<br />
Government<br />
transfer<br />
PSF<br />
duties<br />
subsidy<br />
subsidy<br />
Importers<br />
Exporters<br />
46 LS/$<br />
MERS<br />
56 LS/$<br />
56 LS/$
<strong>The</strong> specification <strong>of</strong> government finances is standard except for the role <strong>of</strong> PSF and MERS.<br />
<strong>The</strong> PSF budget receives indirect tax proceeds and budgetary transfers from the government,<br />
it pays subsidies on domestic production and rice imports. <strong>The</strong> remaining deficit is financed<br />
from the capital market.<br />
<strong>The</strong> multiple exchange rate system obtains revenues from the surrender requirement for 25<br />
percent <strong>of</strong> private non-agricultural exports, and a customs tariff equivalent caused by forcing<br />
importers <strong>of</strong> goods on the „export proceeds payments list“ to purchase foreign exchange at an<br />
exchange rate higher than the Beirut free market rate. This customs tariff equivalent is equal<br />
to the MERS effective export subsidy due to the sale <strong>of</strong> retained export proceeds. In order to<br />
achieve budget balance, the share <strong>of</strong> imports with mandatory payments in export proceeds is<br />
required to adjust according to excess demand or excess supply on the export proceeds<br />
market 3 . For exogenously given free market Beirut and export proceeds market exchange<br />
rates and exogenously given shares <strong>of</strong> retained exports the MERS subsidy rate is also<br />
exogenous, while the MERS customs tariff equivalent rate is endogenous so that changes in<br />
the „payment in export proceeds list“ not only affect the export proceeds market balance but<br />
also the effective domestic price <strong>of</strong> imports. An overview <strong>of</strong> government finance is given in<br />
Figure 2. For a detailed specification <strong>of</strong> the model, consult the next section.<br />
3 This adjustment is either to be interpreted as governmental control <strong>of</strong> the export proceeds market exchange rate<br />
or as the result <strong>of</strong> substitution on the side <strong>of</strong> private importers.<br />
92<br />
38
Section V: <strong>The</strong> Model 1<br />
<strong>The</strong> following model is used in the simulations: <strong>The</strong> Syrian economy is decomposed into<br />
eleven activities: Agriculture, mining, public manufacturing, private manufacturing, utilities,<br />
construction, wholesale and retail trade, transport and communication, finance and insurance,<br />
social and personal services 2 , government services. Real net value added at factor cost Qi, i=1,...,11, is produced under constant elasticity <strong>of</strong> substitution (CES) productions functions,<br />
where agriculture uses three inputs (land B 1,<br />
labor L1, capital K 1),<br />
while all other activities<br />
use only labor Li and capital K i . (Note that, unless otherwise specified, variables are in capital<br />
letters, with bars denoting exogenous variables. Parameters are denoted in lowercase letters).<br />
93<br />
39<br />
( 1 )<br />
− 1 − 1 − 1<br />
Q1 = a ⎡ 1⎣α1K1 + β1B1 + −α1−β1 L ⎤ 1 ⎦<br />
1<br />
−<br />
1<br />
ρ ρ ρ ρ<br />
1<br />
−ρi −ρ<br />
−<br />
i ( 1<br />
i<br />
i = ⎡ ρ<br />
i αi i + −αi)<br />
⎤ i<br />
Q a ⎣ K L ⎦<br />
, i=2,...11<br />
Assuming competitive factor markets, pr<strong>of</strong>it maximization implies the equality between<br />
nominal factor prices and marginal products. Hence factor demands for agriculture are<br />
implicitly given by<br />
1<br />
B B Q<br />
−ρ1 −ρ 1<br />
1 −ρ − −<br />
1 ρ1<br />
1<br />
( )<br />
1<br />
1 1 1 1 α1 1 β1 1 1 α ρ − −<br />
= ⎡ + + − 1−β ⎤ 1 1 β1<br />
1<br />
r P P a ⎣ K B L ⎦ B<br />
1<br />
Q<br />
−ρ1 −ρ1 −ρ − −1<br />
1 1 1<br />
( ) 1<br />
1 1 1 1 1 1 1 ρ<br />
−ρ −<br />
⎡α β α1 β ⎤ 1 1 ( 1 α1 β1)<br />
1<br />
w= P a ⎣ K + B + − − L ⎦ − − L<br />
1<br />
K Q<br />
−ρ1 −ρ 1<br />
1 −ρ − −<br />
1 ρ1<br />
1<br />
( )<br />
1<br />
1 1 1 1α1 1 β1 1 1 α ρ − −<br />
= ⎡ + + − 1−β ⎤ 1 1 α1<br />
1<br />
rP P a ⎣ K B L ⎦ K ,<br />
B<br />
where r1, r 1 , and w denote the gross rates <strong>of</strong> return to capital, the rate <strong>of</strong> return to land and the<br />
nominal wage, respectively. In general, prices are denoted P with super- and subscripts<br />
denoting the goods to which they refer. Analogously, we have<br />
1<br />
1<br />
Q<br />
−ρi −ρ − −<br />
i i 1<br />
( 1 ρ<br />
−ρ −<br />
⎡ i<br />
i i αi i αi) ⎤ i ( 1 αi)<br />
i<br />
w= P a ⎣ K + − L ⎦ − L<br />
1<br />
1<br />
K Q<br />
−ρi −ρ − −<br />
i i 1<br />
( 1<br />
ρ −ρ −<br />
i<br />
i i = ⎡ i i αi i + −αi)<br />
⎤ i αi<br />
i<br />
rP P a ⎣ K L ⎦ K<br />
for the non-agricultural sectors. Note that this specification allows for heterogenous rates <strong>of</strong><br />
return to capital across sectors – which seems appropriate given the observed heterogeneity <strong>of</strong><br />
gross rates <strong>of</strong> return (estimates range between 2 percent for construction to 166 percent for<br />
1<br />
This section repeats information provided in section IV in order to enable the interested reader to read either<br />
section IV or section V without loss <strong>of</strong> information.<br />
2<br />
Including private non-pr<strong>of</strong>it services.<br />
(1)<br />
(2)<br />
(3)<br />
(4)<br />
(5)<br />
(6)
mining). <strong>The</strong> existence <strong>of</strong> such large differences is, <strong>of</strong> course, due to tight government control<br />
and associated monopolisitic structures in some sectors <strong>of</strong> the Syrian economy.<br />
Note that the constant returns property <strong>of</strong> the production function implies zero economic<br />
pr<strong>of</strong>its for all activities:<br />
PQ= rPK+ rPB+ wL<br />
Q K B B<br />
1 1 1 1 1 1 1 1 1<br />
PQ= rPK+ wL<br />
Q K<br />
i i i i i i<br />
From (3) to (6), the nominal incomes <strong>of</strong> the production factors are given by<br />
Y = r P B<br />
B B B<br />
1 1 1<br />
11<br />
L<br />
Y = ∑ wLi<br />
i=<br />
1<br />
11<br />
K<br />
= ∑<br />
i=<br />
1<br />
i<br />
K<br />
i i<br />
Y rP K<br />
<strong>The</strong> resource constraint for the production factor labor is simply<br />
where L is the total supply <strong>of</strong> labor.<br />
11<br />
∑<br />
i=<br />
1<br />
L = L,<br />
i<br />
I distinguish j=1,...,9 commodity categories associated with the one-digit SITC classification,<br />
construction, and services. Due to limitations in the structure <strong>of</strong> the input-output matrix it was<br />
not possible to treat SITC 0 (food and live animals) and SITC 4 (animal and vegetable fats,<br />
oils and waxes) as different goods, so that j=1 is the aggregate <strong>of</strong> SITC 0 and SITC 4. Hence<br />
j=2,...,8 are SITC 1 (beverages and tobacco), SITC 2 (raw materials), SITC 3(mineral fuels),<br />
SITC 5 (chemicals), SITC 6 (manufactures classified chiefly by material), SITC 7 (machines<br />
and transport equipment), and SITC 8 (miscellaneous manufactures), respectively. Finally,<br />
j=9 collects SITC 9 (commodities not elsewhere specified), construction, and services (trade,<br />
transport, finance, social and personal services, and government services).<br />
For each product category, a composite commodity Xj, j=1,...,9, the so-called Armington<br />
good, is produced using the inputs domestic supply D j and imports M j in a CES-production<br />
function:<br />
1<br />
M M −<br />
M<br />
M M −ρj M −ρj<br />
ρ j<br />
j = ⎡<br />
j α j j + −α<br />
⎤<br />
j j<br />
94<br />
40<br />
( 1 )<br />
X a D M<br />
⎣ ⎦<br />
<strong>The</strong> cost minimizing input relation is given by<br />
(7)<br />
(8)<br />
(9)<br />
(10)<br />
(11)<br />
(12)
and the zero pr<strong>of</strong>it condition is<br />
M ( 1−α<br />
j )<br />
D<br />
M ⎛<br />
j P ⎞<br />
j<br />
= ⎜ ⎟<br />
M M<br />
D ⎜ j Pj<br />
α ⎟<br />
⎝ j ⎠<br />
95<br />
41<br />
1<br />
M<br />
1+<br />
ρ j<br />
X D M<br />
j j j j j j<br />
,<br />
(13)<br />
P X = P D + P M . (14)<br />
Equation (13) describes trade creation as a function <strong>of</strong> the relative price between domestic and<br />
imported goods. To model trade diversion, assume that for a given import volume M j Syria<br />
minimizes the costs <strong>of</strong> imports over trading partners k=1,...8, under a CES technology<br />
8<br />
m<br />
m ⎡ m − ρ j ⎤<br />
M j = aj⎢∑ α jkM jk ⎥<br />
⎣k= 1 ⎦<br />
where trading partners k=1,...,8 are given by the following countries or trading blocks:<br />
Arabic states (Arab)<br />
(Algeria, Bahrein, Egypt, Iraq, <strong>Jordan</strong>, Kuwait, Lebanon, Libya, Morocco, Mouritania, Saudi<br />
Arabia, Somalia, Sudan, Tunisia, United Arab Emirates, Yemen),<br />
European Union (EU 15)<br />
(Austria, Belgium, Denmark, Finland, France, Germany, Greece, Ireland, Italy, Luxemburg,<br />
Netherlands, Portugal, Spain, Sweden, United Kingdom),<br />
Formerly socialist countries (Ex-Soc.)<br />
(Bulgaria, Byelorussia, China, Cuba, Czech Republic, Hungary, Poland, Rumania, Russia,<br />
Serbia, Ukraine),<br />
United States <strong>of</strong> America (USA) ,<br />
Argentina, Brasil, Chile (ABC),<br />
Turkey,<br />
Japan,<br />
and the rest <strong>of</strong> the world (ROW). Minimization requires<br />
and total costs <strong>of</strong> imports are given by<br />
m m<br />
M ⎛ jk α jk P ⎞ j1<br />
= ⎜ m m<br />
M ⎜<br />
⎟<br />
j1 α j1 P ⎟<br />
⎝ jk ⎠<br />
1<br />
m<br />
1+<br />
ρ j<br />
M<br />
j<br />
8<br />
j = ∑<br />
k = 1<br />
m<br />
jk jk<br />
P M P M<br />
1<br />
−<br />
m<br />
ρ j<br />
,<br />
(15)<br />
(16)<br />
(17)
Having defined the supply side <strong>of</strong> the domestic commodity market by Armington aggregates,<br />
intermediate demand for commodity j <strong>of</strong> sector i is assumed to depend linearly on gross<br />
output G i <strong>of</strong> sector i:<br />
Total (nominal) intermediate demand <strong>of</strong> sector i is therefore<br />
Vji = ajiG (18)<br />
i<br />
V<br />
i<br />
9<br />
i = ∑<br />
j=<br />
1<br />
X<br />
j ji<br />
PV PV<br />
Depreciation per sector depends linearly on the capital stock:<br />
Hence gross output at factor costs is given by<br />
i i i<br />
96<br />
42<br />
(19)<br />
O = δ K<br />
(20)<br />
PG= PQ+ PV+ PO,<br />
(21)<br />
G Q V K<br />
i i i i i i i i<br />
Equation (21) describes the value <strong>of</strong> the total supply <strong>of</strong> activity i at producers cost. To specify<br />
the demand side, let us start with exports, whose treatment is completely analogous to<br />
imports. Assume that for a given level <strong>of</strong> real gross output G i producers maximize its value<br />
PG= PD+ PE<br />
(22)<br />
G D E<br />
i i i i i i<br />
subject to a constant elasticity <strong>of</strong> transformation (CET) choice between sales on the domestic<br />
market and exports:<br />
It is then necessary to have<br />
i =<br />
E ⎡ E<br />
i αi E<br />
ρi i +<br />
E<br />
−αi<br />
1<br />
E<br />
ρ E<br />
i ⎤ρi<br />
i<br />
( 1 )<br />
G a D E<br />
⎣ ⎦<br />
E E<br />
E ⎛<br />
i Pi<br />
α ⎞<br />
i = ⎜ ⎟<br />
D E<br />
D ⎜ i Pi<br />
( 1−α<br />
i ) ⎟<br />
⎝ ⎠<br />
1<br />
E<br />
ρi<br />
−1<br />
Further, for a given aggregate export volume E i, export revenue<br />
E<br />
i<br />
8<br />
i = ∑<br />
k = 1<br />
e<br />
ik ik<br />
P E P E<br />
is maximized over sales to trading partners k=1,...8, under a CET-transformation function<br />
i =<br />
8<br />
e ⎡ e<br />
i ⎢∑ αik<br />
k = 1<br />
1<br />
e<br />
e ρ<br />
ρ ⎤ i<br />
i<br />
ik ⎥<br />
E a E<br />
⎣ ⎦<br />
(23)<br />
(23)<br />
(24)<br />
(25)
It is then necessary to have<br />
e e<br />
E ⎛ ik αi1<br />
P ⎞ ik = ⎜ e e ⎟<br />
Ei1 ⎝αik Pi1<br />
⎠<br />
In fact, since we assume that world market prices are equal for all countries, equations (24)<br />
and (26) simplify to<br />
and<br />
E<br />
E<br />
8<br />
E = ∑ E<br />
i ik<br />
k = 1<br />
⎛α⎞ = ⎜ ⎟<br />
⎝ ⎠<br />
ik<br />
e<br />
i1<br />
i1 e<br />
αik<br />
97<br />
43<br />
1<br />
e<br />
ρi<br />
−1<br />
1<br />
e<br />
ρi<br />
−1<br />
such that the export shares <strong>of</strong> individual trading blocks are invariant.<br />
Disposable land income is given by<br />
( 1 τ )<br />
B<br />
D<br />
B B<br />
.<br />
(26)<br />
(24‘)<br />
(26‘)<br />
Y = − Y , (27)<br />
where effective direct tax rates are denoted τ with appropriate superscript. Analogously,<br />
disposable labor income is given by<br />
where<br />
( 1 τ )( )<br />
Y = − Y + Y , (28)<br />
L L L F<br />
D L<br />
F<br />
Y L is labor income from foreign countries. Disposable capital income is defined as<br />
( 1 τ π π π )<br />
Y = − − − − Y , (29)<br />
K<br />
D<br />
K SS LS F K<br />
F<br />
SS<br />
where π is the net share <strong>of</strong> capital income flowing to foreign countries. To understand π<br />
LS<br />
and π , note that the Syrian government budget distinguishes between „supply surplus“ (SS)<br />
and „liquidity surplus“ (LS) <strong>of</strong> public entreprises. <strong>The</strong> liquidity surplus comprises temporary<br />
surplusses due to depreciation or provisions, whereas the the supply surplus is similar to after<br />
SS<br />
LS<br />
tax economic pr<strong>of</strong>its. Hence, π and π denote the share <strong>of</strong> these surplusses in total capital<br />
income.<br />
Nominal household income consists <strong>of</strong> disposable factor incomes plus exogenous transfers<br />
from the government and abroad:<br />
H B L K<br />
D D D<br />
G F<br />
Y = Y + Y + Y + TR + TR<br />
Nominal household savings are assumed to be a constant fraction <strong>of</strong> household income<br />
(30)
H H H<br />
S = s Y , (31)<br />
while (real) household consumption is derived from maximizing the utility function <strong>of</strong> a<br />
Stone-Geary linear expenditure system (LES)<br />
max<br />
subject to the budget constraint<br />
9<br />
H<br />
∏ ( C j −γ<br />
j)<br />
j=<br />
1<br />
j≠3<br />
9<br />
∑<br />
j=<br />
1<br />
j≠3<br />
α<br />
H j<br />
98<br />
44<br />
,<br />
9<br />
∑<br />
P C + S = Y −T<br />
j=<br />
1<br />
j≠3<br />
X H H H H<br />
j j<br />
H<br />
where the γj are minimum consumption levels and T is a catchall for other government<br />
taxes on hourseholds. Note that households do not consume raw materials (SITC 3), which is<br />
why j=3 is excluded in (32). Maximization yields the following demand functions:<br />
C<br />
H<br />
j<br />
α<br />
H<br />
j<br />
= 1<br />
⎧<br />
0 j = 3<br />
⎪<br />
⎪ ⎛ ⎞<br />
9<br />
⎪ H H H H X<br />
= α ⎜<br />
j ( 1 s ) Y T Pj’<br />
γ ⎟<br />
⎨ − − −<br />
j’<br />
⎜ ∑ ⎟<br />
⎪ ⎜ j ’1 = ⎟<br />
j ’3 ≠<br />
⎪ γ j +<br />
⎝ ⎠<br />
X<br />
⎪⎩<br />
Pj<br />
j ≠3<br />
<strong>The</strong> capital market is modeled as an institution with revenues (supply) and expenditures<br />
(demand). Capital market revenues are defined as<br />
D F<br />
where and<br />
11<br />
K<br />
= ∑<br />
i=<br />
1<br />
i +<br />
H<br />
+<br />
D<br />
+<br />
F<br />
+<br />
G<br />
+<br />
F<br />
R O S DS DS DE DEF<br />
DS DS denote domestic and foreign debt service, respectively, DEF are<br />
G<br />
foreign loans, and the endogenous variable DE denotes government outlays for investment<br />
purposes, labelled development expenditures in the government budget.<br />
Capital market expenditures are given by investment demand (both public and private),<br />
deficits <strong>of</strong> the government (excluding PSF) financed by domestic or by foreign loans<br />
D<br />
F<br />
PSF<br />
( DEF and DEF , respectively), PSF-deficit DEF , and exogenous taxes on wealth W<br />
T :<br />
9<br />
K<br />
= ∑<br />
j=<br />
1<br />
X<br />
j j +<br />
D<br />
+<br />
F<br />
+<br />
PSF<br />
+<br />
W<br />
E P I DEF DEF DEF T<br />
Capital market equilibrium requires that the current account (CA) is equal to the gap between<br />
revenues and expenditures:<br />
F<br />
(32)<br />
(33)<br />
(34)<br />
(35)<br />
(36)<br />
K K<br />
CA = R − E<br />
(37)
Assuming that total investment is a constant fraction <strong>of</strong> capital market revenues<br />
9<br />
∑<br />
j=<br />
1<br />
P I = s R<br />
X K K<br />
j j I<br />
makes it possible to treat the current account deficit CA as an endogenous variable. Using<br />
CES demand functions, gross investment is given by<br />
⎧ 0 j ≤ 4<br />
⎪<br />
I K K<br />
⎪ α jsI R<br />
I j = ⎨<br />
I<br />
1 9<br />
ρ<br />
⎪ X I I<br />
1<br />
I X<br />
1<br />
( P + ρ<br />
j ) α j’ ( P + ρ<br />
⎪ ∑ j’<br />
)<br />
⎩<br />
j ’5 =<br />
j > 4<br />
99<br />
45<br />
9<br />
I<br />
∑ ( j )<br />
I<br />
1 ρ<br />
α<br />
j 5<br />
+<br />
=<br />
where I j is zero for SITC 0 – SITC 4, since these do not include significant amounts <strong>of</strong> capital<br />
goods.<br />
<strong>The</strong> PSF budget constraint is modeled as<br />
= 1,<br />
11<br />
PSF Q<br />
PSF<br />
PSF<br />
ti Pi Qi + TR + DEF =<br />
11<br />
PSF Q<br />
si Pi Qi +<br />
9<br />
PSF m<br />
f j pj M j<br />
i= 1 i= 1 j=<br />
1<br />
∑ ∑ ∑ ,<br />
PSF PSF<br />
where t and s denote PSF-specific indirect tax and subsidy rates on domestic<br />
i i<br />
production and fj is a subsidy rate on imports.<br />
government budget.<br />
Revenues consolidated in the government budget are given by<br />
(38)<br />
(39)<br />
(40)<br />
PSF<br />
TR is the transfer the PSF receives from the<br />
( )<br />
11<br />
G<br />
= ∑ i<br />
Q<br />
i<br />
9 8<br />
i + ∑∑ jk<br />
m<br />
j<br />
B<br />
jk + τ<br />
B L<br />
+ τ<br />
L K SS LS<br />
+ τ + π + π<br />
K<br />
i= 1 j= 1 k=<br />
1<br />
12<br />
H W<br />
F<br />
D MERS e<br />
+ T + T + DEF + DEF + ∑ti<br />
pi Ei.<br />
i=<br />
1<br />
R t P Q c p M Y Y Y<br />
MERS<br />
Here ti is the effective indirect tax rate per sector earmarked for the government budget, ti is the effective indirect tax rate equivalent <strong>of</strong> the multiple exchange rate system and cjk is the<br />
effective customs rate for good j imported from country k.<br />
Government expenditure is given by<br />
G<br />
=<br />
11<br />
i<br />
e<br />
i i +<br />
9<br />
X<br />
j<br />
G<br />
j +<br />
G<br />
+<br />
D<br />
+<br />
F<br />
+<br />
G<br />
+<br />
PSF<br />
i= 1 j=<br />
1<br />
∑ ∑ ,<br />
E s p E P C TR DS DS DE TR<br />
G<br />
where si is the effective subsidy rate on exports and Cj is government consumption <strong>of</strong> good j.<br />
Development expenditures DE G and total government consumption are assumed to be<br />
constant fractions <strong>of</strong> government revenues, such that<br />
(41)<br />
(42)
9<br />
∑<br />
j=<br />
1<br />
DE = s R<br />
G G<br />
I<br />
G<br />
P C = s R<br />
X G G G<br />
j j C<br />
and demand functions for government consumption are specified as CES functions fulfilling<br />
budget identity and homogeneity <strong>of</strong> degree zero:<br />
⎧ 0 j = 3<br />
⎪<br />
G G G<br />
G ⎪ α j sCR C j = ⎨<br />
G<br />
1 9<br />
ρ<br />
⎪ X G G<br />
1<br />
G X<br />
1<br />
( P + ρ<br />
j ) α j’ ( P + ρ<br />
⎪ ∑ j’<br />
)<br />
⎩<br />
j ’5 =<br />
j ≠ 3<br />
<strong>The</strong> budget restriction is, <strong>of</strong> course, simply<br />
G G<br />
R = E .<br />
100<br />
46<br />
9<br />
G<br />
∑ ( α j )<br />
j=<br />
1<br />
j≠3<br />
G<br />
1+<br />
ρ<br />
<strong>The</strong> multiple exchange rate system is another institution with revenues given by<br />
While<br />
11<br />
MERS e<br />
ti pi Ei<br />
i=<br />
1<br />
MERS<br />
=<br />
11<br />
MERS<br />
i<br />
e<br />
i i +<br />
9<br />
MERS<br />
j<br />
m<br />
j j<br />
i= 1 j=<br />
1<br />
∑ ∑ .<br />
R t p E c p M<br />
∑ is the MERS export tax due to the surrender requirement for 25 percent<br />
<strong>of</strong> private non-agricultural exports,<br />
= 1<br />
(43)<br />
(44)<br />
(45)<br />
(46)<br />
9<br />
MERS m<br />
∑ cj pj M j is the MERS customs tariff equivalent<br />
j=<br />
1<br />
caused by forcing importers <strong>of</strong> goods on the „export proceeds payments list“ to purchase<br />
foreign exchange at an exchange rate higher than the Beirut free market rate. This customs<br />
tariff equivalent is hence equal to the MERS effective export subsidy due to the sale <strong>of</strong><br />
retained export proceeds. Total expenditures <strong>of</strong> the MERS are therefore given by<br />
and budget balance requires<br />
12<br />
∑ ( )<br />
E = t + s p E<br />
MERS MERS MERS e<br />
i i i i<br />
i=<br />
1<br />
(47)<br />
MERS MERS<br />
R = E . (48)<br />
In order to achieve budget balance, the share <strong>of</strong> imports with mandatory payments in export<br />
PEP<br />
proceeds λ j is required to adjust according to excess demand or excess supply on the<br />
export proceeds market 3 FM<br />
EPM<br />
. For exogenously given exchange rates e and e (free market<br />
Beirut and export proceeds market, respectively) and exogenously given shares <strong>of</strong> retained<br />
REP<br />
exports λ i the MERS subsidy rate is also exogenous and given by the export proceeds<br />
market exchange rate<br />
3 This adjustment is either to be interpreted as governmental control <strong>of</strong> the export proceeds<br />
market exchange rate or as the result <strong>of</strong> substitution on the side <strong>of</strong> private importers.
s<br />
EPM<br />
⎛e⎞ = λ ⎜ −1⎟.<br />
⎝ e ⎠<br />
MERS REP<br />
i i FM<br />
<strong>The</strong> MERS customs tariff equivalent rate, however, is endogenous and given by<br />
c<br />
EPM<br />
PEP ⎛e⎞ = λ ⎜ −1⎟,<br />
⎝ e ⎠<br />
j j FM<br />
so that changes in the „payment in export proceeds list“ not only affect the export proceeds<br />
market balance but also the effective domestic price <strong>of</strong> imports.<br />
Price identities complete the model: <strong>The</strong> domestic prices <strong>of</strong> exports are derived from world<br />
market prices e<br />
p i , adjusted for export taxes and subsidies. Similarly, domestic prices for<br />
imports are derived from world market prices<br />
m<br />
p j adjusted for customs tariffs (and<br />
equivalent) and import subsidies.<br />
( 1<br />
)<br />
P = + s + s − t p<br />
e MERS MERS e<br />
ik i i i i<br />
( 1<br />
)<br />
P = + c + c − f p<br />
m MERS PSF m<br />
jk jk j j j<br />
<strong>The</strong> trade (and services) balances <strong>of</strong> Syria vis-à-vis each trading partner are simply<br />
and the current account is given by<br />
8<br />
∑<br />
k = 1<br />
12<br />
k = ∑<br />
e<br />
i<br />
9<br />
ik −∑<br />
m<br />
j jk<br />
i= 1 j=<br />
1<br />
TB p E p M<br />
F K F<br />
k L<br />
101<br />
47<br />
F F<br />
CA = TB − π Y + Y + DEF + TR<br />
which basically states that current account is the sum <strong>of</strong> the trade (and services) balance plus<br />
the income balance plus the transfers balance. Given equation (1) – (53), this equation is<br />
redundant by Walras law.<br />
,<br />
(49)<br />
(50)<br />
(51)<br />
(52)<br />
(53)<br />
(54)
Section VI: Calibration<br />
Calibration <strong>of</strong> the relevant parameters is mostly achieved using the 1999 Social Accounting<br />
Matrix. This matrix uses national accounts, foreign trade and government budget data<br />
provided by various Syrian authorities (Central Bureau <strong>of</strong> Statistics, 1999, 2000) and the IMF<br />
(1999a, 1999b). Also, data on labor input and capital stocks, partially constructed from<br />
available net investment series, were used to calibrate rates <strong>of</strong> return to capital.<br />
A major limitation <strong>of</strong> the analysis is the fact that the Syrian government was unable to provide<br />
an input-output matrix for Syria 1 . Instead, usage <strong>of</strong> material inputs was approximated using<br />
proportions borrowed from <strong>Jordan</strong>’s 1987 input-output matrix, see Department <strong>of</strong> Statistics,<br />
1990, and Hosoe, 1998. However, appropriate adjustments were made to some sectors <strong>of</strong> the<br />
economy, in particular the oil producing sector, to make the implied input usage compatible<br />
with existent data on total intermediate consumption per sector from the Syrian national<br />
accounts.<br />
It is important to note that only the technical (Leontief) coefficients have been borrowed from<br />
the <strong>Jordan</strong>ian table. While it is undeniable that this still involves error, it seems nevertheless a<br />
reasonable measure in view <strong>of</strong> the scarcity <strong>of</strong> data, since the technical production conditions,<br />
i. e. the proportions <strong>of</strong> factor inputs, may be similar in both countries. In fact, since <strong>Jordan</strong>’s<br />
industry is certainly more advanced than Syria’s, the usage <strong>of</strong> an „old“ input-output matrix<br />
may actually be quite appropriate.<br />
<strong>The</strong> Social Accounting Matrix is the basis for most <strong>of</strong> the calibration exercises, as many<br />
parameters are simply chosen such that the model’s benchmark solution exactly replicates the<br />
SAM. Table 25 contains the basic information on the SAM.<br />
1 <strong>The</strong>y acknowledged the existence <strong>of</strong> an input-output matrix constructed in the 1980s, but, unfortunately, the<br />
staff in the Ministry <strong>of</strong> Planning did not find it any more.<br />
102<br />
48
Table 25<br />
Social Accounting Matrix for Syria, 1999<br />
1 2 3 4 5 6 7<br />
1 Agriculture<br />
2 Mining<br />
3 Public manufacturing<br />
4 Private manufacturing<br />
5 Utilities<br />
6 Construction<br />
7 <strong>Trade</strong><br />
8 Transp. & communic.<br />
9 Finance and insurance<br />
10 Social & pers. services<br />
11<br />
12<br />
Government services<br />
13 SITC0,4 58984 0 29558 34939 0 0 1990<br />
14 SITC1 0 0 36 43 0 0 230<br />
15 SITC2 309 973 7130 26662 0 14340 22<br />
16 SITC3 2111 610 13612 16089 15582 3258 447<br />
17 SITC5 4980 93 22901 27069 158 553 1646<br />
18 SITC6 1338 273 25780 30472 258 9758 2271<br />
19 SITC7 583 200 780 922 0 1691 3571<br />
20 SITC8 31 26 1043 1232 36 494 166<br />
21<br />
22<br />
SITC9, Constr., Serv. 33280 18641 31666 29130 6529 15362 14469<br />
23 Land income 76490 0 0 0 0 0 0<br />
24 Labor income 42643 2189 10982 15570 4307 5843 21525<br />
25<br />
26<br />
Capital income 72092 121613 7690 54252 6866 20357 74998<br />
27<br />
28<br />
Households<br />
29 Capital<br />
29a Interest on dom. debt<br />
29b Interest on ext. debt<br />
29c Develop. expenditures<br />
29d<br />
30<br />
Cons. <strong>of</strong> fixed capital 4475 4861 4930 7385 1149 366 2011<br />
31a PSF-Subsidies -6119 -22881<br />
31b<br />
32<br />
PSF own resources 1266 4734<br />
33 Government<br />
33a Ind. taxes (exc. tariffs, 6179 97 432 1616 475 867 40892<br />
MERS and PSF taxes)<br />
33b MERS tax<br />
33c Direct taxes<br />
33d Other revenues<br />
103<br />
49
33e Govern. entrepreneurial<br />
income, supply surplus<br />
33f Govern. entrepreneurial<br />
income, liquidity surpl.<br />
33g Foreign loans<br />
33h Local loans and taken<br />
from reserve<br />
33i Import duty revenue<br />
from ARAB<br />
33j Import duty revenue<br />
from EU 15<br />
33k Import duty revenue<br />
from formerly socialist<br />
countries<br />
33l Import duty revenue<br />
from USA<br />
33m Import duty revenue<br />
from ABC<br />
33n Import duty revenue<br />
from Turkey<br />
33o Import duty revenue<br />
from Japan<br />
33p Import duty revenue<br />
from ROW<br />
34<br />
35a MERS subsidy<br />
35b MERS tax<br />
36<br />
37 Foreign Sector<br />
37a ARAB<br />
37b EU 15<br />
37c Formerly Socialist<br />
37d USA<br />
37e ABC<br />
37f Turkey<br />
37g Japan<br />
37h ROW<br />
Table 25 cont’d<br />
Social Accounting Matrix for Syria, 1999<br />
1 2 3 4 5 6 7<br />
Totals 303496 149578 151686 227234 35360 72890 164239<br />
104<br />
50
Table 25 cont‘d<br />
Social Accounting Matrix for Syria, 1999<br />
8 9 10 11 12 13 14 15 16 17<br />
1 261484 0 0 0 0<br />
2 0 0 506 37144 0<br />
3 25317 5116 16479 26786 20010<br />
4 36248 7325 23593 38350 28648<br />
5 0 0 0 0 0<br />
6 0 0 0 212 0<br />
7 1087 0 0 0 0<br />
8 0 0 0 0 0<br />
9 0 0 0 0 0<br />
10 1 0 0 0 0<br />
11 2 0 0 0 0<br />
12<br />
13 3 0 266 412<br />
14 0 0 34 54<br />
15 12 595 7 26<br />
16 21003 7 634 984<br />
17 1109 56 2828 4391<br />
18 1572 51 1287 1999<br />
19 535 0 479 744<br />
20 1013 30 714 1109<br />
21 32143 1842 12927 20073<br />
22<br />
23 0 0 0 0<br />
24 21347 7052 4011 14179<br />
25 74380 24572 13974 49405<br />
26<br />
27<br />
28<br />
29<br />
29a<br />
29b<br />
29c<br />
29d 6780 723 637 1095<br />
30<br />
31a -1000<br />
31b<br />
32<br />
33<br />
33a -104 2748 240 180<br />
33b<br />
33c<br />
33d<br />
105<br />
51
Table 25 cont‘d<br />
Social Accounting Matrix for Syria, 1999<br />
8 9 10 11 12 13 14 15 16 17<br />
33e<br />
33f<br />
33g<br />
33h<br />
33i 164 8 27 34 183<br />
33j 654 51 38 151 497<br />
33k 211 0 79 36 79<br />
33l 149 66 18 0 35<br />
33m 278 0 14 0 8<br />
33n 188 0 2 19 27<br />
33o 0 7 1 0 10<br />
33p<br />
34<br />
531 4 31 34 143<br />
35a<br />
35b<br />
36<br />
37<br />
687 9 151 91 405<br />
37a 3920 37 1407 829 5446<br />
37b 12076 200 1594 2934 11827<br />
37c 3878 1 3336 705 1874<br />
37d 2732 256 756 1 823<br />
37e 5110 0 601 0 189<br />
37f 3716 0 90 366 638<br />
37g 6 26 27 3 240<br />
37h 10036 17 1328 656 3412<br />
159794 37676 38039 94651 0 367473 13122 50077 108352 74492<br />
106<br />
52
Table 25 cont‘d<br />
Social Accounting Matrix for Syria, 1999<br />
18 19 20 21 22 23 24 25 26 27<br />
1 0 0 0 1865<br />
2 0 0 0 218<br />
3 13266 799 17241 16563<br />
4 18994 1144 24685 23714<br />
5 0 0 0 35360<br />
6 222 31 0 72425<br />
7 168 0 340 162644<br />
8 9 0 19 84362<br />
9 0 0 0 25622<br />
10 0 0 0 28125<br />
11 0 0 0 78427<br />
12<br />
13 241229<br />
14 12721<br />
15 0<br />
16 33686<br />
17 8251<br />
18 15197<br />
19 26704<br />
20 30348<br />
21 207867<br />
22<br />
23<br />
24<br />
25<br />
26<br />
27 76455 153417 380941<br />
28<br />
29 40049<br />
29a<br />
29b<br />
29c<br />
29d<br />
30<br />
31a<br />
31b<br />
32<br />
33<br />
33a<br />
33b<br />
33c 35 5200 48675<br />
33d 2100<br />
107<br />
53
Table 25 cont‘d<br />
Social Accounting Matrix for Syria, 1999<br />
18 19 20 21 22 23 24 25 26 27<br />
33e 39771<br />
33f 12107<br />
33g<br />
33h<br />
33i 178 121 11 130<br />
33j 800 2554 119 479<br />
33k 1272 491 73 267<br />
33l 145 265 29 72<br />
33m 60 42 2 57<br />
33n 260 133 4 78<br />
33o 120 802 33 64<br />
33p 1218 1855 78 503<br />
34<br />
35a 1026 712 66 1697<br />
35b<br />
36<br />
37 38706<br />
37a 3370 1034 150 8092<br />
37b 12091 17433 1346 29733<br />
37c 19233 3348 829 16592<br />
37d 2194 1809 330 4448<br />
37e 907 284 22 3555<br />
37f 3925 909 44 4841<br />
37g 1810 5476 374 3979<br />
37h 18419 12665 882 31197<br />
99688 51905 46677 635108 0 76490 158617 520201 0 618152<br />
108<br />
54
Table 25 cont‘d<br />
Social Accounting Matrix for Syria, 1999<br />
28 29 29a 29b 29c 29d 30 31a 31b 32<br />
1<br />
2<br />
3<br />
4<br />
5<br />
6<br />
7<br />
8<br />
9<br />
10<br />
11<br />
12<br />
13 0<br />
14 0<br />
15 0<br />
16 0<br />
17 83<br />
18 8664<br />
19 15213<br />
20 10090<br />
21<br />
22<br />
23<br />
24<br />
25<br />
26<br />
27<br />
28<br />
29<br />
29a<br />
29b<br />
29c<br />
29d<br />
30<br />
31a<br />
120201<br />
31b<br />
32<br />
33<br />
33a<br />
33b<br />
19500<br />
33c<br />
33d<br />
295<br />
109<br />
55
Table 25 cont‘d<br />
Social Accounting Matrix for Syria, 1999<br />
28 29 29a 29b 29c 29d 30 31a 31b 32<br />
33e<br />
33f<br />
33g 26033<br />
33h<br />
33i<br />
33j<br />
33k<br />
33l<br />
33m<br />
33n<br />
33o<br />
33p<br />
34<br />
35a<br />
35b<br />
36<br />
54968<br />
37<br />
37a<br />
37b<br />
37c<br />
37d<br />
37e<br />
37f<br />
37g<br />
37h<br />
-4371<br />
0 250674 0 0 0 0 0 0 0 0<br />
110<br />
56
Table 25 cont‘d<br />
Social Accounting Matrix for Syria, 1999<br />
33 34 35a 35b 36 37a 37b 37c 37d 37e<br />
1 5137 3126 0 19114 4133 1081 687 169<br />
2 1 0 3869 91626 64 945 377<br />
3 0 0 4270 3634 707 200 39<br />
4 1716 -521 9857 8388 1631 461 91<br />
5 0 0 0 0 0 0 0<br />
6 0 0 0 0 0 0 0<br />
7 0 0 0 0 0 0 0<br />
8 0 0 15806 45905 1483 976 288<br />
9 0 0 2527 7339 237 156 46<br />
10 0 0 2078 6035 195 128 38<br />
11 0 0 3400 9876 319 210 62<br />
12<br />
13 92<br />
14 3<br />
15 0<br />
16 330<br />
17 375<br />
18 767<br />
19 483<br />
20 344<br />
21 90977<br />
22<br />
23<br />
24<br />
25<br />
26<br />
27 6229<br />
28<br />
29<br />
29a 1846<br />
29b 10381<br />
29c 137953<br />
29d<br />
30<br />
31a<br />
31b 4500<br />
32<br />
33<br />
33a<br />
33b 521<br />
33c<br />
33d<br />
111<br />
57
33e<br />
33f<br />
33g<br />
33h<br />
33i<br />
33j<br />
33k<br />
33l<br />
33m<br />
33n<br />
33o<br />
33p<br />
34<br />
35a<br />
35b<br />
36<br />
37<br />
37a<br />
37b<br />
37c<br />
37d<br />
37e<br />
37f<br />
37g<br />
37h<br />
Table 25 cont‘d<br />
Social Accounting Matrix for Syria, 1999<br />
33 34 35a 35b 36 37a 37b 37c 37d 37e<br />
259417 0 4843 0 0 60921 176935 5717 3763 1109<br />
112<br />
58
Table 25 cont‘d<br />
Social Accounting Matrix for Syria, 1999<br />
37f 37g 37h 37 Totals<br />
1 2108 399 4194 303496<br />
2 12604 74 2149 149578<br />
3 507 17 736 151686<br />
4 1171 39 1699 227234<br />
5 0 0 0 35360<br />
6 0 0 0 72890<br />
7 0 0 0 164239<br />
8 6981 225 3741 159794<br />
9 1116 36 597 37676<br />
10 918 30 492 38039<br />
11 1502 49 805 94651<br />
12 0<br />
13 367473<br />
14 13122<br />
15 50077<br />
16 108352<br />
17 74492<br />
18 99688<br />
19 51905<br />
20 46677<br />
21 635108<br />
22 0<br />
23 76490<br />
24 8969 158617<br />
25 520201<br />
26 0<br />
27 1110 618152<br />
28 0<br />
29 26033 66082<br />
29a 1846<br />
29b 10381<br />
29c 137953<br />
29d 34413<br />
30 0<br />
31a -30000<br />
31b 30000<br />
32 0<br />
33 0<br />
33a 53622<br />
33b 521<br />
33c 54205<br />
33d 2100<br />
113<br />
59
Table 25 cont‘d<br />
Social Accounting Matrix for Syria, 1999<br />
37f 37g 37h 37 Totals<br />
33e 39771<br />
33f 12107<br />
33g 26033<br />
33h 54968<br />
33i 856<br />
33j 5343<br />
33k 2508<br />
33l 778<br />
33m 461<br />
33n 710<br />
33o 1037<br />
33p 4398<br />
34 0<br />
35a 4843<br />
35b 0<br />
36 0<br />
37 34335<br />
37a 24284<br />
37b 89234<br />
37c 49796<br />
37d 13348<br />
37e 10669<br />
37f 14528<br />
37g 11941<br />
37h 78612<br />
0<br />
26906 869 14413 36112 0<br />
114<br />
60
<strong>The</strong> remaining parameters to be specified are various elasticities <strong>of</strong> substitution and<br />
transformation. Fortunately, key parameters for Syria are available from time series estimates<br />
using modern unit root and cointegration techniques, see Devarajan et al., 1999. From this we<br />
set the elasticity <strong>of</strong> transformation between domestic and exported goods equal to 0.09 and the<br />
elasticity <strong>of</strong> substitution between imports and domestic goods equal to 0.1. In calibrating the<br />
elasticities <strong>of</strong> substitution or transformation between trading blocks I follow Martin, 2000,<br />
who argues that benchmark values <strong>of</strong> 3.0 (for both elasticities) are appropriate for Lebanon’s<br />
foreign trade. This is a rather high value, which must be cautiously received given Syria’s<br />
complex quality standard and rules <strong>of</strong> origin regulations, cf. Lucke, 2001. On the other hand,<br />
the fact that Syria is in a phase <strong>of</strong> economic transition implies that traditional trade relations<br />
may undergo vivid changes, which would justify the choice <strong>of</strong> high elasticity values for<br />
trading partners. Moreover, trade diversion in favor <strong>of</strong> trading partners with reduced import<br />
tariffs leads to revenue losses for the customs authorities. If the specified elasticities were too<br />
low, then the impact <strong>of</strong> trade liberalization on the budget deficit would be underestimated.<br />
Conversely, high elasticities give an upper limit for possible revenue losses, and this is what<br />
policy makers might be interested in.<br />
Further, we exploit the fact that tariff rates for many products are different for different<br />
usages, see Ministry <strong>of</strong> Finance, 1989. For instance, nominal tariff rates for industrial usage<br />
are <strong>of</strong>ten merely 1 percent (or free <strong>of</strong> charge for projects under Investment Law No. 10).<br />
Since the model is fairly aggregated on the commodity side it is in particular incapable <strong>of</strong><br />
distinguishing different usages <strong>of</strong> commodities. Hence the average calibrated tariff rates in the<br />
model will tend to be too high for industrial demands. I capture this bias by compensating<br />
through the specification <strong>of</strong> a low elasticity <strong>of</strong> substitution <strong>of</strong> 0.01 for investment demand,<br />
reasoning that tariff reductions are not likely to yield notable increases in capital goods and<br />
raw material imports, since these do not carry much <strong>of</strong> a tariff load anyway. Note that this is<br />
not to say that investment demand is not price elastic, the assumption merely states that<br />
investment demand is hardly price elastic along the particular variation <strong>of</strong> prices used in the<br />
simulations below.<br />
A similar reasoning applies to the elasticity <strong>of</strong> substitution <strong>of</strong> government consumption.<br />
Government consumption is overwhelmingly consumption <strong>of</strong> services, most <strong>of</strong> which are<br />
probably domestically produced. As far as the government consumes imported services, it is<br />
essential to note that taxes on foreign trade in services are constant in most <strong>of</strong> the simulations.<br />
Hence government consumption is not likely to respond much to trade liberalization, which is<br />
why I assume an elasticity <strong>of</strong> substitution for government demand equal to 0.01 as well 2 .<br />
<strong>The</strong> main aggregate to respond to reduced import tariffs is thus private consumption. Here,<br />
the LES specification (31) requires the calibration <strong>of</strong> minimum consumption quantities, which<br />
then imply the demand elasticities. Using data from the 1985/1986 income and expenditure<br />
survey, I assume that minimum consumption levels in 1999 are equal to nominal consumption<br />
levels in 1985/1986. On average, this is precisely 25 percent <strong>of</strong> today’s consumption<br />
expenditure, which seems a reasonable specification <strong>of</strong> minimum consumption 3 . <strong>The</strong> precise<br />
values are found in Table 26.<br />
2 This may not be appropriate for non-service component <strong>of</strong> government consumption. However, this component<br />
is very tiny (2.6 percent <strong>of</strong> total government consumption).<br />
3 Minimum consumption quantities vary with product categories. <strong>The</strong>y are particularly high (54 percent <strong>of</strong><br />
todays consumption) for SITC 5, which includes medicines.<br />
115<br />
61
Table 26<br />
Minimum Consumption Levels in LES<br />
Actual consumption Minimum Share <strong>of</strong> minimum<br />
consumption consumption<br />
SITC0+4 241.229 81.042 34%<br />
SITC1 12.721 3.334 26%<br />
SITC2 0 0 0%<br />
SITC3 33.686 3.531 10%<br />
SITC5 8.251 4.479 54%<br />
SITC6 15.197 4.095 27%<br />
SITC7 26.704 2.793 10%<br />
SITC8 30.348 12.541 41%<br />
SITC9 207.867 29.773 14%<br />
Elasticities <strong>of</strong> substitution for the production functions (1) are not readily available. In the<br />
public sector, factor substitution seems to be extremely low, since, e. g. employees intending<br />
to resign from their posts must seek <strong>of</strong>ficial permission, which is difficult to obtain (US<br />
Department <strong>of</strong> State, 2000). <strong>The</strong>refore, I assume an elasticity <strong>of</strong> substitution <strong>of</strong> zero (fixed<br />
proportions) for pure public sector activities. For pure private sector activities I use the Cobb-<br />
Douglas benchmark (elasticity <strong>of</strong> substitution equal to one), so that for sectors with mixed<br />
public/private activities I calibrate the elasticity <strong>of</strong> substitution with the share <strong>of</strong> private<br />
activity.<br />
116<br />
62
Section VII: Simulation results<br />
Various liberalization scenarios are simulated. Denoting the status quo (benchmark) by L0, let<br />
us first focus on the following removal <strong>of</strong> tariff barriers:<br />
Scenario L1: 50 percent decrease in duties on agricultural products imported from the EU.<br />
Scenario L2: Zero duties on agricultural products imported from the EU.<br />
Scenario L3: Zero duties on non-agricultural products imported from the EU.<br />
Scenario L4: Scenario L1 and Scenario L3.<br />
Scenario L5: Zero duties on products imported from the EU.<br />
Scenario L6: Zero duties on products imported from the EU, Arab, and Turkey.<br />
Scenario L7: Zero duties on all imports 1 .<br />
A first selection <strong>of</strong> results is given in Table 27, which displays real variables only. Gross<br />
domestic product at factor cost (GDPF) is hardly changed in any <strong>of</strong> the scenarios. <strong>The</strong>re are<br />
slight reductions in GDP at market prices (GDPM), but comparison with GDPF shows that<br />
these are solely due to the reduced indirect tax, i. e. tariff load. Private consumption (CPRIV)<br />
is almost constant when tariffs on EU agricultural products are reduced, but increases more<br />
impressively when manufactures are liberalized. Generally, the increase in private<br />
consumption is <strong>of</strong> approximately the same value as the loss in tariff revenues. Variability in<br />
public consumption (CPUB) is tiny, there are small increases when liberalization is confined<br />
to agricultural products, and small decreases when manufactures are (also) involved. Gross<br />
investment (INVEST) grows a little, but only for the radical scenario L7 is the growth rate<br />
larger than one percent. Imports respond to trade liberalization much more than exports:<br />
Changes in imports are three to four times the changes in exports, so that the trade balance<br />
deteriorates.<br />
Table 27<br />
Effects <strong>of</strong> <strong>Trade</strong> <strong>Liberalization</strong> on Main Aggregates,<br />
Variables in Volume<br />
L0 L1 L2 L3 L4 L5 L6 L7<br />
GDPF 781 781 781 781 781 781 781 781<br />
0.00% 0.00% 0.00% 0.00% 0.00% 0.01% 0.02%<br />
GDPM 821 821 821 821 821 821 821 821<br />
-0.01% -0.04% -0.05% -0.07% -0.09% -0.07% -0.01%<br />
CPRIV 576 576 577 580 580 581 582 589<br />
0.05% 0.10% 0.69% 0.74% 0.79% 1.01% 2.21%<br />
CPUB 93 93 94 93 93 93 93 93<br />
0.10% 0.21% -0.50% -0.40% -0.29% -0.22% -0.15%<br />
INVEST 154 154 154 155 155 155 155 156<br />
0.07% 0.14% 0.21% 0.28% 0.36% 0.48% 1.08%<br />
Imports 292 293 295 298 298 300 302 314<br />
0.34% 0.74% 1.74% 2.08% 2.48% 3.41% 7.41%<br />
Exports 291 291 291 292 292 293 294 298<br />
0.14% 0.29% 0.39% 0.52% 0.68% 1.03% 2.56%<br />
<strong>Trade</strong> -1.777 -2.370 -3.094 -5.741 -6.338 -7.068 -8.771 -16.029<br />
Balance 33.4% 74.1% 223% 257% 298% 394% 802%<br />
1 Unlike L1-L6, this scenario also includes abolition <strong>of</strong> taxes on the import and export <strong>of</strong> services.<br />
117<br />
63
Table 28 gives the corresponding results for nominal variables. <strong>The</strong>re is a gradual increase <strong>of</strong><br />
producers prices which lets nominal GDP at factor costs increase across scenarios. GDP at<br />
market prices, however, is almost constant since the increase in factor costs is balanced by the<br />
decrease in indirect taxes, i. e. customs tariffs. All components <strong>of</strong> aggregate demand<br />
(expressed in market prices) increase, where the increase in imports balances the increases in<br />
consumption, investment and exports. Again, there are clearly negative effects on the trade<br />
balance, partially <strong>of</strong> dramatic extent.<br />
Table 28<br />
Effects <strong>of</strong> <strong>Trade</strong> <strong>Liberalization</strong> on Main Aggregates,<br />
Variables in Value (Billion 1999 LS)<br />
L0 L1 L2 L3 L4 L5 L6 L7<br />
GDPF 781 781 782 786 786 787 789 798<br />
0.06% 0.14% 0.65% 0.71% 0.79% 1.01% 2.22%<br />
GDPM 821 821 822 821 821 821 821 822<br />
0.02% 0.03% -0.03% -0.02% 0.00% 0.00% 0.10%<br />
CPRIV 576 576 577 580 580 581 582 589<br />
0.05% 0.10% 0.69% 0.74% 0.79% 1.01% 2.21%<br />
CPUB 93 94 94 93 93 94 94 94<br />
0.20% 0.43% -0.12% 0.09% 0.32% 0.52% 1.11%<br />
INVEST 154 155 155 154 154 155 155 156<br />
0.18% 0.39% -0.07% 0.11% 0.32% 0.54% 1.12%<br />
Imports 292 294 295 299 300 302 305 321<br />
0.45% 0.98% 2.30% 2.76% 3.30% 4.47% 9.89%<br />
Exports 291 291 292 293 294 295 297 305<br />
0.25% 0.53% 0.94% 1.19% 1.48% 2.06% 4.92%<br />
<strong>Trade</strong> -1.777 -2.373 -3.101 -5.773 -6.381 -7.124 -8.861 -16.398<br />
Balance 33.5% 41.0% 150% 34.2% 41.8% 97.8% 424%<br />
<strong>The</strong> effects <strong>of</strong> trade liberalization on the government budget and on capital accumulation are<br />
shown in Table 29. To interpret the effects on the government budget, it may be useful to<br />
express tariff revenue as a percentage <strong>of</strong> the 1999 government revenues (excluding loans and<br />
the PSF). This benchmark value is 178 billion LS. Thus, the tariff revenue loss implied by,<br />
say, scenario L2 is less than half a percent <strong>of</strong> today’s government revenue. For L3, however, 3<br />
percent <strong>of</strong> government revenue are affected and for L6 and L7 (complete liberalization) we<br />
find 4.4 percent and 9 percent, respectively. While these reductions in tariff revenue are not<br />
negligible, they appear considerably smaller than those reported for other MENA-countries<br />
under similar scenarios. Note that the loss <strong>of</strong> tariff revenues in absolute terms is mirrored by<br />
similar increases in private consumption, cf. Table 27.<br />
Changes in domestic indirect taxes are small, and changes in direct taxes are not much larger.<br />
Thus, total tax revenues (excluding PSF and MERS revenues) decrease by almost the same<br />
amount as does tariff revenue. Consolidating the PSF, we see that the total government deficit<br />
increases almost one-to-one with the loss <strong>of</strong> tariff revenue. Since household savings are<br />
hardly changed and investment expenditures even increase, cf. Table 27, the government<br />
deficit must be financed from abroad, which explains the current account deterioration in the<br />
last row <strong>of</strong> Table 29. This perspective is hardly promising for the Syrian government, which is<br />
118<br />
64
already plagued by a sizable external debt 2 requiring complicated negotiations with the Paris<br />
Club, see International Monetary Fund, 1999a.<br />
Table 29<br />
Effects <strong>of</strong> <strong>Trade</strong> <strong>Liberalization</strong> on Government Budget and Capital Accumulation,<br />
Variables in Value (Billion 1999 LS)<br />
L0 L1 L2 L3 L4 L5 L6 L7<br />
Tariff 16.090 15.789 15.397 10.525 10.213 9.808 8.183 0<br />
revenue -1.87% -4.31% -34.6% -36.5% -39.0% -49.1% -100%<br />
Domest. 30.622 30.641 30.663 30.874 30.893 30.914 30.863 30.716<br />
ind. tax 0.06% 0.13% 0.82% 0.89% 0.95% 0.79% 0.31%<br />
Total 46.712 46.430 46.060 41.399 41.106 40.722 39.045 30.716<br />
ind. taxes -0.60% -1.40% -11.4% -12.0% -12.8% -16.4% -34.2%<br />
Direct 54.205 54.255 54.312 54.557 54.607 54.665 54.796 55.490<br />
taxes 0.09% 0.20% 0.65% 0.74% 0.85% 1.09% 2.37%<br />
All taxes 100.917 100.686 100.372 95.956 95.713 95.387 93.842 86.206<br />
-0.23% -0.54% -4.92% -5.16% -5.48% -7.01% -14.6%<br />
Govern. 100.501 101.131 101.898 105.081 105.721 106.498 108.368 116.986<br />
deficit 0.63% 1.39% 4.56% 5.19% 5.97% 7.83% 16.4%<br />
Househ. 40.049 40.083 40.121 40.389 40.423 40.462 40.583 41.215<br />
savings 0.08% 0.18% 0.85% 0.93% 1.03% 1.33% 2.91%<br />
Current -4.371 -4.967 -5.695 8.612 -9.220 -9.962 -11.738 -19.632<br />
account 13.6% 30.3% 97.0% 111% 128% 169% 349%<br />
Table 30 illustrates trade diversion effects for scenario L1, i. e. a 50 percent reduction <strong>of</strong><br />
import duties on EU agricultural products. <strong>The</strong> table shows percentage changes in real<br />
imports vis-à-vis the benchmark equilibrium and is confined to agricultural commodity<br />
groups (including beverages and tobacco), the effects <strong>of</strong> other commodity groups being<br />
negligible (changes <strong>of</strong> less than 0.25 percent in absolute value). Clearly, the EU benefits at the<br />
expense <strong>of</strong> all other trading partners. However, it should be noted that the magnitude <strong>of</strong> this<br />
effect is determined by the rather high elasticity <strong>of</strong> substitution specified for the choice <strong>of</strong><br />
trading partners. If a lower value were appropriate, trade diversion effects would generally be<br />
reduced.<br />
Table 30<br />
<strong>Trade</strong> Diversion <strong>of</strong> Syrian Imports,<br />
Percentage Changes <strong>of</strong> Scenario L1<br />
ABC Arab EU15 Ex-Soc. Japan ROW Turkey USA<br />
SITC0+4 -2.60% -2.60% 14.05% -2.60% -2.60% -2.60% -2.60% -2.60%<br />
SITC1 - -0.41% -0.41% -0.41% -0.41% -0.41% - -0.41%<br />
2 This debt is partially denominated in hard currency, partially in Russian rubles.<br />
119<br />
65
<strong>The</strong> same caveat applies to simulations which reduce tariff rates on non-agricultural products.<br />
Table 31 gives the respective percentage changes for a 100 percent reduction <strong>of</strong> imports from<br />
the EU (scenario L3). This scenario may be particularly relevant as ist may be close to the<br />
tariff reduction finally agreed upon in an Association Agreement. With high elasticity <strong>of</strong><br />
substitution, the EU will make large inroads into the domains <strong>of</strong> other Syrian trading partners.<br />
This holds for all product categories except agricultural products (SITC 0 and SITC 4) and<br />
Services.<br />
Table 31<br />
<strong>Trade</strong> Diversion <strong>of</strong> Syrian Imports,<br />
Percentage Changes <strong>of</strong> Scenario L3<br />
ABC Arab EU15 Ex-Soc. Japan ROW Turkey USA<br />
SITC0+4 0.59% 0.59% 0.59% 0.59% 0.59% 0.59% 0.59% 0.59%<br />
SITC1 - -26.89% 182.17% -26.90% -26.90% -26.90% - -26.90%<br />
SITC2 -1.21% -1.21% 13.36% -1.21% -1.21% -1.21% -1.21% -1.21%<br />
SITC3 - -6.34% 26.02% -6.34% -6.34% -6.34% -6.34% -6.34%<br />
SITC5 -10.71% -10.71% 13.85% -10.71% -10.71% -10.71% -10.71% -10.71%<br />
SITC6 -7.35% -7.35% 35.24% -7.35% -7.35% -7.35% -7.35% -7.35%<br />
SITC7 -28.94% -28.94% 59.40% -28.94% -28.94% -28.94% -28.94% -28.94%<br />
SITC8 -9.87% -9.87% 48.69% -9.87% -9.87% -9.87% -9.87% -9.87%<br />
Services -0.39% -0.39% -0.39% -0.39% -0.39% -0.39% -0.39% -0.39%<br />
Finally, Table 32 depicts trade diversion effects in scenario L6, where duties on all products<br />
from Arab countries, Turkey, and the EU are completely abolished. For the EU, gains in trade<br />
are then almost as large as if tariff reductions only in favor <strong>of</strong> the EU had been enacted – a<br />
result which is probably due to large differences in the product structure <strong>of</strong> exported goods<br />
between the EU on the one hand and Arab states and Turkey on the other hand.<br />
Table 32<br />
<strong>Trade</strong> Diversion <strong>of</strong> Syrian Imports,<br />
Percentage Changes <strong>of</strong> Scenario L6<br />
ABC Arab EU15 Ex-Soc. Japan ROW Turkey USA<br />
SITC0+4 -7.23% 18.83% 27.61% -7.23% -7.23% -7.23% 25.01% -7.23%<br />
SITC1 - 110.16% 169.00% -30.31% -30.31% -30.31% - -30.31%<br />
SITC2 -3.01% 8.31% 11.30% -3.01% -3.01% -3.01% 11.30% -3.01%<br />
SITC3 - 16.33% 23.30% -8.36% -8.36% -8.36% 23.30% -8.36%<br />
SITC5 -14.31% 4.17% 9.27% -14.31% -14.31% -14.31% 9.27% -14.31%<br />
SITC6 -10.59% 21.23% 30.51% -10.59% -10.59% -10.59% 30.51% -10.59%<br />
SITC7 -30.82% 33.17% 55.20% -30.82% -30.82% -30.82% 55.20% -30.82%<br />
SITC8 -11.98% 31.80% 45.20% -11.98% -11.98% -11.98% 45.20% -11.98%<br />
Services -1.01% 8.78% -1.01% -1.01% -1.01% -1.01% 8.78% -1.01%<br />
120<br />
66
Table 33 gives a detailed account <strong>of</strong> imports in volume and Table 34 gives the corresponding<br />
numbers in value. Similarly, Table 35 gives exports in volume and Table 36 gives exports in<br />
value.<br />
Table 33<br />
Imports by Product and Origin<br />
Variables in Volume<br />
L0 L1 L2 L3 L4 L5 L6 L7<br />
Imports by product group<br />
SITC0+4 41.474 42.407 43.512 41.719 42.658 43.769 44.902 48.471<br />
2.25% 4.91% 0.59% 2.86% 5.53% 8.27% 16.87%<br />
SITC1 537 534 532 810 807 803 824 1.043<br />
-0.41% -0.86% 50.97% 50.38% 49.73% 53.64% 94.34%<br />
SITC2 9.138 9.131 9.123 9.260 9.252 9.244 9.263 9.433<br />
-0.08% -0.17% 1.33% 1.25% 1.16% 1.37% 3.22%<br />
SITC3 5.493 5.493 5.493 6.094 6.094 6.094 6.283 6.514<br />
0.00% -0.01% 10.94% 10.94% 10.93% 14.39% 18.59%<br />
SITC5 24.448 24.463 24.481 24.734 24.750 24.768 24.895 25.263<br />
0.06% 0.13% 1.17% 1.23% 1.31% 1.83% 3.33%<br />
SITC6 61.950 61.997 62.049 62.545 62.593 62.648 63.043 64.455<br />
0.08% 0.16% 0.96% 1.04% 1.13% 1.76% 4.04%<br />
SITC7 42.958 42.963 42.970 45.926 45.931 45.938 46.157 47.977<br />
0.01% 0.03% 6.91% 6.92% 6.94% 7.45% 11.68%<br />
SITC8 3.977 3.968 3.957 4.373 4.363 4.351 4.361 4.775<br />
-0.24% -0.50% 9.96% 9.69% 9.40% 9.65% 20.07%<br />
Services 102.436 102.443 102.453 102.040 102.048 102.060 102.667 106.160<br />
0.01% 0.02% -0.39% -0.38% -0.37% 0.23% 3.64%<br />
Imports by country <strong>of</strong> origin<br />
ABC 10.669 10.536 10.393 10.506 10.373 10.228 10.032 11.835<br />
-1.24% -2.59% -1.52% -2.77% -4.13% -5.97% 10.93%<br />
Arab 24.284 24.187 24.082 23.051 22.953 22.847 27.359 24.954<br />
-0.40% -0.83% -5.08% -5.48% -5.92% 12.66% 2.76%<br />
EU15 89.234 90.946 92.900 107.441 109.166 111.136 108.485 96.758<br />
1.92% 4.11% 20.40% 22.34% 24.55% 21.57% 8.43%<br />
Ex-Soc. 49.796 49.707 49.612 47.003 46.914 46.817 45.751 52.876<br />
-0.18% -0.37% -5.61% -5.79% -5.98% -8.12% 6.19%<br />
Japan 11.941 11.942 11.944 10.137 10.138 10.140 9.932 12.942<br />
0.01% 0.02% -15.11% -15.09% -15.08% -16.82% 8.38%<br />
ROW 78.612 78.368 78.103 73.016 72.770 72.502 71.023 84.343<br />
-0.31% -0.65% -7.12% -7.43% -7.77% -9.65% 7.29%<br />
Turkey 14.528 14.435 14.334 13.882 13.789 13.687 17.755 15.680<br />
-0.64% -1.33% -4.44% -5.09% -5.79% 22.22% 7.93%<br />
USA 13.348 13.278 13.201 12.464 12.393 12.316 12.058 14.703<br />
-0.53% -1.11% -6.63% -7.16% -7.74% -9.67% 10.15%<br />
In general, reduced tariffs for agricultural products (SITC0+4) increase the imported<br />
quantities <strong>of</strong> these products and have weak effects <strong>of</strong> either sign on other product groups. If<br />
tariffs for manufactures are (also) reduced, we note particularly high responses for the import<br />
<strong>of</strong> beverages and tobacco (SITC1). Further, tariff reductions for European goods only are<br />
generally benefitial for the EU and have advers effects for other trading partners. <strong>The</strong>se can<br />
become substantial tariffs for other MENA countries are also reduced. For instance, in<br />
121<br />
67
scenario L6, Japan and the US loose 17 percent and 10 percent <strong>of</strong> their import volume,<br />
respectively. Interestingly, Turkey benefits from this form <strong>of</strong> trade liberalization much more<br />
than the Arab countries, its percentage increase in import volume is even slightly higher than<br />
the one for the European Union. Under full tariff liberalization the American countries would<br />
make the largest percentage gains, and the foreign trade increase <strong>of</strong> Arabic states would be far<br />
<strong>of</strong>f those enjoyed by all other countries.<br />
Table 34<br />
Imports by Product and Origin<br />
Variables in Value (Billion 1999 LS)<br />
L0 L1 L2 L3 L4 L5 L6 L7<br />
Imports by product group<br />
SITC0+4 41.474 42.455 43.616 41.950 42.942 44.116 45.361 49.586<br />
2.37% 5.17% 1.15% 3.54% 6.37% 9.37% 19.56%<br />
SITC1 537 535 533 815 812 810 833 1.067<br />
-0.29% -0.62% 51.80% 51.38% 50.92% 55.21% 98.81%<br />
SITC2 9.138 9.141 9.145 9.311 9.314 9.317 9.358 9.650<br />
0.03% 0.07% 1.89% 1.92% 1.96% 2.41% 5.60%<br />
SITC3 5.493 5.499 5.506 6.128 6.134 6.142 6.348 6.664<br />
0.11% 0.23% 11.55% 11.67% 11.81% 15.56% 21.31%<br />
SITC5 24.448 24.491 24.539 24.870 24.914 24.964 25.150 25.844<br />
0.18% 0.37% 1.73% 1.91% 2.11% 2.87% 5.71%<br />
SITC6 61.950 62.066 62.198 62.890 63.010 63.145 63.688 65.938<br />
0.19% 0.40% 1.52% 1.71% 1.93% 2.81% 6.44%<br />
SITC7 42.958 43.012 43.073 46.179 46.237 46.303 46.629 49.080<br />
0.13% 0.27% 7.50% 7.63% 7.79% 8.55% 14.25%<br />
SITC8 3.977 3.972 3.967 4.397 4.392 4.385 4.406 4.885<br />
-0.13% -0.26% 10.56% 10.42% 10.27% 10.78% 22.83%<br />
Services 102.436 102.558 102.698 102.603 102.727 102.869 103.718 108.602<br />
0.12% 0.26% 0.16% 0.28% 0.42% 1.25% 6.02%<br />
Imports by country <strong>of</strong> origin<br />
ABC 10.669 10.548 10.417 10.564 10.442 10.310 10.134 12.107<br />
-1.13% -2.35% -0.98% -2.12% -3.36% -5.01% 13.48%<br />
Arab 24.284 24.214 24.140 23.178 23.106 23.029 27.639 25.528<br />
-0.29% -0.59% -4.55% -4.85% -5.17% 13.82% 5.12%<br />
EU15 89.234 91.048 93.123 108.034 109.892 112.017 109.595 98.984<br />
2.03% 4.36% 21.07% 23.15% 25.53% 22.82% 10.93%<br />
Ex-Soc. 49.796 49.763 49.731 47.263 47.226 47.189 46.219 54.092<br />
-0.06% -0.13% -5.09% -5.16% -5.24% -7.18% 8.63%<br />
Japan 11.941 11.955 11.972 10.193 10.206 10.220 10.034 13.239<br />
0.12% 0.26% -14.64% -14.53% -14.41% -15.97% 10.88%<br />
ROW 78.612 78.456 78.291 73.419 73.254 73.077 71.750 86.283<br />
-0.20% -0.41% -6.61% -6.82% -7.04% -8.73% 9.76%<br />
Turkey 14.528 14.451 14.368 13.959 13.881 13.796 17.937 16.041<br />
-0.53% -1.10% -3.91% -4.45% -5.04% 23.47% 10.42%<br />
USA 13.348 13.293 13.233 12.533 12.475 12.414 12.182 15.041<br />
-0.42% -0.87% -6.11% -6.54% -7.00% -8.74% 12.68%<br />
We now turn to Tables 9 and 10 which give simulation results for exports by activity and<br />
country <strong>of</strong> destination.<br />
122<br />
68
Table 35<br />
Exports by Activity and Destination<br />
Variables in Volume<br />
L0 L1 L2 L3 L4 L5 L6 L7<br />
Exports by activity<br />
Agricult. 31.884 32.082 32.306 31.777 31.975 32.199 32.367 32.943<br />
0.62% 1.32% -0.33% 0.28% 0.99% 1.51% 3.32%<br />
Mining 111.708 111.739 111.774 111.819 111.850 111.884 111.997 112.438<br />
0.03% 0.06% 0.10% 0.13% 0.16% 0.26% 0.65%<br />
Public 10.109 10.158 10.213 10.447 10.498 10.556 10.805 11.756<br />
manuf. 0.49% 1.03% 3.34% 3.85% 4.42% 6.88% 16.29%<br />
Private 23.337 23.390 23.450 23.727 23.781 23.843 24.112 25.173<br />
manuf. 0.23% 0.48% 1.67% 1.90% 2.17% 3.32% 7.87%<br />
Transp.+ 75.404 75.447 75.494 75.620 75.662 75.708 75.835 76.681<br />
commun. 0.06% 0.12% 0.29% 0.34% 0.40% 0.57% 1.69%<br />
Finance + 12.054 12.061 12.068 12.058 12.065 12.072 12.083 12.187<br />
insurance 0.06% 0.12% 0.03% 0.09% 0.15% 0.24% 1.10%<br />
Social 9.914 9.920 9.927 10.012 10.018 10.025 10.067 10.280<br />
services 0.07% 0.14% 0.99% 1.05% 1.13% 1.55% 3.70%<br />
Govern. 16.222 16.232 16.243 16.299 16.308 16.319 16.359 16.603<br />
services 0.06% 0.13% 0.47% 0.53% 0.60% 0.84% 2.34%<br />
Exports by country <strong>of</strong> destination<br />
ABC 1.109 1.111 1.113 1.113 1.115 1.117 1.121 1.139<br />
0.16% 0.34% 0.37% 0.54% 0.72% 1.09% 2.69%<br />
Arab 60.921 61.097 61.297 61.251 61.428 61.629 61.998 63.504<br />
0.29% 0.62% 0.54% 0.83% 1.16% 1.77% 4.24%<br />
EU15 176.935 177.063 177.206 177.514 177.642 177.786 178.219 180.236<br />
0.07% 0.15% 0.33% 0.40% 0.48% 0.73% 1.87%<br />
Ex-Soc. 5.717 5.732 5.749 5.772 5.787 5.805 5.851 6.039<br />
0.26% 0.56% 0.96% 1.23% 1.54% 2.34% 5.64%<br />
Japan 869 872 875 870 873 876 880 895<br />
0.33% 0.70% 0.13% 0.46% 0.83% 1.26% 3.00%<br />
ROW 14.413 14.450 14.492 14.473 14.511 14.553 14.626 14.927<br />
0.26% 0.55% 0.42% 0.68% 0.97% 1.48% 3.57%<br />
Turkey 26.906 26.934 26.965 26.985 27.012 27.044 27.114 27.433<br />
0.10% 0.22% 0.29% 0.39% 0.51% 0.77% 1.96%<br />
USA 3.763 3.771 3.779 3.781 3.789 3.797 3.815 3.889<br />
0.20% 0.42% 0.48% 0.68% 0.90% 1.37% 3.34%<br />
In terms <strong>of</strong> activities, exports <strong>of</strong> manufactures, both from the public and the private sector<br />
show the largest percentage increases. Exports <strong>of</strong> mining products are small both in absolute<br />
and relative terms. Agriclture is also only modestly stimulated, in fact, there may be slight<br />
reductions in agricultural exports under scenario L3, where we simulate the effects <strong>of</strong> nonagricultural<br />
tariff reductions. Since we do not study improved market access in partner<br />
countries, no dramatic changes occur in the distribution <strong>of</strong> exports across trading partners.<br />
123<br />
69
Table 36<br />
Exports by Activity and Destination<br />
Variables in Value (Billion 1999 LS)<br />
L0 L1 L2 L3 L4 L5 L6 L7<br />
Exports by activity<br />
Agricult. 31.884 32.118 32.383 31.953 32.188 32.454 32.698 33.701<br />
0.73% 1.57% 0.22% 0.95% 1.79% 2.55% 5.70%<br />
Mining 111.708 111.865 112.041 112.436 112.594 112.772 113.143 115.024<br />
0.14% 0.30% 0.65% 0.79% 0.95% 1.28% 2.97%<br />
Public 10.109 10.169 10.238 10.504 10.568 10.640 10.915 12.026<br />
manuf. 0.60% 1.28% 3.91% 4.54% 5.25% 7.98% 18.97%<br />
Private 23.337 23.416 23.506 23.858 23.940 24.032 24.359 25.752<br />
manuf. 0.34% 0.72% 2.23% 2.58% 2.98% 4.38% 10.35%<br />
Transp.+ 75.404 75.532 75.675 76.038 76.165 76.309 76.611 78.445<br />
commun. 0.17% 0.36% 0.84% 1.01% 1.20% 1.60% 4.03%<br />
Finance + 12.054 12.074 12.097 12.125 12.145 12.168 12.206 12.468<br />
insurance 0.17% 0.36% 0.59% 0.75% 0.94% 1.26% 3.43%<br />
Social 9.914 9.931 9.951 10.067 10.085 10.105 10.170 10.517<br />
services 0.18% 0.38% 1.55% 1.73% 1.93% 2.59% 6.08%<br />
Govern. 16.222 16.251 16.282 16.389 16.417 16.449 16.526 16.985<br />
services 0.17% 0.37% 1.02% 1.20% 1.39% 1.87% 4.70%<br />
Exports by country <strong>of</strong> destination<br />
ABC 1.109 1.112 1.115 1.119 1.122 1.126 1.132 1.165<br />
0.27% 0.58% 0.93% 1.20% 1.52% 2.13% 5.05%<br />
Arab 60.921 61.166 61.443 61.589 61.837 62.118 62.633 64.965<br />
0.40% 0.86% 1.10% 1.50% 1.96% 2.81% 6.64%<br />
EU15 176.935 177.262 177.630 178.494 178.824 179.196 180.043 184.382<br />
0.18% 0.39% 0.88% 1.07% 1.28% 1.76% 4.21%<br />
Ex-Soc. 5.717 5.739 5.763 5.804 5.826 5.851 5.911 6.178<br />
0.38% 0.80% 1.52% 1.91% 2.34% 3.39% 8.07%<br />
Japan 869 873 877 875 879 883 889 916<br />
0.44% 0.94% 0.68% 1.13% 1.63% 2.30% 5.37%<br />
ROW 14.413 14.466 14.527 14.553 14.607 14.668 14.776 15.270<br />
0.37% 0.79% 0.98% 1.35% 1.78% 2.52% 5.95%<br />
Turkey 26.906 26.964 27.030 27.134 27.192 27.258 27.391 28.064<br />
0.22% 0.46% 0.85% 1.06% 1.31% 1.80% 4.30%<br />
USA 3.763 3.775 3.788 3.802 3.814 3.827 3.854 3.978<br />
0.31% 0.66% 1.04% 1.35% 1.70% 2.41% 5.72%<br />
Production by activity is given in Tables 11 and 12, where the former displays variables in<br />
volume and the latter variables in value. We comment only on the former, since price effects<br />
will separately be discussed below.<br />
124<br />
70
Table 37<br />
Production by Activity<br />
Variables in Volume<br />
L0 L1 L2 L3 L4 L5 L6 L7<br />
Agricult. 303.496 302.937 302.310 305.612 305.046 304.411 304.287 305.739<br />
-0.18% -0.39% 0.70% 0.51% 0.30% 0.26% 0.74%<br />
Mining 149.578 149.765 149.977 150.212 150.400 150.611 150.878 152.809<br />
0.13% 0.27% 0.42% 0.55% 0.69% 0.87% 2.16%<br />
Public 151.686 152.163 152.702 153.121 153.610 154.163 155.724 161.643<br />
manuf. 0.31% 0.67% 0.95% 1.27% 1.63% 2.66% 6.56%<br />
Private 227.234 227.391 227.567 225.975 226.133 226.311 226.026 225.768<br />
manuf. 0.07% 0.15% -0.55% -0.48% -0.41% -0.53% -0.65%<br />
Utilities 35.360 35.422 35.492 35.567 35.630 35.701 35.799 35.608<br />
0.18% 0.37% 0.59% 0.76% 0.97% 1.24% 0.70%<br />
Construc. 72.890 73.004 73.134 73.905 74.022 74.154 74.642 76.939<br />
0.16% 0.33% 1.39% 1.55% 1.73% 2.40% 5.55%<br />
<strong>Trade</strong> 164.239 164.471 164.732 164.768 165.000 165.263 165.344 165.699<br />
0.14% 0.30% 0.32% 0.46% 0.62% 0.67% 0.89%<br />
Transp.+ 159.794 160.036 160.308 160.574 160.816 161.090 161.423 163.094<br />
commun. 0.15% 0.32% 0.49% 0.64% 0.81% 1.02% 2.07%<br />
Finance + 37.676 37.731 37.793 37.727 37.782 37.844 37.872 38.021<br />
insurance 0.15% 0.31% 0.14% 0.28% 0.45% 0.52% 0.91%<br />
Social 38.039 38.097 38.163 38.439 38.498 38.565 38.713 39.286<br />
services 0.15% 0.33% 1.05% 1.21% 1.38% 1.77% 3.28%<br />
Govern. 94.651 94.789 94.946 95.098 95.237 95.394 95.561 96.161<br />
services 0.15% 0.31% 0.47% 0.62% 0.79% 0.96% 1.60%<br />
Reduced agricultural import tariffs generally lead to slight depressions <strong>of</strong> domestic<br />
agricultural production, while all other activities enjoy very, very minor stimuli. Conversely,<br />
agriculture benefits a little from the reduction <strong>of</strong> non-agricultural tariffs only, since this<br />
effectively raises the price <strong>of</strong> agricultural products relative to non-agricultural products.<br />
Consequently, most activities suffer minor reductions, among the exceptions being those<br />
activities whose products are not traded (utilities, construction). Full liberalization under<br />
scenario L7 has very hererogenous effects across activities and some <strong>of</strong> these are difficult to<br />
explain. For instance, private manufacturing decreases slightly, but public manufacturing<br />
increases. Still, the adverse effects <strong>of</strong> trade liberalization due to increased competition on the<br />
domestic markets seem very limited. We have some doubts about the reliability <strong>of</strong> the results<br />
for this scenario, since we share a general feeling <strong>of</strong> weak competitiveness for the Syrian<br />
industry which, if true, would suggest much larger inroads into Syrian markets. However, to<br />
the best <strong>of</strong> our knowledge, the data released by the Syrian authorities do not support this<br />
skeptical view in a mostly standard computable general equilibrium model.<br />
125<br />
71
Table 38<br />
Production by activity<br />
Variables in Value (Billion 1999 LS)<br />
L0 L1 L2 L3 L4 L5 L6 L7<br />
Agricult. 303.496 302.937 302.310 305.612 305.046 304.411 304.287 305.739<br />
-0.18% -0.39% 0.70% 0.51% 0.30% 0.26% 0.74%<br />
Mining 149.578 149.765 149.977 150.212 150.400 150.611 150.878 152.809<br />
0.13% 0.27% 0.42% 0.55% 0.69% 0.87% 2.16%<br />
Public 151.686 152.163 152.702 153.121 153.610 154.163 155.724 161.643<br />
manuf. 0.31% 0.67% 0.95% 1.27% 1.63% 2.66% 6.56%<br />
Private 227.234 227.391 227.567 225.975 226.133 226.311 226.026 225.768<br />
manuf. 0.07% 0.15% -0.55% -0.48% -0.41% -0.53% -0.65%<br />
Utilities 35.360 35.422 35.492 35.567 35.630 35.701 35.799 35.608<br />
0.18% 0.37% 0.59% 0.76% 0.97% 1.24% 0.70%<br />
Construc. 72.890 73.004 73.134 73.905 74.022 74.154 74.642 76.939<br />
0.16% 0.33% 1.39% 1.55% 1.73% 2.40% 5.55%<br />
<strong>Trade</strong> 159.794 164.471 164.732 164.768 165.000 165.263 165.344 165.699<br />
0.14% 0.30% 0.32% 0.46% 0.62% 0.67% 0.89%<br />
Transp.+ 164.239 160.036 160.308 160.574 160.816 161.090 161.423 163.094<br />
commun. 0.15% 0.32% 0.49% 0.64% 0.81% 1.02% 2.07%<br />
Finance + 37.676 37.731 37.793 37.727 37.782 37.844 37.872 38.021<br />
insurance 0.15% 0.31% 0.14% 0.28% 0.45% 0.52% 0.91%<br />
Social 38.039 38.097 38.163 38.439 38.498 38.565 38.713 39.286<br />
services 0.15% 0.33% 1.05% 1.21% 1.38% 1.77% 3.28%<br />
Govern. 94.651 94.789 94.946 95.098 95.237 95.394 95.561 96.161<br />
services 0.15% 0.31% 0.47% 0.62% 0.79% 0.96% 1.60%<br />
Looking at factor prices, Table 39, the wage rate (measured in units <strong>of</strong> the consumer basket)<br />
increases slightly. This was to be expected since the price <strong>of</strong> the consumer basket decreases<br />
with reduced import tariffs and domestic production does not change much. Since we use a<br />
neoclassical production function with fixed factor supply in the aggregate economy, it is not<br />
surprising to find the remuneration <strong>of</strong> the complementary factor capital also increasing across<br />
scenarios. Table 39 shows the gross rates <strong>of</strong> return to capital, i. e. including allowance for<br />
depreciation. <strong>The</strong> base year values are obtained from estimating sectoral production functions<br />
and evaluating the marginal products. Given the scarcity and quality <strong>of</strong> available data, these<br />
estimates will have large standard errors and need to be interpreted very cautiously. Still, the<br />
general impression they communicate may be correct: We find extremely high returns to<br />
capital in the oil producing sector and low returns in sectors in which the government might<br />
find it appropriate to guarantee basic needs like housing, water, and electricity at low prices.<br />
(Note that utilities are almost completely government controled and that the state still controls<br />
about 50 percent <strong>of</strong> the construction business). It seems also plausible to find rather high<br />
returns to capital in an economy which is reputedly scarce <strong>of</strong> this prodction factor (and<br />
abundant <strong>of</strong> labor). As pointed out above, the specification <strong>of</strong> the model does not allow the<br />
free flow <strong>of</strong> capital among different sectors, which is why we show different and very<br />
heterogenous returns in Table 39.<br />
126<br />
72
Table 39<br />
Compensation <strong>of</strong> Production Factors<br />
L0 L1 L2 L3 L4 L5 L6 L7<br />
Wage<br />
rate<br />
100.00% 100.07% 100.14% 100.79% 100.85% 100.93% 101.23% 102.65%<br />
gross return to capital<br />
Agricult. 15.61% 15.60% 15.58% 15.70% 15.81% 15.91% 16.03% 16.30%<br />
Mining<br />
Public<br />
manufact.<br />
Private<br />
manufact.<br />
Utilities<br />
Construc.<br />
<strong>Trade</strong><br />
Transp. +<br />
commun.<br />
Finance +<br />
insurance<br />
Social<br />
services<br />
Govern.<br />
services<br />
166.3% 166.5% 166.9% 167.8% 168.9% 170.3% 172.0% 176.1%<br />
14.79% 14.83% 14.91% 15.10% 15.34% 15.62% 16.07% 17.13%<br />
8.10% 8.11% 8.12% 8.14% 8.17% 8.20% 8.25% 8.39%<br />
4.77% 4.78% 4.79% 4.83% 4.88% 4.93% 5.00% 5.09%<br />
2.21% 2.21% 2.22% 2.25% 2.29% 2.33% 2.38% 2.52%<br />
18.52% 18.55% 18.59% 18.70% 18.84% 19.00% 19.19% 19.55%<br />
15.98% 16.00% 16.04% 16.15% 16.28% 16.43% 16.63% 17.05%<br />
18.49% 18.51% 18.56% 18.63% 18.73% 18.85% 19.01% 19.33%<br />
18.51% 18.54% 18.59% 18.80% 19.04% 19.32% 19.67% 20.39%<br />
18.51% 18.53% 18.58% 18.71% 18.86% 19.04% 19.27% 19.72%<br />
Price indices <strong>of</strong> domestically produced goods are given in Table 40, both by factor costs and<br />
by market prices. Effects are qualitatively similar for factor costs and for market prices, since<br />
in both cases two effects merge into each other: On the one hand, prices for the primary<br />
factors <strong>of</strong> production increase, cf. Table 39, on the other hand, competing imports become<br />
cheaper due to reduced import tariffs. This again makes intermediate consumption cheaper,<br />
such that the effects on total costs is unclear. <strong>The</strong> general line visible in Table 40 seems to be<br />
that the prices <strong>of</strong> manufactured products decrease, while the prices <strong>of</strong> raw material,<br />
agricultural products and services increase.<br />
127<br />
73
Table 40<br />
Prices <strong>of</strong> Domestically Produced Products<br />
L0 L1 L2 L3 L4 L5 L6 L7<br />
by factor costs<br />
SITC0+4 100.00% 99.90% 99.79% 100.67% 100.56% 100.45% 100.50% 101.17%<br />
SITC1 100.00% 99.99% 99.98% 98.50% 98.50% 98.49% 98.21% 96.35%<br />
SITC2 100.00% 100.07% 100.15% 100.48% 100.55% 100.63% 100.52% 100.50%<br />
SITC3 100.00% 100.10% 100.22% 100.37% 100.47% 100.59% 100.70% 101.67%<br />
SITC5 100.00% 100.11% 100.23% 98.78% 98.88% 99.00% 98.50% 98.87%<br />
SITC6 100.00% 100.11% 100.24% 99.36% 99.47% 99.59% 99.17% 96.73%<br />
SITC7 100.00% 100.10% 100.20% 95.42% 95.52% 95.62% 95.37% 91.64%<br />
SITC8 100.00% 100.03% 100.07% 99.59% 99.62% 99.66% 99.51% 98.23%<br />
Services 100.00% 100.11% 100.23% 100.42% 100.53% 100.65% 100.80% 101.56%<br />
by market prices<br />
SITC0+4 100.00% 99.83% 99.64% 100.65% 100.48% 100.28% 100.25% 100.65%<br />
SITC1 100.00% 100.00% 99.99% 97.95% 97.95% 97.95% 97.63% 95.32%<br />
SITC2 100.00% 100.08% 100.17% 100.41% 100.49% 100.58% 100.47% 100.41%<br />
SITC3 100.00% 100.10% 100.22% 100.22% 100.32% 100.44% 100.50% 101.43%<br />
SITC5 100.00% 100.11% 100.23% 98.67% 98.78% 98.90% 98.38% 98.70%<br />
SITC6 100.00% 100.11% 100.24% 99.21% 99.32% 99.45% 98.98% 96.29%<br />
SITC7 100.00% 100.11% 100.24% 94.17% 94.28% 94.40% 94.11% 89.51%<br />
SITC8 100.00% 100.04% 100.09% 99.37% 99.41% 99.45% 99.31% 97.81%<br />
Services 100.00% 100.11% 100.23% 100.44% 100.55% 100.67% 100.80% 101.41%<br />
Table 41 shows price indices for domestic prices <strong>of</strong> imports. <strong>The</strong>re is little to say about this;<br />
all price effects are intuitive in the sense that import prices fall when tariffs <strong>of</strong> this product<br />
group are reduced. Conversely, (relative) prices rise when the own customs tariff rate is<br />
unchanged but the rates <strong>of</strong> other product groups are reduced.<br />
Table 41<br />
Domestic Prices <strong>of</strong> Imports by Product Groups<br />
L0 L1 L2 L3 L4 L5 L6 L7<br />
SITC0+4 100.00% 99.31% 98.55% 100.53% 99.84% 99.08% 98.47% 97.13%<br />
SITC1 100.00% 100.11% 100.24% 89.61% 89.71% 89.83% 89.05% 81.86%<br />
SITC2 100.00% 100.11% 100.24% 100.11% 100.22% 100.35% 100.27% 100.01%<br />
SITC3 100.00% 100.11% 100.24% 97.76% 97.87% 98.00% 97.36% 97.47%<br />
SITC5 100.00% 100.11% 100.24% 98.48% 98.59% 98.72% 98.16% 98.37%<br />
SITC6 100.00% 100.11% 100.24% 99.14% 99.25% 99.38% 98.89% 96.08%<br />
SITC7 100.00% 100.11% 100.24% 94.12% 94.23% 94.35% 94.07% 89.43%<br />
SITC8 100.00% 100.11% 100.24% 97.34% 97.45% 97.57% 97.46% 94.13%<br />
Services 100.00% 100.11% 100.24% 100.53% 100.65% 100.78% 100.80% 100.67%<br />
Finally, Table 42 shows the domestic prices <strong>of</strong> exports. <strong>The</strong>se are equal across commodities,<br />
since world market prices are given and the subsidy structure is held constant in scenarios L1<br />
through L7. Clearly, export prices rise slightly since they are measured relative to the<br />
consumer basket price and this price falls due to cheaper inputs.<br />
128<br />
74
Table 42<br />
Domestic Prices <strong>of</strong> Exports by Activities<br />
L0 L1 L2 L3 L4 L5 L6 L7<br />
Agricult. 100.00% 100.11% 100.24% 100.55% 100.67% 100.79% 101.02% 102.30%<br />
Mining 100.00% 100.11% 100.24% 100.55% 100.67% 100.79% 101.02% 102.30%<br />
Public<br />
manuf.<br />
100.00% 100.11% 100.24% 100.55% 100.67% 100.79% 101.02% 102.30%<br />
Private<br />
manuf.<br />
100.00% 100.11% 100.24% 100.55% 100.67% 100.79% 101.02% 102.30%<br />
Transp. +<br />
commun.<br />
100.00% 100.11% 100.24% 100.55% 100.67% 100.79% 101.02% 102.30%<br />
Finance +<br />
insurance<br />
100.00% 100.11% 100.24% 100.55% 100.67% 100.79% 101.02% 102.30%<br />
Social 100.00% 100.11% 100.24% 100.55% 100.67% 100.79% 101.02% 102.30%<br />
services<br />
Govern.<br />
services<br />
100.00% 100.11% 100.24% 100.55% 100.67% 100.79% 101.02% 102.30%<br />
As pointed out above, the MERS has, among other things, tariff equivalent effects. Let us<br />
therefore study scenarios that include the abolition <strong>of</strong> the MERS. Thus along formal tariff<br />
barriers, a specific form <strong>of</strong> non-tariff barrier is eliminated in the scenarios specified below. In<br />
place <strong>of</strong> the multiple exchange rate systems the scenarios postulate that the Syrian<br />
government fixes the exchange rate at the Beirut free market level (51 LS/$). <strong>The</strong> following<br />
scenarios are studied:<br />
Scenario L8: Zero duties on all imports 3 and abolition <strong>of</strong> MERS.<br />
Scenario L9: Zero duties on non-agricultural EU-products and abolition <strong>of</strong> MERS.<br />
Scenario L10: Zero duties on all products imported from the EU and abolition <strong>of</strong> MERS.<br />
Scenario L11: Zero duties on imports from the EU, Arab, and Turkey and abolition <strong>of</strong> MERS.<br />
Scenario L8 is a scenario <strong>of</strong> completely free trade. Scenario L9 (no tariff reduction for<br />
agriculture) may be close to what will actually be specified under EU-Association. Scenario<br />
L10 also includes liberalization for agricultural products. Scenarion L11 studies the effects <strong>of</strong><br />
also integrating Turkey and the Arabic countries into such a free trade area.<br />
<strong>The</strong> economic effects <strong>of</strong> the MERS are equivalent to import tariffs, export subsidies and<br />
export taxes. Abolition <strong>of</strong> the MERS has thus direct effects also on export performance.<br />
However, it is important to note that MERS export subsidy equivalents support hardly<br />
anything else but agriculture and private manufacturing 4 . While agriculture enjoys the full<br />
subsidy equivalent effect, private manufacturing is simultaneously subject to the MERS<br />
export tax equivalent effect, which effectively reduces, but does not extinguish the subsidy<br />
equivalent effect. <strong>The</strong>refore, the first impact <strong>of</strong> MERS abolition is a strong negative effect on<br />
agricultural exports and a somewhat weaker, but still negative effect on exports <strong>of</strong> private<br />
manufacturing. Table 43 and Table 44 show exports in volume and value, respectively.<br />
3 Again, unlike L9-L11, this scenario also includes abolition <strong>of</strong> taxes on the import and export <strong>of</strong> services.<br />
4 <strong>The</strong>re are also very tiny subsidies for private mining activities, but these are negligible.<br />
129<br />
75
Table 43<br />
Exports by Activity and Destination<br />
Variables in Volume<br />
L0 L8 L9 L10 L11<br />
Exports by activity<br />
Agricult. 31.884 27.082 26.075 26.483 26.627<br />
-15.06% -18.22% -16.94% -16.49%<br />
Mining 111.708 115.218 114.571 114.790 114.907<br />
3.14% 2.56% 2.76% 2.86%<br />
Public 10.109 13.060 11.581 11.758 12.040<br />
manuf. 29.20% 14.56% 16.32% 19.10%<br />
Private 23.337 22.053 20.775 20.933 21.172<br />
manuf. -5.50% -10.98% -10.30% -9.28%<br />
Transp.+ 75.404 81.121 79.986 80.338 80.473<br />
commun. 7.58% 6.08% 6.54% 6.72%<br />
Finance + 12.054 12.914 12.775 12.831 12.842<br />
insurance 7.13% 5.98% 6.44% 6.53%<br />
Social 9.914 10.992 10.702 10.759 10.804<br />
services 10.88% 7.95% 8.52% 8.98%<br />
Govern. 16.222 17.730 17.400 17.488 17.531<br />
services 9.29% 7.26% 7.80% 8.07%<br />
Exports by country <strong>of</strong> destination<br />
ABC 1.109 1.137 1.111 1.118 1.122<br />
2.51% 0.22% 0.79% 1.16%<br />
Arab 60.921 60.788 58.601 59.110 59.470<br />
-0.22% -3.81% -2.97% -2.38%<br />
EU15 176.935 185.368 182.564 183.253 183.697<br />
4.77% 3.18% 3.57% 3.82%<br />
Ex-Soc. 5.717 5.853 5.589 5.637 5.683<br />
2.38% -2.25% -1.40% -0.60%<br />
Japan 869 842 818 826 829<br />
-3.17% -5.86% -5.00% -4.60%<br />
ROW 14.413 14.424 13.985 14.094 14.165<br />
0.08% -2.97% -2.21% -1.72%<br />
Turkey 26.906 27.916 27.463 27.583 27.653<br />
3.76% 2.07% 2.52% 2.78%<br />
USA 3.763 3.841 3.735 3.759 3.777<br />
2.07% -0.75% -0.11% 0.36%<br />
From Table 43, it is immediately apparent that the abolition <strong>of</strong> MERS subsidy equivalents<br />
implies sharply decreasing exports <strong>of</strong> agriculture and private manufacturing. Exports <strong>of</strong> all<br />
other activities rise, since there relative export price has risen. Particularly impressive is the<br />
rise in public manufacturing, since this is likely the closest sbstitute for private manufacturing.<br />
130<br />
76
Table 44<br />
Exports by Activity and Destination<br />
Variables in Value (Billion 1999 LS)<br />
L0 L8 L9 L10 L11<br />
Exports by activity<br />
Agricult. 31.884 28.300 26.777 27.289 27.502<br />
-11.24% -16.02% -14.41% -13.75%<br />
Mining 111.708 120.403 117.655 118.287 118.680<br />
7.78% 5.32% 5.89% 6.24%<br />
Public 10.109 13.648 11.893 12.117 12.435<br />
manuf. 35.01% 17.64% 19.86% 23.01%<br />
Private 23.337 23.045 21.334 21.571 21.867<br />
manuf. -1.25% -8.58% -7.57% -6.30%<br />
Transp.+ 75.404 84.772 82.140 82.785 83.115<br />
commun. 12.42% 8.93% 9.79% 10.23%<br />
Finance + 12.054 13.495 13.119 13.221 13.263<br />
insurance 11.95% 8.84% 9.68% 10.03%<br />
Social 9.914 11.487 10.990 11.086 11.159<br />
services 15.87% 10.85% 11.83% 12.56%<br />
Govern. 16.222 18.528 17.868 18.021 18.106<br />
services 14.21% 10.15% 11.09% 11.61%<br />
Exports by country <strong>of</strong> destination<br />
ABC 1.109 1.188 1.141 1.152 1.158<br />
7.13% 2.92% 3.86% 4.48%<br />
Arab 60.921 63.524 60.178 60.911 61.423<br />
4.27% -1.22% -0.02% 0.82%<br />
EU15 176.935 193.711 187.478 188.835 189.729<br />
9.48% 5.96% 6.73% 7.23%<br />
Ex-Soc. 5.717 6.116 5.739 5.809 5.869<br />
6.99% 0.38% 1.60% 2.66%<br />
Japan 869 879 840 851 856<br />
1.19% -3.32% -2.10% -1.46%<br />
ROW 14.413 15.073 14.361 14.524 14.630<br />
4.59% -0.36% 0.77% 1.51%<br />
Turkey 26.906 29.173 28.203 28.423 28.561<br />
8.42% 4.82% 5.64% 6.15%<br />
USA 3.763 4.014 3.835 3.874 3.901<br />
6.66% 1.92% 2.94% 3.65%<br />
We can clearly discern the sectoral impact <strong>of</strong> MERS abolition in domestic export prices, cf.<br />
Table 45: Export prices for private manufacturing decrease, and prices for agricultural exports<br />
decrease even more strongly. Export prices for all other activities increase, however. This is<br />
due to the fact that these prices are expressed in terms <strong>of</strong> the consumer basket, which becomes<br />
cheaper with reduced import tariffs.<br />
131<br />
77
Agricult.<br />
Mining<br />
Public<br />
manuf.<br />
Private<br />
manuf.<br />
Transp. +<br />
commun.<br />
Finance +<br />
insurance<br />
Social services<br />
Govern.<br />
services<br />
Table 45<br />
Domestic Prices <strong>of</strong> Exports by Activities<br />
L0 L8 L9 L10 L11<br />
100.00% 96.36% 94.70% 95.02% 95.24%<br />
100.00% 104.50% 102.69% 103.05% 103.28%<br />
100.00% 104.50% 102.69% 103.05% 103.28%<br />
100.00% 99.41% 97.69% 98.02% 98.25%<br />
100.00% 104.50% 102.69% 103.05% 103.28%<br />
100.00% 104.50% 102.69% 103.05% 103.28%<br />
100.00% 104.50% 102.69% 103.05% 103.28%<br />
100.00% 104.50% 102.69% 103.05% 103.28%<br />
Production receives two kinds <strong>of</strong> stimulating effects from the abolition <strong>of</strong> the MERS: First,<br />
intermediate consumption <strong>of</strong> imported goods becomes cheaper, and second, export prices rise<br />
except for agriculture and private manufacturing. Thus the sectoral production increases for<br />
all exporting activities but these two, cf. Table 46 and Table 47. Interestingly, two nonexporting<br />
sectors (trade and utilities) also experience decreases in production, while a third<br />
one (construction) does not. Again we see that public manufacturing expands rather strongly,<br />
apparently at the cost <strong>of</strong> private manufacturing.<br />
132<br />
78
Table 46<br />
Production by Activity<br />
Variables in Volume<br />
L0 L8 L9 L10 L11<br />
Agricult. 303.496 296.812 298.827 298.154 297.800<br />
-2.20% -1.54% -1.76% -1.88%<br />
Mining 149.578 151.841 151.666 151.826 151.797<br />
1.51% 1.40% 1.50% 1.48%<br />
Public 151.686 166.335 157.509 158.730 160.503<br />
manuf. 9.66% 3.84% 4.64% 5.81%<br />
Private 227.234 219.139 220.103 220.169 219.969<br />
manuf. -3.56% -3.14% -3.11% -3.20%<br />
Utilities 35.360 34.281 34.636 34.574 34.619<br />
-3.05% -2.05% -2.22% -2.10%<br />
Construc. 72.890 75.975 73.768 73.710 74.088<br />
4.23% 1.20% 1.13% 1.64%<br />
<strong>Trade</strong> 164.239 162.912 163.829 163.757 163.582<br />
-0.81% -0.25% -0.29% -0.40%<br />
Transp.+ 159.794 163.124 162.826 163.058 163.092<br />
commun. 2.08% 1.90% 2.04% 2.06%<br />
Finance + 37.676 37.702 37.902 37.918 37.879<br />
insurance 0.07% 0.60% 0.64% 0.54%<br />
Social 38.039 39.153 38.793 38.835 38.917<br />
services 2.93% 1.98% 2.09% 2.31%<br />
Govern. 94.651 95.127 95.228 95.253 95.260<br />
services 0.50% 0.61% 0.64% 0.64%<br />
133<br />
79
Table 47<br />
Production by activity<br />
Variables in Value (Billion 1999 LS)<br />
L0 L8 L9 L10 L11<br />
Agricult. 303.496 296.280 296.420 295.456 295.297<br />
-2.38% -2.33% -2.65% -2.70%<br />
Mining 149.578 158.043 155.303 155.969 156.252<br />
5.66% 3.83% 4.27% 4.46%<br />
Public 151.686 166.840 157.824 159.297 160.943<br />
manuf. 9.99% 4.05% 5.02% 6.10%<br />
Private 227.234 218.952 219.600 220.020 219.654<br />
manuf. -3.64% -3.36% -3.17% -3.34%<br />
Utilities 35.360 34.918 34.883 34.888 34.989<br />
-1.25% -1.35% -1.33% -1.05%<br />
Construc. 72.890 77.376 74.291 74.380 74.877<br />
6.15% 1.92% 2.04% 2.73%<br />
<strong>Trade</strong> 159.794 165.904 164.979 165.227 165.309<br />
1.01% 0.45% 0.60% 0.65%<br />
Transp.+ 164.239 168.245 165.537 166.221 166.579<br />
commun. 5.29% 3.59% 4.02% 4.25%<br />
Finance + 37.676 38.733 38.418 38.530 38.560<br />
insurance 2.81% 1.97% 2.27% 2.35%<br />
Social 38.039 40.161 39.275 39.412 39.565<br />
services 5.58% 3.25% 3.61% 4.01%<br />
Govern. 94.651 97.345 96.240 96.481 96.654<br />
services 2.85% 1.68% 1.93% 2.12%<br />
Turning to imports, we basically see the expected stimulating effects <strong>of</strong> tariff reduction, cf.<br />
Table 48. Some special features merit attention, however. Most prominently, we find that<br />
imports <strong>of</strong> (non-mineral) raw materials (SITC2) shrink in volume. This are probably mainly<br />
due to the depressing effects on agriculture, which needs less inputs like seeds and fertilizers.<br />
A similar mechnism may be at work for private manufacturing, although this will be weaker,<br />
since lower raw material demand by private manufacturing will (partially) be <strong>of</strong>fset by higher<br />
demand in public manufacturing). It may also be the case that more domesticcly produced<br />
agricultural raw materials are supplied on the domestic market since domestic export prices <strong>of</strong><br />
these goods have fallen with the abolition <strong>of</strong> the MERS.<br />
Further, we see that imports <strong>of</strong> agricultural products (SITC0+4) decline when the only formal<br />
tariff rates to be lowered are those for non-agricultural imports from the EU. In this case,<br />
agricultural imports become relatively more expensive. Moreover, the above supply effect<br />
tends to make domestic agricultural products cheaper which reinforces the negative effect on<br />
agricultural imports.<br />
134<br />
80
Table 48<br />
Imports by Product and Origin<br />
Variables in Volume<br />
L0 L8 L9 L10 L11<br />
Imports by product group<br />
SITC0+4 41.474 46.274 39.744 41.699 42.798<br />
11.58% -4.17% 0.54% 3.19%<br />
SITC1 537 1.023 794 784 805<br />
90.70% 47.94% 46.18% 50.03%<br />
SITC2 9.138 8.947 8.802 8.750 8.765<br />
-2.09% -3.68% -4.24% -4.08%<br />
SITC3 5.493 6.656 6.226 6.212 6.407<br />
21.16% 13.34% 13.08% 16.63%<br />
SITC5 24.448 25.148 24.614 24.659 24.788<br />
2.87% 0.68% 0.86% 1.39%<br />
SITC6 61.950 64.200 62.282 62.387 62.786<br />
3.63% 0.54% 0.70% 1.35%<br />
SITC7 42.958 47.550 45.529 45.511 45.727<br />
10.69% 5.99% 5.94% 6.45%<br />
SITC8 3.977 4.640 4.250 4.212 4.221<br />
16.67% 6.87% 5.91% 6.13%<br />
Services 102.436 104.547 100.520 101.807 102.386<br />
2.06% -1.87% -0.61% -0.05%<br />
Imports by country <strong>of</strong> origin<br />
ABC 10.669 11.465 10.170 9.838 9.645<br />
7.47% -4.67% -7.78% -9.59%<br />
Arab 24.284 24.527 22.634 22.299 26.797<br />
1.00% -6.79% -8.17% 10.35%<br />
EU15 89.234 95.302 106.219 112.174 109.487<br />
6.80% 19.03% 25.71% 22.70%<br />
Ex-Soc. 49.796 52.097 46.242 45.780 44.710<br />
4.62% -7.14% -8.06% -10.21%<br />
Japan 11.941 12.800 9.991 9.927 9.719<br />
7.20% -16.32% -16.86% -18.60%<br />
ROW 78.612 83.016 71.730 70.718 69.241<br />
5.60% -8.75% -10.04% -11.92%<br />
Turkey 14.528 15.384 13.599 13.329 17.384<br />
5.90% -6.39% -8.25% 19.66%<br />
USA 13.348 14.394 12.177 11.956 11.700<br />
7.84% -8.78% -10.43% -12.35%<br />
135<br />
81
Table 49<br />
Imports by Product and Origin<br />
Variables in Value (Billion 1999 LS)<br />
L0 L8 L9 L10 L11<br />
Imports by product group<br />
SITC0+4 41.474 48.357 40.814 42.970 44.203<br />
16.60% -1.59% 3.61% 6.58%<br />
SITC1 537 1.069 815 808 832<br />
99.28% 51.92% 50.64% 54.96%<br />
SITC2 9.138 9.350 9.039 9.017 9.053<br />
2.32% -1.08% -1.33% -0.93%<br />
SITC3 5.493 6.955 6.393 6.401 6.617<br />
26.62% 16.39% 16.52% 20.46%<br />
SITC5 24.448 26.280 25.276 25.410 25.602<br />
7.49% 3.39% 3.94% 4.72%<br />
SITC6 61.950 67.090 63.959 64.287 64.848<br />
8.30% 3.24% 3.77% 4.68%<br />
SITC7 42.958 49.690 46.754 46.897 47.228<br />
15.67% 8.84% 9.17% 9.94%<br />
SITC8 3.977 4.849 4.365 4.340 4.359<br />
21.92% 9.75% 9.13% 9.62%<br />
Services 102.436 109.252 103.226 104.908 105.749<br />
6.65% 0.77% 2.41% 3.23%<br />
Imports by country <strong>of</strong> origin<br />
ABC 10.669 11.981 10.444 10.138 9.962<br />
12.30% -2.11% -4.97% -6.62%<br />
Arab 24.284 25.630 23.243 22.979 27.677<br />
5.54% -4.29% -5.38% 13.97%<br />
EU15 89.234 99.591 109.078 115.591 113.082<br />
11.61% 22.24% 29.54% 26.73%<br />
Ex-Soc. 49.796 54.442 47.487 47.174 46.178<br />
9.33% -4.64% -5.26% -7.26%<br />
Japan 11.941 13.377 10.260 10.229 10.039<br />
12.03% -14.07% -14.33% -15.93%<br />
ROW 78.612 86.752 73.661 72.872 71.514<br />
10.35% -6.30% -7.30% -9.03%<br />
Turkey 14.528 16.077 13.965 13.735 17.954<br />
10.66% -3.87% -5.45% 23.59%<br />
USA 13.348 15.042 12.504 12.320 12.084<br />
12.69% -6.32% -7.71% -9.47%<br />
Finally, note that the volume <strong>of</strong> imports increases less when the MERS is abolished than<br />
when it is not, cf. Table 50. This is again due to the reduction in export subsidies. If, for<br />
instance, we compare scenarios L7 and L8 (which are identical except for the abolition <strong>of</strong> the<br />
MERS), we find that the volume <strong>of</strong> imports increases with the abolition <strong>of</strong> the MERS except<br />
for product groups SITC0+4 (food and live animals), SITC2 (non-mineral raw materials), and<br />
SITC8 (various manufactures). <strong>The</strong>se groups correspond precisely to the activities (or their<br />
inputs) whose subsidies have been reduced. In fact, imports for these activities are rather<br />
large, so that the volume <strong>of</strong> aggregate imports actually decreases despite <strong>of</strong> growing imports<br />
in all other product groups.<br />
136<br />
82
Table 50<br />
Effects <strong>of</strong> <strong>Trade</strong> <strong>Liberalization</strong> on Main Aggregates,<br />
Variables in Volume<br />
L0 L8 L9 L10 L11<br />
GDPF 781 780 781 781 781<br />
-0.04% -0.03% -0.04% -0.03%<br />
GDPM 821 823 822 822 822<br />
0.17% 0.11% 0.06% 0.09%<br />
CPRIV 576 588 580 581 582<br />
2,17% 0,64% 0,80% 1,02%<br />
CPUB 93 90 90 90 90<br />
-3,44% -3,67% -3,39% -3,34%<br />
INVEST 154 153 152 152 152<br />
-0,62% -1,43% -1,25% -1,14%<br />
Imports 292 309 293 296 299<br />
5,67% 0,12% 1,23% 2,14%<br />
Exports 291 300 294 295 296<br />
3,28% 1,11% 1,63% 1,98%<br />
<strong>Trade</strong> -1.777 -8.816 1.104 -641 -2.287<br />
Balance 396% -162% -63.9% 28.7%<br />
In other respects, Table 50 just reflects earlier results. GDP at factor costs and at market<br />
prices is almost constant and private consumption expands. However, the expansion is less<br />
pronounced than in the earlier scenarios without MERS abolition. Also, public consumption<br />
and investment shrink – an effect which will become clear when looking at government<br />
finances. Imports and exports rise in a more balanced way than without MERS abolition, so<br />
that the deficit in the trade balance is less dramatic. In fact, scenarios L9 and L10 even result<br />
in an improved trade balance.<br />
137<br />
83
Table 51<br />
Effects <strong>of</strong> <strong>Trade</strong> <strong>Liberalization</strong> on Main Aggregates,<br />
Variables in Value (Billion 1999 LS)<br />
L0 L8 L9 L10 L11<br />
GDPF 781 799 787 788 790<br />
1.56% -0.01% 0.18% 0.41%<br />
GDPM 821 824 823 823 823<br />
5.60% 5.44% 5.46% 5.46%<br />
CPRIV 576 588 580 581 582<br />
2,17% 0,64% 0,80% 1,02%<br />
CPUB 93 92 91 91 91<br />
-1,89% -2,98% -2,56% -2,39%<br />
INVEST 154 154 152 152 153<br />
-0,42% -1,54% -1,15% -0,94%<br />
Imports 292 323 301 305 308<br />
10,42% 2,82% 4,32% 5,50%<br />
Exports 291 314 302 304 306<br />
7,93% 3,83% 4,73% 5,33%<br />
<strong>Trade</strong> -1.777 -9.213 1.133 -661 -2.362<br />
Balance 418% -164% -63.8% 32.9%<br />
As for the effects <strong>of</strong> trade liberalization on the government budget and on capital<br />
accumulation, observe that the loss <strong>of</strong> tax revenue is similar to the respective scenarios<br />
without MERS abolition. What is different is the trade balance: Syria imports less capital<br />
since the trade deficit is much smaller. Hence capital market supply is smaller than without<br />
MERS abolition and thus the government borrows less funds at the capital market. Since<br />
government consumption and development expenditures (government investment) depend on<br />
total government revenue, these components <strong>of</strong> aggregate demand do also decrease.<br />
138<br />
84
Table 52<br />
Effects <strong>of</strong> <strong>Trade</strong> <strong>Liberalization</strong> on Government Budget and Capital Accumulation,<br />
Variables in Value (Billion 1999 LS)<br />
L0 L8 L9 L10 L11<br />
Tariff 16.090 0 10.538 9.342 7.713<br />
revenue -100.00% -34.51% -41.94% -52.06%<br />
Domest. 30.622 31.094 31.229 31.185 31.138<br />
ind. tax 1.54% 1.98% 1.84% 1.69%<br />
Total 46.712 31.094 31.229 31.185 31.138<br />
ind. taxes 1.54% 1.98% 1.84% 1.69%<br />
Direct 54.205 55.880 54.935 55.071 55.204<br />
taxes 3.09% 1.35% 1.60% 1.84%<br />
All taxes 100.917 86.974 96.702 95.598 94.056<br />
-13.82% -4.18% -5.27% -6.80%<br />
Govern. 100.501 108.390 96.814 98.748 100.579<br />
deficit 7.85% -3.67% -1.74% 0.08%<br />
Househ. 40.049 41.229 40.400 40.498 40.620<br />
savings 2.95% 0.88% 1.12% 1.42%<br />
Current -4.371 12.738 1.988 3.807 5.548<br />
account 191.39% -54.53% -12.91% 26.91%<br />
Factor prices are shown in Table 53. As before, trade liberalization increases factor<br />
compensation on the same line <strong>of</strong> reasoning as exposed for the scenarios without MERS<br />
abolition.<br />
139<br />
85
Table 53<br />
Compensation <strong>of</strong> Production Factors<br />
L0 L8 L9 L10 L11<br />
Wage rate 100.00% 102.29% 100.41% 100.59% 100.89%<br />
Agricult.<br />
Mining<br />
Public<br />
manufact.<br />
Private<br />
manufact.<br />
Utilities<br />
Construc.<br />
<strong>Trade</strong><br />
Transp. +<br />
commun.<br />
Finance +<br />
insurance<br />
Social services<br />
Govern.<br />
services<br />
gross return to capital<br />
15.61% 16.33% 16.22% 16.09% 15.99%<br />
166.3% 184.42% 189.64% 195.71% 202.41%<br />
14.79% 18.67% 19.32% 20.14% 21.19%<br />
8.10% 8.40% 8.28% 8.19% 8.12%<br />
4.77% 5.12% 5.11% 5.10% 5.10%<br />
2.21% 2.69% 2.75% 2.81% 2.90%<br />
18.52% 20.00% 20.22% 20.47% 20.77%<br />
15.98% 17.86% 18.37% 18.96% 19.62%<br />
18.49% 19.93% 20.28% 20.69% 21.15%<br />
18.51% 21.51% 22.14% 22.86% 23.70%<br />
18.51% 20.41% 20.77% 21.19% 21.68%<br />
Price indices <strong>of</strong> domestically produced goods are given in Table 54. Again, these effects are<br />
qualitatively similar for factor costs and for market prices. No clear-cut picture emerges, since<br />
reduction <strong>of</strong> formal tariffs plus MERS abolition is a complex shock to the system <strong>of</strong> sectoral<br />
prices with the effects <strong>of</strong> tariffs, tariff equivalents, subsidy equivalents and export tax<br />
equivalence working with varying strength partially in the same, partially in opposite<br />
directions. A similar comment applies to domestic import prices shown in Table 55.<br />
140<br />
86
Table 54<br />
Prices <strong>of</strong> Domestically Produced Products<br />
L0 L8 L9 L10 L11<br />
by factor costs<br />
SITC0+4 100.00% 100.30% 99.81% 99.65% 99.70%<br />
SITC1 100.00% 96.36% 98.54% 98.52% 98.23%<br />
SITC2 100.00% 99.67% 99.70% 99.83% 99.71%<br />
SITC3 100.00% 102.87% 101.54% 101.80% 101.91%<br />
SITC5 100.00% 99.24% 99.13% 99.45% 98.94%<br />
SITC6 100.00% 97.10% 99.78% 100.10% 99.67%<br />
SITC7 100.00% 91.88% 95.73% 95.98% 95.73%<br />
SITC8 100.00% 98.00% 99.40% 99.45% 99.30%<br />
Services 100.00% 101.86% 100.71% 100.91% 101.07%<br />
by market prices<br />
SITC0+4 100.00% 99.96% 99.95% 99.65% 99.62%<br />
SITC1 100.00% 95.37% 98.02% 98.03% 97.70%<br />
SITC2 100.00% 99.83% 99.87% 100.04% 99.93%<br />
SITC3 100.00% 102.58% 101.35% 101.62% 101.68%<br />
SITC5 100.00% 99.12% 99.08% 99.41% 98.87%<br />
SITC6 100.00% 96.75% 99.72% 100.06% 99.58%<br />
SITC7 100.00% 89.97% 94.70% 95.03% 94.74%<br />
SITC8 100.00% 97.66% 99.25% 99.33% 99.19%<br />
Services 100.00% 101.75% 100.77% 100.91% 101.05%<br />
Table 55<br />
Domestic Prices <strong>of</strong> Imports by Product Groups<br />
L0 L8 L9 L10 L11<br />
SITC0+4 100.00% 97.60% 101.06% 99.67% 99.05%<br />
SITC1 100.00% 82.29% 90.15% 90.46% 89.66%<br />
SITC2 100.00% 100.54% 100.63% 100.97% 100.89%<br />
SITC3 100.00% 97.98% 98.26% 98.60% 97.95%<br />
SITC5 100.00% 98.89% 98.98% 99.32% 98.75%<br />
SITC6 100.00% 96.58% 99.69% 100.04% 99.54%<br />
SITC7 100.00% 89.90% 94.66% 94.99% 94.70%<br />
SITC8 100.00% 94.63% 97.88% 98.22% 98.10%<br />
Services 100.00% 101.19% 101.04% 100.91% 100.94%<br />
141<br />
87
Part II<br />
What fiscal budget modification can be performed to overcome the loss <strong>of</strong> tariff<br />
revenues?<br />
This chapter discusses possible fiscal responses to the challenge <strong>of</strong> reduced import tariff<br />
revenues along with suggested reform measures in the design <strong>of</strong> direct and indirect taxes.<br />
Also, a critical review <strong>of</strong> certain expenditure blocks is proposed in order to cut government<br />
outlays and relieve budgetary pressure. <strong>The</strong> conclusions on policy measures formulated in the<br />
sequel refer to the economic and budgetary situation <strong>of</strong> the Syrian Arab Republic in<br />
November 2000, and relate to information obtained from high-ranking government <strong>of</strong>ficials at<br />
the occasion <strong>of</strong> a five-day visit to Damascus in this month. I have to warn that the information<br />
may be outdated at the time <strong>of</strong> reading, since it seemed one <strong>of</strong> the intentions <strong>of</strong> the new<br />
president to promote economic reform. In particular, legislative initiatives aiming at a<br />
unification <strong>of</strong> exchange rates, simplification <strong>of</strong> the tariff structure, elimination <strong>of</strong> price<br />
controls and abolition <strong>of</strong> the PSF were under discussion but had not yet been approved in<br />
November 2000. If such measures were adopted by the Syrian government, they would come<br />
close to some <strong>of</strong> the budgetary strategies discussed below. <strong>The</strong>refore, an informed reader<br />
might find parts <strong>of</strong> the following discussion obsolete at the time <strong>of</strong> reading.<br />
Simulation results obtained from the formal model <strong>of</strong> the Syrian economy suggest that the<br />
most natural fiscal response to lost tariff revenues would be an increase in indirect taxation.<br />
This increase should be levied on consumption goods, since these benefit much more than<br />
capital goods or raw materials from reduced import tariffs. In fact, any increase in indirect<br />
taxes on industrial supplies might have adverse effects on domestic production, so that the net<br />
effect <strong>of</strong> trade liberalization plus compensating fiscal measures on Syria’s GDP might be<br />
negative if a substantial share <strong>of</strong> the additional indirect tax load were borne by the industry.<br />
As far as the consumer’s point <strong>of</strong> view is concerned, it is important to underline that higher<br />
indirect taxation <strong>of</strong> consumption goods does not seem to raise major problems regarding a<br />
politically and socially acceptable distribution <strong>of</strong> the tax burden, since the increase in tax rates<br />
can be designed such that it approximately <strong>of</strong>fsets the gain in purchasing power due to lower<br />
import tariffs. <strong>The</strong> major effect <strong>of</strong> an indirect tax hike is hence a market price increase for<br />
domestically produced consumption goods relative to imported substitutes. Domestic<br />
producers might therefore encounter reduced domestic demand for their products. Thus,<br />
unless the Syrian consumption goods industries could increase their exports, domestic<br />
production in these industries would fall. Given the almost constant volume <strong>of</strong> GDP at factor<br />
cost under various scenarios <strong>of</strong> trade liberalization, this implies that the government response<br />
to reduced tariff revenues might eventually induce a reduction <strong>of</strong> GDP. It might therefore be<br />
advisable to combine the increase in indirect taxes with stimulating measures in the design <strong>of</strong><br />
direct taxation.<br />
This last remark raises the difficult issue <strong>of</strong> a general reform <strong>of</strong> the Syrian tax system – an<br />
issue which by far exceeds the prospects and problems <strong>of</strong> trade liberalization. However, given<br />
the present state <strong>of</strong> the Syrian tax system it is not completely unlikely that a mandatory<br />
redesign <strong>of</strong> foreign trade taxes under an Association Agreement also initiates a redesign <strong>of</strong> the<br />
whole tax system, which has a reputation <strong>of</strong> being inefficient, see Corm, 1997a. I will<br />
therefore comment on some features <strong>of</strong> the Syrian tax system which should be considered by<br />
tax reform strategists. I will subsequently discuss some budgetary measures which are likely<br />
to increase economic efficiency. Finally, I will point out some rather primitive steps that<br />
142<br />
88
could be taken in order to compensate for reduced tariff revenues if the Syrian government<br />
were unwilling to initiate major changes in its current budgetary policies.<br />
Indirect taxation in Syria is achieved by a great number <strong>of</strong> different taxes. <strong>The</strong> precise number<br />
<strong>of</strong> indirect taxes remains unclear, as the nature <strong>of</strong> some taxes (i. e. direct versus indirect) is<br />
difficult to determine. <strong>The</strong> Syrian authorities list 22 indirect taxes in their account <strong>of</strong> revenues<br />
in the 1999 „consolidated“ budget (i. e. excluding PSF resources). This number, however, is<br />
probably too small. Corm, 1997a, argues that a more conventional classification would lead to<br />
32 different taxes being classified as „indirect“. This number would have to be increased by<br />
seven surcharges and the indirect taxes attributable to the Price Stabilization Fund.<br />
Whatever the correct number <strong>of</strong> indirect taxes may be, many <strong>of</strong> these are very weak in terms<br />
<strong>of</strong> volume. <strong>The</strong> administrative cost <strong>of</strong> tax collection may hence be larger than actual revenue<br />
for a substantial number <strong>of</strong> taxes, so that their removal would actually benefit the government<br />
sector and increase allocative efficiency <strong>of</strong> resources due to reduced deadweight losses.<br />
Among the top candidates for taxes to be eliminated on grounds <strong>of</strong> insufficient tax revenue<br />
are, e. g., the duties on television sets, arms‘ permits duties, irrigation fees, various excises,<br />
for instance on fuels, sugar, salt, hunting, mines and quarries, taxes on entertainments, taxes<br />
on agricultural production, and fees on the notary public.<br />
Besides mere abolition <strong>of</strong> inefficient indirect taxes, a restructuring <strong>of</strong> the main domestic taxes<br />
seems recommendable. Currently, much <strong>of</strong> the indirect tax revenue on domestic production is<br />
levied in terms <strong>of</strong> excises, mostly on goods from government protected monopolies. This<br />
induces two important and distortive asymmetries: First, selected goods bear a certain tax<br />
burden which other goods do not. Second, the government sector carries most <strong>of</strong> the indirect<br />
tax burden, while the private sector pays only very few indirect taxes. While a certain<br />
legitimation for this sort <strong>of</strong> indirect taxation may consist <strong>of</strong> arguing that the indirect tax load<br />
is paid from monopoly rents and therefore tends to correct for monopoly-induced allocative<br />
failures, the first best solution to handle negative effects <strong>of</strong> monopolized markets would still<br />
embody an increased degree <strong>of</strong> competition on these markets and not asymmetric indirect<br />
taxation.<br />
It seems thus recommendable to develop the system <strong>of</strong> excises and related indirect taxes into a<br />
general ad-valorem tax on domestic transactions. In a first step, paying tribute to capacity<br />
restrictions in the tax collecting administration, the introduction <strong>of</strong> a general sales tax seems<br />
advisable. This general sales tax should exempt raw materials and semi-finished goods,<br />
however, so that the tax design includes features similar to a value added tax. In addition, it<br />
might be useful to specify lower tax rates for capital goods than for consumption goods, since<br />
this would make it possible to implement proper compensating measures for the reduction in<br />
import tariffs and would simultaneously support the growth enhancing provisions <strong>of</strong><br />
Investment Law No. 10. Clearly, in a second step, the general sales tax should be developed<br />
into a full value added tax when sufficiently qualified staff and capacity is available in the<br />
government administration.<br />
Direct tax revenues are predominantly business taxes and taxes on labor income, where the<br />
revenue <strong>of</strong> the former is far larger than the revenue <strong>of</strong> the latter. Here again, the public sector<br />
contributes to total tax revenues to a much larger extent than the private sector. Three reasons<br />
for the weak private sector contribution are suggested by Syrian government <strong>of</strong>ficials: First,<br />
incomes from the agricultural sector are not taxed, second, various exemptions to business<br />
pr<strong>of</strong>its are granted under Investment Law No. 10, and third, many private entrepreneurs and<br />
143<br />
89
self-employed are suspected to incorrectly declare their income as so low as to be exempted<br />
from tax or not to declare entrepreneurial income at all.<br />
It is therefore <strong>of</strong> prime concern to broaden the tax base. <strong>The</strong> subsidy <strong>of</strong> agricultural activities<br />
implicit in the exemption <strong>of</strong> agricultural income from direct taxes may be difficult to abolish,<br />
both on political and social reasons. Moreover, the fact that agricultural income is also tax<br />
free in e. g. neighboring <strong>Jordan</strong> may strengthen resistance against efforts to levy income taxes<br />
on this large and economically significant sector. We therefore suggest to use a stepwise<br />
approach which consists <strong>of</strong> tax reform measures that make agricultural incomes taxable in<br />
principle but keep it effectively without a significant tax burden. Specifically, the introduction<br />
<strong>of</strong> a negative income tax in the sense <strong>of</strong> Friedman might serve this purpose well: It could be<br />
tuned such that today’s average agricultural income is tax free, with lower than average<br />
incomes receiving small subsidies and higher than average incomes paying rather low taxes.<br />
As this measure would change the status quo only slightly, it will probably not meet more<br />
than a manageable degree <strong>of</strong> opposition. However, two important goals would be achieved:<br />
First, the government would emphasize that in principle any kind <strong>of</strong> income is subject to<br />
taxes, and second, assuming normal economic growth in the years ahead, agricultural incomes<br />
would rise and therefore induce a slowly rising tax contribution <strong>of</strong> the agricultural sector.<br />
We do not propose to tackle the second important cause <strong>of</strong> weak private sector tax<br />
contributions, the tax exemptions for the returns on investment projects under Investment Law<br />
No. 10. <strong>The</strong> relative success <strong>of</strong> this law, visible in the strong growth <strong>of</strong> private sector activity<br />
in the last ten years suggests that the stimulating effects <strong>of</strong> Investment Law No. 10 broaden<br />
the tax base so much that this effect outweighs the lost tax revenue from the granted<br />
exemptions. In fact, a continuation and reinforcement <strong>of</strong> Law No. 10 may be called for. In<br />
particular, remaining restrictions on investment activities should be lifted, for example the<br />
requirement that companies benefiting from the law must be partially owned by Syrian<br />
citizens. Also, investors should be allowed to purchase rather than rent land and to freely<br />
convert local currency into foreign exchange at the relevant black market rates. Clearly, this<br />
would imply that the 25 percent surrender requirement for non-agricultural export earnings<br />
would be lifted for projects benefiting from Investment Law No. 10.<br />
Finally, incorrect tax declarations can be fought not only by tighter controls and punishments<br />
but also by reduced average and marginal tax rates. Currently, marginal tax rates may be as<br />
high as 65 percent, providing strong incentives for tax evasion. (By comparison, marginal tax<br />
rates in <strong>Jordan</strong> are 30 percent for personal incomes and at most 35 percent for corporate<br />
incomes). Further, the unification <strong>of</strong> the various individual income taxes currently in<br />
existence is also likely to reduce loopholes for citizens seeking to minimize their tax burden.<br />
To sum up, a reduction in foreign trade taxes could be compensated by an increase in indirect<br />
taxation in particular on consumption goods. <strong>The</strong> introduction <strong>of</strong> a general sales tax with<br />
different tax rates applied to raw and semi-finished materials, capital, and consumption goods<br />
should be considered. Such a reform <strong>of</strong> the indirect taxation system would replace the current<br />
system <strong>of</strong> specific excises which relies on an extremely narrow tax base and hardly reaches<br />
the private sector. As tax reform measures are equally suggestive for the current system <strong>of</strong><br />
direct taxes, we propose to unify income taxation by the introduction <strong>of</strong> a negative income tax<br />
whose design at the time <strong>of</strong> introduction is tuned so as to approximately match the effective<br />
current tax load <strong>of</strong> the lower income groups <strong>of</strong> the Syrian society.<br />
While tax reform measures are suggestive, they are by far not the only possible means <strong>of</strong><br />
compensation for reduced tariff revenues. Alternatively (or supplementary), the government<br />
144<br />
90
might contemplate a reduction <strong>of</strong> government expenditures. For instance, the staff in the<br />
government exceeds 800,000 people (almost 20 percent <strong>of</strong> the work force) and it has a<br />
reputation <strong>of</strong> being very unproductive. We therefore suggest to reduce public employees to an<br />
undeniably necessary number, while simultaneously raising their wages to a level which is<br />
competitive with private sector earnings. Despite the wage increase, this measure would<br />
probably result in a significant reduction <strong>of</strong> labor cost.<br />
In addition, a review <strong>of</strong> other expenditure components may be warranted. Little is known<br />
about the structure and effectiveness <strong>of</strong> public investments, but it is quite conceivable that<br />
higher controling and monitoring efforts would save considerable resources. Further, a more<br />
or less gradual reduction <strong>of</strong> food subsidies should be considered, in particular if support for<br />
the poorest part <strong>of</strong> the population could be ensured by the introduction <strong>of</strong> a negative income<br />
tax, see above. Similarly, the implicit fuel oil subsidy induced by selling fuel at prices lower<br />
than the world market price, could gradually be eliminated. Government procurement prices<br />
for cotton and wheat could also be reviewed for the possibility <strong>of</strong> a stepwise realignment with<br />
world market prices.<br />
So far, the Syrian government has not encouraged any discussion <strong>of</strong> public enterprise<br />
privatization. However, it is difficult to see convincing evidence for large-scale productive<br />
activities <strong>of</strong> the state under a government policy which cautiously moves towards a market<br />
economy. Since under these conditions privatization will be an issue sooner or later, it is<br />
suggestive to discuss this in the context <strong>of</strong> necessary adjustments under the Association<br />
Agreement. Clearly, the extra revenue from privatization <strong>of</strong> public enterprises could be quite<br />
helpful if the government feels that budgetary pressures due to reduced import tariffs are<br />
particularly tight in a transition period <strong>of</strong> a couple <strong>of</strong> years. However, an equally appealing<br />
way <strong>of</strong> handling the privatization revenue would consist in a reduction <strong>of</strong> the considerable<br />
amount <strong>of</strong> government debt, such that future debt service obligations could be significantly<br />
reduced. Such a reduction in interest and debt repayment would be particularly attractive if it<br />
were true that Syrian oil reserves will be depleted in the not too far future, thereby causing the<br />
loss <strong>of</strong> large oil-related revenues in the government budget.<br />
<strong>The</strong> strong dependence <strong>of</strong> government revenues on oil-related proceeds is highly problematic<br />
in the light <strong>of</strong> very limited proven oil reserves. As pointed out earlier in this report, some<br />
estimates suggest that oil reserves may not last longer than approximately ten more years.<br />
This prospect constitutes a fiscal challenge whose importance far outweighs the problems<br />
caused by reduced import tariff revenues, although the latter may certainly reinforce the<br />
former to a certain extent, in particular if there is further delay in signing and ratifying the<br />
Association Agreement. As such it seems sensible to suggest that the Syrian Ministry <strong>of</strong><br />
Finance should make use <strong>of</strong> oil-related proceeds in a way consistent with their possibly<br />
transitory nature: This kind <strong>of</strong> revenue should be earmarked for pr<strong>of</strong>itable government<br />
investment projects, the proceeds <strong>of</strong> which could, in later years, partially compensate for<br />
lower oil-related government receipts. By contrast, budget projections over the next ten years<br />
should be designed such that current government expenditures could be financed from non-oil<br />
sources only at the time <strong>of</strong> likely depletion <strong>of</strong> oil reserves.<br />
Finally, besides the complex and politically possibly hazardous issues <strong>of</strong> tax reform and<br />
expenditure realignment a seemingly easy way <strong>of</strong> fiscal compensation for reduced import<br />
tariff revenues should be mentioned: <strong>The</strong> facilitation <strong>of</strong> import procedures along with a<br />
simplification <strong>of</strong> the tariff structure and improved information on foreign trade regulations. In<br />
the course <strong>of</strong> this research we have experienced many, but certainly not all <strong>of</strong> the difficulties a<br />
European exporter <strong>of</strong> goods to Syria is likely to encounter. To illustrate these, consider first <strong>of</strong><br />
145<br />
91
all the issue <strong>of</strong> information and imagine to be German exporter who would like to find out<br />
about import regulations in Syria:<br />
<strong>The</strong>re is, to our knowledge, no internet site which would provide any information on<br />
applicable tariff and exchange rates, let alone supplementary regulations. Neither the Syrian<br />
embassy nor consular representations in Germany are able to communicate tariff information,<br />
nor is the German embassy in Damascus. Phone calls to the Syrian customs department (by a<br />
person fluent in Arabic) do not yield the desired result; it is difficult to get through in the first<br />
place and if successful one is handed from one <strong>of</strong>ficial to the other without finding the person<br />
who would know. Similar experiences are made with phone calls to the Syrian Ministry <strong>of</strong><br />
Economics and Foreign <strong>Trade</strong>. Written requests to both institutions are not answered. <strong>The</strong><br />
German Ministry <strong>of</strong> Economics sustains an Information Center for Foreign <strong>Trade</strong><br />
(Bundesstelle fürAußenhandelsinformation) which does have the full tariff schedule – alas<br />
without the applicable customs exchange rates. <strong>The</strong> information center is, in fact, not even<br />
aware that different customs exchange rates apply. Thus, information on the tariff rates alone<br />
is at best misleading and next to worthless. A German-Syrian Chamber <strong>of</strong> Commerce does not<br />
exist. Information on the Damascus Chamber <strong>of</strong> Commerce and the Syrian Consulting Bureau<br />
for Development and Investment (SCB) found in the internet provide outdated email adresses<br />
so that electronic requests bounce back. GHORFA, the Arabic-German Association for <strong>Trade</strong><br />
and Industry does not have any tariff information either. While very cooperative, this<br />
Association capitulates after three months <strong>of</strong> fruitless efforts to obtain the relevant<br />
information from Syrian authorities. Neither the IMF, nor the World Bank, the United<br />
Nations, the World <strong>Trade</strong> Organisation (WTO) or various trade centers have more than just<br />
the most general information on Syrian import tariffs. <strong>The</strong> last Syrian <strong>of</strong>ficial publication<br />
which collects foreign trade information (if one is able to get hold <strong>of</strong> it), dates back from<br />
1995, so that many recent changes are not included.<br />
By contrast, the same exporter might contemplate exporting his goods to <strong>Jordan</strong>. In this case,<br />
the complete tariff information (in the Harmonized System (HS) classification) is just a few<br />
mouseclicks away and links to the correct URL are found at many places in the internet. It<br />
thus seems fair to say that insufficient information is probably a major impediment to Syrian<br />
trade, and as little effort as an up-to-date internet site with the relevant regulations could<br />
easily increase the volume <strong>of</strong> Syrian imports and hence import tariff revenues.<br />
Second, a (revenue neutral) simplification <strong>of</strong> the tariff structure might also encourage imports<br />
and raise import tariff revenues. Currently, an importer must pay attention to nominal tariff<br />
rates, the relevant customs exchange rate, the surcharge labelled „unified tax on imports“, the<br />
statistics fees and the license fees. In addition, he needs to know the precise classification <strong>of</strong><br />
his products according to the outdated CCCN nomenclature and possibly further<br />
disaggregated by the products‘ nature and intended usage. In particular, traders unfamiliar<br />
with Syrian foreign trade taxation might find this system confusing and be deterred from the<br />
Syrian market. Consequently, unifying all charges in a single import tariff rate and classifying<br />
according to the widely used HS nomenclature might also encourage trade and raise import<br />
tariff revenues.<br />
Finally, bureaucratic regulations could be reduced and facilitated. Currently, importing into<br />
Syria requires a lot <strong>of</strong> time and patience. Licenses have to be obtained, quality standards<br />
respected, residence has to be proved, availability <strong>of</strong> foreign exchange and its proper origin<br />
must be documented, rules <strong>of</strong> origin certified, and the authorities must be convinced that the<br />
importer complies to the Arab League boycott <strong>of</strong> Israel. Further complicated documentation is<br />
required if the importer wants to benefit from exemptions, reduced rates or regulations <strong>of</strong><br />
146<br />
92
Investment Law No. 10. Last but not least, corruption in the customs department or elsewhere<br />
in the administration must be dealt with. In short, any attempt by the Syrian government to<br />
facilitate the bureaucratic requirements can only have trade-enhancing effects.<br />
Summing up, various measures at the administrative level are possible that would likely<br />
stimulate foreign trade even if the effective tariff rates remained unaltered. Given the large<br />
and purely administrative impediments to trade currently existing, it is not unlikely that the<br />
inevitable loss <strong>of</strong> tariff revenues under an Association Agreement with the European Union<br />
could be made up for by removing these non-tariff barriers to trade. As pointed out in the<br />
discussion <strong>of</strong> the economic effects <strong>of</strong> trade liberalization, the removal <strong>of</strong> non-tariff barriers is<br />
likely to have stimulating effects on domestic production, as this kind <strong>of</strong> reform, unlike<br />
reduced import tariffs, also induces a significant benefit to the Syrian industry. This is not to<br />
say that the issues <strong>of</strong> tax reform and critical inspection <strong>of</strong> expenditure policies should be<br />
discarded. But it seems that these important measures <strong>of</strong> economic reform could be<br />
approached independent <strong>of</strong> budgetary pressures to increase government revenues, if the<br />
administration were willing to discontinue an effectively import-deterring regime <strong>of</strong> foreign<br />
trade regulations.<br />
147<br />
93
References:<br />
Alkazaz, Aziz, 1997: „Staatliche finanzwirtschaft und Budgetpolitik in den arabischen<br />
Ländern: Syrien als Fallstudie für die mittlere Einkommensgruppe“, Orient 38 (4), p. 653-<br />
676.<br />
Augier, Patricia and Michael Gasiorek, 2000: „<strong>Trade</strong> Liberalisation Between the Southern<br />
Mediterranean and the EU: An Analysis <strong>of</strong> the Sectoral <strong>Impact</strong>“. FEMISE Conference Paper,<br />
Marseille.<br />
Central Bureau <strong>of</strong> Statistics, 1999. Foreign <strong>Trade</strong> Statistics. Syrian Arab Republic, Office <strong>of</strong><br />
the Prime Minister.<br />
Central Bureau <strong>of</strong> Statistics, 2000. Statistical Abstract. Syrian Arab Republic, Office <strong>of</strong> the<br />
Prime Minister.<br />
Corm, C. G., 1997a: „Etude de Modernisation du Ministère des Finances de la République<br />
Arabe Syrienne“, Rapport d’Ensemble, Commission Européenne.<br />
Corm, C. G., 1997b: „Etude des Besoins du Ministère des Finances en Syrie“, Rapport de Pré-<br />
Diagnostic, Commission Européenne.<br />
Department <strong>of</strong> Statistics, 1990. „1987 Input-Output Tables for <strong>Jordan</strong>“, UNDP/DTCD Project<br />
JOR/87/006, Amman.<br />
Hosoe, N., 1998. „A General Equilibrium Analysis <strong>of</strong> <strong>Jordan</strong>’s <strong>Trade</strong> <strong>Liberalization</strong>“,<br />
Discussion Paper, Osaka University.<br />
International Monetary Fund, 1999a. Syrian Arab Republic – Staff Report for the 1999 Article<br />
IV Consultation, SM/99/137, Washington D. C.<br />
International Monetary Fund, 1999b. Syrian Arab Republic – Statistical Appendix,<br />
SM/99/140, Washington D. C.<br />
MEDA-Team, 2000. „Report on Syria’s International <strong>Trade</strong>“, Technical Assistance Unit to<br />
the Delegation <strong>of</strong> the European Commission, Damascus.<br />
Ministry <strong>of</strong> Finance, 1989. Decret No. 25, Tableau des Tarifs des Douanes, Syrian Arab<br />
Republic, Damaskus.<br />
Royal Dutch Embassy, undated. „<strong>Trade</strong> Barriers and Constraints to Access Resulting from<br />
Syrian Commercial Policy“, Damaskus.<br />
Syrian Arab Republic, 1980. Loi No.1 du 20.1.1980, Relative à l’Institution de la Taxe<br />
Unique sur les Importations, Damaskus.<br />
U.S. Department <strong>of</strong> State, 2000. <strong>Fiscal</strong> Year 2000 Country Commercial Guide: Syria,<br />
Washington D. C.<br />
148<br />
94
U.S. Department <strong>of</strong> State, 1996. Country Reports on Economic Policy and <strong>Trade</strong> Practices:<br />
Syria, Http://www.state.gov/www/issues/economic/trade_reports/neareast96/syria96.html<br />
(18 April 2000)<br />
U.S. Energy Information Administration, 2000. „Syria“. March 2000.<br />
Http://www.eia.doe.gov/emeu/cabs/syria.html (29 August 2000).<br />
149<br />
95