Eastern Middle School - Forest Hills Public Schools
Eastern Middle School - Forest Hills Public Schools
Eastern Middle School - Forest Hills Public Schools
You also want an ePaper? Increase the reach of your titles
YUMPU automatically turns print PDFs into web optimized ePapers that Google loves.
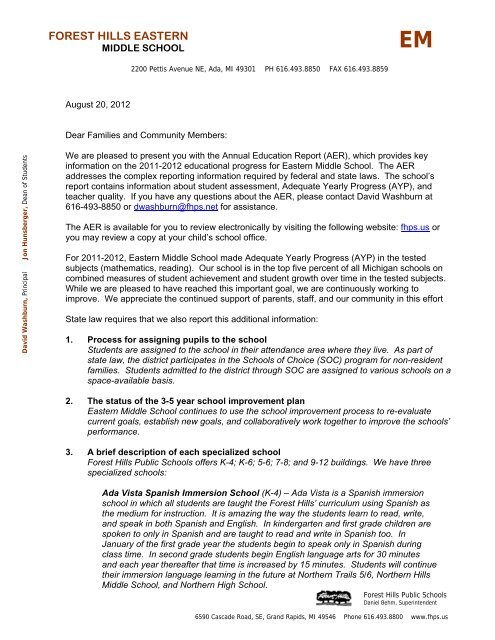
David Washburn, Principal Jon Hunsberger, Dean of Students<br />
FOREST HILLS EASTERN<br />
MIDDLE SCHOOL<br />
August 20, 2012<br />
2200 Pettis Avenue NE, Ada, MI 49301 PH 616.493.8850 FAX 616.493.8859<br />
Dear Families and Community Members:<br />
We are pleased to present you with the Annual Education Report (AER), which provides key<br />
information on the 2011-2012 educational progress for <strong>Eastern</strong> <strong>Middle</strong> <strong>School</strong>. The AER<br />
addresses the complex reporting information required by federal and state laws. The school’s<br />
report contains information about student assessment, Adequate Yearly Progress (AYP), and<br />
teacher quality. If you have any questions about the AER, please contact David Washburn at<br />
616-493-8850 or dwashburn@fhps.net for assistance.<br />
The AER is available for you to review electronically by visiting the following website: fhps.us or<br />
you may review a copy at your child’s school office.<br />
For 2011-2012, <strong>Eastern</strong> <strong>Middle</strong> <strong>School</strong> made Adequate Yearly Progress (AYP) in the tested<br />
subjects (mathematics, reading). Our school is in the top five percent of all Michigan schools on<br />
combined measures of student achievement and student growth over time in the tested subjects.<br />
While we are pleased to have reached this important goal, we are continuously working to<br />
improve. We appreciate the continued support of parents, staff, and our community in this effort<br />
State law requires that we also report this additional information:<br />
EM<br />
1. Process for assigning pupils to the school<br />
Students are assigned to the school in their attendance area where they live. As part of<br />
state law, the district participates in the <strong>School</strong>s of Choice (SOC) program for non-resident<br />
families. Students admitted to the district through SOC are assigned to various schools on a<br />
space-available basis.<br />
2. The status of the 3-5 year school improvement plan<br />
<strong>Eastern</strong> <strong>Middle</strong> <strong>School</strong> continues to use the school improvement process to re-evaluate<br />
current goals, establish new goals, and collaboratively work together to improve the schools’<br />
performance.<br />
3. A brief description of each specialized school<br />
<strong>Forest</strong> <strong>Hills</strong> <strong>Public</strong> <strong>School</strong>s offers K-4; K-6; 5-6; 7-8; and 9-12 buildings. We have three<br />
specialized schools:<br />
Ada Vista Spanish Immersion <strong>School</strong> (K-4) – Ada Vista is a Spanish immersion<br />
school in which all students are taught the <strong>Forest</strong> <strong>Hills</strong>’ curriculum using Spanish as<br />
the medium for instruction. It is amazing the way the students learn to read, write,<br />
and speak in both Spanish and English. In kindergarten and first grade children are<br />
spoken to only in Spanish and are taught to read and write in Spanish too. In<br />
January of the first grade year the students begin to speak only in Spanish during<br />
class time. In second grade students begin English language arts for 30 minutes<br />
and each year thereafter that time is increased by 15 minutes. Students will continue<br />
their immersion language learning in the future at Northern Trails 5/6, Northern <strong>Hills</strong><br />
<strong>Middle</strong> <strong>School</strong>, and Northern High <strong>School</strong>.<br />
<strong>Forest</strong> <strong>Hills</strong> <strong>Public</strong> <strong>School</strong>s<br />
Daniel Behm, Superintendent<br />
6590 Cascade Road, SE, Grand Rapids, MI 49546 Phone 616.493.8800 www.fhps.us
Meadow Brook Chinese Immersion <strong>School</strong> (K-4) – Meadow Brook Elementary hosts<br />
a 50/50 model Chinese immersion program where students learn half the core content<br />
(math, science, and Mandarin literacy) in the Chinese language with English language<br />
arts and social studies taught in English. From the vast amount of research available,<br />
we know students can acquire any language faster and more easily if we begin as early<br />
as possible. Students in the Chinese immersion learn to speak, read, and write at<br />
scaffold levels in each subsequent grade. Teachers in kindergarten and first grade have<br />
prescribed dates when English is no longer spoken in the classroom (December and<br />
October respectively). Teachers in grades second through fourth start off the school<br />
year with no English and encourage students to only use the target language in class.<br />
Students will continue their immersion language learning in the future at Northern Trails<br />
5/6, Northern <strong>Hills</strong> <strong>Middle</strong> <strong>School</strong>, and Northern High <strong>School</strong>.<br />
Goodwillie Environmental 5/6 <strong>School</strong> – We are in our thirteenth year of offering to<br />
fifth and sixth grade students a model educational program that is based primarily on<br />
learning in the “living classroom,” the great outdoors. While this sounds easy on the<br />
surface, it is extremely difficult to adapt a challenging state mandated curriculum to<br />
meaningful and engaging lessons in nature. The awareness, dependency, and<br />
flexibility upon the weather are critical for weekly/daily planning. Phonology, Magic<br />
Spots, journaling, sketching, observing, writing, understanding, and of course just<br />
enjoying nature is a special gift that these teachers are happy to share with their<br />
students.<br />
4. Identify how to access a copy of the core curriculum, a description of its<br />
implementation, and an explanation of the variances from the state’s model<br />
The Core Curriculum for our district is located within our Instruction Office. Copies of each<br />
content standard, essential questions, enduring understandings, and sequence of the<br />
course is available electronically or on paper. Committees, consistently of administrators<br />
and teachers, are developed and rotated yearly to update and modify the content as<br />
needed. This ensures our district remains vigilant in meeting the state's expectations for<br />
each grade level and course.<br />
5. The aggregate student achievement results for any local competency tests or<br />
nationally normed achievement tests are located at the end of this letter.<br />
6. Identify the number and percent of students represented by parents at parent-teacher<br />
conferences:<br />
Number & Percentage Parents/Guardians<br />
Fall Spring<br />
2010-2011 371 94% 355 90%<br />
2011-2012 366 94% 350 90%<br />
Congratulations to our students and staff on another amazing year. Students tackled a rigorous<br />
core curriculum, exciting exploratory classes, and a variety of after school activities. Thanks to<br />
the excellence of our caring staff and the support of our parents, <strong>Eastern</strong> <strong>Middle</strong> <strong>School</strong> students<br />
realized our goal of “all learners achieving individual potential.”<br />
Sincerely,<br />
David Washburn<br />
Principal
Annual Education Report 08/15/2012<br />
<strong>School</strong>-Level Combined Reports Data for Kent ISD, <strong>Forest</strong> <strong>Hills</strong> <strong>Public</strong> <strong>School</strong>s, <strong>Eastern</strong> <strong>Middle</strong> <strong>School</strong><br />
Subject Grade Student Group <strong>School</strong> Year % Students<br />
Tested<br />
English<br />
Language Arts /<br />
Reading<br />
English<br />
Language Arts /<br />
Reading<br />
English<br />
Language Arts /<br />
Reading<br />
English<br />
Language Arts /<br />
Reading<br />
English<br />
Language Arts /<br />
Reading<br />
English<br />
Language Arts /<br />
Reading<br />
English<br />
Language Arts /<br />
Reading<br />
English<br />
Language Arts /<br />
Reading<br />
English<br />
Language Arts /<br />
Reading<br />
English<br />
Language Arts /<br />
Reading<br />
English<br />
Language Arts /<br />
Reading<br />
English<br />
Language Arts /<br />
Reading<br />
English<br />
Language Arts /<br />
Reading<br />
English<br />
Language Arts /<br />
Reading<br />
Page 1 of 26<br />
Student Assessment Data - Michigan Educational Assessment Program (MEAP)<br />
State %<br />
Students<br />
Proficient<br />
District %<br />
Students<br />
Proficient<br />
<strong>School</strong> %<br />
Students<br />
Proficient<br />
% Advanced<br />
(Level 1)<br />
% Proficient<br />
(Level 2)<br />
% Partially<br />
Proficient<br />
(Level 3)<br />
07 All Students 2010-11 100% 55.6% 84% 84.1% 31.2% 52.9% 11.6% 4.2%<br />
07 All Students 2011-12 100% 59.7% 84.9% 81.4% 29.4% 52.1% 12.9% 5.7%<br />
07 Asian 2010-11
Annual Education Report 08/15/2012<br />
<strong>School</strong>-Level Combined Reports Data for Kent ISD, <strong>Forest</strong> <strong>Hills</strong> <strong>Public</strong> <strong>School</strong>s, <strong>Eastern</strong> <strong>Middle</strong> <strong>School</strong><br />
Subject Grade Student Group <strong>School</strong> Year % Students<br />
Tested<br />
English<br />
Language Arts /<br />
Reading<br />
English<br />
Language Arts /<br />
Reading<br />
English<br />
Language Arts /<br />
Reading<br />
English<br />
Language Arts /<br />
Reading<br />
English<br />
Language Arts /<br />
Reading<br />
English<br />
Language Arts /<br />
Reading<br />
English<br />
Language Arts /<br />
Reading<br />
English<br />
Language Arts /<br />
Reading<br />
English<br />
Language Arts /<br />
Reading<br />
English<br />
Language Arts /<br />
Reading<br />
English<br />
Language Arts /<br />
Reading<br />
English<br />
Language Arts /<br />
Reading<br />
English<br />
Language Arts /<br />
Reading<br />
English<br />
Language Arts /<br />
Reading<br />
Page 2 of 26<br />
Student Assessment Data - Michigan Educational Assessment Program (MEAP)<br />
State %<br />
Students<br />
Proficient<br />
District %<br />
Students<br />
Proficient<br />
<strong>School</strong> %<br />
Students<br />
Proficient<br />
% Advanced<br />
(Level 1)<br />
% Proficient<br />
(Level 2)<br />
% Partially<br />
Proficient<br />
(Level 3)<br />
07 Female 2011-12 100% 63.9% 84.6% 83.5% 29.4% 54.1% 12.8% 3.7%<br />
07 Male 2010-11 100% 51.1% 81.6% 81.2% 23.8% 57.4% 13.9% 5%<br />
07 Male 2011-12 100% 55.6% 85.2% 78.8% 29.4% 49.4% 12.9% 8.2%<br />
07 Economically<br />
Disadvantaged<br />
07 Economically<br />
Disadvantaged<br />
07 Students with<br />
Disabilities<br />
07 Students with<br />
Disabilities<br />
2010-11 100% 40.1% 70.9% 70% 25% 45% 20% 10%<br />
2011-12 100% 44.5% 70.1% 70.8% 20.8% 50% 25% 4.2%<br />
2010-11 100% 14.9% 26.3% 50% 8.3% 41.7% 8.3% 41.7%<br />
2011-12 100% 19% 52.1% 33.3% 6.7% 26.7% 40% 26.7%<br />
08 All Students 2010-11 99.5% 56% 83.4% 85.8% 23.9% 61.9% 10.7% 3.6%<br />
08 All Students 2011-12 100% 60.5% 85.9% 89.5% 21.5% 68.1% 9.4% 1%<br />
08 American Indian<br />
or Alaska Native<br />
2010-11
Annual Education Report 08/15/2012<br />
<strong>School</strong>-Level Combined Reports Data for Kent ISD, <strong>Forest</strong> <strong>Hills</strong> <strong>Public</strong> <strong>School</strong>s, <strong>Eastern</strong> <strong>Middle</strong> <strong>School</strong><br />
Subject Grade Student Group <strong>School</strong> Year % Students<br />
Tested<br />
English<br />
Language Arts /<br />
Reading<br />
English<br />
Language Arts /<br />
Reading<br />
English<br />
Language Arts /<br />
Reading<br />
English<br />
Language Arts /<br />
Reading<br />
English<br />
Language Arts /<br />
Reading<br />
English<br />
Language Arts /<br />
Reading<br />
English<br />
Language Arts /<br />
Reading<br />
English<br />
Language Arts /<br />
Reading<br />
English<br />
Language Arts /<br />
Reading<br />
English<br />
Language Arts /<br />
Reading<br />
English<br />
Language Arts /<br />
Reading<br />
English<br />
Language Arts /<br />
Reading<br />
English<br />
Language Arts /<br />
Reading<br />
English<br />
Language Arts /<br />
Reading<br />
08 Hispanic or<br />
Latino<br />
08 Hispanic or<br />
Latino<br />
08 Two or More<br />
Races<br />
08 Two or More<br />
Races<br />
Student Assessment Data - Michigan Educational Assessment Program (MEAP)<br />
State %<br />
Students<br />
Proficient<br />
District %<br />
Students<br />
Proficient<br />
<strong>School</strong> %<br />
Students<br />
Proficient<br />
% Advanced<br />
(Level 1)<br />
% Proficient<br />
(Level 2)<br />
% Partially<br />
Proficient<br />
(Level 3)<br />
2010-11
Annual Education Report 08/15/2012<br />
<strong>School</strong>-Level Combined Reports Data for Kent ISD, <strong>Forest</strong> <strong>Hills</strong> <strong>Public</strong> <strong>School</strong>s, <strong>Eastern</strong> <strong>Middle</strong> <strong>School</strong><br />
Subject Grade Student Group <strong>School</strong> Year % Students<br />
Tested<br />
Student Assessment Data - Michigan Educational Assessment Program (MEAP)<br />
State %<br />
Students<br />
Proficient<br />
District %<br />
Students<br />
Proficient<br />
<strong>School</strong> %<br />
Students<br />
Proficient<br />
% Advanced<br />
(Level 1)<br />
% Proficient<br />
(Level 2)<br />
% Partially<br />
Proficient<br />
(Level 3)<br />
Mathematics 07 All Students 2011-12 100% 37.2% 69.9% 56.7% 8.2% 48.5% 24.2% 19.1%<br />
Mathematics 07 Asian 2010-11
Annual Education Report 08/15/2012<br />
<strong>School</strong>-Level Combined Reports Data for Kent ISD, <strong>Forest</strong> <strong>Hills</strong> <strong>Public</strong> <strong>School</strong>s, <strong>Eastern</strong> <strong>Middle</strong> <strong>School</strong><br />
Subject Grade Student Group <strong>School</strong> Year % Students<br />
Tested<br />
Mathematics 08 Black or African<br />
American<br />
Mathematics 08 Black or African<br />
American<br />
Mathematics 08 Hispanic or<br />
Latino<br />
Mathematics 08 Hispanic or<br />
Latino<br />
Mathematics 08 Two or More<br />
Races<br />
Mathematics 08 Two or More<br />
Races<br />
Student Assessment Data - Michigan Educational Assessment Program (MEAP)<br />
State %<br />
Students<br />
Proficient<br />
District %<br />
Students<br />
Proficient<br />
<strong>School</strong> %<br />
Students<br />
Proficient<br />
% Advanced<br />
(Level 1)<br />
% Proficient<br />
(Level 2)<br />
% Partially<br />
Proficient<br />
(Level 3)<br />
2010-11
Annual Education Report 08/15/2012<br />
<strong>School</strong>-Level Combined Reports Data for Kent ISD, <strong>Forest</strong> <strong>Hills</strong> <strong>Public</strong> <strong>School</strong>s, <strong>Eastern</strong> <strong>Middle</strong> <strong>School</strong><br />
Subject Grade Student Group <strong>School</strong> Year % Students<br />
Tested<br />
Science 08 Hispanic or<br />
Latino<br />
Science 08 Two or More<br />
Races<br />
Science 08 Two or More<br />
Races<br />
Student Assessment Data - Michigan Educational Assessment Program (MEAP)<br />
State %<br />
Students<br />
Proficient<br />
District %<br />
Students<br />
Proficient<br />
<strong>School</strong> %<br />
Students<br />
Proficient<br />
% Advanced<br />
(Level 1)<br />
% Proficient<br />
(Level 2)<br />
% Partially<br />
Proficient<br />
(Level 3)<br />
2011-12
Annual Education Report 08/15/2012<br />
<strong>School</strong>-Level Combined Reports Data for Kent ISD, <strong>Forest</strong> <strong>Hills</strong> <strong>Public</strong> <strong>School</strong>s, <strong>Eastern</strong> <strong>Middle</strong> <strong>School</strong><br />
Subject Grade Student Group <strong>School</strong> Year % Students<br />
Tested<br />
Page 7 of 26<br />
Student Assessment Data - Michigan Merit Examination (MME)<br />
State %<br />
Students<br />
Proficient<br />
District %<br />
Students<br />
Proficient<br />
<strong>School</strong> %<br />
Students<br />
Proficient<br />
% Advanced<br />
(Level 1)<br />
% Proficient<br />
(Level 2)<br />
% Partially<br />
Proficient<br />
(Level 3)<br />
% Not<br />
Proficient<br />
(Level 4)
Annual Education Report 08/15/2012<br />
<strong>School</strong>-Level Combined Reports Data for Kent ISD, <strong>Forest</strong> <strong>Hills</strong> <strong>Public</strong> <strong>School</strong>s, <strong>Eastern</strong> <strong>Middle</strong> <strong>School</strong><br />
Subject Grade Student Group <strong>School</strong> Year % Students<br />
Tested<br />
Student Assessment Data - MI-Access : Functional Independence<br />
State % Students<br />
Proficient<br />
District %<br />
Students<br />
Proficient<br />
<strong>School</strong> %<br />
Students<br />
Proficient<br />
% Surpassed<br />
(Level 1)<br />
% Attained<br />
(Level 2)<br />
Mathematics 07 All Students 2010-11
Annual Education Report 08/15/2012<br />
<strong>School</strong>-Level Combined Reports Data for Kent ISD, <strong>Forest</strong> <strong>Hills</strong> <strong>Public</strong> <strong>School</strong>s, <strong>Eastern</strong> <strong>Middle</strong> <strong>School</strong><br />
Subject Grade Student Group <strong>School</strong> Year % Students<br />
Tested<br />
Page 9 of 26<br />
Student Assessment Data - MI-Access : Supported Independence<br />
State % Students<br />
Proficient<br />
District %<br />
Students<br />
Proficient<br />
<strong>School</strong> %<br />
Students<br />
Proficient<br />
% Surpassed<br />
(Level 1)<br />
% Attained<br />
(Level 2)<br />
% Emerging<br />
(Level 3)
Annual Education Report 08/15/2012<br />
<strong>School</strong>-Level Combined Reports Data for Kent ISD, <strong>Forest</strong> <strong>Hills</strong> <strong>Public</strong> <strong>School</strong>s, <strong>Eastern</strong> <strong>Middle</strong> <strong>School</strong><br />
Subject Grade Student Group <strong>School</strong> Year % Students<br />
Tested<br />
Page 10 of 26<br />
Student Assessment Data - MI-Access : Participation<br />
State % Students<br />
Proficient<br />
District %<br />
Students<br />
Proficient<br />
<strong>School</strong> %<br />
Students<br />
Proficient<br />
% Surpassed<br />
(Level 1)<br />
% Attained<br />
(Level 2)<br />
% Emerging<br />
(Level 3)
Annual Education Report 08/15/2012<br />
<strong>School</strong>-Level Combined Reports Data for Kent ISD, <strong>Forest</strong> <strong>Hills</strong> <strong>Public</strong> <strong>School</strong>s, <strong>Eastern</strong> <strong>Middle</strong> <strong>School</strong><br />
Subject Grade Student Group <strong>School</strong> Year % Students<br />
Tested<br />
Student Assessment Data - MEAP-Access<br />
State % Students<br />
Proficient<br />
District %<br />
Students<br />
Proficient<br />
<strong>School</strong> %<br />
Students<br />
Proficient<br />
% Level 1 % Level 2 % Level 3<br />
Reading 07 All Students 2011-12
Annual Education Report 08/15/2012<br />
<strong>School</strong>-Level Combined Reports Data for Kent ISD, <strong>Forest</strong> <strong>Hills</strong> <strong>Public</strong> <strong>School</strong>s, <strong>Eastern</strong> <strong>Middle</strong> <strong>School</strong><br />
AYP Detail Data<br />
Student Group Location Subject % Tested (Goal 95%) % Proficient for AYP*<br />
All Students State English Language Arts /<br />
Reading<br />
98.8% 82.9%<br />
All Students State Mathematics 98.5% 57.5%<br />
All Students District English Language Arts /<br />
Reading<br />
99.6% 94.6%<br />
All Students District Mathematics 99.5% 84.7%<br />
All Students <strong>School</strong> English Language Arts /<br />
Reading<br />
99.7% 97.3%<br />
All Students <strong>School</strong> Mathematics 99.7% 84%<br />
American Indian or Alaska<br />
Native<br />
American Indian or Alaska<br />
Native<br />
American Indian or Alaska<br />
Native<br />
American Indian or Alaska<br />
Native<br />
Asian, Native Hawaiian, or<br />
Pacific Islander<br />
Asian, Native Hawaiian, or<br />
Pacific Islander<br />
Asian, Native Hawaiian, or<br />
Pacific Islander<br />
Asian, Native Hawaiian, or<br />
Pacific Islander<br />
Asian, Native Hawaiian, or<br />
Pacific Islander<br />
Asian, Native Hawaiian, or<br />
Pacific Islander<br />
State English Language Arts /<br />
Reading<br />
97.7% 78.6%<br />
State Mathematics 97.5% 47.4%<br />
District English Language Arts /<br />
Reading<br />
Annual Education Report 08/15/2012<br />
<strong>School</strong>-Level Combined Reports Data for Kent ISD, <strong>Forest</strong> <strong>Hills</strong> <strong>Public</strong> <strong>School</strong>s, <strong>Eastern</strong> <strong>Middle</strong> <strong>School</strong><br />
AYP Detail Data<br />
Student Group Location Subject % Tested (Goal 95%) % Proficient for AYP*<br />
White <strong>School</strong> Mathematics 99.7% 84.9%<br />
Economically<br />
Disadvantaged<br />
Economically<br />
Disadvantaged<br />
Economically<br />
Disadvantaged<br />
Economically<br />
Disadvantaged<br />
Economically<br />
Disadvantaged<br />
Economically<br />
Disadvantaged<br />
State English Language Arts /<br />
Reading<br />
98.3% 74.4%<br />
State Mathematics 97.9% 43.3%<br />
District English Language Arts /<br />
Reading<br />
99.7% 87.3%<br />
District Mathematics 99.5% 66.9%<br />
<strong>School</strong> English Language Arts /<br />
Reading<br />
100% 100%<br />
<strong>School</strong> Mathematics 100% 85.7%<br />
Students with Disabilities State English Language Arts /<br />
Reading<br />
97.7% 51.5%<br />
Students with Disabilities State Mathematics 97.3% 32%<br />
Students with Disabilities District English Language Arts /<br />
Reading<br />
98% 74.1%<br />
Students with Disabilities District Mathematics 97.8% 57%<br />
Students with Disabilities <strong>School</strong> English Language Arts /<br />
Reading<br />
100% 81.8%<br />
Students with Disabilities <strong>School</strong> Mathematics 100% 54.5%<br />
Note: 1037 Recently arrived LEP students took part in the State’s ELPA instead of the MEAP/MME/MI-Access.<br />
Page 13 of 26
Annual Education Report 08/15/2012<br />
<strong>School</strong>-Level Combined Reports Data for Kent ISD, <strong>Forest</strong> <strong>Hills</strong> <strong>Public</strong> <strong>School</strong>s, <strong>Eastern</strong> <strong>Middle</strong> <strong>School</strong><br />
AYP Detail Data - Graduation Rate<br />
Student Group Location Graduation Rate (High <strong>School</strong>s only) (Goal<br />
80%)<br />
All Students State 79.2%<br />
All Students District >95%<br />
American Indian or Alaska Native State 68.49%<br />
American Indian or Alaska Native District 95%<br />
Black or African American State 62.56%<br />
Black or African American District >95%<br />
Hispanic or Latino State 68.31%<br />
Hispanic or Latino District 92.86%<br />
Migrant State 73.33%<br />
Native Hawaiian or Other Pacific Islander State 71.79%<br />
Native Hawaiian or Other Pacific Islander District 95%<br />
Female State 83.17%<br />
Female District >95%<br />
Male State 75.45%<br />
Male District >95%<br />
Economically Disadvantaged State 67.16%<br />
Economically Disadvantaged District 89.55%<br />
Students with Disabilities State 64.79%<br />
Students with Disabilities District 87.38%<br />
* All data based on students enrolled for a full academic year.<br />
Page 14 of 26
Annual Education Report 08/15/2012<br />
<strong>School</strong>-Level Combined Reports Data for Kent ISD, <strong>Forest</strong> <strong>Hills</strong> <strong>Public</strong> <strong>School</strong>s, <strong>Eastern</strong> <strong>Middle</strong> <strong>School</strong><br />
AYP Detail Data - Attendance Rate<br />
Student Group Location Attendance Rate (Goal 90%)<br />
All Students State 94.8%<br />
All Students District 96.7%<br />
All Students <strong>School</strong> 96.4%<br />
American Indian or Alaska Native State 94.1%<br />
American Indian or Alaska Native District 95.5%<br />
American Indian or Alaska Native <strong>School</strong> 88.1%<br />
Asian, Native Hawaiian, or Pacific Islander State 96.4%<br />
Asian, Native Hawaiian, or Pacific Islander District 96.9%<br />
Asian, Native Hawaiian, or Pacific Islander <strong>School</strong> 97.5%<br />
Black or African American State 91%<br />
Black or African American District 96.2%<br />
Black or African American <strong>School</strong> 94.4%<br />
Hispanic or Latino State 94.3%<br />
Hispanic or Latino District 96.2%<br />
Hispanic or Latino <strong>School</strong> 96.5%<br />
Two or More Races State 95%<br />
Two or More Races District 97.2%<br />
Two or More Races <strong>School</strong> 97.7%<br />
White State 95.8%<br />
White District 96.7%<br />
White <strong>School</strong> 96.3%<br />
Economically Disadvantaged State 94.8%<br />
Economically Disadvantaged District 96.7%<br />
Economically Disadvantaged <strong>School</strong> 96.4%<br />
Students with Disabilities State 93.2%<br />
Students with Disabilities District 95.8%<br />
Students with Disabilities <strong>School</strong> 96.1%<br />
* All data based on students enrolled for a full academic year.<br />
Page 15 of 26
Annual Education Report 08/15/2012<br />
<strong>School</strong>-Level Combined Reports Data for Kent ISD, <strong>Forest</strong> <strong>Hills</strong> <strong>Public</strong> <strong>School</strong>s, <strong>Eastern</strong> <strong>Middle</strong> <strong>School</strong><br />
Michigan Annual AYP Objectives for Reading/ELA<br />
<strong>School</strong> Year Grade 3 Grade 4 Grade 5 Grade 6 Grade 7 Grade 8 Grade 11<br />
2001-02 38% 31% 42%<br />
2002-03 38% 31% 42%<br />
2003-04 38% 31% 42%<br />
2004-05 48% 43% 52%<br />
2005-06 50% 48% 46% 45% 43% 41% 52%<br />
2006-07 50% 48% 46% 45% 43% 41% 52%<br />
2007-08 60% 59% 57% 56% 54% 53% 61%<br />
2008-09 60% 59% 57% 56% 54% 53% 61%<br />
2009-10 70% 69% 68% 67% 66% 65% 71%<br />
2010-11 78% 77% 76% 75% 74% 73% 79%<br />
2011-12 86% 85% 84% 83% 82% 82% 86%<br />
2012-13 93% 92% 92% 91% 91% 91% 93%<br />
2013-14 100% 100% 100% 100% 100% 100% 100%<br />
Page 16 of 26
Annual Education Report 08/15/2012<br />
<strong>School</strong>-Level Combined Reports Data for Kent ISD, <strong>Forest</strong> <strong>Hills</strong> <strong>Public</strong> <strong>School</strong>s, <strong>Eastern</strong> <strong>Middle</strong> <strong>School</strong><br />
Michigan Annual AYP Objectives for Mathematics<br />
<strong>School</strong> Year Grade 3 Grade 4 Grade 5 Grade 6 Grade 7 Grade 8 Grade 11<br />
2001-02 47% 31% 33%<br />
2002-03 47% 31% 33%<br />
2003-04 47% 31% 33%<br />
2004-05 56% 43% 44%<br />
2005-06 59% 56% 53% 50% 46% 43% 44%<br />
2006-07 59% 56% 53% 50% 46% 43% 44%<br />
2007-08 67% 65% 62% 60% 57% 54% 55%<br />
2008-09 67% 65% 62% 60% 57% 54% 55%<br />
2009-10 67% 65% 62% 60% 57% 54% 55%<br />
2010-11 75% 74% 71% 70% 67% 66% 67%<br />
2011-12 83% 82% 81% 80% 78% 77% 78%<br />
2012-13 91% 91% 90% 90% 89% 89% 89%<br />
2013-14 100% 100% 100% 100% 100% 100% 100%<br />
Page 17 of 26
Annual Education Report 08/15/2012<br />
<strong>School</strong>-Level Combined Reports Data for Kent ISD, <strong>Forest</strong> <strong>Hills</strong> <strong>Public</strong> <strong>School</strong>s, <strong>Eastern</strong> <strong>Middle</strong> <strong>School</strong><br />
Title 1 Status AYP ELA/Reading<br />
Status<br />
AYP Mathematics<br />
Status<br />
<strong>School</strong> AYP Status<br />
AYP Overall Status Education Yes Report<br />
Card Grade<br />
<strong>School</strong> Status<br />
Indicator<br />
No Met Met Met B Reward<br />
Page 18 of 26
Annual Education Report 08/15/2012<br />
<strong>School</strong>-Level Combined Reports Data for Kent ISD, <strong>Forest</strong> <strong>Hills</strong> <strong>Public</strong> <strong>School</strong>s, <strong>Eastern</strong> <strong>Middle</strong> <strong>School</strong><br />
Teacher Quality Data<br />
Other B.A. M.A. Ph.D<br />
Professional Qualifications<br />
of All <strong>Public</strong> Elementary and<br />
Secondary <strong>School</strong> Teachers<br />
in the <strong>School</strong><br />
0 10 27 0<br />
Professional Qualifications are defined by the State and may include information such as the degrees of public school teachers<br />
(e.g., percentage of teachers with Bachelors Degrees or Masters Degrees) or the percentage of fully certified teachers<br />
Page 19 of 26
Annual Education Report 08/15/2012<br />
<strong>School</strong>-Level Combined Reports Data for Kent ISD, <strong>Forest</strong> <strong>Hills</strong> <strong>Public</strong> <strong>School</strong>s, <strong>Eastern</strong> <strong>Middle</strong> <strong>School</strong><br />
Percentage of <strong>Public</strong> Elementary and Secondary <strong>School</strong> Teachers in the<br />
<strong>School</strong> with Emergency Certification<br />
Page 20 of 26<br />
Teacher Quality Data<br />
Certification Percent<br />
0%
Annual Education Report 08/15/2012<br />
<strong>School</strong>-Level Combined Reports Data for Kent ISD, <strong>Forest</strong> <strong>Hills</strong> <strong>Public</strong> <strong>School</strong>s, <strong>Eastern</strong> <strong>Middle</strong> <strong>School</strong><br />
Percentage of Core Academic Subject Elementary and Secondary<br />
<strong>School</strong> Classes not Taught by Highly Qualified Teachers<br />
Page 21 of 26<br />
Teacher Quality Data<br />
<strong>School</strong> Aggregate<br />
0%
Annual Education Report 08/15/2012<br />
<strong>School</strong>-Level Combined Reports Data for Kent ISD, <strong>Forest</strong> <strong>Hills</strong> <strong>Public</strong> <strong>School</strong>s, <strong>Eastern</strong> <strong>Middle</strong> <strong>School</strong><br />
NAEP 2011 Grade 4 Mathematics Results<br />
Percent of Students Percent below Basic Percent Basic Percent Proficient Percent Advanced<br />
All Students 100 22 43 30 5<br />
Male<br />
Female<br />
National Lunch<br />
Program Eligility<br />
Eligible<br />
Not Eligible<br />
Info not available<br />
Race Ethnicity<br />
White<br />
Black<br />
Hispanic<br />
Asian<br />
American Indian<br />
Native<br />
Hawaiian/Pacific<br />
Islander<br />
Two or More Races<br />
Student classified as<br />
having a disability<br />
SD<br />
Not SD<br />
Student is an English<br />
Language Learner<br />
ELL<br />
Not ELL<br />
50<br />
50<br />
43<br />
56<br />
71<br />
16<br />
6<br />
3<br />
2<br />
13<br />
87<br />
4<br />
96<br />
21<br />
22<br />
35<br />
11<br />
14<br />
53<br />
31<br />
7<br />
‡<br />
‡<br />
23<br />
50<br />
18<br />
47<br />
21<br />
‡ Reporting Standards not met.<br />
Note: Observed differences are not necessarily statistically significant. Detail may not sum to total because of rounding.<br />
SOURCE: U.S. Department of Education. Institute for Education Sciences. National Center for Education Statistics. National Assessment Program (NAEP) 2011<br />
Mathematics Achievement.<br />
Page 22 of 26<br />
42<br />
45<br />
47<br />
41<br />
45<br />
39<br />
48<br />
22<br />
‡<br />
‡<br />
50<br />
37<br />
44<br />
41<br />
44<br />
31<br />
29<br />
17<br />
41<br />
36<br />
8<br />
19<br />
45<br />
‡<br />
‡<br />
21<br />
13<br />
32<br />
11<br />
31<br />
6<br />
4<br />
1<br />
8<br />
5<br />
0<br />
2<br />
26<br />
‡<br />
‡<br />
6<br />
1<br />
5<br />
1<br />
5
Annual Education Report 08/15/2012<br />
<strong>School</strong>-Level Combined Reports Data for Kent ISD, <strong>Forest</strong> <strong>Hills</strong> <strong>Public</strong> <strong>School</strong>s, <strong>Eastern</strong> <strong>Middle</strong> <strong>School</strong><br />
NAEP 2011 Grade 8 Mathematics Results<br />
Percent of Students Percent below Basic Percent Basic Percent Proficient Percent Advanced<br />
All Students 100 29 40 25 6<br />
Male<br />
Female<br />
National Lunch<br />
Program Eligility<br />
Eligible<br />
Not Eligible<br />
Info not available<br />
Race Ethnicity<br />
White<br />
Black<br />
Hispanic<br />
Asian<br />
American Indian<br />
Native<br />
Hawaiian/Pacific<br />
Islander<br />
Two or More Races<br />
Student classified as<br />
having a disability<br />
SD<br />
Not SD<br />
Student is an English<br />
Language Learner<br />
ELL<br />
Not ELL<br />
51<br />
49<br />
42<br />
58<br />
74<br />
16<br />
4<br />
3<br />
1<br />
2<br />
12<br />
88<br />
2<br />
98<br />
28<br />
30<br />
45<br />
18<br />
22<br />
66<br />
26<br />
13<br />
‡<br />
‡<br />
‡<br />
70<br />
25<br />
57<br />
29<br />
‡ Reporting Standards not met.<br />
NOTE: Detail may not sum to totals because of rounding. Some apparent differences between estimates may not be statistically significant.<br />
SOURCE: U.S. Department of Education. Institute for Education Sciences. National Center for Education Statistics. National Assessment Program (NAEP) 2011<br />
Mathematics Achievement.<br />
Page 23 of 26<br />
39<br />
41<br />
39<br />
41<br />
43<br />
26<br />
41<br />
25<br />
‡<br />
‡<br />
‡<br />
23<br />
41<br />
27<br />
40<br />
26<br />
24<br />
15<br />
32<br />
29<br />
7<br />
18<br />
31<br />
‡<br />
‡<br />
‡<br />
5<br />
27<br />
7<br />
25<br />
7<br />
5<br />
2<br />
9<br />
6<br />
0<br />
5<br />
32<br />
‡<br />
‡<br />
‡<br />
1<br />
6<br />
10<br />
6
Annual Education Report 08/15/2012<br />
<strong>School</strong>-Level Combined Reports Data for Kent ISD, <strong>Forest</strong> <strong>Hills</strong> <strong>Public</strong> <strong>School</strong>s, <strong>Eastern</strong> <strong>Middle</strong> <strong>School</strong><br />
NAEP 2011 Grade 4 Reading Results<br />
Percent of Students Percent below Basic Percent Basic Percent Proficient Percent Advanced<br />
All Students 100 34 34 25 6<br />
Male<br />
Female<br />
National Lunch<br />
Program Eligility<br />
Eligible<br />
Not Eligible<br />
Info not available<br />
Race Ethnicity<br />
White<br />
Black<br />
Hispanic<br />
Asian<br />
American Indian<br />
Native<br />
Hawaiian/Pacific<br />
Islander<br />
Two or More Races<br />
Student classified as<br />
having a disability<br />
SD<br />
Not SD<br />
Student is an English<br />
Language Learner<br />
ELL<br />
Not ELL<br />
# Rounds to zero<br />
50<br />
50<br />
38<br />
31<br />
45<br />
55 51<br />
21<br />
70<br />
17<br />
6<br />
3<br />
0<br />
2<br />
13<br />
87<br />
3<br />
97<br />
26<br />
67<br />
51<br />
19<br />
‡<br />
‡<br />
36<br />
73<br />
30<br />
67<br />
33<br />
‡ Reporting Standards not met.<br />
NOTE: Detail may not sum to totals because of rounding. Some apparent differences between estimates may not be statistically significant.<br />
SOURCE: U.S. Department of Education, Institute of Education Sciences, National Center for Education Statistics, National Assessment of Educational Progress<br />
(NAEP), 2011 Reading Assessment.<br />
Page 24 of 26<br />
33<br />
36<br />
32<br />
36<br />
37<br />
24<br />
29<br />
33<br />
‡<br />
‡<br />
31<br />
17<br />
36<br />
26<br />
35<br />
24<br />
26<br />
15<br />
33<br />
30<br />
7<br />
17<br />
33<br />
‡<br />
‡<br />
19<br />
8<br />
27<br />
7<br />
25<br />
6<br />
7<br />
2<br />
10<br />
7<br />
1<br />
3<br />
15<br />
‡<br />
‡<br />
14<br />
2<br />
7<br />
0<br />
7
Annual Education Report 08/15/2012<br />
<strong>School</strong>-Level Combined Reports Data for Kent ISD, <strong>Forest</strong> <strong>Hills</strong> <strong>Public</strong> <strong>School</strong>s, <strong>Eastern</strong> <strong>Middle</strong> <strong>School</strong><br />
NAEP 2011 Grade 8 Reading Results<br />
Percent of Students Percent below Basic Percent Basic Percent Proficient Percent Advanced<br />
All Students 100 23 45 29 3<br />
Male<br />
Female<br />
National Lunch<br />
Program Eligility<br />
Eligible<br />
Not Eligible<br />
Info not available<br />
Race Ethnicity<br />
White<br />
Black<br />
Hispanic<br />
Asian<br />
American Indian<br />
Native<br />
Hawaiian/Pacific<br />
Islander<br />
Two or More Races<br />
Student classified as<br />
having a disability<br />
SD<br />
Not SD<br />
Student is an English<br />
Language Learner<br />
ELL<br />
Not ELL<br />
# Rounds to zero<br />
50<br />
50<br />
42<br />
58<br />
74<br />
16<br />
4<br />
3<br />
1<br />
1<br />
12<br />
88<br />
2<br />
98<br />
28<br />
18<br />
35<br />
14<br />
18<br />
46<br />
25<br />
19<br />
‡<br />
‡<br />
‡<br />
67<br />
19<br />
52<br />
22<br />
‡ Reporting Standards not met.<br />
NOTE: Detail may not sum to totals because of rounding. Some apparent differences between estimates may not be statistically significant.<br />
SOURCE: U.S. Department of Education, Institute of Education Sciences, National Center for Education Statistics, National Assessment of Educational Progress<br />
(NAEP), 2011 Reading Assessment.<br />
Page 25 of 26<br />
47<br />
43<br />
46<br />
44<br />
46<br />
43<br />
50<br />
27<br />
‡<br />
‡<br />
‡<br />
27<br />
46<br />
40<br />
45<br />
24<br />
35<br />
18<br />
37<br />
33<br />
10<br />
25<br />
39<br />
‡<br />
‡<br />
‡<br />
6<br />
31<br />
8<br />
30<br />
2<br />
4<br />
0<br />
4<br />
3<br />
0<br />
1<br />
14<br />
‡<br />
‡<br />
‡<br />
0<br />
3<br />
0<br />
3
Annual Education Report 08/15/2012<br />
<strong>School</strong>-Level Combined Reports Data for Kent ISD, <strong>Forest</strong> <strong>Hills</strong> <strong>Public</strong> <strong>School</strong>s, <strong>Eastern</strong> <strong>Middle</strong> <strong>School</strong><br />
Grade Subject Participation Rate for<br />
Students with<br />
Disabilities<br />
4 Math<br />
Reading<br />
8 Math<br />
Reading<br />
Page 26 of 26<br />
85<br />
75<br />
73<br />
63<br />
Standard Error Participation Rate for<br />
Limited English<br />
Proficient Students<br />
2.0<br />
3.1<br />
2.5<br />
3.3<br />
73<br />
93<br />
83<br />
79<br />
Standard Error<br />
3.3<br />
2.4<br />
4.7<br />
4.5


