Q2 Dealer Facts Guide - Franklin Templeton
Q2 Dealer Facts Guide - Franklin Templeton
Q2 Dealer Facts Guide - Franklin Templeton

Create successful ePaper yourself
Turn your PDF publications into a flip-book with our unique Google optimized e-Paper software.
DEALER USE ONLY/NOT FOR DISTRIBUTION TO THE PUBLIC<br />
JUNE 30, 2009<br />
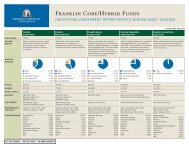
<strong>Q2</strong> <strong>Dealer</strong> <strong>Facts</strong> <strong>Guide</strong><br />
VALUE BLEND GROWTH SECTOR GLOBAL INTERNATIONAL HYBRID ASSET ALLOCATION FIXED INCOME TAX-FREE INCOME
Table of Contents<br />
OPEN-END FUND PROFILES<br />
VALUE<br />
<strong>Franklin</strong> All Cap Value Fund . . . . . . . . . . . . . . . . . . . . 13<br />
<strong>Franklin</strong> Balance Sheet Investment Fund . . . . . . . . . . 14<br />
<strong>Franklin</strong> Large Cap Value Fund . . . . . . . . . . . . . . . . . . 15<br />
CLOSED <strong>Franklin</strong> MicroCap Value Fund . . . . . . . . . . . . . . . . . . . 16<br />
<strong>Franklin</strong> MidCap Value Fund . . . . . . . . . . . . . . . . . . . . 17<br />
<strong>Franklin</strong> Small Cap Value Fund . . . . . . . . . . . . . . . . . . 18<br />
Mutual Beacon Fund . . . . . . . . . . . . . . . . . . . . . . . . . 19<br />
Mutual Quest Fund . . . . . . . . . . . . . . . . . . . . . . . . . . 20<br />
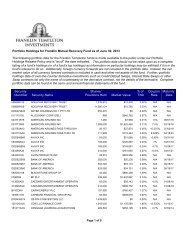
Mutual Recovery Fund . . . . . . . . . . . . . . . . . . . . . . . . 21<br />
Mutual Shares Fund . . . . . . . . . . . . . . . . . . . . . . . . . 22<br />
BLEND<br />
<strong>Franklin</strong> Focused Core Equity Fund . . . . . . . . . . . . . . . 23<br />
<strong>Franklin</strong> Large Cap Equity Fund . . . . . . . . . . . . . . . . . 24<br />
<strong>Franklin</strong> Rising Dividends Fund . . . . . . . . . . . . . . . . . 25<br />
GROWTH<br />
<strong>Franklin</strong> Flex Cap Growth Fund . . . . . . . . . . . . . . . . . . 26<br />
<strong>Franklin</strong> Growth Fund . . . . . . . . . . . . . . . . . . . . . . . . 27<br />
<strong>Franklin</strong> Growth Opportunities Fund . . . . . . . . . . . . . . 28<br />
<strong>Franklin</strong> Small Cap Growth Fund . . . . . . . . . . . . . . . . 29<br />
<strong>Franklin</strong> Small-Mid Cap Growth Fund . . . . . . . . . . . . . 30<br />
SECTOR<br />
<strong>Franklin</strong> Biotechnology Discovery Fund . . . . . . . . . . . . 31<br />
<strong>Franklin</strong> DynaTech Fund . . . . . . . . . . . . . . . . . . . . . . . 32<br />
<strong>Franklin</strong> Global Real Estate Fund . . . . . . . . . . . . . . . . 33<br />
<strong>Franklin</strong> Gold and Precious Metals Fund . . . . . . . . . . . 34<br />
<strong>Franklin</strong> Natural Resources Fund . . . . . . . . . . . . . . . . 35<br />
<strong>Franklin</strong> Real Estate Securities Fund . . . . . . . . . . . . . . 36<br />
<strong>Franklin</strong> Utilities Fund . . . . . . . . . . . . . . . . . . . . . . . . 37<br />
Mutual Financial Services Fund . . . . . . . . . . . . . . . . . 38<br />
GLOBAL<br />
Mutual Global Discovery Fund . . . . . . . . . . . . . . . . . . 39<br />
<strong>Templeton</strong> Global Long-Short Fund . . . . . . . . . . . . . . . 40<br />
<strong>Templeton</strong> Global Opportunities Trust . . . . . . . . . . . . . 41<br />
<strong>Templeton</strong> Global Smaller Companies Fund . . . . . . . . . 42<br />
<strong>Templeton</strong> Growth Fund . . . . . . . . . . . . . . . . . . . . . . . 43<br />
<strong>Templeton</strong> World Fund . . . . . . . . . . . . . . . . . . . . . . . . 44<br />
KEY INFORMATION<br />
PERFORMANCE SUMMARY<br />
Open-End Funds . . . . . . . . . . . . . . . . . . . . . . . . . . . . . . 2<br />
Variable Insurance Funds . . . . . . . . . . . . . . . . . . . . . . . 9<br />
Selected Index Returns . . . . . . . . . . . . . . . . . . . . . . . . 11<br />
Closed-End Funds . . . . . . . . . . . . . . . . . . . . . . . . . . . . 11<br />
Money Funds . . . . . . . . . . . . . . . . . . . . . . . . . . . . . . . . 11<br />
<strong>Franklin</strong> <strong>Templeton</strong> 529 College Savings Plan . . . . 121<br />
Footnotes . . . . . . . . . . . . . . . . . . . . . . . . . . . . . . . . . 125<br />
Fund Sales Charges and Commissions . . . . . . . . . . 128<br />
INTERNATIONAL<br />
<strong>Franklin</strong> India Growth Fund . . . . . . . . . . . . . . . . . . . . . . . 45<br />
<strong>Franklin</strong> International Growth Fund . . . . . . . . . . . . . . . . . 46<br />
<strong>Franklin</strong> International Small Cap Growth Fund . . . . . . . . . 47<br />
Mutual European Fund . . . . . . . . . . . . . . . . . . . . . . . . . . 48<br />
NEW Mutual International Fund . . . . . . . . . . . . . . . . . . . . . . . . 49<br />
<strong>Templeton</strong> BRIC Fund . . . . . . . . . . . . . . . . . . . . . . . . . . . 50<br />
<strong>Templeton</strong> China World Fund . . . . . . . . . . . . . . . . . . . . . . 51<br />
<strong>Templeton</strong> Developing Markets Trust . . . . . . . . . . . . . . . . 52<br />
<strong>Templeton</strong> Emerging Markets Small Cap Fund . . . . . . . . . 53<br />
<strong>Templeton</strong> Foreign Fund . . . . . . . . . . . . . . . . . . . . . . . . . 54<br />
<strong>Templeton</strong> Foreign Smaller Companies Fund . . . . . . . . . . .55<br />
<strong>Templeton</strong> Frontier Markets Fund . . . . . . . . . . . . . . . . . . . 56<br />
HYBRID<br />
<strong>Franklin</strong> Balanced Fund . . . . . . . . . . . . . . . . . . . . . . . . . 57<br />
<strong>Franklin</strong> Convertible Securities Fund . . . . . . . . . . . . . . . . 58<br />
<strong>Franklin</strong> Equity Income Fund . . . . . . . . . . . . . . . . . . . . . . 59<br />
<strong>Franklin</strong> Income Fund . . . . . . . . . . . . . . . . . . . . . . . . . . . 60<br />
<strong>Templeton</strong> Income Fund . . . . . . . . . . . . . . . . . . . . . . . . . 61<br />
ASSET ALLOCATION<br />
<strong>Franklin</strong> <strong>Templeton</strong> Corefolio Allocation Fund . . . . . . . . . . 62<br />
<strong>Franklin</strong> <strong>Templeton</strong> Founding Funds Allocation Fund . . . . . 63<br />
<strong>Franklin</strong> <strong>Templeton</strong> Perspectives Allocation Fund . . . . . . . 64<br />
<strong>Franklin</strong> <strong>Templeton</strong> Conservative Target Fund . . . . . . . . . . 65<br />
<strong>Franklin</strong> <strong>Templeton</strong> Moderate Target Fund . . . . . . . . . . . . 66<br />
<strong>Franklin</strong> <strong>Templeton</strong> Growth Target Fund . . . . . . . . . . . . . . 67<br />
<strong>Franklin</strong> <strong>Templeton</strong> 2015 Retirement Target Fund . . . . . . . 68<br />
<strong>Franklin</strong> <strong>Templeton</strong> 2025 Retirement Target Fund . . . . . . . 68<br />
<strong>Franklin</strong> <strong>Templeton</strong> 2035 Retirement Target Fund . . . . . . . 69<br />
<strong>Franklin</strong> <strong>Templeton</strong> 2045 Retirement Target Fund . . . . . . . 69<br />
FIXED INCOME<br />
<strong>Franklin</strong> Adjustable U.S. Government Securities Fund . . . . 70<br />
<strong>Franklin</strong> Floating Rate Daily Access Fund . . . . . . . . . . . . . 71<br />
<strong>Franklin</strong> High Income Fund . . . . . . . . . . . . . . . . . . . . . . . 72<br />
<strong>Franklin</strong> Limited Maturity<br />
U.S. Government Securities Fund . . . . . . . . . . . . . . . . . . 73<br />
<strong>Franklin</strong> Low Duration Total Return Fund . . . . . . . . . . . . . 74<br />
<strong>Franklin</strong> Real Return Fund . . . . . . . . . . . . . . . . . . . . . . . 75<br />
<strong>Franklin</strong> Strategic Income Fund . . . . . . . . . . . . . . . . . . . . 76<br />
<strong>Franklin</strong> Strategic Mortgage Portfolio . . . . . . . . . . . . . . . . 77<br />
<strong>Franklin</strong> Total Return Fund . . . . . . . . . . . . . . . . . . . . . . . 78<br />
<strong>Franklin</strong> U.S. Government Securities Fund . . . . . . . . . . . . 79<br />
<strong>Franklin</strong> <strong>Templeton</strong> Hard Currency Fund . . . . . . . . . . . . . . 80<br />
<strong>Templeton</strong> Global Bond Fund . . . . . . . . . . . . . . . . . . . . . . 81<br />
<strong>Templeton</strong> Global Total Return Fund . . . . . . . . . . . . . . . . . 82<br />
<strong>Templeton</strong> International Bond Fund . . . . . . . . . . . . . . . . . 83<br />
<strong>Franklin</strong> Money Fund . . . . . . . . . . . . . . . . . . . . . . . . . . . 84<br />
WHOLESALER LISTINGS<br />
Separate Accounts . . . . . . . . . . . . . . . . . . . . . . . . . . 131<br />
Offshore Products . . . . . . . . . . . . . . . . . . . . . . . . . . 131<br />
Retirement Division . . . . . . . . . . . . . . . . . . . . . . . . . 131<br />
Independent and Bank Division . . . . . . . . . . . . . . . . 132<br />
NYSE Division . . . . . . . . . . . . . . . . . . . . . . . . . . . . . . 134<br />
Contact Us<br />
Telephone Numbers and Mailing Addresses . . . . . . . 136
TAX-FREE INCOME<br />
National<br />
<strong>Franklin</strong> Double Tax-Free Income Fund . . . . . . . . . . . . . . . . 85<br />
<strong>Franklin</strong> Federal Tax-Free Income Fund . . . . . . . . . . . . . . . . 85<br />
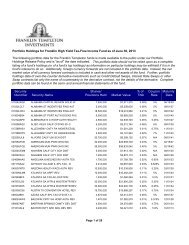
<strong>Franklin</strong> High Yield Tax-Free Income Fund . . . . . . . . . . . . . 86<br />
<strong>Franklin</strong> Insured Tax-Free Income Fund . . . . . . . . . . . . . . . 86<br />
Intermediate-/Limited-Term<br />
<strong>Franklin</strong> California Intermediate-Term Tax-Free Income Fund 87<br />
<strong>Franklin</strong> Federal Intermediate-Term Tax-Free Income Fund . . 87<br />
<strong>Franklin</strong> Federal Limited-Term Tax-Free Income Fund . . . . . 88<br />
<strong>Franklin</strong> New York Intermediate-Term Tax-Free Income Fund 88<br />
State<br />
<strong>Franklin</strong> Alabama Tax-Free Income Fund . . . . . . . . . . . . . . . 89<br />
<strong>Franklin</strong> Arizona Tax-Free Income Fund . . . . . . . . . . . . . . . . 89<br />
<strong>Franklin</strong> California High Yield Municipal Fund . . . . . . . . . . . 90<br />
<strong>Franklin</strong> California Insured Tax-Free Income Fund . . . . . . . . 90<br />
<strong>Franklin</strong> California Tax-Free Income Fund . . . . . . . . . . . . . . 91<br />
<strong>Franklin</strong> Colorado Tax-Free Income Fund . . . . . . . . . . . . . . . 91<br />
<strong>Franklin</strong> Connecticut Tax-Free Income Fund . . . . . . . . . . . . 92<br />
<strong>Franklin</strong> Florida Tax-Free Income Fund . . . . . . . . . . . . . . . . 92<br />
<strong>Franklin</strong> Georgia Tax-Free Income Fund . . . . . . . . . . . . . . . 93<br />
<strong>Franklin</strong> Kentucky Tax-Free Income Fund . . . . . . . . . . . . . . 93<br />
<strong>Franklin</strong> Louisiana Tax-Free Income Fund . . . . . . . . . . . . . . 94<br />
<strong>Franklin</strong> Maryland Tax-Free Income Fund . . . . . . . . . . . . . . 94<br />
<strong>Franklin</strong> Massachusetts Tax-Free Income Fund . . . . . . . . . . 95<br />
<strong>Franklin</strong> Michigan Tax-Free Income Fund . . . . . . . . . . . . . . 95<br />
<strong>Franklin</strong> Minnesota Tax-Free Income Fund . . . . . . . . . . . . . 96<br />
<strong>Franklin</strong> Missouri Tax-Free Income Fund . . . . . . . . . . . . . . . 96<br />
<strong>Franklin</strong> New Jersey Tax-Free Income Fund . . . . . . . . . . . . . 97<br />
<strong>Franklin</strong> New York Insured Tax-Free Income Fund . . . . . . . . 97<br />
<strong>Franklin</strong> New York Tax-Free Income Fund . . . . . . . . . . . . . . 98<br />
<strong>Franklin</strong> North Carolina Tax-Free Income Fund . . . . . . . . . . 98<br />
<strong>Franklin</strong> Ohio Tax-Free Income Fund . . . . . . . . . . . . . . . . . . 99<br />
<strong>Franklin</strong> Oregon Tax-Free Income Fund . . . . . . . . . . . . . . . . 99<br />
<strong>Franklin</strong> Pennsylvania Tax-Free Income Fund . . . . . . . . . . 100<br />
<strong>Franklin</strong> Tennessee Municipal Bond Fund . . . . . . . . . . . . . 100<br />
<strong>Franklin</strong> Virginia Tax-Free Income Fund . . . . . . . . . . . . . . 101<br />
<strong>Franklin</strong> California Tax-Exempt Money Fund . . . . . . . . . . . 102<br />
CLOSED <strong>Franklin</strong> New York Tax-Exempt Money Fund . . . . . . . . . . . 102<br />
<strong>Franklin</strong> Tax-Exempt Money Fund . . . . . . . . . . . . . . . . . . . 102<br />
The enclosed material is authorized for <strong>Dealer</strong> Use Only and shall not be distributed<br />
to the public. To order fund-specific sales and marketing tools, please call Sales and<br />
Marketing Services at (800) 223-2141.<br />
NOT FDIC INSURED | MAY LOSE VALUE | NO BANK GUARANTEE<br />
JUNE 30, 2009<br />
VARIABLE INSURANCE FUND PROFILES<br />
Trust Profile . . . . . . . . . . . . . . . . . . . . . . . . . . . . . . . . . . . 103<br />
VALUE<br />
<strong>Franklin</strong> Large Cap Value Securities Fund . . . . . . . . . . . . . . 103<br />
<strong>Franklin</strong> Small Cap Value Securities Fund . . . . . . . . . . . . . 104<br />
Mutual Shares Securities Fund . . . . . . . . . . . . . . . . . . . . . 104<br />
BLEND<br />
<strong>Franklin</strong> Rising Dividends Securities Fund . . . . . . . . . . . . . 105<br />
GROWTH<br />
<strong>Franklin</strong> Flex Cap Growth Securities Fund . . . . . . . . . . . . . 105<br />
<strong>Franklin</strong> Large Cap Growth Securities Fund . . . . . . . . . . . . 106<br />
<strong>Franklin</strong> Small-Mid Cap Growth Securities Fund . . . . . . . . . 106<br />
SECTOR<br />
<strong>Franklin</strong> Global Real Estate Securities Fund . . . . . . . . . . . . 107<br />
GLOBAL<br />
Mutual Global Discovery Securities Fund . . . . . . . . . . . . . . 107<br />
<strong>Templeton</strong> Global Asset Allocation Fund . . . . . . . . . . . . . . . 108<br />
<strong>Templeton</strong> Growth Securities Fund . . . . . . . . . . . . . . . . . . . 108<br />
INTERNATIONAL<br />
NEW Mutual International Securities Fund . . . . . . . . . . . . . . . . .109<br />
<strong>Templeton</strong> Developing Markets Securities Fund . . . . . . . . . . . 109<br />
<strong>Templeton</strong> Foreign Securities Fund . . . . . . . . . . . . . . . . . . 110<br />
HYBRID<br />
<strong>Franklin</strong> Growth and Income Securities Fund . . . . . . . . . . . 110<br />
<strong>Franklin</strong> Income Securities Fund . . . . . . . . . . . . . . . . . . . . 111<br />
ASSET ALLOCATION<br />
<strong>Franklin</strong> <strong>Templeton</strong> VIP Founding Funds Allocation Fund . . . . 111<br />
FIXED INCOME<br />
<strong>Franklin</strong> High Income Securities Fund . . . . . . . . . . . . . . . . 112<br />
<strong>Franklin</strong> Strategic Income Securities Fund . . . . . . . . . . . . . 112<br />
<strong>Franklin</strong> U.S. Government Fund . . . . . . . . . . . . . . . . . . . . . 113<br />
<strong>Franklin</strong> Zero Coupon Fund – 2010 . . . . . . . . . . . . . . . . . . 113<br />
<strong>Templeton</strong> Global Bond Securities Fund . . . . . . . . . . . . . . . 114<br />
SEPARATE ACCOUNTS STRATEGY PROFILES<br />
Availability Chart . . . . . . . . . . . . . . . . . . . . . . . . . . . . . . . 115<br />
<strong>Franklin</strong> Portfolio Advisors<br />
All Cap Growth . . . . . . . . . . . . . . . . . . . . . . . . . . . . . . . . . 116<br />
Intermediate Fixed Income . . . . . . . . . . . . . . . . . . . . . . . . 116<br />
Intermediate Municipal Fixed Income . . . . . . . . . . . . . . . . 117<br />
Mid Cap Growth . . . . . . . . . . . . . . . . . . . . . . . . . . . . . . . . 117<br />
Multi Strategy Municipal Fixed Income . . . . . . . . . . . . . . . 118<br />
Small Cap Growth . . . . . . . . . . . . . . . . . . . . . . . . . . . . . . . 118<br />
<strong>Templeton</strong> Portfolio Advisors<br />
Global Equity . . . . . . . . . . . . . . . . . . . . . . . . . . . . . . . . . . 119<br />
International Equity . . . . . . . . . . . . . . . . . . . . . . . . . . . . . 119<br />
Disclosures . . . . . . . . . . . . . . . . . . . . . . . . . . . . . . . . . . . 120
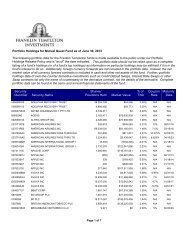
PERFORMANCE SUMMARY<br />
Performance Summary<br />
Ongoing market volatility can dramatically impact the fund’s short-term<br />
performance. Call (800) 342-5236 or go to franklintempleton.com for the<br />
most recent month-end performance.<br />
OPEN-END FUNDS<br />
VALUE<br />
This material is for dealer use only and has not been filed with FINRA for use with the public.<br />
AVERAGE ANNUAL TOTAL RETURN AVERAGE ANNUAL TOTAL RETURN<br />
WITHOUT SALES CHARGES 5 WITH SALES CHARGES 6<br />
Symbol Inception 1 1-Year 5-Year 10-Year Inception 1-Year 5-Year 10-Year Inception<br />
6/30/09<br />
<strong>Franklin</strong> All Cap Value–A 9 FRAVX 6/1/07 13<br />
<strong>Franklin</strong> All Cap Value–C 9 — 6/1/07 13<br />
<strong>Franklin</strong> All Cap Value–ADV9 — 6/1/07 13<br />
<strong>Franklin</strong> Balance Sheet Investment–A 13, 20 FRBSX 4/2/90 14<br />
<strong>Franklin</strong> Balance Sheet Investment–C 13 FCBSX 3/1/01 14<br />
<strong>Franklin</strong> Balance Sheet Investment–ADV13, 43 FBSAX 4/2/90 14<br />
<strong>Franklin</strong> Large Cap Value–A 13 FLVAX 6/1/00 15<br />
<strong>Franklin</strong> Large Cap Value–C 13 FLCVX 6/1/00 15<br />
<strong>Franklin</strong> Large Cap Value–ADV13, 43 — 6/1/00 15<br />
<strong>Franklin</strong> MicroCap Value–A 13, 46 FRMCX 12/12/95 16<br />
<strong>Franklin</strong> MicroCap Value–ADV13, 43 FVRMX 12/12/95 16<br />
<strong>Franklin</strong> MidCap Value–A 9 FMVAX 7/1/05 17<br />
<strong>Franklin</strong> MidCap Value–C 9 FMVCX 7/1/05 17<br />
<strong>Franklin</strong> MidCap Value–ADV9 — 7/1/05 17<br />
<strong>Franklin</strong> Small Cap Value–A 13, 46 FRVLX 3/11/96 18<br />
<strong>Franklin</strong> Small Cap Value–C 13 FRVFX 9/3/96 18<br />
<strong>Franklin</strong> Small Cap Value–ADV13, 43 FVADX 3/11/96 18<br />
Mutual Beacon–A 13, 18, 23 TEBIX 6/29/62 19<br />
Mutual Beacon–C 13, 18, 23 TEMEX 6/29/62 19<br />
Mutual Beacon–Z13, 18, 23 BEGRX 6/29/62 19<br />
Mutual Quest–A 13, 23, 80 TEQIX 9/26/80 20<br />
Mutual Quest–C 13, 23, 80 TEMQX 9/26/80 20<br />
Mutual Quest–Z13, 23, 80 MQIFX 9/26/80 20<br />
Mutual Recovery–A 77 FMRAX 6/2/03 21<br />
Mutual Recovery–C 77 FCMRX 6/2/03 21<br />
Mutual Recovery–ADV77 FMRVX 6/2/03 21<br />
Mutual Shares–A 13, 23, 34 TESIX 7/1/49 22<br />
Mutual Shares–C 13, 23, 34 TEMTX 7/1/49 22<br />
Mutual Shares–Z13, 23, 34 BLEND<br />
MUTHX 7/1/49 22<br />
<strong>Franklin</strong> Focused Core Equity–A 9 — 12/13/07 23<br />
<strong>Franklin</strong> Focused Core Equity–C 9 — 12/13/07 23<br />
<strong>Franklin</strong> Focused Core Equity–ADV9 — 12/13/07 23<br />
<strong>Franklin</strong> Large Cap Equity–A 9, 63 — 12/11/98 24<br />
<strong>Franklin</strong> Large Cap Equity–C 9, 63 — 12/11/98 24<br />
<strong>Franklin</strong> Large Cap Equity–ADV9, 63 FLCIX 12/11/98 24<br />
<strong>Franklin</strong> Rising Dividends–A 13, 46 FRDPX 1/14/87 25<br />
<strong>Franklin</strong> Rising Dividends–C 13 FRDTX 5/1/95 25<br />
<strong>Franklin</strong> Rising Dividends–ADV13, 43 GROWTH<br />
FRDAX 1/14/87 25<br />
<strong>Franklin</strong> Flex Cap Growth–A 13, 62 FKCGX 10/30/91 26<br />
<strong>Franklin</strong> Flex Cap Growth–C 13, 62 FCIIX 9/3/96 26<br />
<strong>Franklin</strong> Flex Cap Growth–ADV13, 43, 62 -27.89% —% —% -20.52% -32.02% —% —% -22.75%<br />
-28.47 — — -21.06 -29.19 — — -21.06<br />
-27.70 — — -20.25 -27.70 — — -20.25<br />
-31.62 -2.08 4.64 9.43 -35.55 -3.23 4.03 9.10<br />
-32.20 -2.83 — 2.85 -32.85 -2.83 — 2.85<br />
-30.47 -1.56 5.00 9.63 -30.47 -1.56 5.00 9.63<br />
-28.38 -3.79 — 1.78 -32.52 -4.93 — 1.12<br />
-28.84 -4.43 — 1.13 -29.55 -4.43 — 1.13<br />
-28.12 -3.55 — 1.92 -28.12 -3.55 — 1.92<br />
-16.82 1.11 8.80 10.25 -21.59 -0.09 8.15 9.77<br />
-16.60 1.29 8.89 10.33 -16.60 1.29 8.89 10.33<br />
-27.20 — — -5.39 -31.37 — — -6.79<br />
-27.79 — — -6.04 -28.52 — — -6.04<br />
-27.06 — — -5.09 -27.06 — — -5.09<br />
-26.89 0.05 5.41 6.58 -31.10 -1.13 4.78 6.11<br />
-27.41 -0.64 4.69 5.41 -28.13 -0.64 4.69 5.41<br />
-26.68 0.36 5.75 6.99 -26.68 0.36 5.75 6.99<br />
-25.52 -1.08 2.90 7.41 -29.79 -2.25 2.29 7.28<br />
-26.01 -1.74 2.22 6.47 -26.72 -1.74 2.22 6.47<br />
-25.28 -0.75 3.25 7.93 -25.28 -0.75 3.25 7.93<br />
-13.79 4.86 5.83 13.13 -18.73 3.62 5.20 12.90<br />
-14.38 4.16 5.14 12.15 -15.16 4.16 5.14 12.15<br />
-13.50 5.21 6.19 13.67 -13.50 5.21 6.19 13.67<br />
-27.77 -2.44 — 1.07 -31.93 -3.59 — 0.09<br />
-28.31 -3.07 — 0.43 -29.02 -3.07 — 0.43<br />
-27.61 -2.11 — 1.42 -27.61 -2.11 — 1.42<br />
-23.79 -0.88 2.71 11.93 -28.17 -2.05 2.11 11.82<br />
-24.32 -1.54 2.04 10.27 -25.07 -1.54 2.04 10.27<br />
-23.55 -0.55 3.06 12.92 -23.55 -0.55 3.06 12.92<br />
-18.38 — — -22.85 -23.07 — — -25.74<br />
-19.04 — — -23.38 -19.84 — — -23.38<br />
-18.11 — — -22.56 -18.11 — — -22.56<br />
-29.23 -2.50 -2.28 -0.96 -33.30 -3.65 -2.86 -1.52<br />
-29.75 -3.24 -3.15 -1.83 -30.43 -3.24 -3.15 -1.83<br />
-29.04 -2.13 -1.82 -0.50 -29.04 -2.13 -1.82 -0.50<br />
-20.15 -2.28 2.90 7.74 -24.74 -3.43 2.29 7.46<br />
-20.74 -2.97 2.25 6.99 -21.52 -2.97 2.25 6.99<br />
-19.91 -2.09 3.00 7.79 -19.91 -2.09 3.00 7.79<br />
-24.21 -0.69 2.54 10.14 -28.56 -1.86 1.94 9.77<br />
-24.78 -1.44 1.78 5.64 -25.53 -1.44 1.78 5.64<br />
FKCAX 10/30/91 -24.00 -0.45 2.67 10.21 -24.00 -0.45 2.67 10.21 26<br />
Advisor Class and Class Z shares are only offered to certain eligible investors as stated in the prospectus.<br />
2 <strong>Dealer</strong> <strong>Facts</strong> <strong>Guide</strong> Go to franklintempleton.com or call (800) 223-2141 DEALER USE ONLY/NOT FOR DISTRIBUTION TO THE PUBLIC<br />
Fund<br />
Profile<br />
on<br />
Page
Performance Summary, cont’d.<br />
Ongoing market volatility can dramatically impact the fund’s short-term<br />
performance. Call (800) 342-5236 or go to franklintempleton.com for the<br />
most recent month-end performance.<br />
OPEN-END FUNDS<br />
GROWTH, cont’d.<br />
This material is for dealer use only and has not been filed with FINRA for use with the public.<br />
AVERAGE ANNUAL TOTAL RETURN AVERAGE ANNUAL TOTAL RETURN<br />
WITHOUT SALES CHARGES 5 WITH SALES CHARGES 6<br />
Symbol Inception 1 1-Year 5-Year 10-Year Inception 1-Year 5-Year 10-Year Inception<br />
6/30/09<br />
<strong>Franklin</strong> Growth–A47 FKGRX 3/31/48 27<br />
<strong>Franklin</strong> Growth–C FRGSX 5/1/95 27<br />
<strong>Franklin</strong> Growth–ADV 43 FCGAX 3/31/48 27<br />
<strong>Franklin</strong> Growth Opportunities–A 13 FGRAX 6/23/99 28<br />
<strong>Franklin</strong> Growth Opportunities–C 13 FKACX 6/23/99 28<br />
<strong>Franklin</strong> Growth Opportunities–ADV13 FRAAX 6/23/99 28<br />
<strong>Franklin</strong> Small Cap Growth–A 13 FSGRX 5/1/00 29<br />
<strong>Franklin</strong> Small Cap Growth–C 13 FCSGX 5/1/00 29<br />
<strong>Franklin</strong> Small Cap Growth–ADV13 FSSAX 5/1/00 29<br />
<strong>Franklin</strong> Small-Mid Cap Growth–A 13, 46, 52 FRSGX 2/14/92 30<br />
<strong>Franklin</strong> Small-Mid Cap Growth–C 13, 52 FRSIX 10/2/95 30<br />
<strong>Franklin</strong> Small-Mid Cap Growth–ADV13, 43, 52 SECTOR<br />
FSGAX 2/14/92 30<br />
<strong>Franklin</strong> Biotechnology Discovery–A13, 46 FBDIX 9/15/97 31<br />
<strong>Franklin</strong> DynaTech–A 47 FKDNX 1/1/68 32<br />
<strong>Franklin</strong> DynaTech–C FDYNX 9/16/96 32<br />
<strong>Franklin</strong> DynaTech–ADV 43 — 1/1/68 32<br />
<strong>Franklin</strong> Global Real Estate–A 9 FAGRX 6/16/06 33<br />
<strong>Franklin</strong> Global Real Estate–C 9 — 6/16/06 33<br />
<strong>Franklin</strong> Global Real Estate–ADV9 FVGRX 6/16/06 33<br />
<strong>Franklin</strong> Gold and Precious Metals–A 13, 42, 47 FKRCX 5/19/69 34<br />
<strong>Franklin</strong> Gold and Precious Metals–C 13, 42 FRGOX 5/1/95 34<br />
<strong>Franklin</strong> Gold and Precious Metals–ADV13, 42, 43 FGADX 5/19/69 34<br />
<strong>Franklin</strong> Natural Resources–A 13, 46 FRNRX 6/5/95 35<br />
<strong>Franklin</strong> Natural Resources–C 13 FNCRX 9/1/05 35<br />
<strong>Franklin</strong> Natural Resources–ADV13, 43 FNRAX 6/5/95 35<br />
<strong>Franklin</strong> Real Estate Securities–A 13, 46 FREEX 1/3/94 36<br />
<strong>Franklin</strong> Real Estate Securities–C 13 FRRSX 5/1/95 36<br />
<strong>Franklin</strong> Real Estate Securities–ADV13, 43 FRLAX 1/3/94 36<br />
<strong>Franklin</strong> Utilities–A 10 FKUTX 9/30/48 37<br />
<strong>Franklin</strong> Utilities–C FRUSX 5/1/95 37<br />
<strong>Franklin</strong> Utilities–ADV43 FRUAX 9/30/48 37<br />
Mutual Financial Services–A 13, 46 TFSIX 8/19/97 38<br />
Mutual Financial Services–C13 TMFSX 8/19/97 38<br />
Mutual Financial Services–Z13 GLOBAL<br />
TEFAX 8/19/97 38<br />
Mutual Global Discovery–A 13, 23, 92 TEDIX 12/31/92 39<br />
Mutual Global Discovery–C 13, 23, 92 TEDSX 12/31/92 39<br />
Mutual Global Discovery–Z13, 23, 92 MDISX 12/31/92 39<br />
<strong>Templeton</strong> Global Long-Short–A 13 TLSAX 7/31/01 40<br />
<strong>Templeton</strong> Global Long-Short–ADV13, 43 -20.65% -0.25% 0.02% 9.62% -25.21% -1.43% -0.57% 9.51%<br />
-21.21 -1.00 -0.73 5.02 -21.99 -1.00 -0.73 5.02<br />
-20.45 0.00 0.27 9.69 -20.45 0.00 0.27 9.69<br />
-25.97 1.83 3.36 4.13 -30.24 0.63 2.75 3.52<br />
-26.50 1.12 2.66 3.43 -27.24 1.12 2.66 3.43<br />
-25.71 2.14 3.68 4.46 -25.71 2.14 3.68 4.46<br />
-19.22 -3.03 — -0.37 -23.88 -4.17 — -1.01<br />
-19.78 -3.74 — -1.07 -20.57 -3.74 — -1.07<br />
-18.96 -2.78 — -0.08 -18.96 -2.78 — -0.08<br />
-26.12 -1.04 1.42 8.60 -30.37 -2.20 0.82 8.23<br />
-26.65 -1.78 0.66 4.50 -27.38 -1.78 0.66 4.50<br />
-25.94 -0.79 1.67 8.88 -25.94 -0.79 1.67 8.88<br />
-6.68 0.66 7.62 6.93 -12.04 -0.52 6.99 6.39<br />
-24.86 -0.82 0.52 7.77 -29.17 -1.99 -0.07 7.77<br />
-25.44 -1.57 -0.23 4.49 -26.11 -1.57 -0.23 4.49<br />
-24.68 -0.76 0.55 7.78 -24.68 -0.76 0.55 7.78<br />
-39.70 — — -17.96 -43.19 — — -19.55<br />
-40.20 — — -18.53 -40.76 — — -18.53<br />
-39.58 — — -17.70 -39.58 — — -17.70<br />
-21.04 18.18 16.51 6.35 -25.59 16.79 15.83 6.20<br />
-21.63 17.30 15.66 7.35 -22.41 17.30 15.66 7.35<br />
-20.84 18.46 16.80 6.53 -20.84 18.46 16.80 6.53<br />
-47.91 9.62 9.37 9.83 -50.91 8.32 8.72 9.36<br />
-48.29 — — -0.49 -48.77 — — -0.49<br />
-47.77 9.95 9.74 10.47 -47.77 9.95 9.74 10.47<br />
-46.80 -8.62 1.67 5.12 -49.87 -9.70 1.07 4.72<br />
-47.21 -9.30 0.91 4.21 -47.68 -9.30 0.91 4.21<br />
-46.69 -8.40 1.92 5.45 -46.69 -8.40 1.92 5.45<br />
-22.49 6.73 6.09 9.51 -25.77 5.81 5.62 9.43<br />
-22.85 6.22 5.56 7.26 -23.58 6.22 5.56 7.26<br />
-22.35 6.91 6.24 9.57 -22.35 6.91 6.24 9.57<br />
-20.31 -3.02 4.53 7.35 -24.91 -4.16 3.91 6.81<br />
-20.83 -3.68 3.83 6.64 -21.61 -3.68 3.83 6.64<br />
-20.04 -2.72 4.87 7.69 -20.04 -2.72 4.87 7.69<br />
-12.41 7.26 8.12 12.21 -17.44 6.00 7.48 11.80<br />
-13.06 6.52 7.40 11.46 -13.89 6.52 7.40 11.46<br />
-12.19 7.59 8.48 12.61 -12.19 7.59 8.48 12.61<br />
-25.29 -2.53 — -0.24 -29.60 -3.68 — -0.99<br />
— 7/31/01 -25.14 -2.23 — -0.05 -25.14 -2.23 — -0.05 40<br />
Advisor Class and Class Z shares are only offered to certain eligible investors as stated in the prospectus.<br />
DEALER USE ONLY/NOT FOR DISTRIBUTION TO THE PUBLIC Go to franklintempleton.com or call (800) 223-2141 <strong>Dealer</strong> <strong>Facts</strong> <strong>Guide</strong> 3<br />
Fund<br />
Profile<br />
on<br />
Page<br />
PERFORMANCE SUMMARY
PERFORMANCE SUMMARY<br />
Performance Summary, cont’d.<br />
Ongoing market volatility can dramatically impact the fund’s short-term<br />
performance. Call (800) 342-5236 or go to franklintempleton.com for the<br />
most recent month-end performance.<br />
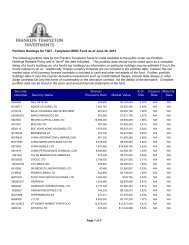
OPEN-END FUNDS<br />
GLOBAL, cont’d.<br />
AVERAGE ANNUAL TOTAL RETURN AVERAGE ANNUAL TOTAL RETURN<br />
WITHOUT SALES CHARGES 5 WITH SALES CHARGES 6<br />
Symbol Inception 1 1-Year 5-Year 10-Year Inception 1-Year 5-Year 10-Year Inception<br />
6/30/09<br />
<strong>Templeton</strong> Global Opportunities Trust–A 21 TEGOX 2/28/90 41<br />
<strong>Templeton</strong> Global Opportunities Trust–C TEGPX 5/1/95 41<br />
<strong>Templeton</strong> Global Opportunities Trust–ADV43 — 2/28/90 41<br />
<strong>Templeton</strong> Global Smaller Companies–A 21 TEMGX 6/1/81 42<br />
<strong>Templeton</strong> Global Smaller Companies–C TESGX 5/1/95 42<br />
<strong>Templeton</strong> Global Smaller Companies–ADV43 TGSAX 6/1/81 42<br />
<strong>Templeton</strong> Growth–A 21 TEPLX 11/29/54 43<br />
<strong>Templeton</strong> Growth–C TEGTX 5/1/95 43<br />
<strong>Templeton</strong> Growth–ADV43 TGADX 11/29/54 43<br />
<strong>Templeton</strong> World–A 21 TEMWX 1/17/78 44<br />
<strong>Templeton</strong> World–C TEWTX 5/1/95 44<br />
<strong>Templeton</strong> World–ADV 43 INTERNATIONAL<br />
TWADX 1/17/78 44<br />
<strong>Franklin</strong> India Growth–A9 — 1/31/08 45<br />
<strong>Franklin</strong> India Growth–C9 — 1/31/08 45<br />
<strong>Franklin</strong> India Growth–ADV9 FIGZX 1/31/08 45<br />
<strong>Franklin</strong> International Growth–A9 — 6/3/08 46<br />
<strong>Franklin</strong> International Growth–C9 — 6/3/08 46<br />
<strong>Franklin</strong> International Growth–ADV9 — 6/3/08 46<br />
<strong>Franklin</strong> International Small Cap Growth–A9 — 10/15/02 47<br />
<strong>Franklin</strong> International Small Cap Growth–C9 — 10/15/02 47<br />
<strong>Franklin</strong> International Small Cap Growth–ADV9 FKSCX 10/15/02 47<br />
Mutual European–A13, 23 TEMIX 7/3/96 48<br />
Mutual European–C13, 23 TEURX 7/3/96 48<br />
Mutual European–Z 13, 23 MEURX 7/3/96 48<br />
Mutual International–A 9 — 5/1/09 49<br />
Mutual International–C 9 — 5/1/09 49<br />
Mutual International–Z 9 — 5/1/09 49<br />
<strong>Templeton</strong> BRIC–A 13 TABRX 6/1/06 50<br />
<strong>Templeton</strong> BRIC–C 13 TPBRX 6/1/06 50<br />
<strong>Templeton</strong> BRIC–ADV13, 43 — 6/1/06 50<br />
<strong>Templeton</strong> China World–A 72 TCWAX 9/9/93 51<br />
<strong>Templeton</strong> China World–C 72 TCWCX 9/9/93 51<br />
<strong>Templeton</strong> China World–ADV72 TACWX 9/9/93 51<br />
<strong>Templeton</strong> Developing Markets Trust–A 13 TEDMX 10/16/91 52<br />
<strong>Templeton</strong> Developing Markets Trust–C 13 TDMTX 5/1/95 52<br />
<strong>Templeton</strong> Developing Markets Trust–ADV13, 43 TDADX 10/16/91 52<br />
<strong>Templeton</strong> Emerging Markets Small Cap–A 9 TEMMX 10/2/06 53<br />
<strong>Templeton</strong> Emerging Markets Small Cap–C 9 TCEMX 10/2/06 53<br />
<strong>Templeton</strong> Emerging Markets Small Cap–ADV9 — 10/2/06 53<br />
<strong>Templeton</strong> Foreign–A 21 TEMFX 10/5/82 54<br />
<strong>Templeton</strong> Foreign–C TEFTX 5/1/95 54<br />
<strong>Templeton</strong> Foreign–ADV43 -27.09% 3.76% 3.12% 7.63% -31.28% 2.54% 2.51% 7.30%<br />
-27.65 2.98 2.35 5.25 -28.35 2.98 2.35 5.25<br />
-27.09 3.76 3.12 7.63 -27.09 3.76 3.12 7.63<br />
-26.33 0.34 3.66 9.39 -30.56 -0.84 3.05 9.15<br />
-27.00 -0.44 2.89 4.02 -27.63 -0.44 2.89 4.02<br />
-26.17 0.58 3.93 9.53 -26.17 0.58 3.93 9.53<br />
-29.96 -2.23 2.29 12.34 -33.98 -3.38 1.68 12.22<br />
-30.52 -2.96 1.53 5.19 -31.20 -2.96 1.53 5.19<br />
-29.84 -1.99 2.54 12.42 -29.84 -1.99 2.54 12.42<br />
-25.00 1.27 2.31 11.68 -29.31 0.07 1.70 11.47<br />
-25.53 0.51 1.54 5.87 -26.24 0.51 1.54 5.87<br />
-24.78 1.43 2.39 11.71 -24.78 1.43 2.39 11.71<br />
3.59 — — -20.58 -2.43 — — -23.84<br />
2.88 — — -21.12 1.88 — — -21.12<br />
3.89 — — -20.33 3.89 — — -20.33<br />
-24.13 — — -29.32 -28.47 — — -33.11<br />
-24.61 — — -29.81 -25.36 — — -29.81<br />
-23.86 — — -29.08 -23.86 — — -29.08<br />
-14.27 11.07 — 17.33 -19.20 9.76 — 16.30<br />
-14.67 10.30 — 16.52 -15.23 10.30 — 16.52<br />
-14.19 11.44 — 17.73 -14.19 11.44 — 17.73<br />
-19.63 6.74 9.51 11.51 -24.25 5.49 8.87 11.00<br />
-20.21 6.01 8.80 10.82 -20.99 6.01 8.80 10.82<br />
-19.41 7.06 9.87 11.92 -19.41 7.06 9.87 11.92<br />
— — — 5.30 — — — -0.75<br />
— — — 5.10 — — — 4.10<br />
— — — 5.30 — — — 5.30<br />
-34.43 — — 2.50 -38.21 — — 0.55<br />
-34.81 — — 1.86 -35.46 — — 1.86<br />
-34.27 — — 2.58 -34.27 — — 2.58<br />
-9.08 15.45 13.97 8.40 -14.31 14.09 13.30 7.99<br />
-9.73 14.72 13.21 7.59 -10.52 14.72 13.21 7.59<br />
-8.82 15.84 14.38 8.83 -8.82 15.84 14.38 8.83<br />
-28.78 9.34 5.79 6.66 -32.86 8.05 5.16 6.30<br />
-29.30 8.56 5.07 5.02 -29.96 8.56 5.07 5.02<br />
-28.57 9.66 6.14 6.89 -28.57 9.66 6.14 6.89<br />
-23.71 — — -6.20 -28.09 — — -8.21<br />
-24.33 — — -6.83 -25.01 — — -6.83<br />
-23.52 — — -5.92 -23.52 — — -5.92<br />
-25.06 2.68 3.46 11.06 -29.37 1.47 2.85 10.81<br />
-25.70 1.90 2.69 4.97 -26.19 1.90 2.69 4.97<br />
TFFAX 10/5/82 -25.00 2.89 3.69 11.21 -25.00 2.89 3.69 11.21 54<br />
Advisor Class and Class Z shares are only offered to certain eligible investors as stated in the prospectus.<br />
This material is for dealer use only and has not been filed with FINRA for use with the public.<br />
4 <strong>Dealer</strong> <strong>Facts</strong> <strong>Guide</strong> Go to franklintempleton.com or call (800) 223-2141 DEALER USE ONLY/NOT FOR DISTRIBUTION TO THE PUBLIC<br />
Fund<br />
Profile<br />
on<br />
Page
Performance Summary, cont’d.<br />
Ongoing market volatility can dramatically impact the fund’s short-term<br />
performance. Call (800) 342-5236 or go to franklintempleton.com for the<br />
most recent month-end performance.<br />
OPEN-END FUNDS<br />
INTERNATIONAL, cont’d.<br />
This material is for dealer use only and has not been filed with FINRA for use with the public.<br />
AVERAGE ANNUAL TOTAL RETURN AVERAGE ANNUAL TOTAL RETURN<br />
WITHOUT SALES CHARGES 5 WITH SALES CHARGES 6<br />
Symbol Inception 1 1-Year 5-Year 10-Year Inception 1-Year 5-Year 10-Year Inception<br />
6/30/09<br />
<strong>Templeton</strong> Foreign Smaller Companies–A 13, 31 FINEX 9/20/91 55<br />
<strong>Templeton</strong> Foreign Smaller Companies–C 13, 31 FCFSX 7/1/98 55<br />
<strong>Templeton</strong> Foreign Smaller Companies–ADV13, 31, 43 FTFAX 9/20/91 55<br />
<strong>Templeton</strong> Frontier Markets–A 9 — 10/14/08 56<br />
<strong>Templeton</strong> Frontier Markets–C 9 — 10/14/08 56<br />
<strong>Templeton</strong> Frontier Markets–ADV9 HYBRID<br />
— 10/14/08 56<br />
<strong>Franklin</strong> Balanced–A 9 FBLAX 7/3/06 57<br />
<strong>Franklin</strong> Balanced–C 9 FBMCX 7/3/06 57<br />
<strong>Franklin</strong> Balanced–ADV9 — 7/3/06 57<br />
<strong>Franklin</strong> Convertible Securities–A 13, 47 FISCX 4/15/87 58<br />
<strong>Franklin</strong> Convertible Securities–C 13 FROTX 10/2/95 58<br />
<strong>Franklin</strong> Convertible Securities–ADV13, 43 — 4/15/87 58<br />
<strong>Franklin</strong> Equity Income–A 13, 47 FISEX 3/15/88 59<br />
<strong>Franklin</strong> Equity Income–C 13 FRETX 10/2/95 59<br />
<strong>Franklin</strong> Equity Income–ADV13, 43 — 3/15/88 59<br />
<strong>Franklin</strong> Income–A 10 FKINX 8/31/48 60<br />
<strong>Franklin</strong> Income–C FCISX 5/1/95 60<br />
<strong>Franklin</strong> Income–ADV43 FRIAX 8/31/48 60<br />
<strong>Templeton</strong> Income–A 9 TINCX 7/1/05 61<br />
<strong>Templeton</strong> Income–C 9 TCINX 7/1/05 61<br />
<strong>Templeton</strong> Income–ADV9 ASSET ALLOCATION<br />
TZINX 7/1/05 61<br />
<strong>Franklin</strong> <strong>Templeton</strong> Corefolio Allocation–A9 FTCOX 8/15/03 62<br />
<strong>Franklin</strong> <strong>Templeton</strong> Corefolio Allocation–C 9 FTCLX 8/15/03 62<br />
<strong>Franklin</strong> <strong>Templeton</strong> Corefolio Allocation–ADV9 — 8/15/03 62<br />
<strong>Franklin</strong> <strong>Templeton</strong> Founding Funds Allocation–A 9 FFALX 8/15/03 63<br />
<strong>Franklin</strong> <strong>Templeton</strong> Founding Funds Allocation–C 9 FFACX 8/15/03 63<br />
<strong>Franklin</strong> <strong>Templeton</strong> Founding Funds Allocation–ADV9 FFAAX 8/15/03 63<br />
<strong>Franklin</strong> <strong>Templeton</strong> Perspectives Allocation–A 9 FPAAX 8/2/04 64<br />
<strong>Franklin</strong> <strong>Templeton</strong> Perspectives Allocation–C 9 FPCAX 8/2/04 64<br />
<strong>Franklin</strong> <strong>Templeton</strong> Perspectives Allocation–ADV9 — 8/2/04 64<br />
<strong>Franklin</strong> <strong>Templeton</strong> Conservative Target–A 9, 46 FTCIX 12/31/96 65<br />
<strong>Franklin</strong> <strong>Templeton</strong> Conservative Target–C 9 FTCCX 12/31/96 65<br />
<strong>Franklin</strong> <strong>Templeton</strong> Conservative Target–ADV9, 43 — 12/31/96 65<br />
<strong>Franklin</strong> <strong>Templeton</strong> Moderate Target–A 9, 46 FMTIX 12/31/96 66<br />
<strong>Franklin</strong> <strong>Templeton</strong> Moderate Target–C 9 FTMTX 12/31/96 66<br />
<strong>Franklin</strong> <strong>Templeton</strong> Moderate Target–ADV9, 43 FMTZX 12/31/96 66<br />
<strong>Franklin</strong> <strong>Templeton</strong> Growth Target–A 9, 46 FGTIX 12/31/96 67<br />
<strong>Franklin</strong> <strong>Templeton</strong> Growth Target–C 9 FTGTX 12/31/96 67<br />
<strong>Franklin</strong> <strong>Templeton</strong> Growth Target–ADV9, 43 FGTZX 12/31/96 67<br />
<strong>Franklin</strong> <strong>Templeton</strong> 2015 Retirement Target–A 9 FTRAX 8/1/06 68<br />
<strong>Franklin</strong> <strong>Templeton</strong> 2015 Retirement Target–C 9 — 8/1/06 68<br />
<strong>Franklin</strong> <strong>Templeton</strong> 2015 Retirement Target–ADV9 -28.77% 1.10% 4.27% 6.87% -32.86% -0.09% 3.66% 6.51%<br />
-29.35 0.34 3.47 3.42 -29.94 0.34 3.47 3.42<br />
-28.66 1.33 4.53 7.09 -28.66 1.33 4.53 7.09<br />
— — — 20.90 — — — 13.95<br />
— — — 20.30 — — — 19.30<br />
— — — 21.10 — — — 21.10<br />
-18.53 — — -4.18 -23.19 — — -6.06<br />
-19.16 — — -4.83 -19.93 — — -4.83<br />
-18.36 — — -3.88 -18.36 — — -3.88<br />
-19.13 0.25 4.97 8.13 -23.76 -0.93 4.36 7.84<br />
-19.73 -0.49 4.20 5.55 -20.48 -0.49 4.20 5.55<br />
-18.91 0.32 5.01 8.15 -18.91 0.32 5.01 8.15<br />
-24.49 -3.73 -0.10 7.09 -28.84 -4.86 -0.69 6.79<br />
-25.03 -4.43 -0.84 3.35 -25.75 -4.43 -0.84 3.35<br />
-24.23 -3.66 -0.06 7.11 -24.23 -3.66 -0.06 7.11<br />
-17.12 2.14 5.51 10.29 -20.79 1.29 5.07 10.21<br />
-17.83 1.52 4.95 6.41 -18.59 1.52 4.95 6.41<br />
-17.07 2.30 5.64 10.34 -17.07 2.30 5.64 10.34<br />
-9.23 — — 3.16 -13.05 — — 2.06<br />
-9.25 — — 2.81 -10.07 — — 2.81<br />
-9.32 — — 3.38 -9.32 — — 3.38<br />
-24.91 -1.81 — 0.89 -29.22 -2.97 — -0.12<br />
-25.45 -2.46 — 0.21 -26.19 -2.46 — 0.21<br />
-24.72 -1.50 — 1.19 -24.72 -1.50 — 1.19<br />
-23.92 -0.60 — 1.83 -28.30 -1.76 — 0.80<br />
-24.43 -1.25 — 1.16 -25.14 -1.25 — 1.16<br />
-23.71 -0.29 — 2.17 -23.71 -0.29 — 2.17<br />
-26.08 — — -0.79 -30.31 — — -1.97<br />
-26.53 — — -1.43 -27.26 — — -1.43<br />
-25.88 — — -0.46 -25.88 — — -0.46<br />
-6.24 3.76 4.93 5.43 -11.66 2.54 4.31 4.93<br />
-6.90 3.01 4.16 4.62 -7.81 3.01 4.16 4.62<br />
-6.02 3.94 5.02 5.50 -6.02 3.94 5.02 5.50<br />
-10.07 3.53 4.60 5.22 -15.24 2.32 3.98 4.72<br />
-10.67 2.76 3.83 4.38 -11.54 2.76 3.83 4.38<br />
-9.85 3.73 4.70 5.30 -9.85 3.73 4.70 5.30<br />
-17.43 2.38 3.46 4.42 -22.20 1.19 2.85 3.93<br />
-18.07 1.62 2.69 3.66 -18.88 1.62 2.69 3.66<br />
-17.26 2.56 3.55 4.50 -17.26 2.56 3.55 4.50<br />
-12.51 — — -0.88 -17.51 — — -2.88<br />
-13.13 — — -1.57 -13.98 — — -1.57<br />
— 8/1/06 -12.23 — — -0.56 -12.23 — — -0.56 68<br />
Advisor Class and Class Z shares are only offered to certain eligible investors as stated in the prospectus.<br />
DEALER USE ONLY/NOT FOR DISTRIBUTION TO THE PUBLIC Go to franklintempleton.com or call (800) 223-2141 <strong>Dealer</strong> <strong>Facts</strong> <strong>Guide</strong> 5<br />
Fund<br />
Profile<br />
on<br />
Page<br />
PERFORMANCE SUMMARY
PERFORMANCE SUMMARY<br />
Performance Summary, cont’d.<br />
Ongoing market volatility can dramatically impact the fund’s short-term<br />
performance. Call (800) 342-5236 or go to franklintempleton.com for the<br />
most recent month-end performance.<br />
OPEN-END FUNDS<br />
ASSET ALLOCATION, cont’d.<br />
This material is for dealer use only and has not been filed with FINRA for use with the public.<br />
AVERAGE ANNUAL TOTAL RETURN AVERAGE ANNUAL TOTAL RETURN<br />
WITHOUT SALES CHARGES 5 WITH SALES CHARGES 6<br />
Symbol Inception 1 1-Year 5-Year 10-Year Inception 1-Year 5-Year 10-Year Inception<br />
6/30/09<br />
<strong>Franklin</strong> <strong>Templeton</strong> 2025 Retirement Target–A 9 FTRTX 8/1/06 68<br />
<strong>Franklin</strong> <strong>Templeton</strong> 2025 Retirement Target–C 9 — 8/1/06 68<br />
<strong>Franklin</strong> <strong>Templeton</strong> 2025 Retirement Target–ADV9 — 8/1/06 68<br />
<strong>Franklin</strong> <strong>Templeton</strong> 2035 Retirement Target–A 9 — 8/1/06 69<br />
<strong>Franklin</strong> <strong>Templeton</strong> 2035 Retirement Target–C 9 — 8/1/06 69<br />
<strong>Franklin</strong> <strong>Templeton</strong> 2035 Retirement Target–ADV9 — 8/1/06 69<br />
<strong>Franklin</strong> <strong>Templeton</strong> 2045 Retirement Target–A 9 — 8/1/06 69<br />
<strong>Franklin</strong> <strong>Templeton</strong> 2045 Retirement Target–C 9 — 8/1/06 69<br />
<strong>Franklin</strong> <strong>Templeton</strong> 2045 Retirement Target–ADV9 FIXED INCOME<br />
— 8/1/06 69<br />
<strong>Franklin</strong> Adjustable U.S. Government Securities–A 13 FISAX 10/20/87 70<br />
<strong>Franklin</strong> Adjustable U.S. Government Securities–C 13 FCSCX 7/1/03 70<br />
<strong>Franklin</strong> Adjustable U.S. Government Securities–ADV13, 43 — 10/20/87 70<br />
<strong>Franklin</strong> Floating Rate Daily Access–A13 FAFRX 5/1/01 71<br />
<strong>Franklin</strong> Floating Rate Daily Access–C 13 FCFRX 5/1/01 71<br />
<strong>Franklin</strong> Floating Rate Daily Access–ADV13 FDAAX 5/1/01 71<br />
<strong>Franklin</strong> High Income–A 10 FHAIX 12/31/69 72<br />
<strong>Franklin</strong> High Income–C FCHIX 5/16/95 72<br />
<strong>Franklin</strong> High Income–ADV43 FVHIX 12/31/69 72<br />
<strong>Franklin</strong> Limited Maturity U.S. Gov’t. Securities–A 33, 78 FRGVX 4/15/87 73<br />
<strong>Franklin</strong> Limited Maturity U.S. Gov’t. Securities–ADV33, 43, 78 FSUAX 4/15/87 73<br />
<strong>Franklin</strong> Low Duration Total Return–A 9 FLDAX 11/17/04 74<br />
<strong>Franklin</strong> Low Duration Total Return–ADV9, 43 — 11/17/04 74<br />
<strong>Franklin</strong> Real Return–A 9 FRRAX 11/17/04 75<br />
<strong>Franklin</strong> Real Return–C9 — 11/17/04 75<br />
<strong>Franklin</strong> Real Return–ADV9 FARRX 11/17/04 75<br />
<strong>Franklin</strong> Strategic Income–A 13 FRSTX 5/24/94 76<br />
<strong>Franklin</strong> Strategic Income–C 13 FSGCX 5/1/98 76<br />
<strong>Franklin</strong> Strategic Income–ADV13, 43 FKSAX 5/24/94 76<br />
<strong>Franklin</strong> Strategic Mortgage Portfolio FSMIX 2/1/93 77<br />
<strong>Franklin</strong> Total Return–A 9 FKBAX 8/3/98 78<br />
<strong>Franklin</strong> Total Return–C 9 FCTLX 3/1/02 78<br />
<strong>Franklin</strong> Total Return–ADV9 FBDAX 8/3/98 78<br />
<strong>Franklin</strong> U.S. Government Securities–A 10 FKUSX 5/31/70 79<br />
<strong>Franklin</strong> U.S. Government Securities–C FRUGX 5/1/95 79<br />
<strong>Franklin</strong> U.S. Government Securities–ADV 43 FUSAX 5/31/70 79<br />
<strong>Franklin</strong> <strong>Templeton</strong> Hard Currency–A13, 48, 58 ICPHX 11/17/89 80<br />
<strong>Franklin</strong> <strong>Templeton</strong> Hard Currency–ADV13, 43, 58 ICHHX 11/17/89 80<br />
<strong>Templeton</strong> Global Bond–A 12 TPINX 9/18/86 81<br />
<strong>Templeton</strong> Global Bond–C TEGBX 5/1/95 81<br />
<strong>Templeton</strong> Global Bond–ADV43 -18.10% —% —% -3.41% -22.79% —% —% -5.35%<br />
-18.69 — — -4.05 -19.48 — — -4.05<br />
-17.93 — — -3.16 -17.93 — — -3.16<br />
-21.35 — — -4.68 -25.88 — — -6.60<br />
-21.91 — — -5.37 -22.68 — — -5.37<br />
-21.12 — — -4.39 -21.12 — — -4.39<br />
-22.95 — — -5.26 -27.36 — — -7.17<br />
-23.56 — — -5.92 -24.30 — — -5.92<br />
-22.73 — — -4.95 -22.73 — — -4.95<br />
4.46 3.80 3.93 4.88 2.16 3.32 3.69 4.77<br />
3.93 3.37 — 2.84 2.93 3.37 — 2.84<br />
4.72 3.88 3.97 4.90 4.72 3.88 3.97 4.90<br />
-8.02 1.13 — 2.48 -10.12 0.68 — 2.19<br />
-8.38 0.74 — 2.08 -9.26 0.74 — 2.08<br />
-7.68 1.39 — 2.75 -7.68 1.39 — 2.75<br />
-3.62 4.21 4.37 7.55 -7.90 3.31 3.91 7.42<br />
-4.10 3.66 3.82 5.10 -4.97 3.66 3.82 5.10<br />
-3.51 4.36 4.51 7.60 -3.51 4.36 4.51 7.60<br />
6.96 4.19 4.60 5.71 4.58 3.73 4.36 5.61<br />
7.07 4.30 4.70 5.77 7.07 4.30 4.70 5.77<br />
4.80 — — 3.82 2.42 — — 3.31<br />
5.02 — — 3.87 5.02 — — 3.87<br />
-4.22 — — 4.51 -8.32 — — 3.54<br />
-4.86 — — 3.67 -5.79 — — 3.67<br />
-3.95 — — 4.77 -3.95 — — 4.77<br />
0.07 5.04 6.00 7.38 -4.17 4.14 5.55 7.07<br />
-0.33 4.63 5.59 5.11 -1.25 4.63 5.59 5.11<br />
0.32 5.30 6.27 7.56 0.32 5.30 6.27 7.56<br />
-0.89 2.53 4.64 5.42 -5.06 1.64 4.19 5.15<br />
2.06 3.62 5.25 5.03 -2.31 2.73 4.80 4.62<br />
1.66 3.23 — 4.14 0.71 3.23 — 4.14<br />
2.31 3.90 5.52 5.31 2.31 3.90 5.52 5.31<br />
7.49 5.02 5.50 6.93 2.86 4.12 5.03 6.81<br />
6.83 4.43 4.94 5.40 5.83 4.43 4.94 5.40<br />
7.61 5.14 5.65 6.98 7.61 5.14 5.65 6.98<br />
-5.80 4.94 4.68 4.56 -7.93 4.47 4.45 4.44<br />
-5.52 5.27 5.02 4.78 -5.52 5.27 5.02 4.78<br />
13.25 10.27 9.67 8.23 8.46 9.30 9.20 8.02<br />
12.78 9.81 9.23 8.13 11.78 9.81 9.23 8.13<br />
TGBAX 9/18/86 13.57 10.52 9.94 8.40 13.57 10.52 9.94 8.40 81<br />
Advisor Class and Class Z shares are only offered to certain eligible investors as stated in the prospectus.<br />
6 <strong>Dealer</strong> <strong>Facts</strong> <strong>Guide</strong> Go to franklintempleton.com or call (800) 223-2141 DEALER USE ONLY/NOT FOR DISTRIBUTION TO THE PUBLIC<br />
Fund<br />
Profile<br />
on<br />
Page
Performance Summary, cont’d.<br />
Ongoing market volatility can dramatically impact the fund’s short-term<br />
performance. Call (800) 342-5236 or go to franklintempleton.com for the<br />
most recent month-end performance.<br />
OPEN-END FUNDS<br />
FIXED INCOME, cont’d.<br />
AVERAGE ANNUAL TOTAL RETURN AVERAGE ANNUAL TOTAL RETURN<br />
WITHOUT SALES CHARGES 5 WITH SALES CHARGES 6<br />
Symbol Inception 1 1-Year 5-Year 10-Year Inception 1-Year 5-Year 10-Year Inception<br />
6/30/09<br />
<strong>Templeton</strong> Global Total Return–A 9 TGTRX 9/30/08 82<br />
<strong>Templeton</strong> Global Total Return–C 9 — 9/30/08 82<br />
<strong>Templeton</strong> Global Total Return–ADV9 — 9/30/08 82<br />
<strong>Templeton</strong> International Bond–A 9 TBOAX 12/3/07 83<br />
<strong>Templeton</strong> International Bond–C 9 — 12/3/07 83<br />
<strong>Templeton</strong> International Bond–ADV9 TAX-FREE INCOME<br />
National Funds<br />
— 12/3/07 83<br />
<strong>Franklin</strong> Double Tax-Free Income–A10, 61 FPRTX 4/3/85 85<br />
<strong>Franklin</strong> Double Tax-Free Income–C61 FPRIX 5/1/95 85<br />
<strong>Franklin</strong> Federal Tax-Free Income–A 10 FKTIX 10/7/83 85<br />
<strong>Franklin</strong> Federal Tax-Free Income–C FRFTX 5/1/95 85<br />
<strong>Franklin</strong> Federal Tax-Free Income–ADV43 FAFTX 10/7/83 85<br />
<strong>Franklin</strong> High Yield Tax-Free Income–A 10 FRHIX 3/18/86 86<br />
<strong>Franklin</strong> High Yield Tax-Free Income–C FHYIX 5/1/95 86<br />
<strong>Franklin</strong> High Yield Tax-Free Income–ADV43 FHYVX 3/18/86 86<br />
<strong>Franklin</strong> Insured Tax-Free Income–A 10 FTFIX 4/3/85 86<br />
<strong>Franklin</strong> Insured Tax-Free Income–C FRITX 5/1/95 86<br />
<strong>Franklin</strong> Insured Tax-Free Income–ADV43 Intermediate-/Limited-Term Funds<br />
— 4/3/85 86<br />
<strong>Franklin</strong> California Int-Term Tax-Free Income–A 13 FKCIX 9/21/92 87<br />
<strong>Franklin</strong> California Int-Term Tax-Free Income–C 13 FCCIX 7/1/03 87<br />
<strong>Franklin</strong> California Int-Term Tax-Free Income–ADV13, 43 — 9/21/92 87<br />
<strong>Franklin</strong> Federal Int-Term Tax-Free Income–A 13 FKITX 9/21/92 87<br />
<strong>Franklin</strong> Federal Int-Term Tax-Free Income–C 13 FCITX 7/1/03 87<br />
<strong>Franklin</strong> Federal Int-Term Tax-Free Income–ADV13, 43 — 9/21/92 87<br />
<strong>Franklin</strong> Federal Ltd.-Term Tax-Free Income–A9, 51 FFTFX 9/2/03 88<br />
<strong>Franklin</strong> New York Int-Term Tax-Free Income–A 13 FKNIX 9/21/92 88<br />
<strong>Franklin</strong> New York Int-Term Tax-Free Income–C 13 FKNCX 7/1/03 88<br />
<strong>Franklin</strong> New York Int-Term Tax-Free Income–ADV13, 43 State Funds<br />
— 9/21/92 88<br />
<strong>Franklin</strong> Alabama Tax-Free Income–A 10 FRALX 9/1/87 89<br />
<strong>Franklin</strong> Alabama Tax-Free Income–C FALEX 5/1/95 89<br />
<strong>Franklin</strong> Arizona Tax-Free Income–A 10 FTAZX 9/1/87 89<br />
<strong>Franklin</strong> Arizona Tax-Free Income–C FAZIX 5/1/95 89<br />
<strong>Franklin</strong> Arizona Tax-Free Income–ADV43 — 9/1/87 89<br />
<strong>Franklin</strong> California High Yield Municipal–A 12, 13 FCAMX 5/3/93 90<br />
<strong>Franklin</strong> California High Yield Municipal–C 13 FCAHX 5/1/96 90<br />
<strong>Franklin</strong> California High Yield Municipal–ADV13, 43 FVCAX 5/3/93 90<br />
<strong>Franklin</strong> California Insured Tax-Free Income–A 10, 13 FRCIX 9/3/85 90<br />
<strong>Franklin</strong> California Insured Tax-Free Income–C 13 FRCAX 5/1/95 90<br />
<strong>Franklin</strong> California Insured Tax-Free Income–ADV13, 43 — 9/3/85 90<br />
<strong>Franklin</strong> California Tax-Free Income–A 10 FKTFX 2/1/77 91<br />
<strong>Franklin</strong> California Tax-Free Income–C FRCTX 5/1/95 91<br />
<strong>Franklin</strong> California Tax-Free Income–ADV43 —% —% —% 15.78% —% —% —% 10.90%<br />
— — — 15.46 — — — 14.46<br />
— — — 16.01 — — — 16.01<br />
10.62 — — 7.49 5.91 — — 4.59<br />
10.26 — — 7.19 9.26 — — 7.19<br />
10.91 — — 7.80 10.91 — — 7.80<br />
-1.72 2.97 3.93 6.08 -5.91 2.08 3.48 5.89<br />
-2.25 2.42 3.37 4.11 -3.19 2.42 3.37 4.11<br />
1.25 3.72 4.35 7.00 -3.07 2.82 3.90 6.82<br />
0.60 3.12 3.77 4.40 -0.36 3.12 3.77 4.40<br />
1.33 3.81 4.43 7.03 1.33 3.81 4.43 7.03<br />
-3.53 2.74 3.57 6.15 -7.65 1.85 3.12 5.95<br />
-4.02 2.18 3.02 4.10 -4.93 2.18 3.02 4.10<br />
-3.33 2.82 3.61 6.17 -3.33 2.82 3.61 6.17<br />
1.10 3.38 4.35 6.48 -3.16 2.49 3.89 6.29<br />
0.54 2.83 3.78 4.27 -0.42 2.83 3.78 4.27<br />
1.12 3.38 4.35 6.48 1.12 3.38 4.35 6.48<br />
0.51 2.97 3.97 4.92 -1.76 2.50 3.73 4.78<br />
-0.05 2.42 — 2.03 -1.01 2.42 — 2.03<br />
0.57 2.98 3.97 4.93 0.57 2.98 3.97 4.93<br />
2.04 3.35 4.14 5.03 -0.27 2.88 3.91 4.89<br />
1.56 2.81 — 2.26 0.58 2.81 — 2.26<br />
2.28 3.40 4.16 5.05 2.28 3.40 4.16 5.05<br />
4.11 2.98 — 2.62 1.77 2.51 — 2.22<br />
3.37 3.24 4.33 4.90 1.01 2.77 4.09 4.76<br />
2.89 2.67 — 2.12 1.89 2.67 — 2.12<br />
3.52 3.27 4.34 4.91 3.52 3.27 4.34 4.91<br />
1.05 3.31 4.16 5.89 -3.22 2.42 3.71 5.68<br />
0.49 2.75 3.59 4.14 -0.48 2.75 3.59 4.14<br />
2.43 3.82 4.23 5.89 -1.92 2.91 3.78 5.67<br />
1.93 3.25 3.67 4.21 0.96 3.25 3.67 4.21<br />
2.72 3.88 4.26 5.90 2.72 3.88 4.26 5.90<br />
-7.31 1.49 3.16 4.53 -11.23 0.62 2.72 4.25<br />
-7.87 0.94 2.60 3.73 -8.75 0.94 2.60 3.73<br />
-7.21 1.57 3.20 4.56 -7.21 1.57 3.20 4.56<br />
-1.54 3.11 4.10 6.22 -5.72 2.22 3.65 6.03<br />
-2.15 2.55 3.53 4.20 -3.08 2.55 3.53 4.20<br />
-1.48 3.12 4.11 6.22 -1.48 3.12 4.11 6.22<br />
-1.46 3.34 4.14 5.57 -5.64 2.46 3.69 5.43<br />
-2.02 2.77 3.57 4.24 -2.95 2.77 3.57 4.24<br />
FCAVX 2/1/77 -1.38 3.44 4.20 5.59 -1.38 3.44 4.20 5.59 91<br />
Advisor Class and Class Z shares are only offered to certain eligible investors as stated in the prospectus.<br />
This material is for dealer use only and has not been filed with FINRA for use with the public.<br />
DEALER USE ONLY/NOT FOR DISTRIBUTION TO THE PUBLIC Go to franklintempleton.com or call (800) 223-2141 <strong>Dealer</strong> <strong>Facts</strong> <strong>Guide</strong> 7<br />
Fund<br />
Profile<br />
on<br />
Page<br />
PERFORMANCE SUMMARY
PERFORMANCE SUMMARY<br />
Performance Summary, cont’d.<br />
Ongoing market volatility can dramatically impact the fund’s short-term<br />
performance. Call (800) 342-5236 or go to franklintempleton.com for the most<br />
recent month-end performance.<br />
OPEN-END FUNDS<br />
TAX-FREE INCOME, cont’d.<br />
State Funds<br />
<strong>Franklin</strong> Colorado Tax-Free Income–A 10 FRCOX 9/1/87 91<br />
<strong>Franklin</strong> Colorado Tax-Free Income–C FCOIX 5/1/95 91<br />
<strong>Franklin</strong> Connecticut Tax-Free Income–A 10 FXCTX 10/3/88 92<br />
<strong>Franklin</strong> Connecticut Tax-Free Income–C FXCTX 5/1/95 92<br />
<strong>Franklin</strong> Florida Tax-Free Income–A 10 FRFLX 9/1/87 92<br />
<strong>Franklin</strong> Florida Tax-Free Income–C FRFIX 5/1/95 92<br />
<strong>Franklin</strong> Georgia Tax-Free Income–A 10 FTGAX 9/1/87 93<br />
<strong>Franklin</strong> Georgia Tax-Free Income–C FGAIX 5/1/95 93<br />
<strong>Franklin</strong> Kentucky Tax-Free Income–A 10, 13 FRKYX 10/12/91 93<br />
<strong>Franklin</strong> Louisiana Tax-Free Income–A 10 FKLAX 9/1/87 94<br />
<strong>Franklin</strong> Louisiana Tax-Free Income–C FLAIX 5/1/95 94<br />
<strong>Franklin</strong> Maryland Tax-Free Income–A 10 FMDTX 10/3/88 94<br />
<strong>Franklin</strong> Maryland Tax-Free Income–C FMDIX 5/1/95 94<br />
<strong>Franklin</strong> Massachusetts Tax-Free Income–A 10, 91 FMISX 4/3/85 95<br />
<strong>Franklin</strong> Massachusetts Tax-Free Income–C 91 FMAIX 5/1/95 95<br />
<strong>Franklin</strong> Michigan Tax-Free Income–A 10, 13, 91 FTTMX 4/3/85 95<br />
<strong>Franklin</strong> Michigan Tax-Free Income–C 13, 91 FRMTX 5/1/95 95<br />
<strong>Franklin</strong> Michigan Tax-Free Income–ADV13, 43, 91 — 4/3/85 95<br />
<strong>Franklin</strong> Minnesota Tax-Free Income–A 10, 91 FMINX 4/3/85 96<br />
<strong>Franklin</strong> Minnesota Tax-Free Income–C 91 FMNIX 5/1/95 96<br />
<strong>Franklin</strong> Missouri Tax-Free Income–A 10 FRMOX 9/1/87 96<br />
<strong>Franklin</strong> Missouri Tax-Free Income–C FMOIX 5/1/95 96<br />
<strong>Franklin</strong> New Jersey Tax-Free Income–A 10 FRNJX 5/12/88 97<br />
<strong>Franklin</strong> New Jersey Tax-Free Income–C FNIIX 5/1/95 97<br />
<strong>Franklin</strong> New Jersey Tax-Free Income–ADV43 — 5/12/88 97<br />
<strong>Franklin</strong> New York Insured Tax-Free Income–A 10, 13 FRNYX 5/1/91 97<br />
<strong>Franklin</strong> New York Insured Tax-Free Income–C 13 FNYKX 5/1/95 97<br />
<strong>Franklin</strong> New York Tax-Free Income–A 10 FNYTX 9/13/82 98<br />
<strong>Franklin</strong> New York Tax-Free Income–C FNYIX 5/1/95 98<br />
<strong>Franklin</strong> New York Tax-Free Income–ADV43 FNYAX 9/13/82 98<br />
<strong>Franklin</strong> North Carolina Tax-Free Income–A 10 FXNCX 9/1/87 98<br />
<strong>Franklin</strong> North Carolina Tax-Free Income–C FNCIX 5/1/95 98<br />
<strong>Franklin</strong> Ohio Tax-Free Income–A 10, 91 FTOIX 4/3/85 99<br />
<strong>Franklin</strong> Ohio Tax-Free Income–C 91 FOITX 5/1/95 99<br />
<strong>Franklin</strong> Ohio Tax-Free Income–ADV43, 91 — 4/3/85 99<br />
<strong>Franklin</strong> Oregon Tax-Free Income–A 10 FRORX 9/1/87 99<br />
<strong>Franklin</strong> Oregon Tax-Free Income–C FORIX 5/1/95 99<br />
<strong>Franklin</strong> Pennsylvania Tax-Free Income–A 10 FRPAX 12/1/86 100<br />
<strong>Franklin</strong> Pennsylvania Tax-Free Income–C FRPTX 5/1/95 100<br />
<strong>Franklin</strong> Tennessee Municipal Bond–A 9 FRTIX 5/10/94 100<br />
<strong>Franklin</strong> Virginia Tax-Free Income–A 10 1.47% 3.57% 4.30% 6.07% -2.84% 2.67% 3.85% 5.86%<br />
1.00 3.01 3.74 4.37 0.03 3.01 3.74 4.37<br />
1.38 3.79 4.21 5.50 -2.96 2.90 3.76 5.29<br />
0.82 3.22 3.65 4.23 -0.15 3.22 3.65 4.23<br />
1.42 3.70 4.51 6.23 -2.91 2.80 4.06 6.02<br />
0.85 3.14 3.94 4.47 -0.12 3.14 3.94 4.47<br />
1.83 3.76 4.40 6.03 -2.49 2.87 3.95 5.82<br />
1.25 3.21 3.83 4.29 0.28 3.21 3.83 4.29<br />
2.22 3.66 4.26 5.45 -2.16 2.76 3.82 5.19<br />
1.09 3.22 4.27 5.96 -3.18 2.34 3.81 5.74<br />
0.54 2.65 3.70 4.30 -0.43 2.65 3.70 4.30<br />
0.50 2.98 4.11 5.67 -3.73 2.09 3.66 5.45<br />
-0.05 2.42 3.55 4.25 -1.01 2.42 3.55 4.25<br />
0.80 3.36 4.35 6.10 -3.48 2.46 3.90 5.91<br />
0.34 2.80 3.78 4.26 -0.63 2.80 3.78 4.26<br />
1.84 3.77 4.54 6.40 -2.50 2.88 4.08 6.21<br />
1.35 3.20 3.97 4.48 0.37 3.20 3.97 4.48<br />
2.11 3.82 4.57 6.41 2.11 3.82 4.57 6.41<br />
5.25 4.26 4.68 6.39 0.81 3.36 4.23 6.20<br />
4.72 3.71 4.12 4.37 3.72 3.71 4.12 4.37<br />
1.75 3.72 4.46 6.12 -2.54 2.82 4.01 5.91<br />
1.18 3.14 3.90 4.47 0.21 3.14 3.90 4.47<br />
2.00 3.90 4.55 6.10 -2.33 3.00 4.09 5.89<br />
1.42 3.31 3.98 4.50 0.44 3.31 3.98 4.50<br />
2.09 3.92 4.56 6.11 2.09 3.92 4.56 6.11<br />
0.28 2.89 3.91 5.27 -3.98 2.01 3.46 5.02<br />
-0.17 2.36 3.36 4.14 -1.13 2.36 3.36 4.14<br />
3.07 4.02 4.61 7.18 -1.31 3.12 4.15 7.01<br />
2.50 3.45 4.02 4.61 1.52 3.45 4.02 4.61<br />
3.25 4.11 4.69 7.21 3.25 4.11 4.69 7.21<br />
2.84 3.79 4.57 6.13 -1.57 2.89 4.12 5.92<br />
2.33 3.23 4.02 4.50 1.35 3.23 4.02 4.50<br />
4.23 4.30 4.69 6.46 -0.18 3.40 4.24 6.27<br />
3.54 3.72 4.12 4.56 2.54 3.72 4.12 4.56<br />
4.25 4.30 4.70 6.46 4.25 4.30 4.70 6.46<br />
2.89 4.10 4.58 5.87 -1.46 3.20 4.13 5.66<br />
2.30 3.51 4.01 4.43 1.31 3.51 4.01 4.43<br />
2.36 3.78 4.40 5.75 -2.03 2.88 3.95 5.55<br />
1.88 3.22 3.84 4.39 0.90 3.22 3.84 4.39<br />
4.49 3.96 4.60 5.42 0.08 3.06 4.15 5.12<br />
FRVAX 9/1/87 2.13 3.77 4.37 6.06 -2.24 2.88 3.92 5.85 101<br />
<strong>Franklin</strong> Virginia Tax-Free Income–C FVAIX 5/1/95 1.64 3.22 3.81 4.34 0.66 3.22 3.81 4.34<br />
101<br />
Advisor Class and Class Z shares are only offered to certain eligible investors as stated in the prospectus. nt’d.<br />
This material is for dealer use only and has not been filed with FINRA for use with the public.<br />
AVERAGE ANNUAL TOTAL RETURN AVERAGE ANNUAL TOTAL RETURN<br />
WITHOUT SALES CHARGES 5 WITH SALES CHARGES 6<br />
Symbol Inception 1 1-Year 5-Year 10-Year Inception 1-Year 5-Year 10-Year Inception<br />
6/30/09<br />
8 <strong>Dealer</strong> <strong>Facts</strong> <strong>Guide</strong> Go to franklintempleton.com or call (800) 223-2141 DEALER USE ONLY/NOT FOR DISTRIBUTION TO THE PUBLIC<br />
Fund<br />
Profile<br />
on<br />
Page
Performance Summary, cont’d.<br />
Ongoing market volatility can dramatically impact the fund’s short-term<br />
performance. Call (800) 342-5236 or go to franklintempleton.com for the<br />
most recent month-end performance.<br />
VARIABLE INSURANCE FUNDS<br />
VALUE<br />
CUMULATIVE TOTAL RETURN AVERAGE ANNUAL TOTAL RETURN<br />
NO CONTRACT EXPENSES OR CHARGES 53 NO CONTRACT EXPENSES OR CHARGES 53<br />
Inception 1 YTD 1-Year 5-Year 10-Year 5-Year 10-Year Inception<br />
6/30/09<br />
<strong>Franklin</strong> Large Cap Value Securities–256, 66 3/1/05 103<br />
<strong>Franklin</strong> Large Cap Value Securities–456, 66 2/28/08 103<br />
<strong>Franklin</strong> Small Cap Value Securities–1 66, 83 5/1/98 104<br />
<strong>Franklin</strong> Small Cap Value Securities–2 66, 83 1/6/99 104<br />
<strong>Franklin</strong> Small Cap Value Securities–466, 83 2/28/08 104<br />
Mutual Shares Securities–1 13 11/8/96 104<br />
Mutual Shares Securities–2 13 1/6/99 104<br />
Mutual Shares Securities–413 BLEND<br />
2/28/08 104<br />
<strong>Franklin</strong> Rising Dividends Securities–1 66 1/27/92 105<br />
<strong>Franklin</strong> Rising Dividends Securities–2 66 1/6/99 105<br />
<strong>Franklin</strong> Rising Dividends Securities–466 GROWTH<br />
2/28/08 105<br />
<strong>Franklin</strong> Flex Cap Growth Securities–256, 66 3/1/05 105<br />
<strong>Franklin</strong> Flex Cap Growth Securities–456, 66 2/28/08 105<br />
<strong>Franklin</strong> Large Cap Growth Securities–181 5/1/96 106<br />
<strong>Franklin</strong> Large Cap Growth Securities–281 1/6/99 106<br />
<strong>Franklin</strong> Large Cap Growth Securities–481 2/28/08 106<br />
<strong>Franklin</strong> Small-Mid Cap Growth Securities–166, 82 11/1/95 106<br />
<strong>Franklin</strong> Small-Mid Cap Growth Securities–266, 82 1/6/99 106<br />
<strong>Franklin</strong> Small-Mid Cap Growth Securities–466, 82 SECTOR<br />
2/28/08 106<br />
<strong>Franklin</strong> Global Real Estate Securities–1 56, 88 1/24/89 107<br />
<strong>Franklin</strong> Global Real Estate Securities–2 56, 88 1/6/99 107<br />
<strong>Franklin</strong> Global Real Estate Securities–4 56, 88 GLOBAL<br />
2/28/08 107<br />
Mutual Global Discovery Securities–113, 93 11/8/96 107<br />
Mutual Global Discovery Securities–213, 93 1/6/99 107<br />
Mutual Global Discovery Securities–413, 93 2/28/08 107<br />
<strong>Templeton</strong> Global Asset Allocation–155, 56 8/24/88 108<br />
<strong>Templeton</strong> Global Asset Allocation–255, 56 5/1/97 108<br />
<strong>Templeton</strong> Global Asset Allocation–455, 56 2/28/08 108<br />
<strong>Templeton</strong> Growth Securities–156 3/15/94 108<br />
<strong>Templeton</strong> Growth Securities–256 1/6/99 108<br />
<strong>Templeton</strong> Growth Securities–456 INTERNATIONAL<br />
2/28/08 108<br />
Mutual International Securities–256 6/15/09 109<br />
Mutual International Securities–456 6/15/09 109<br />
<strong>Templeton</strong> Developing Markets Securities–155, 66 3/4/96 109<br />
<strong>Templeton</strong> Developing Markets Securities–255, 66 5/1/97 109<br />
<strong>Templeton</strong> Developing Markets Securities–355, 66 5/1/04 —<br />
<strong>Templeton</strong> Developing Markets Securities–455, 66 2.25% -26.85% —% —% —% —% -4.98%<br />
2.29 -26.92 — — — — -5.00<br />
4.33 -27.82 -0.43 71.73 -0.09 5.56 3.60<br />
4.18 -27.98 -1.71 67.42 -0.34 5.29 3.35<br />
4.17 -28.04 -0.86 70.99 -0.17 5.51 3.56<br />
4.87 -23.05 -1.32 36.40 -0.27 3.15 5.23<br />
4.75 -23.25 -2.52 33.51 -0.51 2.93 5.04<br />
4.71 -23.32 -1.78 35.76 -0.36 3.10 5.19<br />
-0.56 -19.99 -8.26 43.28 -1.71 3.66 7.33<br />
-0.71 -20.19 -9.45 39.57 -1.97 3.39 7.16<br />
-0.78 -20.31 -8.72 42.56 -1.81 3.61 7.30<br />
8.03 -23.84 — — — — -2.63<br />
7.93 -23.94 — — — — -2.66<br />
8.66 -20.45 -10.68 -0.24 -2.23 -0.02 4.62<br />
8.48 -20.62 -11.77 -2.72 -2.47 -0.28 4.40<br />
8.48 -20.77 -11.15 -0.76 -2.34 -0.08 4.57<br />
14.59 -27.53 -11.60 13.75 -2.44 1.30 5.33<br />
14.47 -27.73 -12.69 11.03 -2.68 1.05 5.13<br />
14.39 -27.78 -12.03 13.19 -2.53 1.25 5.29<br />
-10.23 -39.37 -29.15 32.14 -6.66 2.83 6.60<br />
-10.36 -39.54 -30.07 28.84 -6.90 2.57 6.47<br />
-10.37 -39.57 -29.49 31.50 -6.75 2.78 6.58<br />
8.62 -12.96 41.85 113.72 7.24 7.89 8.39<br />
8.45 -13.21 40.05 108.45 6.97 7.62 8.17<br />
8.46 -13.27 41.22 112.77 7.15 7.84 8.36<br />
3.65 -16.95 22.63 59.38 4.16 4.77 8.73<br />
3.46 -17.18 21.14 55.46 3.91 4.51 8.58<br />
3.49 -17.19 22.18 58.79 4.09 4.73 8.71<br />
5.59 -28.46 -7.28 14.50 -1.50 1.36 5.40<br />
5.51 -28.67 -8.41 11.67 -1.74 1.11 5.22<br />
5.41 -28.79 -7.76 13.90 -1.60 1.31 5.37<br />
— — — — — — —<br />
— — — — — — —<br />
28.72 -26.70 59.96 67.18 9.85 5.27 1.77<br />
28.47 -26.93 57.97 63.17 9.58 5.02 1.54<br />
28.45 -26.91 58.26 63.48 9.62 5.04 1.56<br />
2/28/08 28.46 -26.96 59.17 66.36 9.74 5.22 1.73<br />
109<br />
Important <strong>Franklin</strong> <strong>Templeton</strong> Variable Insurance Funds Note:<br />
Performance reflects the funds’ operating expenses, which differ by class, but does not include any contract fees, expenses or sales charges. If they had been included, performance would have<br />
been lower. The funds are generally only available as investment options in variable annuity and variable life insurance contracts.<br />
This fund-only performance is for dealer use only and has not been filed with FINRA for use with the public.<br />
DEALER USE ONLY/NOT FOR DISTRIBUTION TO THE PUBLIC Go to franklintempleton.com or call (800) 223-2141 <strong>Dealer</strong> <strong>Facts</strong> <strong>Guide</strong> 9<br />
Fund<br />
Profile<br />
on<br />
Page<br />
PERFORMANCE SUMMARY
PERFORMANCE SUMMARY<br />
Performance Summary, cont’d.<br />
Ongoing market volatility can dramatically impact the fund’s short-term<br />
performance. Call (800) 342-5236 or go to franklintempleton.com for the<br />
most recent month-end performance.<br />
VARIABLE INSURANCE FUNDS<br />
INTERNATIONAL, cont’d.<br />
CUMULATIVE TOTAL RETURN AVERAGE ANNUAL TOTAL RETURN<br />
NO CONTRACT EXPENSES OR CHARGES 53 NO CONTRACT EXPENSES OR CHARGES 53<br />
Inception 1 YTD 1-Year 5-Year 10-Year 5-Year 10-Year Inception<br />
Important <strong>Franklin</strong> <strong>Templeton</strong> Variable Insurance Funds Note:<br />
Performance reflects the funds’ operating expenses, which differ by class, but does not include any contract fees, expenses or sales charges. If they had been included, performance would have<br />
been lower. The funds are generally only available as investment options in variable annuity and variable life insurance contracts.<br />
This fund-only performance is for dealer use only and has not been filed with FINRA for use with the public.<br />
6/30/09<br />
<strong>Templeton</strong> Foreign Securities–113, 55, 66 5/1/92 110<br />
<strong>Templeton</strong> Foreign Securities–213, 55, 66 5/1/97 110<br />
<strong>Templeton</strong> Foreign Securities–313, 55, 66 5/1/04 —<br />
<strong>Templeton</strong> Foreign Securities–413, 55, 66 HYBRID<br />
2/28/08 110<br />
<strong>Franklin</strong> Growth and Income Securities–113 1/24/89 110<br />
<strong>Franklin</strong> Growth and Income Securities–213 1/6/99 110<br />
<strong>Franklin</strong> Growth and Income Securities–413 2/28/08 110<br />
<strong>Franklin</strong> Income Securities–1 13 1/24/89 111<br />
<strong>Franklin</strong> Income Securities–2 13 1/6/99 111<br />
<strong>Franklin</strong> Income Securities–413 ASSET ALLOCATION<br />
2/28/08 111<br />
<strong>Franklin</strong> <strong>Templeton</strong> VIP Founding Funds Allocation–156 7/2/07 111<br />
<strong>Franklin</strong> <strong>Templeton</strong> VIP Founding Funds Allocation–256 7/2/07 111<br />
<strong>Franklin</strong> <strong>Templeton</strong> VIP Founding Funds Allocation–456 FIXED INCOME<br />
2/28/08 111<br />
<strong>Franklin</strong> High Income Securities–113 1/24/89 112<br />
<strong>Franklin</strong> High Income Securities–2 13 1/6/99 112<br />
<strong>Franklin</strong> High Income Securities–413 2/28/08 112<br />
<strong>Franklin</strong> Strategic Income Securities–1 66 7/1/99 112<br />
<strong>Franklin</strong> Strategic Income Securities–2 66 5/15/01 112<br />
<strong>Franklin</strong> Strategic Income Securities–466 2/28/08 112<br />
<strong>Franklin</strong> U.S. Government Securities–1 13 3/14/89 113<br />
<strong>Franklin</strong> U.S. Government Securities–2 13 1/6/99 113<br />
<strong>Franklin</strong> U.S. Government Securities–413 2/28/08 113<br />
<strong>Franklin</strong> Zero Coupon–2010–1 13 3/14/89 113<br />
<strong>Franklin</strong> Zero Coupon–2010–2 13 5/12/03 113<br />
<strong>Templeton</strong> Global Bond Securities–1 13, 94 1/24/89 114<br />
<strong>Templeton</strong> Global Bond Securities–2 13, 94 1/6/99 114<br />
<strong>Templeton</strong> Global Bond Securities–3 13, 94 4/1/05 —<br />
<strong>Templeton</strong> Global Bond Securities–413, 94 9.33% -25.78% 15.92% 20.80% 3.00% 1.91% 7.06%<br />
9.23 -25.99 14.48 17.86 2.74 1.66 6.87<br />
9.18 -26.01 14.37 17.75 2.72 1.65 6.86<br />
9.15 -26.08 15.32 20.18 2.89 1.86 7.02<br />
2.96 -24.30 -15.85 0.45 -3.39 0.05 5.95<br />
2.91 -24.44 -16.89 -1.90 -3.63 -0.19 5.82<br />
2.80 -24.61 -16.26 -0.03 -3.49 0.00 5.93<br />
12.91 -16.46 12.00 75.28 2.29 5.77 8.34<br />
12.84 -16.64 10.58 70.96 2.03 5.51 8.20<br />
12.79 -16.67 11.51 74.52 2.20 5.73 8.32<br />
7.51 -22.26 — — — — -19.75<br />
7.34 -22.50 — — — — -19.97<br />
7.33 -22.51 — — — — -19.87<br />
21.75 -5.46 19.52 28.18 3.63 2.51 5.79<br />
21.51 -5.74 17.79 25.01 3.33 2.26 5.65<br />
21.53 -5.68 19.05 27.68 3.55 2.47 5.77<br />
12.86 0.09 29.33 — 5.28 — 6.31<br />
12.60 -0.24 27.64 — 5.00 — 6.04<br />
12.55 -0.30 28.61 — 5.16 — 6.25<br />
1.13 7.31 28.82 76.33 5.19 5.84 6.80<br />
1.01 7.11 27.27 71.95 4.94 5.57 6.66<br />
1.00 7.02 28.27 75.59 5.11 5.79 6.77<br />
-0.25 4.71 27.34 91.02 4.95 6.69 8.84<br />
-0.35 4.49 25.85 88.17 4.71 6.53 8.76<br />
7.57 13.08 63.34 155.25 10.31 9.82 8.17<br />
7.45 12.79 61.24 148.96 10.03 9.55 8.02<br />
7.39 12.73 61.17 148.86 10.02 9.55 8.02<br />
2/28/08 7.41 12.66 62.63 154.14 10.22 9.78 8.14 114<br />
10 <strong>Dealer</strong> <strong>Facts</strong> <strong>Guide</strong> Go to franklintempleton.com or call (800) 223-2141 DEALER USE ONLY/NOT FOR DISTRIBUTION TO THE PUBLIC<br />
Fund<br />
Profile<br />
on<br />
Page
Performance Summary, cont’d.<br />
SELECTED INDEX RETURNS<br />
Performance as of 6/30/0925 S&P 500 Index — —<br />
Dow Jones Industrial Average36 — —<br />
Consumer Price Index — —<br />
MSCI EAFE Index — —<br />
MSCI Emerging Markets Index — —<br />
MSCI World Index — —<br />
Citigroup World Government Bond Index — —<br />
Barclays Capital Government/Credit Index — —<br />
Barclays Capital Municipal Bond Index — —<br />
Credit Suisse High Yield Index — —<br />
Russell 2000 ® Growth Index — —<br />
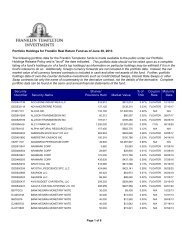
CLOSED-END FUNDS 35<br />
Performance at Market Value as of 5/31/09<br />
<strong>Franklin</strong> <strong>Templeton</strong> Limited Duration Income Trust FTF 8/27/03<br />
<strong>Franklin</strong> Universal Trust FT 9/23/88<br />
<strong>Templeton</strong> Dragon TDF 9/20/94<br />
<strong>Templeton</strong> Emerging Markets EMF 2/26/87<br />
<strong>Templeton</strong> Emerging Markets Income TEI 9/23/93<br />
<strong>Templeton</strong> Global Income GIM 3/17/88<br />
<strong>Templeton</strong> Russia and East European TRF 9/13/95<br />
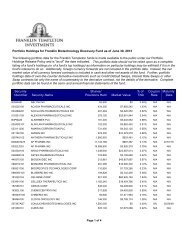
MONEY FUNDS<br />
As of 6/30/09<br />
<strong>Franklin</strong> Money Fund13 <strong>Franklin</strong> Tax-Exempt Money Fund<br />
<strong>Franklin</strong> California Tax-Exempt Money Fund<br />
9, 71<br />
<strong>Franklin</strong> New York Tax-Exempt Money Fund<br />
<strong>Franklin</strong> <strong>Templeton</strong> Money Fund<br />
<strong>Franklin</strong> <strong>Templeton</strong> Money Fund–A9 <strong>Franklin</strong> <strong>Templeton</strong> Money Fund–C9 CUMULATIVE TOTAL RETURN AVERAGE ANNUAL TOTAL RETURN<br />
Symbol Inception YTD 1-Year 5-Year 1-Year 5-Year 10-Year Inception<br />
3.16% -26.22% -10.72% -26.22% -2.24% -2.22% —<br />
-2.01 -23.00 -8.12 -23.00 -1.68 -0.41 —<br />
2.60 -1.43 13.70 -1.43 2.60 2.64 —<br />
8.42 -30.96 14.73 -30.96 2.79 1.59 —<br />
36.22 -27.82 101.88 -27.82 15.08 9.00 —<br />
6.79 -29.01 2.90 -29.01 0.57 -0.37 —<br />
-1.50 4.00 34.20 4.00 6.06 6.53 —<br />
0.55 5.26 26.40 5.26 4.80 5.95 —<br />
6.42 3.77 22.47 3.77 4.14 5.00 —<br />
27.22 -5.00 20.54 -5.00 3.81 5.08 —<br />
11.36 -24.85 -6.45 -24.85 -1.32 -0.89 —<br />
CUMULATIVE TOTAL RETURN AVERAGE ANNUAL TOTAL RETURN<br />
Symbol Inception YTD 1-Year 5-Year 1-Year 5-Year 10-Year Inception<br />
23.53% -6.73% 11.52% -6.73% 2.20% —% 1.31<br />
23.45 -26.48 22.74 -26.48 4.18 1.54 6.14<br />
35.46 -12.07 130.98 -12.07 18.23 18.46 10.77<br />
60.33 -27.04 124.41 -27.04 17.55 8.16 13.47<br />
28.53 -13.46 57.00 -13.46 9.44 11.50 8.69<br />
13.68 10.09 80.63 10.09 12.55 12.79 9.00<br />
166.92 -28.49 143.64 -28.49 19.50 21.88 17.60<br />
7 Day Taxable<br />
Fund No. Symbol CUSIP No. 7 Day Yield 50 Effective Yield 50 Equivalent Yield 16<br />
This material is for dealer use only and has not been filed with FINRA for use with the public.<br />
If you remove the Performance Summary from the <strong>Dealer</strong> <strong>Facts</strong> <strong>Guide</strong> for convenient reference, please copy the Footnotes on pages 125–127 as they contain important related information.<br />
6/30/09<br />
Fund<br />
Profile<br />
on Page<br />
111 FMFXX 354 014 102 0.00% 0.00% —% 84<br />
114 FTMXX 354 719 106 0.00 0.00 0.00 102<br />
125 FCLXX 352 519 201 0.00 0.00 0.00 102<br />
131 FRNXX 354 128 100 0.00 0.00 0.00 102<br />
400 — 354 902 405 0.48 0.49 — —<br />
511 FRIXX 354 902 108 0.00 0.00 — —<br />
DEALER USE ONLY/NOT FOR DISTRIBUTION TO THE PUBLIC Go to franklintempleton.com or call (800) 223-2141 <strong>Dealer</strong> <strong>Facts</strong> <strong>Guide</strong> 11<br />
PERFORMANCE SUMMARY
Notes<br />
12 <strong>Dealer</strong> <strong>Facts</strong> <strong>Guide</strong> Go to franklintempleton.com or call (800) 223-2141 DEALER USE ONLY/NOT FOR DISTRIBUTION TO THE PUBLIC
<strong>Franklin</strong> All Cap Value Fund<br />
OVERALL MORNINGSTAR RATING TM<br />
CLASS A 8<br />
★★★★<br />
MORNINGSTAR STYLE BOX<br />
STYLE<br />
Value Blend Growth<br />
SIZE<br />
Large<br />
✕<br />
Medium<br />
Small<br />
✕ Current<br />
Historical<br />
INVESTMENT CATEGORY<br />
Value<br />
TM 67<br />
PRIMARY INVESTMENT 37<br />
Equity securities of companies of<br />
any size that the fund’s managers<br />
believe are undervalued at the time<br />
of purchase and have the potential<br />
for capital appreciation.<br />
FUND REFERENCE<br />
CLASS A CLASS C<br />
Fund No. 448 548<br />
CUSIP 355 148 743 355 148 735<br />
Symbol FRAVX —<br />
Inception1 6/1/07 6/1/07<br />
CLASS R ADVISOR89 Fund No. 848 648<br />
CUSIP 355 148 727 355 148 719<br />
Symbol — —<br />
Inception1 6/1/07 6/1/07<br />
ANNUAL PROSPECTUS UPDATE AVAILABLE:<br />
March 1<br />
PORTFOLIO MANAGER PROFILE84 William J. Lippman<br />
Joined <strong>Franklin</strong> <strong>Templeton</strong> in 1988<br />
Managed Fund since 2007<br />
Steve Raineri<br />
Joined <strong>Franklin</strong> <strong>Templeton</strong> in 2005<br />
Managed Fund since 2007<br />
Bruce C. Baughman, CPA<br />
Joined <strong>Franklin</strong> <strong>Templeton</strong> in 1988<br />
Managed Fund since 2007<br />
Margaret McGee<br />
Joined <strong>Franklin</strong> <strong>Templeton</strong> in 1988<br />
Managed Fund since 2007<br />
Donald G. Taylor, CPA<br />
Joined <strong>Franklin</strong> <strong>Templeton</strong> in 1996<br />
Managed Fund since 2007<br />
MAXIMUM SALES CHARGE & COMMISSION<br />
CLASS A CLASS C73 Sales Charge 5.75% 0.00%<br />
<strong>Dealer</strong> Concession 5.00 1.00<br />
12b-1 Fee to <strong>Dealer</strong> 0.25 1.00<br />
CLASS R ADVISOR89 Sales Charge 0.00% 0.00%<br />
<strong>Dealer</strong> Concession 0.00 0.00<br />
12b-1 Fee to <strong>Dealer</strong> 0.50 0.00<br />
See page 128 for more commission<br />
information and page 125 for footnotes.<br />
PERFORMANCE INFORMATION<br />
5, 9<br />
ANNUAL TOTAL RETURN–WITHOUT SALES CHARGES<br />
1999 2000 2001 2002 2003 2004 2005 2006 2007 2008<br />
YTD<br />
200914 CLASS A — — — — — — — — — -32.20 1.83<br />
CLASS C — — — — — — — — — -32.70 1.51<br />
ADVISOR — — — — — — — — — -32.05 2.00<br />
AVERAGE ANNUAL TOTAL RETURN – AVERAGE ANNUAL TOTAL RETURN–<br />
WITHOUT SALES CHARGES5, 9 6, 9<br />
WITH SALES CHARGES<br />
1 YR 3 YR 5 YR 10 YR INCEPTION 1 YR 3 YR 5 YR 10 YR INCEPTION<br />
CLASS A -27.89 — — — -20.52 -32.02 — — — -22.75<br />
CLASS C -28.47 — — — -21.06 -29.19 — — — -21.06<br />
ADVISOR -27.70 — — — -20.25 -27.70 — — — -20.25<br />
Advisor Class shares are only offered to certain eligible investors as stated in the prospectus.<br />
PORTFOLIO HOLDINGS 29 6/30<br />
Total Number of Positions 50<br />
PORTFOLIO BREAKDOWN<br />
Capital Goods 19.96%<br />
Energy 13.57<br />
Materials 12.41<br />
Insurance 7.83<br />
Utilities 7.30<br />
Health Care Equipment & Services 7.20<br />
Retailing 5.91<br />
Technology Hardware & Equipment 5.17<br />
Consumer Durables & Apparel 5.01<br />
Food & Staples Retailing 3.21<br />
TOP 10 HOLDINGS7 Laboratory Corporation of<br />
America Holdings 3.72%<br />
Becton Dickinson & Co. 3.48<br />
IBM Corp. 3.37<br />
Wal-Mart Stores Inc. 3.21<br />
RTI International Metals Inc. 3.12<br />
Adidas AG 2.98<br />
Bemis Company Inc. 2.88<br />
Eaton Corp. 2.76<br />
Chubb Corp. 2.71<br />
NV Energy Inc. 2.61<br />
ANNUAL TOTAL RETURN 5, 9 –CLASS A<br />
WITHOUT SALES CHARGES<br />
0<br />
-32.20%<br />
2005 2006 2007 2008<br />
9, 22<br />
HYPOTHETICAL INVESTMENT<br />
CLASS A CLASS C ADVISOR<br />
$10,000 from Inception $5,846 $6,115 $6,247<br />
FUND FACTS<br />
Net Assets (millions)<br />
2, 9<br />
Expense Ratio<br />
without waiver<br />
with waiver<br />
Net Asset Value<br />
Public Offering Price<br />
Beta 3<br />
Standard Deviation 65<br />
FUND DISTRIBUTIONS<br />
Dividend Frequency<br />
Annually in December.<br />
Dividend History 30<br />
12/08<br />
12/07<br />
Capital Gains (last 12 mos.) 30<br />
Short-Term<br />
Long-Term<br />
1.83%<br />
YTD 2009 14<br />
ASSET ALLOCATION 29, 60 6/30<br />
Stocks 96%<br />
Cash 4%<br />
6/30/09<br />
CLASS A CLASS C ADVISOR<br />
$9.3 $1.4 $0.7<br />
2.44% 3.12% 2.14%<br />
1.23% 1.91% 0.93%<br />
$6.11 $6.07 $6.13<br />
$6.48 $6.07 $6.13<br />
— — —<br />
— — —<br />
CLASS A CLASS C ADVISOR<br />
$0.0511 $0.0156 $0.0674<br />
0.0531 0.0403 0.0624<br />
— — —<br />
— — —<br />
DEALER USE ONLY/NOT FOR DISTRIBUTION TO THE PUBLIC Go to franklintempleton.com or call (800) 223-2141 <strong>Dealer</strong> <strong>Facts</strong> <strong>Guide</strong> 13<br />
OPEN-END FUNDS VALUE BLEND GROWTH SECTOR GLOBAL INTERNATIONAL HYBRID ASSET ALLOCATION FIXED INCOME TAX-FREE INCOME
OPEN-END FUNDS<br />
VALUE<br />
BLEND<br />
GROWTH<br />
SECTOR<br />
GLOBAL<br />
INTERNATIONAL<br />
HYBRID<br />
ASSET ALLOCATION<br />
FIXED INCOME<br />
TAX-FREE INCOME<br />
<strong>Franklin</strong> Balance Sheet Investment Fund<br />
OVERALL MORNINGSTAR RATING TM<br />
CLASS A 8<br />
★★★★<br />
MORNINGSTAR STYLE BOX<br />
STYLE<br />
Value Blend Growth<br />
SIZE<br />
Large<br />
✕<br />
Medium<br />
Small<br />
✕ Current<br />
Historical<br />
INVESTMENT CATEGORY<br />
Value<br />
TM 67<br />
PRIMARY INVESTMENT 37<br />
Equity and debt securities, includ ing<br />
foreign, small-capital iza tion, and<br />
high yield, lower-rated securities<br />
that the managers believe to be<br />
under valued.<br />
FUND REFERENCE<br />
CLASS A CLASS C<br />
Fund No. 150 250<br />
CUSIP 355 148 107 355 148 867<br />
Symbol FRBSX FCBSX<br />
Inception1 4/2/90 3/1/01<br />
CLASS R ADVISOR89 Fund No. 850 650<br />
CUSIP 355 148 842 355 148 859<br />
Symbol FBSRX FBSAX<br />
Inception1 4/2/90 4/2/90<br />
ANNUAL PROSPECTUS UPDATE AVAILABLE:<br />
March 1<br />
PORTFOLIO MANAGER PROFILE84 Bruce C. Baughman, CPA<br />
Joined <strong>Franklin</strong> <strong>Templeton</strong> in 1988<br />
Managed Fund since 1990<br />
William J. Lippman<br />
Joined <strong>Franklin</strong> <strong>Templeton</strong> in 1988<br />
Managed Fund since 1990<br />
Donald G. Taylor, CPA<br />
Joined <strong>Franklin</strong> <strong>Templeton</strong> in 1996<br />
Managed Fund since 1996<br />
Margaret McGee<br />
Joined <strong>Franklin</strong> <strong>Templeton</strong> in 1988<br />
Managed Fund since 1990<br />
MAXIMUM SALES CHARGE & COMMISSION<br />
CLASS A CLASS C73 Sales Charge 5.75% 0.00%<br />
<strong>Dealer</strong> Concession 5.00 1.00<br />
12b-1 Fee to <strong>Dealer</strong> 0.25 1.00<br />
CLASS R ADVISOR89 Sales Charge 0.00% 0.00%<br />
<strong>Dealer</strong> Concession 0.00 0.00<br />
12b-1 Fee to <strong>Dealer</strong> 0.50 0.00<br />
See page 128 for more commission<br />
information and page 125 for footnotes.<br />
PERFORMANCE INFORMATION<br />
5, 13<br />
ANNUAL TOTAL RETURN–WITHOUT SALES CHARGES<br />
1999 2000 2001 2002 2003 2004 2005 2006 2007 2008<br />
YTD<br />
200914 CLASS A<br />
CLASS C<br />
ADVISOR43 -1.53 20.47 17.70 -5.96 29.58 25.31 10.90 16.35 -3.36 -36.01 -1.88<br />
— — — -6.63 28.60 24.33 10.06 15.47 -4.08 -36.55 -2.24<br />
-1.53 20.47 17.88 -5.73 29.92 25.58 11.17 16.63 -3.12 -34.96 -1.74<br />
AVERAGE ANNUAL TOTAL RETURN – AVERAGE ANNUAL TOTAL RETURN–<br />
WITHOUT SALES CHARGES5, 13 6, 13, 20<br />
WITH SALES CHARGES<br />
CLASS A<br />
CLASS C<br />
ADVISOR 43<br />
1 YR 3 YR 5 YR 10 YR INCEPTION 1 YR 3 YR 5 YR 10 YR INCEPTION<br />
-31.62 -13.41 -2.08 4.64 9.43 -35.55 -15.10 -3.23 4.03 9.10<br />
-32.20 -14.08 -2.83 — 2.85 -32.85 -14.08 -2.83 — 2.85<br />
-30.47 -12.78 -1.56 5.00 9.63 -30.47 -12.78 -1.56 5.00 9.63<br />
Advisor Class shares are only offered to certain eligible investors as stated in the prospectus.<br />
PORTFOLIO HOLDINGS 29 6/30<br />
Total Number of Positions 108<br />
PORTFOLIO BREAKDOWN<br />
Insurance 22.26%<br />
Utilities 13.02<br />
Capital Goods 11.83<br />
Materials 9.52<br />
Energy 5.60<br />
Consumer Durables & Apparel 5.33<br />
Transportation 5.29<br />
Food, Beverage & Tobacco 5.15<br />
Retailing 4.98<br />
Pharmaceuticals, Biotechnology &<br />
Life Sciences 2.61<br />
TOP 10 HOLDINGS 7<br />
NV Energy Inc. 2.77%<br />
Watson Pharmaceuticals Inc. 2.61<br />
American National Insurance Co. 2.42<br />
Corn Products International Inc. 2.41<br />
ESCO Technologies Inc. 2.35<br />
Old Republic International Corp. 2.24<br />
IPC Holdings Ltd. 2.20<br />
Entergy Corp. 2.11<br />
Norfolk Southern Corp. 2.07<br />
Prudential Financial Inc. 2.01<br />
ANNUAL TOTAL RETURN 5 –CLASS A<br />
WITHOUT SALES CHARGES<br />
16.35%<br />
10.90%<br />
0<br />
HYPOTHETICAL INVESTMENT 22<br />
$10,000 from Inception<br />
FUND FACTS<br />
Net Assets (millions)<br />
Expense Ratio 2<br />
Net Asset Value<br />
Public Offering Price<br />
Beta 3<br />
-3.36% -36.01% -1.88%<br />
2005 2006 2007 2008<br />
Standard Deviation 65<br />
FUND DISTRIBUTIONS<br />
Dividend Frequency<br />
Annually in December.<br />
4, 30<br />
Dividend History<br />
12/08<br />
12/07<br />
12/06<br />
Capital Gains (last 4, 30 12 mos.)<br />
Short-Term<br />
Long-Term<br />
YTD 2009 14<br />
6/30/09<br />
CLASS A CLASS C ADVISOR43 $53,437 $12,640 $58,661<br />
CLASS A CLASS C ADVISOR<br />
$1,948.0 $66.0 $119.1<br />
1.00% 1.76% 0.76%<br />
$34.53 $34.11 $35.04<br />
$36.64 $34.11 $35.04<br />
0.95 0.95 0.94<br />
24.50 24.51 24.35<br />
CLASS A CLASS C ADVISOR<br />
$0.7010 $0.3701 $0.8302<br />
0.6729 0.1000 0.8586<br />
0.8828 0.3543 1.0492<br />
— — —<br />
1.0477 1.0477 1.0477<br />
ASSET ALLOCATION 29, 60 6/30<br />
Stocks 91%<br />
Cash 9%<br />
14 <strong>Dealer</strong> <strong>Facts</strong> <strong>Guide</strong> Go to franklintempleton.com or call (800) 223-2141 DEALER USE ONLY/NOT FOR DISTRIBUTION TO THE PUBLIC
<strong>Franklin</strong> Large Cap Value Fund<br />
OVERALL MORNINGSTAR<br />
RATINGTM 8, 67<br />
– CLASS A<br />
TM 67<br />
MORNINGSTAR STYLE BOX<br />
STYLE<br />
Value Blend Growth<br />
SIZE<br />
✕<br />
Large<br />
Medium<br />
✕ Current<br />
Small Historical<br />
INVESTMENT CATEGORY<br />
Value<br />
PRIMARY INVESTMENT 37<br />
The fund invests primarily in stocks<br />
of large capitalization companies<br />
that are similar in size to those in<br />
the Russell 1000 ® Index at the time<br />
of purchase and that the manager<br />
believes to be undervalued.<br />
FUND REFERENCE<br />
CLASS A CLASS C<br />
Fund No. 480 580<br />
CUSIP 355 148 701 355 148 883<br />
Symbol FLVAX FLCVX<br />
Inception1 6/1/00 6/1/00<br />
CLASS R ADVISOR89 Fund No. 881 630<br />
CUSIP 355 148 834 355 148 768<br />
Symbol FLCRX —<br />
Inception1 6/1/00 6/1/00<br />
ANNUAL PROSPECTUS UPDATE AVAILABLE:<br />
March 1<br />
PORTFOLIO MANAGER PROFILE84 William J. Lippman<br />
Joined <strong>Franklin</strong> <strong>Templeton</strong> in 1988<br />
Managed Fund since 2000<br />
Bruce C. Baughman, CPA<br />
Joined <strong>Franklin</strong> <strong>Templeton</strong> in 1988<br />
Managed Fund since 2000<br />
Margaret McGee<br />
Joined <strong>Franklin</strong> <strong>Templeton</strong> in 1988<br />
Managed Fund since 2000<br />
Donald G. Taylor, CPA<br />
Joined <strong>Franklin</strong> <strong>Templeton</strong> in 1996<br />
Managed Fund since 2000<br />
MAXIMUM SALES CHARGE & COMMISSION<br />
CLASS A CLASS C73 Sales Charge 5.75% 0.00%<br />
<strong>Dealer</strong> Concession 5.00 1.00<br />
12b-1 Fee to <strong>Dealer</strong> 0.25 1.00<br />
CLASS R ADVISOR89 Sales Charge 0.00% 0.00%<br />
<strong>Dealer</strong> Concession 0.00 0.00<br />
12b-1 Fee to <strong>Dealer</strong> 0.50 0.00<br />
See page 128 for more commission<br />
information and page 125 for footnotes.<br />
PERFORMANCE INFORMATION<br />
5, 13<br />
ANNUAL TOTAL RETURN–WITHOUT SALES CHARGES<br />
1999 2000 2001 2002 2003 2004 2005 2006 2007 2008<br />
YTD<br />
200914 CLASS A<br />
CLASS C<br />
ADVISOR43 — — 7.67 -15.52 25.94 13.41 3.65 15.95 -1.12 -36.84 1.76<br />
— — 6.72 -15.84 25.02 12.58 3.07 15.12 -1.72 -37.30 1.43<br />
— — 7.67 -15.52 25.94 13.41 3.80 16.29 -0.78 -36.61 1.88<br />
AVERAGE ANNUAL TOTAL RETURN – AVERAGE ANNUAL TOTAL RETURN–<br />
WITHOUT SALES CHARGES5, 13 6, 13<br />
WITH SALES CHARGES<br />
CLASS A<br />
CLASS C<br />
ADVISOR 43<br />
1 YR 3 YR 5 YR 10 YR INCEPTION 1 YR 3 YR 5 YR 10 YR INCEPTION<br />
-28.38 -10.42 -3.79 — 1.78 -32.52 -12.17 -4.93 — 1.12<br />
-28.84 -11.01 -4.43 — 1.13 -29.55 -11.01 -4.43 — 1.13<br />
-28.12 -10.12 -3.55 — 1.92 -28.12 -10.12 -3.55 — 1.92<br />
Advisor Class shares are only offered to certain eligible investors as stated in the prospectus.<br />
PORTFOLIO HOLDINGS 29 6/30<br />
Total Number of Positions 56<br />
PORTFOLIO BREAKDOWN<br />
Capital Goods 13.99%<br />
Materials 11.73<br />
Energy 10.56<br />
Insurance<br />
Pharmaceuticals, Biotechnology &<br />
9.00<br />
Life Sciences 7.74<br />
Diversified Financials 7.27<br />
Consumer Durables & Apparel 6.81<br />
Retailing 6.16<br />
Technology Hardware & Equipment 5.69<br />
Household & Personal Products 3.96<br />
TOP 10 HOLDINGS7 Nucor Corp. 5.64%<br />
Microsoft Corp. 3.43<br />
IBM Corp. 3.29<br />
State Street Corp. 3.02<br />
D.R. Horton Inc. 2.99<br />
Merck & Company Inc. 2.89<br />
Aflac Inc. 2.86<br />
General Electric Co. 2.51<br />
Exxon Mobil Corp. 2.45<br />
Praxair Inc. 2.43<br />
ANNUAL TOTAL RETURN 5 –CLASS A<br />
WITHOUT SALES CHARGES<br />
3.65%<br />
0<br />
15.95%<br />
-1.12%<br />
-36.84%<br />
2005 2006 2007 2008<br />
6/30/09<br />
HYPOTHETICAL INVESTMENT 22<br />
CLASS A CLASS C ADVISOR43 $10,000 from Inception $11,062 $11,078 $11,885<br />
FUND FACTS<br />
Net Assets (millions)<br />
Expense Ratio2 Net Asset Value<br />
Public Offering Price<br />
Beta 3<br />
Standard Deviation 65<br />
FUND DISTRIBUTIONS<br />
Dividend Frequency<br />
Annually in December.<br />
Dividend History 30<br />
12/08<br />
12/07<br />
12/06<br />
Capital Gains (last 12 mos.) 30<br />
Short-Term<br />
Long-Term<br />
1.76%<br />
YTD 2009 14<br />
CLASS A CLASS C ADVISOR<br />
$80.4 $21.4 $2.9<br />
1.40% 2.10% 1.10%<br />
$9.26 $9.19 $9.23<br />
$9.82 $9.19 $9.23<br />
0.99 0.99 0.99<br />
21.47 21.48 21.48<br />
CLASS A CLASS C ADVISOR<br />
$0.1884 $0.0903 $0.2279<br />
0.2335 0.1120 0.2983<br />
0.2137 0.1141 0.2688<br />
— — —<br />
— — —<br />
ASSET ALLOCATION 29, 60 6/30<br />
Stocks 98%<br />
Cash 2%<br />
DEALER USE ONLY/NOT FOR DISTRIBUTION TO THE PUBLIC Go to franklintempleton.com or call (800) 223-2141 <strong>Dealer</strong> <strong>Facts</strong> <strong>Guide</strong> 15<br />
OPEN-END FUNDS VALUE BLEND GROWTH SECTOR GLOBAL INTERNATIONAL HYBRID ASSET ALLOCATION FIXED INCOME TAX-FREE INCOME
OPEN-END FUNDS<br />
VALUE<br />
BLEND<br />
GROWTH<br />
SECTOR<br />
GLOBAL<br />
INTERNATIONAL<br />
HYBRID<br />
ASSET ALLOCATION<br />
FIXED INCOME<br />
TAX-FREE INCOME<br />
<strong>Franklin</strong> MicroCap Value Fund<br />
OVERALL MORNINGSTAR RATING TM<br />
CLASS A 8<br />
★★★★★<br />
MORNINGSTAR STYLE BOX<br />
STYLE<br />
Value Blend Growth<br />
SIZE<br />
Large<br />
Medium<br />
Small<br />
✕<br />
✕ Current<br />
Historical<br />
INVESTMENT CATEGORY<br />
Value<br />
TM 67<br />
PRIMARY INVESTMENT 37<br />
Securities of domestic and foreign<br />
companies with market capitalizations<br />
under $400 million at the<br />
time of purchase, and which the<br />
managers believe are undervalued<br />
in the marketplace.<br />
Effective 1/14/04, the fund is closed to<br />
new investors, with the exception of select<br />
retirement accounts. Existing shareholders<br />
may continue adding to their accounts.<br />
FUND REFERENCE<br />
CLASS A ADVISOR89 Fund No. 189 629<br />
CUSIP 355 148 206 355 148 750<br />
Symbol FRMCX FVRMX<br />
Inception1 12/12/95 12/12/95<br />
ANNUAL PROSPECTUS UPDATE AVAILABLE:<br />
March 1<br />
PORTFOLIO MANAGER PROFILE84 Bruce C. Baughman, CPA<br />
Joined <strong>Franklin</strong> <strong>Templeton</strong> in 1988<br />
Managed Fund since 1995<br />
William J. Lippman<br />
Joined <strong>Franklin</strong> <strong>Templeton</strong> in 1988<br />
Managed Fund since 1995<br />
Margaret McGee<br />
Joined <strong>Franklin</strong> <strong>Templeton</strong> in 1988<br />
Managed Fund since 1995<br />
Donald G. Taylor, CPA<br />
Joined <strong>Franklin</strong> <strong>Templeton</strong> in 1996<br />
Managed Fund since 1996<br />
MAXIMUM SALES CHARGE & COMMISSION<br />
CLASS A ADVISOR89 Sales Charge 5.75% 0.00%<br />
<strong>Dealer</strong> Concession 5.00 0.00<br />
12b-1 Fee to <strong>Dealer</strong> 0.25 0.00<br />
See page 128 for more commission<br />
information and page 125 for footnotes.<br />
PERFORMANCE INFORMATION<br />
5, 13<br />
ANNUAL TOTAL RETURN–WITHOUT SALES CHARGES<br />
1999 2000 2001 2002 2003 2004 2005 2006 2007 2008<br />
YTD<br />
200914 CLASS A<br />
ADVISOR43 -3.98 12.07 41.28 4.01 36.42 16.01 12.23 19.94 -4.21 -30.26 8.60<br />
-3.98 12.07 41.28 4.01 36.42 16.01 12.28 20.23 -4.00 -30.08 8.75<br />
AVERAGE ANNUAL TOTAL RETURN – AVERAGE ANNUAL TOTAL RETURN–<br />
WITHOUT SALES CHARGES5, 13 6, 13, 46<br />
WITH SALES CHARGES<br />
CLASS A<br />
ADVISOR 43<br />
1 YR 3 YR 5 YR 10 YR INCEPTION 1 YR 3 YR 5 YR 10 YR INCEPTION<br />
-16.82 -7.35 1.11 8.80 10.25 -21.59 -9.16 -0.09 8.15 9.77<br />
-16.60 -7.12 1.29 8.89 10.33 -16.60 -7.12 1.29 8.89 10.33<br />
Advisor Class shares are only offered to certain eligible investors as stated in the prospectus.<br />
PORTFOLIO HOLDINGS 29 6/30<br />
Total Number of Positions 85<br />
PORTFOLIO BREAKDOWN<br />
Food, Beverage & Tobacco 14.98%<br />
Capital Goods 12.87<br />
Materials 8.83<br />
Commercial & Professional Services 8.57<br />
Retailing 6.83<br />
Insurance 6.46<br />
Transportation 6.20<br />
Consumer Durables & Apparel 4.43<br />
Telecommunication Services 4.07<br />
Food & Staples Retailing 3.75<br />
TOP 10 HOLDINGS7 Seneca Foods Corp. 7.10%<br />
Village Super Market Inc. 3.75<br />
Healthcare Services Group Inc. 3.71<br />
International Shipholding Corp. 3.58<br />
Atlantic Tele-Network Inc. 3.55<br />
PHI Inc. 2.98<br />
ACMAT Corp. 2.64<br />
Spherion Corp. 2.34<br />
Smithfield Foods Inc. 2.17<br />
Baldwin & Lyons Inc. 2.01<br />
ANNUAL TOTAL RETURN 5 –CLASS A<br />
WITHOUT SALES CHARGES<br />
0<br />
12.23%<br />
19.94%<br />
-4.21%<br />
-30.26%<br />
2005 2006 2007 2008<br />
HYPOTHETICAL INVESTMENT 22<br />
$10,000 from Inception<br />
FUND FACTS<br />
Net Assets (millions)<br />
Expense Ratio 2<br />
Net Asset Value<br />
Public Offering Price<br />
Beta 3<br />
Standard Deviation 65<br />
FUND DISTRIBUTIONS<br />
Dividend Frequency<br />
Annually in December.<br />
Dividend History 30<br />
12/08<br />
12/07<br />
12/06<br />
Capital Gains (last 12 mos.) 30<br />
Short-Term<br />
Long-Term<br />
8.60%<br />
YTD 2009 14<br />
6/30/09<br />
CLASS A ADVISOR43 $35,364 $37,875<br />
CLASS A ADVISOR<br />
$212.2 $70.3<br />
1.23% 0.99%<br />
$23.11 $23.11<br />
$24.52 $23.11<br />
0.73 0.73<br />
19.85 19.85<br />
CLASS A ADVISOR<br />
$0.4089 $0.4908<br />
0.4116 0.5273<br />
0.5676 0.6684<br />
— —<br />
1.8873 1.8873<br />
ASSET ALLOCATION 29, 60 6/30<br />
Stocks 87%<br />
Cash 12%<br />
Bonds 1%<br />
16 <strong>Dealer</strong> <strong>Facts</strong> <strong>Guide</strong> Go to franklintempleton.com or call (800) 223-2141 DEALER USE ONLY/NOT FOR DISTRIBUTION TO THE PUBLIC
<strong>Franklin</strong> MidCap Value Fund<br />
TM 67<br />
MORNINGSTAR STYLE BOX<br />
STYLE<br />
Value Blend Growth<br />
SIZE<br />
Large<br />
✕<br />
Medium<br />
✕ Current<br />
Small Historical<br />
INVESTMENT CATEGORY<br />
Value<br />
PRIMARY INVESTMENT 37<br />
Securities of mid-capitalization<br />
companies, which are defined as<br />
being similar in size to those in<br />
the Russell Midcap ® Index, at the<br />
time of purchase, and which the<br />
manager believes to be undervalued.<br />
FUND REFERENCE<br />
CLASS A CLASS C<br />
Fund No. 422 522<br />
CUSIP 355 148 818 355 148 792<br />
Symbol FMVAX FMVCX<br />
Inception1 7/1/05 7/1/05<br />
CLASS R ADVISOR89 Fund No. 822 622<br />
CUSIP 355 148 784 355 148 776<br />
Symbol — —<br />
Inception1 7/1/05 7/1/05<br />
ANNUAL PROSPECTUS UPDATE AVAILABLE:<br />
March 1<br />
PORTFOLIO MANAGER PROFILE84 Samuel R. Kerner, CFA<br />
Joined <strong>Franklin</strong> <strong>Templeton</strong> in 1996<br />
Managed Fund since 2005<br />
Bruce C. Baughman, CPA<br />
Joined <strong>Franklin</strong> <strong>Templeton</strong> in 1988<br />
Managed Fund since 2005<br />
William J. Lippman<br />
Joined <strong>Franklin</strong> <strong>Templeton</strong> in 1988<br />
Managed Fund since 2005<br />
Margaret McGee<br />
Joined <strong>Franklin</strong> <strong>Templeton</strong> in 1988<br />
Managed Fund since 2005<br />
Donald G. Taylor, CPA<br />
Joined <strong>Franklin</strong> <strong>Templeton</strong> in 1996<br />
Managed Fund since 2005<br />
MAXIMUM SALES CHARGE & COMMISSION<br />
CLASS A CLASS C73 Sales Charge 5.75% 0.00%<br />
<strong>Dealer</strong> Concession 5.00 1.00<br />
12b-1 Fee to <strong>Dealer</strong> 0.25 1.00<br />
CLASS R ADVISOR89 Sales Charge 0.00% 0.00%<br />
<strong>Dealer</strong> Concession 0.00 0.00<br />
12b-1 Fee to <strong>Dealer</strong> 0.50 0.00<br />
See page 128 for more commission<br />
information and page 125 for footnotes.<br />
PERFORMANCE INFORMATION<br />
5, 9<br />
ANNUAL TOTAL RETURN–WITHOUT SALES CHARGES<br />
1999 2000 2001 2002 2003 2004 2005 2006 2007 2008<br />
YTD<br />
200914 CLASS A — — — — — — — 13.92 0.25 -36.87 7.15<br />
CLASS C — — — — — — — 13.21 -0.36 -37.35 6.75<br />
ADVISOR — — — — — — — 14.37 0.57 -36.70 7.30<br />
AVERAGE ANNUAL TOTAL RETURN – AVERAGE ANNUAL TOTAL RETURN–<br />
WITHOUT SALES CHARGES5, 9 6, 9<br />
WITH SALES CHARGES<br />
CLASS A<br />
CLASS C<br />
ADVISOR<br />
1 YR 3 YR 5 YR 10 YR INCEPTION 1 YR 3 YR 5 YR 10 YR INCEPTION<br />
-27.20 -9.68 — — -5.39 -31.37 -11.45 — — -6.79<br />
-27.79 -10.28 — — -6.04 -28.52 -10.28 — — -6.04<br />
-27.06 -9.40 — — -5.09 -27.06 -9.40 — — -5.09<br />
Advisor Class shares are only offered to certain eligible investors as stated in the prospectus.<br />
PORTFOLIO HOLDINGS 29 6/30<br />
Total Number of Positions 56<br />
PORTFOLIO BREAKDOWN<br />
Materials 13.81%<br />
Utilities 11.82<br />
Capital Goods 11.23<br />
Energy 8.72<br />
Food, Beverage & Tobacco<br />
Pharmaceuticals, Biotechnology &<br />
7.16<br />
Life Sciences 5.25<br />
Health Care Equipment & Services 5.03<br />
Consumer Durables & Apparel 4.94<br />
Insurance 4.79<br />
Retailing 4.23<br />
TOP 10 HOLDINGS7 Celanese Corp. 3.82%<br />
Alberto-Culver Co. 3.30<br />
Dean Foods Inc. 3.23<br />
NV Energy Inc. 3.20<br />
SAIC Inc. 3.02<br />
McCormick & Company Inc. 3.00<br />
Atmos Energy Corp.<br />
Laboratory Corporation of<br />
2.96<br />
America Holdings 2.70<br />
Sigma-Aldrich Corp. 2.62<br />
Airgas Inc. 2.57<br />
ANNUAL TOTAL RETURN 5, 9 –CLASS A<br />
WITHOUT SALES CHARGES<br />
13.92%<br />
0<br />
0.25%<br />
-36.87%<br />
2005 2006 2007 2008<br />
6/30/09<br />
9, 22<br />
HYPOTHETICAL INVESTMENT<br />
CLASS A CLASS C ADVISOR<br />
$10,000 from Inception $7,551 $7,797 $8,116<br />
FUND FACTS<br />
Net Assets (millions)<br />
2, 9<br />
Expense Ratio<br />
without waiver<br />
with waiver<br />
Net Asset Value<br />
Public Offering Price<br />
Beta 3<br />
Standard Deviation 65<br />
FUND DISTRIBUTIONS<br />
Dividend Frequency<br />
Annually in December.<br />
Dividend History 30<br />
12/08<br />
12/07<br />
12/06<br />
Capital Gains (last 12 mos.) 30<br />
Short-Term<br />
Long-Term<br />
7.15%<br />
YTD 2009 14<br />
CLASS A CLASS C ADVISOR<br />
$38.4 $7.7 $1.0<br />
1.77% 2.47% 1.47%<br />
1.37% 2.07% 1.07%<br />
$7.49 $7.43 $7.50<br />
$7.95 $7.43 $7.50<br />
0.89 0.89 0.89<br />
22.78 22.83 22.83<br />
CLASS A CLASS C ADVISOR<br />
$0.0458 — $0.0814<br />
0.1284 $0.0597 0.1652<br />
0.1977 0.1411 0.2257<br />
— — —<br />
— — —<br />
ASSET ALLOCATION 29, 60 6/30<br />
Stocks 94%<br />
Cash 6%<br />
DEALER USE ONLY/NOT FOR DISTRIBUTION TO THE PUBLIC Go to franklintempleton.com or call (800) 223-2141 <strong>Dealer</strong> <strong>Facts</strong> <strong>Guide</strong> 17<br />
OPEN-END FUNDS VALUE BLEND GROWTH SECTOR GLOBAL INTERNATIONAL HYBRID ASSET ALLOCATION FIXED INCOME TAX-FREE INCOME
OPEN-END FUNDS<br />
VALUE<br />
BLEND<br />
GROWTH<br />
SECTOR<br />
GLOBAL<br />
INTERNATIONAL<br />
HYBRID<br />
ASSET ALLOCATION<br />
FIXED INCOME<br />
TAX-FREE INCOME<br />
38 6/30/09<br />
<strong>Franklin</strong> Small Cap Value Fund<br />
TM 67<br />
MORNINGSTAR STYLE BOX<br />
INVESTMENT CATEGORY<br />
Value<br />
PRIMARY INVESTMENT 37<br />
Securities of domestic and foreign<br />
companies with market capitalizations<br />
under $3.5 billion at the time<br />
of purchase, and which the manager<br />
believes to be under valued. The<br />
fund may also invest in high yield,<br />
lower-rated securities.<br />
FUND REFERENCE<br />
CLASS A CLASS C<br />
Fund No. 482 582<br />
CUSIP 355 148 305 355 148 404<br />
Symbol FRVLX FRVFX<br />
Inception1 3/11/96 9/3/96<br />
CLASS R ADVISOR89 Fund No. 882 682<br />
CUSIP 355 148 826 355 148 503<br />
Symbol FVFRX FVADX<br />
Inception1 3/11/96 3/11/96<br />
ANNUAL PROSPECTUS UPDATE AVAILABLE:<br />
March 1<br />
PORTFOLIO MANAGER PROFILE84 William J. Lippman<br />
Joined <strong>Franklin</strong> <strong>Templeton</strong> in 1988<br />
Managed Fund since 1996<br />
Y. Dogan Sahin, CFA<br />
Joined <strong>Franklin</strong> <strong>Templeton</strong> in 2001<br />
Managed Fund since 2007<br />
Bruce C. Baughman, CPA<br />
Joined <strong>Franklin</strong> <strong>Templeton</strong> in 1988<br />
Managed Fund since 1996<br />
Margaret McGee<br />
Joined <strong>Franklin</strong> <strong>Templeton</strong> in 1988<br />
Managed Fund since 1996<br />
Donald G. Taylor, CPA<br />
Joined <strong>Franklin</strong> <strong>Templeton</strong> in 1996<br />
Managed Fund since 1996<br />
MAXIMUM SALES CHARGE & COMMISSION<br />
CLASS A CLASS C73 Sales Charge 5.75% 0.00%<br />
<strong>Dealer</strong> Concession 5.00 1.00<br />
12b-1 Fee to <strong>Dealer</strong> 0.25 1.00<br />
CLASS R ADVISOR89 Sales Charge 0.00% 0.00%<br />
<strong>Dealer</strong> Concession 0.00 0.00<br />
12b-1 Fee to <strong>Dealer</strong> 0.50 0.00<br />
See page 128 for more commission<br />
information and page 125 for footnotes.<br />
PERFORMANCE INFORMATION<br />
5, 13<br />
ANNUAL TOTAL RETURN–WITHOUT SALES CHARGES<br />
1999 2000 2001 2002 2003 2004 2005 2006 2007 2008<br />
YTD<br />
200914 CLASS A<br />
CLASS C<br />
ADVISOR43 -0.82 22.22 15.12 -9.63 32.34 24.81 9.13 16.80 -2.78 -32.78 5.62<br />
-1.54 21.54 14.27 -10.15 31.43 24.00 8.42 15.98 -3.46 -33.26 5.20<br />
-0.43 22.72 15.43 -9.29 32.79 25.24 9.51 17.17 -2.49 -32.60 5.72<br />
AVERAGE ANNUAL TOTAL RETURN – AVERAGE ANNUAL TOTAL RETURN–<br />
WITHOUT SALES CHARGES5, 13 6, 13, 46<br />
WITH SALES CHARGES<br />
CLASS A<br />
CLASS C<br />
ADVISOR 43<br />
1 YR 3 YR 5 YR 10 YR INCEPTION 1 YR 3 YR 5 YR 10 YR INCEPTION<br />
-26.89 -9.97 0.05 5.41 6.58 -31.10 -11.73 -1.13 4.78 6.11<br />
-27.41 -10.62 -0.64 4.69 5.41 -28.13 -10.62 -0.64 4.69 5.41<br />
-26.68 -9.72 0.36 5.75 6.99 -26.68 -9.72 0.36 5.75 6.99<br />
Advisor Class shares are only offered to certain eligible investors as stated in the prospectus.<br />
PORTFOLIO HOLDINGS 29 6/30<br />
Total Number of Positions 114<br />
PORTFOLIO BREAKDOWN<br />
Capital Goods 21.20%<br />
Materials 11.34<br />
Insurance 11.03<br />
Energy 9.52<br />
Retailing 9.09<br />
Consumer Durables & Apparel 5.74<br />
Automobiles & Components 3.93<br />
Utilities 3.19<br />
Technology Hardware & Equipment<br />
Pharmaceuticals, Biotechnology<br />
2.63<br />
& Life Sciences 2.59<br />
TOP 10 HOLDINGS7 Universal Forest Products Inc. 2.08%<br />
Reliance Steel & Aluminum Co. 1.92<br />
Steel Dynamics Inc. 1.79<br />
Westlake Chemical Corp. 1.77<br />
J.C. Penney Company Inc. 1.71<br />
Benchmark Electronics Inc. 1.68<br />
Old Republic International Corp. 1.65<br />
Rowan Companies Inc. 1.64<br />
IPC Holdings Ltd. 1.64<br />
NV Energy Inc. 1.59<br />
ANNUAL TOTAL RETURN 5 –CLASS A<br />
WITHOUT SALES CHARGES<br />
0<br />
9.13%<br />
16.80%<br />
-2.78%<br />
2005 2006 2007<br />
-32.78%<br />
HYPOTHETICAL INVESTMENT 22<br />
$10,000 from Inception<br />
FUND FACTS<br />
Net Assets (millions)<br />
Expense Ratio 2<br />
Net Asset Value<br />
Public Offering Price<br />
Beta 3<br />
Standard Deviation 65<br />
FUND DISTRIBUTIONS<br />
Dividend Frequency<br />
Annually in December.<br />
Dividend History 30<br />
12/08<br />
12/07<br />
12/06<br />
Capital Gains (last 12 mos.) 30<br />
Short-Term<br />
Long-Term<br />
5.62%<br />
2008 YTD 2009 14<br />
CLASS A CLASS C ADVISOR43 $22,000 $19,652 $24,565<br />
CLASS A CLASS C ADVISOR<br />
$541.2 $137.4 $135.3<br />
CLASS A CLASS C ADVISOR<br />
$0.2919 $0.0343 $0.3930<br />
0.3559 0.0353 0.4829<br />
0.2811 0.0474 0.3797<br />
— — —<br />
— — —<br />
ASSET ALLOCATION 29, 60 6/30<br />
Stocks 93%<br />
Cash 7%<br />
1.30% 2.01% 1.02%<br />
$28.39 $26.90 $29.18<br />
$30.12 $26.90 $29.18<br />
0.99 0.99 0.99<br />
26.48 26.50 26.48<br />
18 <strong>Dealer</strong> <strong>Facts</strong> <strong>Guide</strong> Go to franklintempleton.com or call (800) 223-2141 DEALER USE ONLY/NOT FOR DISTRIBUTION TO THE PUBLIC
18 6/30/09<br />
Mutual Beacon Fund<br />
OVERALL MORNINGSTAR RATING TM<br />
CLASS A 8<br />
★★★★<br />
INVESTMENT CATEGORY<br />
Value<br />
PRIMARY INVESTMENT 37<br />
Common and preferred stock, as<br />
well as debt securities, including<br />
high-yield, lower-rated securities of<br />
domestic and foreign companies<br />
that the fund’s manager believes are<br />
undervalued. Investments include<br />
securities of companies involved in<br />
mergers, consolidations, liquidations,<br />
and reorganizations.<br />
FUND REFERENCE<br />
CLASS A CLASS C<br />
Fund No. 476 576<br />
CUSIP 628 380 875 628 380 867<br />
Symbol TEBIX TEMEX<br />
Inception1 6/29/62 6/29/62<br />
CLASS Z89 Fund No. 076<br />
CUSIP 628 380 305<br />
Symbol BEGRX<br />
Inception1 6/29/62<br />
ANNUAL PROSPECTUS UPDATE AVAILABLE:<br />
May 1<br />
PORTFOLIO MANAGER PROFILE84 Christian Correa, CFA<br />
Joined Mutual Series in 2003<br />
Managed Fund since 2007<br />
Mandana Hormozi<br />
Joined Mutual Series in 2003<br />
Managed Fund since 2009<br />
MAXIMUM SALES CHARGE & COMMISSION<br />
CLASS A CLASS C73 Sales Charge 5.75% 0.00%<br />
<strong>Dealer</strong> Concession 5.00 1.00<br />
12b-1 Fee to <strong>Dealer</strong> 0.25 1.00<br />
CLASS Z89 Sales Charge 0.00%<br />
<strong>Dealer</strong> Concession 0.00<br />
12b-1 Fee to <strong>Dealer</strong> 0.00<br />
See page 128 for more commission<br />
information and page 125 for footnotes.<br />
PERFORMANCE INFORMATION<br />
5, 13, 27<br />
ANNUAL TOTAL RETURN–WITHOUT SALES CHARGES<br />
1999 2000 2001 2002 2003 2004 2005 2006 2007 2008<br />
YTD<br />
200914 CLASS A 16.40 13.89 5.78 -11.41 28.99 14.13 8.89 20.65 2.67 -40.48 6.56<br />
CLASS C 15.65 13.21 5.06 -11.99 28.24 13.39 8.12 19.84 1.99 -40.92 6.22<br />
CLASS Z 16.79 14.33 6.11 -11.05 29.44 14.52 9.25 20.98 3.03 -40.37 6.84<br />
AVERAGE ANNUAL TOTAL RETURN – AVERAGE ANNUAL TOTAL RETURN–<br />
WITHOUT SALES CHARGES5, 13, 27 6, 13, 23<br />
WITH SALES CHARGES<br />
1 YR 3 YR 5 YR 10 YR INCEPTION 1 YR 3 YR 5 YR 10 YR INCEPTION<br />
CLASS A -25.52 -9.67 -1.08 2.90 7.41 -29.79 -11.45 -2.25 2.29 7.28<br />
CLASS C -26.01 -10.30 -1.74 2.22 6.47 -26.72 -10.30 -1.74 2.22 6.47<br />
CLASS Z -25.28 -9.39 -0.75 3.25 7.93 -25.28 -9.39 -0.75 3.25 7.93<br />
Class Z shares are only offered to certain eligible investors as stated in the prospectus.<br />
PORTFOLIO HOLDINGS 29 6/30<br />
Total Number of Positions 208<br />
PORTFOLIO BREAKDOWN<br />
Food, Beverage & Tobacco 17.61%<br />
Insurance 8.70<br />
Media<br />
Pharmaceuticals, Biotechnology &<br />
7.70<br />
Life Sciences 6.35<br />
Software & Services 5.73<br />
Materials 5.03<br />
Telecommunication Services 4.93<br />
Capital Goods 4.49<br />
Utilities 4.04<br />
Energy 3.04<br />
TOP 10 HOLDINGS7 Microsoft Corp. 3.44%<br />
Wyeth 3.43<br />
Comcast Corp. 2.85<br />
News Corp Inc. 2.39<br />
Berkshire Hathaway Inc. 2.32<br />
Imperial Tobacco Group PLC 2.29<br />
CVS Caremark Corp.<br />
White Mountains Insurance<br />
2.25<br />
Group Inc. 2.16<br />
Schering-Plough Corp. 2.14<br />
Weyerhaeuser Co. 1.93<br />
ANNUAL TOTAL RETURN 5, 27 –CLASS A<br />
WITHOUT SALES CHARGES<br />
0<br />
8.89%<br />
20.65%<br />
2.67%<br />
-40.48%<br />
2005 2006 2007 2008<br />
22, 27<br />
HYPOTHETICAL INVESTMENT<br />
CLASS A CLASS C CLASS Z<br />
$10,000 from Inception $271,571 $190,394 $361,752<br />
FUND FACTS<br />
Net Assets (millions)<br />
Expense Ratio 2<br />
Net Asset Value<br />
Public Offering Price<br />
Beta 3<br />
Standard Deviation 65<br />
FUND DISTRIBUTIONS<br />
CLASS A CLASS C CLASS Z<br />
$1,594.9 $392.3 $2,020.7<br />
1.13% 1.84% 0.84%<br />
$9.58 $9.39 $9.69<br />
$10.16 $9.39 $9.69<br />
0.88 0.88 0.88<br />
20.35 20.34 20.34<br />
Dividend Frequency<br />
Semiannually in September and December.<br />
CLASS A<br />
Dividend History<br />
CLASS C CLASS Z<br />
30<br />
12/08<br />
9/08<br />
12/07<br />
Capital Gains (last 12 mos.) 30<br />
— — —<br />
$0.0247 $0.0152 $0.0286<br />
0.4789 0.3727 0.5282<br />
Short-Term<br />
0.0640 0.0640 0.0640<br />
Long-Term<br />
0.3580 0.3580 0.3580<br />
6.56%<br />
YTD 2009 14<br />
ASSET ALLOCATION 29, 60 6/30<br />
Stocks 84%<br />
Cash 11%<br />
Bonds 5%<br />
DEALER USE ONLY/NOT FOR DISTRIBUTION TO THE PUBLIC Go to franklintempleton.com or call (800) 223-2141 <strong>Dealer</strong> <strong>Facts</strong> <strong>Guide</strong> 19<br />
OPEN-END FUNDS VALUE BLEND GROWTH SECTOR GLOBAL INTERNATIONAL HYBRID ASSET ALLOCATION FIXED INCOME TAX-FREE INCOME
OPEN-END FUNDS<br />
VALUE<br />
BLEND<br />
GROWTH<br />
SECTOR<br />
GLOBAL<br />
INTERNATIONAL<br />
HYBRID<br />
ASSET ALLOCATION<br />
FIXED INCOME<br />
TAX-FREE INCOME<br />
80 6/30/09<br />
Mutual Quest Fund<br />
OVERALL MORNINGSTAR RATING TM<br />
CLASS A 8<br />
★★★★★<br />
INVESTMENT CATEGORY<br />
Value<br />
PRIMARY INVESTMENT 37<br />
Common and preferred stock, as<br />
well as debt securities, including<br />
high-yield, lower-rated securities<br />
of domestic and foreign companies<br />
that the fund’s manager believes are<br />
undervalued. Investments include<br />
securities of companies involved<br />
in mergers, consolidations, liqui dations,<br />
and reorganizations.<br />
Effective 5/1/09, Mutual Qualified Fund<br />
changed its name to Mutual Quest Fund.<br />
The fund’s investment goal and strategy<br />
remained unchanged.<br />
FUND REFERENCE<br />
CLASS A CLASS C<br />
Fund No. 475 575<br />
CUSIP 628 380 800 628 380 883<br />
Symbol TEQIX TEMQX<br />
Inception1 9/26/80 9/26/80<br />
CLASS R CLASS Z89 Fund No. 875 075<br />
CUSIP 354 026 866 628 380 206<br />
Symbol — MQIFX<br />
Inception1 9/26/80 9/26/80<br />
ANNUAL PROSPECTUS UPDATE AVAILABLE:<br />
May 1<br />
PORTFOLIO MANAGER PROFILE84 Anne E. Gudefin, CFA<br />
Joined Mutual Series in 2000<br />
Managed Fund since 2002<br />
Shawn Tumulty<br />
Joined Mutual Series in 2000<br />
Managed Fund since 2003<br />
MAXIMUM SALES CHARGE & COMMISSION<br />
CLASS A CLASS C73 Sales Charge 5.75% 0.00%<br />
<strong>Dealer</strong> Concession 5.00 1.00<br />
12b-1 Fee to <strong>Dealer</strong> 0.25 1.00<br />
CLASS R CLASS Z89 Sales Charge 0.00% 0.00%<br />
<strong>Dealer</strong> Concession 0.00 0.00<br />
12b-1 Fee to <strong>Dealer</strong> 0.50 0.00<br />
See page 128 for more commission<br />
information and page 125 for footnotes.<br />
PERFORMANCE INFORMATION<br />
5, 13, 27<br />
ANNUAL TOTAL RETURN–WITHOUT SALES CHARGES<br />
1999 2000 2001 2002 2003 2004 2005 2006 2007 2008<br />
YTD<br />
200914 CLASS A 13.27 13.81 7.85 -13.00 29.98 16.27 10.85 18.94 8.73 -25.55 5.24<br />
CLASS C 12.54 13.11 7.16 -13.53 29.16 15.52 10.08 18.16 8.02 -26.06 4.87<br />
CLASS Z 13.64 14.25 8.21 -12.70 30.50 16.64 11.26 19.29 9.12 -25.34 5.41<br />
AVERAGE ANNUAL TOTAL RETURN – AVERAGE ANNUAL TOTAL RETURN–<br />
WITHOUT SALES CHARGES5, 13, 27 6, 13, 23<br />
WITH SALES CHARGES<br />
CLASS A<br />
CLASS C<br />
CLASS Z<br />
PORTFOLIO HOLDINGS 29 6/30<br />
Total Number of Positions 199<br />
PORTFOLIO BREAKDOWN<br />
Food, Beverage & Tobacco 24.67%<br />
Insurance 6.72<br />
Energy 6.03<br />
Capital Goods 5.65<br />
Real Estate<br />
Pharmaceuticals, Biotechnology &<br />
4.32<br />
Life Sciences 4.09<br />
Banks 1.60<br />
Health Care Equipment & Services 1.52<br />
Telecommunication Services 1.44<br />
Utilities 1.30<br />
TOP 10 HOLDINGS7 Schering-Plough Corp. 3.63%<br />
Wyeth 3.49<br />
Lorillard Inc. 3.11<br />
Danone 3.10<br />
British American Tobacco PLC 2.59<br />
Berkshire Hathaway Inc. 2.07<br />
Nestle SA 2.00<br />
Kone Corp.<br />
White Mountains Insurance<br />
1.94<br />
Group Inc. 1.75<br />
Pernod Ricard SA 1.62<br />
ANNUAL TOTAL RETURN 5, 27 –CLASS A<br />
WITHOUT SALES CHARGES<br />
0<br />
10.85%<br />
1 YR 3 YR 5 YR 10 YR INCEPTION 1 YR 3 YR 5 YR 10 YR INCEPTION<br />
-13.79 -1.64 4.86 5.83 13.13 -18.73 -3.56 3.62 5.20 12.90<br />
-14.38 -2.31 4.16 5.14 12.15 -15.16 -2.31 4.16 5.14 12.15<br />
-13.50 -1.32 5.21 6.19 13.67 -13.50 -1.32 5.21 6.19 13.67<br />
Class Z shares are only offered to certain eligible investors as stated in the prospectus.<br />
18.94%<br />
8.73%<br />
-25.55%<br />
2005 2006 2007 2008<br />
22, 27<br />
HYPOTHETICAL INVESTMENT<br />
CLASS A CLASS C CLASS Z<br />
$10,000 from Inception $327,488 $270,167 $398,726<br />
FUND FACTS<br />
Net Assets (millions)<br />
Expense Ratio 2<br />
Net Asset Value<br />
Public Offering Price<br />
Beta 3<br />
Standard Deviation 65<br />
FUND DISTRIBUTIONS<br />
CLASS A CLASS C CLASS Z<br />
$962.3 $351.8 $3,192.5<br />
1.11% 1.80% 0.81%<br />
$15.26 $15.08 $15.38<br />
$16.19 $15.08 $15.38<br />
0.47 0.47 0.47<br />
11.46 11.48 11.46<br />
Dividend Frequency<br />
Semiannually in September and December.<br />
CLASS A<br />
Dividend History<br />
CLASS C CLASS Z<br />
30<br />
12/08<br />
9/08<br />
12/07<br />
Capital Gains (last 12 mos.) 30<br />
$0.2211 $0.0949 $0.2755<br />
0.0379 0.0262 0.0441<br />
0.5954 0.4590 0.6662<br />
Short-Term<br />
0.9134 0.9134 0.9134<br />
Long-Term<br />
0.4935 0.4935 0.4935<br />
5.24%<br />
YTD 2009 14<br />
ASSET ALLOCATION 29, 60 6/30<br />
Stocks 64%<br />
Cash 33%<br />
Bonds 3%<br />
20 <strong>Dealer</strong> <strong>Facts</strong> <strong>Guide</strong> Go to franklintempleton.com or call (800) 223-2141 DEALER USE ONLY/NOT FOR DISTRIBUTION TO THE PUBLIC
Mutual Recovery Fund<br />
INVESTMENT CATEGORY<br />
Value<br />
PRIMARY INVESTMENT 37<br />
The fund seeks capital appreciation<br />
while maintaining a low correlation<br />
to the U.S. equity markets by seeking<br />
investments in these three categories:<br />
bankruptcy and distressed<br />
companies, risk arbitrage, and<br />
undervalued stocks. The fund may<br />
take both long and short positions.<br />
The minimum initial purchase is $10,000<br />
and the minimum subsequent investment in<br />
the continuous offering is $1,000.<br />
FUND REFERENCE<br />
CLASS A CLASS C<br />
Fund No. 471 571<br />
CUSIP 354 02P 203 354 02P 401<br />
Symbol FMRAX FCMRX<br />
Inception1 6/2/03 6/2/03<br />
ADVISOR89 Fund No. 070<br />
CUSIP 354 02P 104<br />
Symbol FMRVX<br />
Inception1 6/2/03<br />
ANNUAL PROSPECTUS UPDATE AVAILABLE:<br />
August 1<br />
PORTFOLIO MANAGER PROFILE84 Shawn Tumulty<br />
Joined Mutual Series in 2000<br />
Managed Fund since 2005<br />
Christian Correa, CFA<br />
Joined Mutual Series in 2003<br />
Managed Fund since 2004<br />
Keith Luh, CFA<br />
Joined Mutual Series in 2005<br />
Managed Fund since 2009<br />
MAXIMUM SALES CHARGE & COMMISSION<br />
CLASS A CLASS C73 Sales Charge 5.75% 0.00%<br />
<strong>Dealer</strong> Concession 5.00 1.00<br />
12b-1 Fee to <strong>Dealer</strong> 0.25 1.00<br />
ADVISOR89 Sales Charge 0.00%<br />
<strong>Dealer</strong> Concession 0.00<br />
12b-1 Fee to <strong>Dealer</strong> 0.00<br />
See page 128 for more commission<br />
information and page 125 for footnotes.<br />
PORTFOLIO HOLDINGS 29 6/30<br />
Total Number of Positions 127<br />
PORTFOLIO BREAKDOWN<br />
Food, Beverage & Tobacco<br />
Pharmaceuticals, Biotechnology &<br />
10.00%<br />
Life Sciences 6.27<br />
Insurance 6.19<br />
Media 5.91<br />
Materials 4.80<br />
Utilities 4.35<br />
Transportation<br />
Semiconductors & Semiconductor<br />
3.76<br />
Equipment 3.42<br />
Food & Staples Retailing 2.85<br />
Diversified Financials 2.80<br />
TOP 10 HOLDINGS7 Wyeth 6.17%<br />
Schering-Plough Corp. 4.35<br />
Smurfit-Stone Container Enterprises 4.15<br />
Virgin Media Inc. 3.82<br />
Symetra Financial 3.72<br />
Constellation Energy Group 3.53<br />
CVS Caremark Corp.<br />
Motor Coach Industries<br />
2.85<br />
International Inc. 2.77<br />
Community Health Systems Inc. 2.59<br />
Weyerhaeuser Co. 2.52<br />
The fund is a continuously offered closed-end fund.<br />
Shares may be purchased daily. There is no daily<br />
redemption; instead the fund intends to make quarterly<br />
tender offers for 5%–25% of the outstanding shares.<br />
ANNUAL TOTAL RETURN 5, 77 –CLASS A<br />
WITHOUT SALES CHARGES<br />
0<br />
18.59%<br />
2005 2006 2007 2008<br />
22, 77<br />
HYPOTHETICAL INVESTMENT<br />
CLASS A CLASS C ADVISOR<br />
$10,000 from Inception $10,057 $10,266 $10,893<br />
FUND FACTS<br />
Net Assets (millions)<br />
Expense Ratio 2<br />
Net Asset Value<br />
Public Offering Price<br />
Beta 3<br />
6.74% 7.44%<br />
0.98% -41.66%<br />
Standard Deviation 65<br />
FUND DISTRIBUTIONS<br />
Dividend Frequency<br />
Annually in December.<br />
Dividend History 30<br />
12/08<br />
12/07<br />
6/07<br />
Capital Gains (last 12 mos.) 30<br />
Short-Term<br />
Long-Term<br />
YTD 2009 14<br />
6/30/09<br />
PERFORMANCE INFORMATION<br />
5, 77<br />
ANNUAL TOTAL RETURN–WITHOUT SALES CHARGES<br />
1999 2000 2001 2002 2003 2004 2005 2006 2007 2008<br />
YTD<br />
200914 CLASS A — — — — — 13.11 6.74 18.59 0.98 -41.66 7.44<br />
CLASS C — — — — — 12.47 5.99 17.86 0.40 -42.06 7.00<br />
ADVISOR — — — — — 13.53 7.04 19.07 1.36 -41.43 7.51<br />
AVERAGE ANNUAL TOTAL RETURN – AVERAGE ANNUAL TOTAL RETURN–<br />
WITHOUT SALES CHARGES5, 77 6, 77<br />
WITH SALES CHARGES<br />
1 YR 3 YR 5 YR 10 YR INCEPTION 1 YR 3 YR 5 YR 10 YR INCEPTION<br />
CLASS A -27.77 -11.11 -2.44 — 1.07 -31.93 -12.85 -3.59 — 0.09<br />
CLASS C -28.31 -11.69 -3.07 — 0.43 -29.02 -11.69 -3.07 — 0.43<br />
ADVISOR -27.61 -10.81 -2.11 — 1.42 -27.61 -10.81 -2.11 — 1.42<br />
Advisor Class shares are only offered to certain eligible investors as stated in the prospectus.<br />
CLASS A CLASS C ADVISOR<br />
$99.2 $38.9 $36.0<br />
2.48% 3.13% 2.13%<br />
$8.09 $7.95 $8.16<br />
$8.58 $7.95 $8.16<br />
0.93 0.93 0.93<br />
19.62 19.58 19.62<br />
CLASS A CLASS C ADVISOR<br />
$0.1852 $0.1055 $0.2311<br />
0.1582 0.0932 0.1936<br />
0.1362 0.1164 0.1453<br />
0.0081 0.0081 0.0081<br />
0.0005 0.0005 0.0005<br />
ASSET ALLOCATION 29, 60 6/30<br />
Stocks 63%<br />
Cash 19%<br />
Bonds 18%<br />
DEALER USE ONLY/NOT FOR DISTRIBUTION TO THE PUBLIC Go to franklintempleton.com or call (800) 223-2141 <strong>Dealer</strong> <strong>Facts</strong> <strong>Guide</strong> 21<br />
OPEN-END FUNDS VALUE BLEND GROWTH SECTOR GLOBAL INTERNATIONAL HYBRID ASSET ALLOCATION FIXED INCOME TAX-FREE INCOME
OPEN-END FUNDS<br />
VALUE<br />
BLEND<br />
GROWTH<br />
SECTOR<br />
GLOBAL<br />
INTERNATIONAL<br />
HYBRID<br />
ASSET ALLOCATION<br />
FIXED INCOME<br />
TAX-FREE INCOME<br />
Mutual Shares Fund<br />
OVERALL MORNINGSTAR RATING TM<br />
CLASS A 8<br />
★★★★<br />
INVESTMENT CATEGORY<br />
Value<br />
PRIMARY INVESTMENT 37<br />
Common and preferred stock, as<br />
well as debt securities, including<br />
high-yield, lower-rated securities<br />
of domestic and foreign companies<br />
that the fund’s manager believes are<br />
undervalued. Investments include<br />
securities of companies involved in<br />
mergers, consolidations, liquidations,<br />
and reorganizations.<br />
FUND REFERENCE<br />
CLASS A CLASS C<br />
Fund No. 474 574<br />
CUSIP 628 380 602 628 380 701<br />
Symbol TESIX TEMTX<br />
Inception1 7/1/49 7/1/49<br />
CLASS R CLASS Z89 Fund No. 874 074<br />
CUSIP 354 026 502 628 380 107<br />
Symbol TESRX MUTHX<br />
Inception1 7/1/49 7/1/49<br />
ANNUAL PROSPECTUS UPDATE AVAILABLE:<br />
May 1<br />
PORTFOLIO MANAGER PROFILE84 Peter Langerman<br />
Tenure at Mutual Series:<br />
1986-2002, 2005<br />
Managed Fund since<br />
1986-2001, 2005<br />
F. David Segal, CFA<br />
Joined Mutual Series in 2002<br />
Managed Fund since 2005<br />
Deborah A. Turner, CFA<br />
Joined Mutual Series in 1993<br />
Managed Fund since 2001<br />
MAXIMUM SALES CHARGE & COMMISSION<br />
CLASS A CLASS C73 Sales Charge 5.75% 0.00%<br />
<strong>Dealer</strong> Concession 5.00 1.00<br />
12b-1 Fee to <strong>Dealer</strong> 0.25 1.00<br />
CLASS R CLASS Z89 Sales Charge 0.00% 0.00%<br />
<strong>Dealer</strong> Concession 0.00 0.00<br />
12b-1 Fee to <strong>Dealer</strong> 0.50 0.00<br />
See page 128 for more commission<br />
information and page 125 for footnotes.<br />
PORTFOLIO HOLDINGS 29 6/30<br />
Total Number of Positions 245<br />
PORTFOLIO BREAKDOWN<br />
Food, Beverage & Tobacco 18.51%<br />
Capital Goods 7.13<br />
Insurance 7.03<br />
Energy 5.98<br />
Materials 5.85<br />
Food & Staples Retailing 5.25<br />
Media<br />
Pharmaceuticals, Biotechnology &<br />
5.00<br />
Life Sciences 4.64<br />
Utilities 4.20<br />
Technology Hardware & Equipment 3.57<br />
TOP 10 HOLDINGS7 Wyeth 2.90%<br />
Berkshire Hathaway Inc. 2.82<br />
British American Tobacco PLC 2.55<br />
Microsoft Corp. 2.35<br />
CVS Caremark Corp. 2.30<br />
Comcast Corp. 2.12<br />
Imperial Tobacco Group PLC 2.03<br />
Nestle SA 1.85<br />
Schering-Plough Corp. 1.74<br />
News Corp Inc. 1.54<br />
ANNUAL TOTAL RETURN 5, 27 –CLASS A<br />
WITHOUT SALES CHARGES<br />
17.98%<br />
9.98%<br />
2.97%<br />
-38.10%<br />
0<br />
2005 2006 2007 2008<br />
22, 27<br />
HYPOTHETICAL INVESTMENT<br />
CLASS A CLASS C CLASS Z<br />
$10,000 from Inception $8,164,614 $3,526,524 $14,665,231<br />
FUND FACTS<br />
Net Assets (millions)<br />
Expense Ratio 2<br />
Net Asset Value<br />
Public Offering Price<br />
Beta 3<br />
Standard Deviation 65<br />
FUND DISTRIBUTIONS<br />
6/30/09<br />
PERFORMANCE INFORMATION<br />
5, 13, 27<br />
ANNUAL TOTAL RETURN–WITHOUT SALES CHARGES<br />
1999 2000 2001 2002 2003 2004 2005 2006 2007 2008<br />
YTD<br />
200914 CLASS A 14.63 13.42 5.94 -11.20 26.18 13.50 9.98 17.98 2.97 -38.10 5.26<br />
CLASS C 13.87 12.68 5.26 -11.78 25.37 12.77 9.27 17.18 2.30 -38.53 4.90<br />
CLASS Z 15.00 13.83 6.32 -10.89 26.62 13.89 10.39 18.37 3.30 -37.92 5.42<br />
AVERAGE ANNUAL TOTAL RETURN – AVERAGE ANNUAL TOTAL RETURN–<br />
WITHOUT SALES CHARGES5, 13, 27, 34 6, 13, 23, 34<br />
WITH SALES CHARGES<br />
1 YR 3 YR 5 YR 10 YR INCEPTION 1 YR 3 YR 5 YR 10 YR INCEPTION<br />
CLASS A -23.79 -9.07 -0.88 2.71 11.93 -28.17 -10.85 -2.05 2.11 11.82<br />
CLASS C -24.32 -9.69 -1.54 2.04 10.27 -25.07 -9.69 -1.54 2.04 10.27<br />
CLASS Z -23.55 -8.79 -0.55 3.06 12.92 -23.55 -8.79 -0.55 3.06 12.92<br />
Class Z shares are only offered to certain eligible investors as stated in the prospectus.<br />
CLASS A CLASS C CLASS Z<br />
$4,388.7 $1,203.6 $7,267.5<br />
1.08% 1.77% 0.79%<br />
$16.02 $15.84 $16.15<br />
$17.00 $15.84 $16.15<br />
0.83 0.83 0.83<br />
18.97 18.97 18.97<br />
Dividend Frequency<br />
Semiannually in September and December.<br />
CLASS A<br />
Dividend History<br />
CLASS C CLASS Z<br />
30<br />
12/08<br />
9/08<br />
12/07<br />
Capital Gains (last 12 mos.) 30<br />
$0.1791 $0.0332 $0.2371<br />
0.0264 0.0114 0.0330<br />
0.6352 0.4685 0.7110<br />
Short-Term<br />
0.1653 0.1653 0.1653<br />
Long-Term<br />
0.0356 0.0356 0.0356<br />
5.26%<br />
YTD 2009 14<br />
ASSET ALLOCATION 29, 60 6/30<br />
Stocks 86%<br />
Cash 9%<br />
Bonds 5%<br />
22 <strong>Dealer</strong> <strong>Facts</strong> <strong>Guide</strong> Go to franklintempleton.com or call (800) 223-2141 DEALER USE ONLY/NOT FOR DISTRIBUTION TO THE PUBLIC
<strong>Franklin</strong> Focused Core Equity Fund<br />
OVERALL MORNINGSTAR<br />
RATINGTM 8, 67<br />
– CLASS A<br />
INVESTMENT CATEGORY<br />
Blend<br />
PRIMARY INVESTMENT 37<br />
The fund will generally seek to<br />
maintain a portfolio consisting of<br />
securities of approximately 30 to 40<br />
companies, primarily equity securities<br />
of large-capitalization companies<br />
across the style spectrum from<br />
value to growth.<br />
FUND REFERENCE<br />
CLASS A CLASS C<br />
Fund No. 443 543<br />
CUSIP 354 713 448 354 713 430<br />
Symbol — —<br />
Inception1 12/13/07 12/13/07<br />
CLASS R ADVISOR89 Fund No. 843 600<br />
CUSIP 354 713 422 354 713 414<br />
Symbol — —<br />
Inception1 12/13/07 12/13/07<br />
ANNUAL PROSPECTUS UPDATE AVAILABLE:<br />
September 1<br />
PORTFOLIO MANAGER PROFILE84 Steve Kornfeld, CFA<br />
Joined <strong>Franklin</strong> <strong>Templeton</strong> in 2001<br />
Managed Fund since 2007<br />
Edward D. Perks, CFA<br />
Joined <strong>Franklin</strong> <strong>Templeton</strong> in 1992<br />
Managed Fund since 2007<br />
MAXIMUM SALES CHARGE & COMMISSION<br />
CLASS A CLASS C73 Sales Charge 5.75% 0.00%<br />
<strong>Dealer</strong> Concession 5.00 1.00<br />
12b-1 Fee to <strong>Dealer</strong> 0.25 1.00<br />
CLASS R ADVISOR89 Sales Charge 0.00% 0.00%<br />
<strong>Dealer</strong> Concession 0.00 0.00<br />
12b-1 Fee to <strong>Dealer</strong> 0.50 0.00<br />
See page 128 for more commission<br />
information and page 125 for footnotes.<br />
PORTFOLIO HOLDINGS 29 6/30<br />
Total Number of Positions 36<br />
PORTFOLIO BREAKDOWN<br />
Pharmaceuticals, Biotechnology &<br />
Life Sciences 17.27%<br />
Capital Goods 8.66<br />
Energy 8.21<br />
Software & Services 7.78<br />
Food, Beverage & Tobacco 5.05<br />
Insurance 4.66<br />
Banks 4.21<br />
Food & Staples Retailing 3.81<br />
Materials 3.63<br />
Commercial & Professional Services 3.39<br />
TOP 10 HOLDINGS7 Berkshire Hathaway Inc. 4.66%<br />
Schering-Plough Corp. 4.62<br />
MasterCard Inc. 4.28<br />
Roche Holding AG 4.22<br />
Merck & Company Inc. 4.03<br />
CVS Caremark Corp. 3.81<br />
Marathon Oil Corp. 3.77<br />
Celanese Corp. 3.63<br />
Petroplus Holdings AG 3.59<br />
U.S. Bancorp 3.56<br />
ANNUAL TOTAL RETURN 5, 9 –CLASS A<br />
WITHOUT SALES CHARGES<br />
0<br />
-44.63%<br />
2005 2006 2007 2008<br />
9, 22<br />
HYPOTHETICAL INVESTMENT<br />
CLASS A CLASS C ADVISOR<br />
$10,000 from Inception $6,308 $6,622 $6,731<br />
FUND FACTS<br />
Net Assets (millions)<br />
2, 9<br />
Expense Ratio<br />
without waiver<br />
with waiver<br />
Net Asset Value<br />
Public Offering Price<br />
Beta 3<br />
Standard Deviation 65<br />
FUND DISTRIBUTIONS<br />
Dividend Frequency<br />
Annually in December.<br />
Dividend History 30<br />
12/08<br />
12/07<br />
Capital Gains (last 12 mos.) 30<br />
Short-Term<br />
Long-Term<br />
19.56%<br />
YTD 2009 14<br />
6/30/09<br />
PERFORMANCE INFORMATION<br />
5, 9<br />
ANNUAL TOTAL RETURN–WITHOUT SALES CHARGES<br />
1999 2000 2001 2002 2003 2004 2005 2006 2007 2008<br />
YTD<br />
200914 CLASS A — — — — — — — — — -44.63 19.56<br />
CLASS C — — — — — — — — — -44.99 19.08<br />
ADVISOR — — — — — — — — — -44.54 19.93<br />
AVERAGE ANNUAL TOTAL RETURN – AVERAGE ANNUAL TOTAL RETURN–<br />
WITHOUT SALES CHARGES5, 9 6, 9<br />
WITH SALES CHARGES<br />
1 YR 3 YR 5 YR 10 YR INCEPTION 1 YR 3 YR 5 YR 10 YR INCEPTION<br />
CLASS A -18.38 — — — -22.85 -23.07 — — — -25.74<br />
CLASS C -19.04 — — — -23.38 -19.84 — — — -23.38<br />
ADVISOR -18.11 — — — -22.56 -18.11 — — — -22.56<br />
Advisor Class shares are only offered to certain eligible investors as stated in the prospectus.<br />
CLASS A CLASS C ADVISOR<br />
$5.7 $0.3 $0.2<br />
5.53% 6.16% 5.20%<br />
1.25% 1.88% 0.92%<br />
$6.54 $6.49 $6.56<br />
$6.94 $6.49 $6.56<br />
— — —<br />
— — —<br />
CLASS A CLASS C ADVISOR<br />
$0.0989 $0.0829 $0.1129<br />
— — —<br />
0.0217 0.0217 0.0217<br />
0.0002 0.0002 0.0002<br />
ASSET ALLOCATION 29, 60 6/30<br />
Stocks 91%<br />
Cash 9%<br />
DEALER USE ONLY/NOT FOR DISTRIBUTION TO THE PUBLIC Go to franklintempleton.com or call (800) 223-2141 <strong>Dealer</strong> <strong>Facts</strong> <strong>Guide</strong> 23<br />
OPEN-END FUNDS VALUE BLEND GROWTH SECTOR GLOBAL INTERNATIONAL HYBRID ASSET ALLOCATION FIXED INCOME TAX-FREE INCOME
OPEN-END FUNDS<br />
VALUE<br />
BLEND<br />
GROWTH<br />
SECTOR<br />
GLOBAL<br />
INTERNATIONAL<br />
HYBRID<br />
ASSET ALLOCATION<br />
FIXED INCOME<br />
TAX-FREE INCOME<br />
<strong>Franklin</strong> Large Cap Equity Fund<br />
INVESTMENT CATEGORY<br />
Blend<br />
PRIMARY INVESTMENT 37<br />
Seeks long-term growth of principal<br />
and income by investing predominantly<br />
in large-cap equity securities<br />
across the style spectrum from value<br />
to growth.<br />
FUND REFERENCE<br />
CLASS A CLASS C<br />
Fund No. 428 278<br />
CUSIP 353 533 680 353 533 672<br />
Symbol — —<br />
Inception1 12/11/98 12/11/98<br />
CLASS R ADVISOR 89<br />
Fund No. 828 064<br />
CUSIP 353 533 664 353 533 870<br />
Symbol — FLCIX<br />
Inception1 12/11/98 12/11/98<br />
ANNUAL PROSPECTUS UPDATE AVAILABLE:<br />
September 30<br />
PORTFOLIO MANAGER PROFILE84 Mackin Pulsifer<br />
Joined <strong>Franklin</strong> <strong>Templeton</strong> in 1988<br />
Managed Fund since 1998<br />
Kenneth Siegel<br />
Joined <strong>Franklin</strong> <strong>Templeton</strong> in 1996<br />
Managed Fund since 2005<br />
Linda Krouner<br />
Joined <strong>Franklin</strong> <strong>Templeton</strong> in 2001<br />
Managed Fund since 2008<br />
MAXIMUM SALES CHARGE & COMMISSION<br />
CLASS A CLASS C73 Sales Charge 5.75% 0.00%<br />
<strong>Dealer</strong> Concession 5.00 1.00<br />
12b-1 Fee to <strong>Dealer</strong> 0.25 1.00<br />
CLASS R ADVISOR 89<br />
Sales Charge 0.00% 0.00%<br />
<strong>Dealer</strong> Concession 0.00 0.00<br />
12b-1 Fee to <strong>Dealer</strong> 0.50 0.00<br />
See page 128 for more commission<br />
information and page 125 for footnotes.<br />
PORTFOLIO HOLDINGS 29 6/30<br />
Total Number of Positions 55<br />
PORTFOLIO BREAKDOWN<br />
Pharmaceuticals, Biotechnology &<br />
Life Sciences 13.71%<br />
Technology Hardware & Equipment 13.19<br />
Energy 12.28<br />
Capital Goods 10.88<br />
Food, Beverage & Tobacco 10.08<br />
Diversified Financials 8.51<br />
Software & Services 5.45<br />
Materials 4.72<br />
Telecommunication Services 4.69<br />
Retailing 4.15<br />
TOP 10 HOLDINGS7 Exxon Mobil Corp. 3.37%<br />
Home Depot Inc. 2.77<br />
Nestle SA 2.69<br />
ABB Ltd. 2.67<br />
Roche Holding AG 2.54<br />
Johnson & Johnson 2.50<br />
Schlumberger Ltd. 2.36<br />
BlackRock Inc./New York 2.32<br />
Celgene Corp. 2.32<br />
Qualcomm Inc. 2.31<br />
ANNUAL TOTAL RETURN 5, 9, 63 –CLASS A<br />
WITHOUT SALES CHARGES<br />
3.97%<br />
0<br />
10.88%<br />
11.15%<br />
-38.99%<br />
2005 2006 2007 2008<br />
6.16%<br />
YTD 2009 14<br />
6/30/09<br />
PERFORMANCE INFORMATION<br />
5, 9, 63<br />
ANNUAL TOTAL RETURN–WITHOUT SALES CHARGES<br />
1999 2000 2001 2002 2003 2004 2005 2006 2007 2008<br />
YTD<br />
2009 14<br />
CLASS A 7.59 -2.51 -11.32 -21.62 26.00 10.83 3.97 10.88 11.15 -38.99 6.16<br />
CLASS C 6.09 -3.96 -12.11 -22.15 25.14 9.96 3.11 10.08 10.38 -39.38 5.70<br />
ADVISOR 8.42 -1.70 -10.89 -21.33 26.46 11.30 4.43 11.32 11.56 -38.80 6.29<br />
AVERAGE ANNUAL TOTAL RETURN– AVERAGE ANNUAL TOTAL RETURN–<br />
WITHOUT SALES CHARGES5, 9, 63 6, 9, 63<br />
WITH SALES CHARGES<br />
1 YR 3 YR 5 YR 10 YR INCEPTION 1 YR 3 YR 5 YR 10 YR INCEPTION<br />
CLASS A -29.23 -7.68 -2.50 -2.28 -0.96 -33.30 -9.48 -3.65 -2.86 -1.52<br />
CLASS C -29.75 -8.34 -3.24 -3.15 -1.83 -30.43 -8.34 -3.24 -3.15 -1.83<br />
ADVISOR -29.04 -7.36 -2.13 -1.82 -0.50 -29.04 -7.36 -2.13 -1.82 -0.50<br />
Advisor Class shares are only offered to certain eligible investors as stated in the prospectus.<br />
9, 22, 63<br />
HYPOTHETICAL INVESTMENT<br />
CLASS A CLASS C ADVISOR<br />
$10,000 from Inception $8,511 $8,228 $9,485<br />
FUND FACTS<br />
Net Assets (millions)<br />
2, 9<br />
Expense Ratio<br />
without waiver<br />
with waiver<br />
Net Asset Value<br />
Public Offering Price<br />
Beta 3<br />
Standard Deviation65 *Less than $100,000<br />
FUND DISTRIBUTIONS<br />
Dividend Frequency<br />
Quarterly.<br />
Dividend History 30<br />
6/09<br />
3/09<br />
12/08<br />
Capital Gains (last 12 mos.) 30<br />
Short-Term<br />
Long-Term<br />
ASSET ALLOCATION 29, 60 6/30<br />
Stocks 98%<br />
Cash 2%<br />
CLASS A CLASS C ADVISOR<br />
$1.3 $0.1* $46.3<br />
1.44% 2.09% 1.09%<br />
1.30% 1.95% 0.95%<br />
$4.30 $4.29 $4.30<br />
$4.56 $4.29 $4.30<br />
0.94 0.93 0.94<br />
19.31 19.25 19.30<br />
CLASS A CLASS C ADVISOR<br />
$0.0139 $0.0098 $0.0168<br />
0.0058 0.0020 0.0050<br />
0.0110 0.0052 0.0220<br />
— — —<br />
0.1470 0.1470 0.1470<br />
24 <strong>Dealer</strong> <strong>Facts</strong> <strong>Guide</strong> Go to franklintempleton.com or call (800) 223-2141 DEALER USE ONLY/NOT FOR DISTRIBUTION TO THE PUBLIC
<strong>Franklin</strong> Rising Dividends Fund<br />
OVERALL MORNINGSTAR RATING TM<br />
CLASS A 8<br />
★★★★<br />
MORNINGSTAR STYLE BOX<br />
STYLE<br />
Value Blend Growth<br />
SIZE<br />
Large<br />
✕ Medium<br />
Small<br />
✕ Current<br />
Historical<br />
INVESTMENT CATEGORY<br />
Blend<br />
TM 67<br />
PRIMARY INVESTMENT 37<br />
Equity securities of companies<br />
that have paid consistently rising<br />
dividends over the past 10 years.<br />
FUND REFERENCE<br />
CLASS A CLASS C<br />
Fund No. 158 258<br />
CUSIP 353 825 102 353 825 409<br />
Symbol FRDPX FRDTX<br />
Inception1 1/14/87 5/1/95<br />
CLASS R ADVISOR 89<br />
Fund No. 858 658<br />
CUSIP 353 825 706 353 825 805<br />
Symbol FRDRX FRDAX<br />
Inception1 1/14/87 1/14/87<br />
ANNUAL PROSPECTUS UPDATE AVAILABLE:<br />
February 1<br />
PORTFOLIO MANAGER PROFILE84 Donald G. Taylor, CPA<br />
Joined <strong>Franklin</strong> <strong>Templeton</strong> in 1996<br />
Managed Fund since 1996<br />
William J. Lippman<br />
Joined <strong>Franklin</strong> <strong>Templeton</strong> in 1988<br />
Managed Fund since 1987<br />
Margaret McGee<br />
Joined <strong>Franklin</strong> <strong>Templeton</strong> in 1988<br />
Managed Fund since 1988<br />
Bruce C. Baughman, CPA<br />
Joined <strong>Franklin</strong> <strong>Templeton</strong> in 1988<br />
Managed Fund since 1987<br />
MAXIMUM SALES CHARGE & COMMISSION<br />
CLASS A CLASS C73 Sales Charge 5.75% 0.00%<br />
<strong>Dealer</strong> Concession 5.00 1.00<br />
12b-1 Fee to <strong>Dealer</strong> 0.25 1.00<br />
CLASS R ADVISOR 89<br />
Sales Charge 0.00% 0.00%<br />
<strong>Dealer</strong> Concession 0.00 0.00<br />
12b-1 Fee to <strong>Dealer</strong> 0.50 0.00<br />
See page 128 for more commission<br />
information and page 125 for footnotes.<br />
PORTFOLIO HOLDINGS 29 6/30<br />
Total Number of Positions 44<br />
PORTFOLIO BREAKDOWN<br />
Capital Goods 22.63%<br />
Insurance 12.31<br />
Health Care Equipment & Services 12.19<br />
Materials 11.82<br />
Household & Personal Products<br />
Pharmaceuticals, Biotechnology &<br />
6.71<br />
Life Sciences 5.37<br />
Food & Staples Retailing 4.99<br />
Retailing 4.58<br />
Food, Beverage & Tobacco 3.95<br />
Commercial & Professional Services 2.49<br />
TOP 10 HOLDINGS7 Becton Dickinson & Co. 5.43%<br />
Praxair Inc. 5.20<br />
Roper Industries Inc. 5.18<br />
United Technologies Corp. 5.09<br />
Procter & Gamble Co. 5.00<br />
Wal-Mart Stores Inc. 4.99<br />
Family Dollar Stores Inc. 4.41<br />
McCormick & Company Inc. 3.95<br />
Dover Corp. 3.92<br />
Erie Indemnity Co. 3.66<br />
ANNUAL TOTAL RETURN 5 –CLASS A<br />
WITHOUT SALES CHARGES<br />
17.36%<br />
0<br />
2.32%<br />
-2.95%<br />
2005 2006 2007 2008<br />
HYPOTHETICAL INVESTMENT 22<br />
$10,000 from Inception<br />
FUND FACTS<br />
Net Assets (millions)<br />
Expense Ratio 2<br />
Net Asset Value<br />
Public Offering Price<br />
Beta 3<br />
-27.22% -0.71%<br />
Standard Deviation 65<br />
FUND DISTRIBUTIONS<br />
Dividend Frequency<br />
Annually in December.<br />
4, 30<br />
Dividend History<br />
12/08<br />
12/07<br />
12/06<br />
Capital Gains (last 4, 30 12 mos.)<br />
Short-Term<br />
Long-Term<br />
YTD 2009 14<br />
6/30/09<br />
PERFORMANCE INFORMATION<br />
5, 13<br />
ANNUAL TOTAL RETURN–WITHOUT SALES CHARGES<br />
1999 2000 2001 2002 2003 2004 2005 2006 2007 2008<br />
YTD<br />
2009 14<br />
CLASS A<br />
CLASS C<br />
ADVISOR43 -10.28 18.98 13.11 -1.76 23.70 10.28 2.32 17.36 -2.95 -27.22 -0.71<br />
-10.77 18.38 12.47 -2.24 22.98 9.67 1.58 16.49 -3.69 -27.75 -1.05<br />
-10.28 18.98 13.11 -1.76 23.70 10.28 2.36 17.65 -2.69 -27.01 -0.59<br />
AVERAGE ANNUAL TOTAL RETURN– AVERAGE ANNUAL TOTAL RETURN–<br />
WITHOUT SALES CHARGES5, 13 6, 13, 46<br />
WITH SALES CHARGES<br />
1 YR 3 YR 5 YR 10 YR INCEPTION 1 YR 3 YR 5 YR 10 YR INCEPTION<br />
CLASS A<br />
CLASS C<br />
ADVISOR43 -20.15 -7.82 -2.28 2.90 7.74 -24.74 -9.63 -3.43 2.29 7.46<br />
-20.74 -8.50 -2.97 2.25 6.99 -21.52 -8.50 -2.97 2.25 6.99<br />
-19.91 -7.57 -2.09 3.00 7.79 -19.91 -7.57 -2.09 3.00 7.79<br />
Advisor Class shares are only offered to certain eligible investors as stated in the prospectus.<br />
CLASS A CLASS C ADVISOR 43<br />
$50,300 $26,032 $53,887<br />
CLASS A CLASS C ADVISOR<br />
$1,193.5 $311.0 $48.3<br />
1.03% 1.77% 0.78%<br />
$23.78 $23.55 $23.74<br />
$25.23 $23.55 $23.74<br />
0.80 0.80 0.80<br />
17.85 17.86 17.84<br />
CLASS A CLASS C ADVISOR<br />
$0.5145 $0.2765 $0.5943<br />
0.4518 0.1671 0.5467<br />
0.9139 0.6605 0.9958<br />
— — —<br />
— — —<br />
ASSET ALLOCATION 29, 60 6/30<br />
Stocks 93%<br />
Cash 7%<br />
DEALER USE ONLY/NOT FOR DISTRIBUTION TO THE PUBLIC Go to franklintempleton.com or call (800) 223-2141 <strong>Dealer</strong> <strong>Facts</strong> <strong>Guide</strong> 25<br />
OPEN-END FUNDS VALUE BLEND GROWTH SECTOR GLOBAL INTERNATIONAL HYBRID ASSET ALLOCATION FIXED INCOME TAX-FREE INCOME
OPEN-END FUNDS<br />
VALUE<br />
BLEND<br />
GROWTH<br />
SECTOR<br />
GLOBAL<br />
INTERNATIONAL<br />
HYBRID<br />
ASSET ALLOCATION<br />
FIXED INCOME<br />
TAX-FREE INCOME<br />
62 6/30/09<br />
<strong>Franklin</strong> Flex Cap Growth Fund<br />
TM 67<br />
MORNINGSTAR STYLE BOX<br />
STYLE<br />
Value Blend Growth<br />
SIZE<br />
✕ Large<br />
Medium<br />
✕ Current<br />
Small Historical<br />
INVESTMENT CATEGORY<br />
Growth<br />
PRIMARY INVESTMENT 37<br />
Equity securities of companies in<br />
any industry and of any market<br />
cap size.<br />
FUND REFERENCE<br />
CLASS A CLASS C<br />
Fund No. 180 280<br />
CUSIP 352 51D 103 352 51D 202<br />
Symbol FKCGX FCIIX<br />
Inception1 10/30/91 9/3/96<br />
CLASS R ADVISOR89 Fund No. 880 683<br />
CUSIP 354 713 562 354 713 463<br />
Symbol FRCGX FKCAX<br />
Inception1 10/30/91 10/30/91<br />
ANNUAL PROSPECTUS UPDATE AVAILABLE:<br />
September 1<br />
PORTFOLIO MANAGER PROFILE84 Conrad B. Herrmann, CFA<br />
Joined <strong>Franklin</strong> <strong>Templeton</strong> in 1989<br />
Managed Fund since 1993<br />
Matthew Moberg, CPA<br />
Joined <strong>Franklin</strong> <strong>Templeton</strong> in 1998<br />
Managed Fund since 2000<br />
Raymond Chan, CFA<br />
Joined <strong>Franklin</strong> <strong>Templeton</strong> in 1996<br />
Managed Fund since 2000<br />
MAXIMUM SALES CHARGE & COMMISSION<br />
CLASS A CLASS C73 Sales Charge 5.75% 0.00%<br />
<strong>Dealer</strong> Concession 5.00 1.00<br />
12b-1 Fee to <strong>Dealer</strong> 0.25 1.00<br />
CLASS R ADVISOR89 Sales Charge 0.00% 0.00%<br />
<strong>Dealer</strong> Concession 0.00 0.00<br />
12b-1 Fee to <strong>Dealer</strong> 0.50 0.00<br />
See page 128 for more commission<br />
information and page 125 for footnotes.<br />
PERFORMANCE INFORMATION<br />
5, 13<br />
ANNUAL TOTAL RETURN–WITHOUT SALES CHARGES<br />
1999 2000 2001 2002 2003 2004 2005 2006 2007 2008<br />
YTD<br />
200914 CLASS A<br />
CLASS C<br />
ADVISOR43 95.17 -7.04 -23.23 -24.94 40.48 12.96 6.21 5.76 16.02 -36.27 8.74<br />
93.81 -7.74 -23.84 -25.48 39.42 12.11 5.41 4.98 15.19 -36.74 8.32<br />
95.17 -7.04 -23.23 -24.94 40.48 13.05 6.47 6.03 16.32 -36.10 8.88<br />
AVERAGE ANNUAL TOTAL RETURN – AVERAGE ANNUAL TOTAL RETURN–<br />
WITHOUT SALES CHARGES5, 13 6, 13<br />
WITH SALES CHARGES<br />
1 YR 3 YR 5 YR 10 YR INCEPTION 1 YR 3 YR 5 YR 10 YR INCEPTION<br />
CLASS A<br />
CLASS C<br />
ADVISOR43 -24.21 -5.46 -0.69 2.54 10.14 -28.56 -7.31 -1.86 1.94 9.77<br />
-24.78 -6.16 -1.44 1.78 5.64 -25.53 -6.16 -1.44 1.78 5.64<br />
-24.00 -5.22 -0.45 2.67 10.21 -24.00 -5.22 -0.45 2.67 10.21<br />
Advisor Class shares are only offered to certain eligible investors as stated in the prospectus.<br />
PORTFOLIO HOLDINGS 29 6/30<br />
Total Number of Positions 82<br />
PORTFOLIO BREAKDOWN<br />
Information Technology 34.86%<br />
Health Care 18.12<br />
Industrials 10.27<br />
Energy 8.74<br />
Consumer Staples 6.79<br />
Consumer Discretionary 4.94<br />
Financials 4.91<br />
Materials 4.13<br />
Telecommunication Services 2.82<br />
TOP 10 HOLDINGS7 Qualcomm Inc. 3.34%<br />
Apple Inc. 3.01<br />
Cisco Systems Inc. 2.76<br />
Google Inc. 2.49<br />
Praxair Inc. 2.40<br />
Oracle Corp. 2.26<br />
American Tower Corp. 2.20<br />
CVS Caremark Corp. 2.15<br />
Danaher Corp. 2.09<br />
Hewlett-Packard Co. 2.00<br />
ANNUAL TOTAL RETURN 5 –CLASS A<br />
WITHOUT SALES CHARGES<br />
16.02%<br />
0<br />
6.21%<br />
5.76%<br />
-36.27%<br />
2005 2006 2007 2008<br />
HYPOTHETICAL INVESTMENT 22<br />
$10,000 from Inception<br />
FUND FACTS<br />
Net Assets (millions)<br />
Expense Ratio 2<br />
Net Asset Value<br />
Public Offering Price<br />
Beta 3<br />
Standard Deviation 65<br />
CLASS A CLASS C ADVISOR43 $51,902 $20,219 $55,753<br />
CLASS A CLASS C ADVISOR<br />
$1,439.2 $254.4 $587.3<br />
0.96% 1.71% 0.71%<br />
$33.59 $31.11 $33.98<br />
$35.64 $31.11 $33.98<br />
0.97 0.97 0.97<br />
20.30 20.30 20.29<br />
FUND DISTRIBUTIONS<br />
Dividend Frequency<br />
Annually in December.<br />
CLASS A CLASS C ADVISOR<br />
4, 30<br />
Dividend History<br />
12/08<br />
12/07<br />
6/0787 — — —<br />
— — —<br />
Capital Gains (last 4, 30 12 mos.)<br />
$0.0245 — $0.0245<br />
Short-Term<br />
— — —<br />
Long-Term<br />
— — —<br />
8.74%<br />
YTD 2009 14<br />
ASSET ALLOCATION 29, 60 6/30<br />
Stocks 96%<br />
Cash 4%<br />
26 <strong>Dealer</strong> <strong>Facts</strong> <strong>Guide</strong> Go to franklintempleton.com or call (800) 223-2141 DEALER USE ONLY/NOT FOR DISTRIBUTION TO THE PUBLIC
<strong>Franklin</strong> Growth Fund<br />
TM 67<br />
MORNINGSTAR STYLE BOX<br />
STYLE<br />
Value Blend Growth<br />
SIZE<br />
✕ Large<br />
Medium<br />
✕ Current<br />
Small Historical<br />
INVESTMENT CATEGORY<br />
Growth<br />
PRIMARY INVESTMENT 37<br />
Common stocks of established companies<br />
with demonstrated growth<br />
characteristics. The fund’s holdings<br />
may include some foreign and small<br />
capitalization securities.<br />
FUND REFERENCE<br />
CLASS A CLASS C<br />
Fund No. 106 206<br />
CUSIP 353 496 508 353 496 888<br />
Symbol FKGRX FRGSX<br />
Inception1 3/31/48 5/1/95<br />
CLASS R ADVISOR89 Fund No. 806 606<br />
CUSIP 353 496 730 353 496 839<br />
Symbol FGSRX FCGAX<br />
Inception1 3/31/48 3/31/48<br />
ANNUAL PROSPECTUS UPDATE AVAILABLE:<br />
February 1<br />
PORTFOLIO MANAGER PROFILE84 V. Jerry Palmieri<br />
Joined <strong>Franklin</strong> <strong>Templeton</strong> in 1965<br />
Managed Fund since 1965<br />
Serena Perin Vinton, CFA<br />
Joined <strong>Franklin</strong> <strong>Templeton</strong> in 1991<br />
Managed Fund since 2008<br />
Conrad B. Herrmann, CFA<br />
Joined <strong>Franklin</strong> <strong>Templeton</strong> in 1989<br />
Managed Fund since 1993<br />
MAXIMUM SALES CHARGE & COMMISSION<br />
CLASS A CLASS C73 Sales Charge 5.75% 0.00%<br />
<strong>Dealer</strong> Concession 5.00 1.00<br />
12b-1 Fee to <strong>Dealer</strong> 0.25 1.00<br />
CLASS R ADVISOR89 Sales Charge 0.00% 0.00%<br />
<strong>Dealer</strong> Concession 0.00 0.00<br />
12b-1 Fee to <strong>Dealer</strong> 0.50 0.00<br />
See page 128 for more commission<br />
information and page 125 for footnotes.<br />
PORTFOLIO HOLDINGS 29 6/30<br />
Total Number of Positions 152<br />
PORTFOLIO BREAKDOWN<br />
Industrials 30.29%<br />
Information Technology 23.59<br />
Health Care 21.76<br />
Consumer Discretionary 6.71<br />
Energy 4.75<br />
Materials 3.01<br />
Financials 2.79<br />
Consumer Staples 2.71<br />
Telecommunication Services 1.57<br />
Utilities 1.38<br />
TOP 10 HOLDINGS7 Apple Inc. 4.72%<br />
Johnson & Johnson 2.71<br />
IBM Corp. 2.29<br />
General Dynamics Corp. 2.10<br />
3M Co. 1.95<br />
Cisco Systems Inc. 1.90<br />
Amgen Inc. 1.87<br />
Allergan Inc. 1.80<br />
Northrop Grumman Corp. 1.73<br />
W.W. Grainger Inc. 1.71<br />
ANNUAL TOTAL RETURN 5 –CLASS A<br />
WITHOUT SALES CHARGES<br />
14.16%<br />
8.36%<br />
7.13%<br />
-33.39%<br />
0<br />
2005 2006 2007 2008<br />
HYPOTHETICAL INVESTMENT 22<br />
$10,000 from Inception<br />
FUND FACTS<br />
Net Assets (millions)<br />
Expense Ratio 2<br />
Net Asset Value<br />
Public Offering Price<br />
Beta 3<br />
Standard Deviation 65<br />
FUND DISTRIBUTIONS<br />
Dividend Frequency<br />
Annually in December.<br />
4, 30<br />
Dividend History<br />
12/08<br />
12/07<br />
12/06<br />
Capital Gains (last 4, 30 12 mos.)<br />
Short-Term<br />
Long-Term<br />
5.94%<br />
YTD 2009 14<br />
6/30/09<br />
PERFORMANCE INFORMATION<br />
ANNUAL TOTAL RETURN–WITHOUT SALES CHARGES5 1999 2000 2001 2002 2003 2004 2005 2006 2007 2008<br />
YTD<br />
200914 CLASS A<br />
CLASS C<br />
ADVISOR43 12.19 7.53 -9.47 -24.35 28.03 11.30 8.36 14.16 7.13 -33.39 5.94<br />
11.34 6.71 -10.15 -24.90 27.05 10.46 7.54 13.31 6.34 -33.88 5.59<br />
12.45 7.77 -9.23 -24.17 28.37 11.53 8.64 14.42 7.39 -33.21 6.08<br />
AVERAGE ANNUAL TOTAL RETURN – AVERAGE ANNUAL TOTAL RETURN–<br />
WITHOUT SALES CHARGES5 6, 47<br />
WITH SALES CHARGES<br />
1 YR 3 YR 5 YR 10 YR INCEPTION 1 YR 3 YR 5 YR 10 YR INCEPTION<br />
CLASS A<br />
CLASS C<br />
ADVISOR43 -20.65 -5.63 -0.25 0.02 9.62 -25.21 -7.48 -1.43 -0.57 9.51<br />
-21.21 -6.33 -1.00 -0.73 5.02 -21.99 -6.33 -1.00 -0.73 5.02<br />
-20.45 -5.40 0.00 0.27 9.69 -20.45 -5.40 0.00 0.27 9.69<br />
Advisor Class shares are only offered to certain eligible investors as stated in the prospectus.<br />
CLASS A CLASS C ADVISOR43 $2,614,897 $20,018 $2,879,680<br />
CLASS A CLASS C ADVISOR<br />
$1,865.5 $274.6 $367.6<br />
0.89% 1.64% 0.64%<br />
$31.02 $29.49 $31.04<br />
$32.91 $29.49 $31.04<br />
0.97 0.97 0.97<br />
20.40 20.40 20.39<br />
CLASS A CLASS C ADVISOR<br />
$0.3065 $0.0224 $0.4017<br />
0.1302 — 0.2332<br />
0.1064 — 0.2006<br />
— — —<br />
— — —<br />
ASSET ALLOCATION 29, 60 6/30<br />
Stocks 99%<br />
Cash 1%<br />
DEALER USE ONLY/NOT FOR DISTRIBUTION TO THE PUBLIC Go to franklintempleton.com or call (800) 223-2141 <strong>Dealer</strong> <strong>Facts</strong> <strong>Guide</strong> 27<br />
OPEN-END FUNDS VALUE BLEND GROWTH SECTOR GLOBAL INTERNATIONAL HYBRID ASSET ALLOCATION FIXED INCOME TAX-FREE INCOME
OPEN-END FUNDS<br />
VALUE<br />
BLEND<br />
GROWTH<br />
SECTOR<br />
GLOBAL<br />
INTERNATIONAL<br />
HYBRID<br />
ASSET ALLOCATION<br />
FIXED INCOME<br />
TAX-FREE INCOME<br />
<strong>Franklin</strong> Growth Opportunities Fund<br />
TM 67<br />
MORNINGSTAR STYLE BOX<br />
STYLE<br />
Value Blend Growth<br />
SIZE<br />
Large<br />
✕ Medium<br />
✕ Current<br />
Small Historical<br />
INVESTMENT CATEGORY<br />
Growth<br />
PRIMARY INVESTMENT 37<br />
The fund invests primarily in equity<br />
securities of companies demonstrating<br />
accelerating growth, increasing<br />
profitability, or above-average<br />
growth or growth potential, as<br />
compared with the overall economy.<br />
FUND REFERENCE<br />
CLASS A CLASS<br />
Fund No. 462 562<br />
CUSIP 354 713 687 354 713 711<br />
Symbol FGRAX FKACX<br />
Inception1 6/23/99 6/23/99<br />
CLASS R ADVISOR89 Fund No. 862 662<br />
CUSIP 354 713 513 354 713 729<br />
Symbol FKARX FRAAX<br />
Inception1 6/23/99 6/23/99<br />
ANNUAL PROSPECTUS UPDATE AVAILABLE:<br />
September 1<br />
PORTFOLIO MANAGER PROFILE84 Grant Bowers<br />
Joined <strong>Franklin</strong> <strong>Templeton</strong> in 1993<br />
Managed Fund since 2007<br />
Conrad B. Herrmann, CFA<br />
Joined <strong>Franklin</strong> <strong>Templeton</strong> in 1989<br />
Managed Fund since 1999<br />
Raymond Chan, CFA<br />
Joined <strong>Franklin</strong> <strong>Templeton</strong> in 1996<br />
Managed Fund since 2006<br />
MAXIMUM SALES CHARGE & COMMISSION<br />
CLASS A CLASS C 73<br />
Sales Charge 5.75% 0.00%<br />
<strong>Dealer</strong> Concession 5.00 1.00<br />
12b-1 Fee to <strong>Dealer</strong> 0.25 1.00<br />
CLASS R ADVISOR 89<br />
Sales Charge 0.00% 0.00%<br />
<strong>Dealer</strong> Concession 0.00 0.00<br />
12b-1 Fee to <strong>Dealer</strong> 0.50 0.00<br />
See page 128 for more commission<br />
information and page 125 for footnotes.<br />
PORTFOLIO HOLDINGS 29 6/30<br />
Total Number of Positions 80<br />
PORTFOLIO BREAKDOWN<br />
Information Technology 34.99%<br />
Health Care 21.15<br />
Energy 10.53<br />
Industrials 10.50<br />
Consumer Discretionary 8.15<br />
Financials 3.67<br />
Telecommunication Services 3.55<br />
Materials 2.80<br />
Consumer Staples 1.25<br />
TOP 10 HOLDINGS7 Celgene Corp. 3.54%<br />
Apple Inc. 3.11<br />
Gilead Sciences Inc. 3.01<br />
FLIR Systems Inc. 2.73<br />
Myriad Genetics Inc. 2.49<br />
MasterCard Inc. 2.33<br />
Life Technologies Corp. 2.26<br />
Qualcomm Inc. 2.25<br />
SBA Communications Corp. 2.10<br />
Concur Technologies Inc. 2.09<br />
ANNUAL TOTAL RETURN 5 –CLASS A<br />
WITHOUT SALES CHARGES<br />
0<br />
11.07%<br />
6.76%<br />
20.93%<br />
-40.08%<br />
2005 2006 2007 2008<br />
HYPOTHETICAL INVESTMENT 22<br />
$10,000 from Inception<br />
FUND FACTS<br />
Net Assets (millions)<br />
Expense Ratio 2<br />
Net Asset Value<br />
Public Offering Price<br />
Beta 3<br />
Standard Deviation 65<br />
FUND DISTRIBUTIONS<br />
Dividend Frequency<br />
Annually in December.<br />
Dividend History 30<br />
12/08<br />
12/07<br />
12/06<br />
Capital Gains (last 12 mos.) 30<br />
Short-Term<br />
Long-Term<br />
14.36%<br />
YTD 2009 14<br />
6/30/09<br />
PERFORMANCE INFORMATION<br />
5, 13<br />
ANNUAL TOTAL RETURN–WITHOUT SALES CHARGES<br />
1999 2000 2001 2002 2003 2004 2005 2006 2007 2008<br />
YTD<br />
200914 CLASS A — -25.83 -22.59 -35.74 43.94 17.31 11.07 6.76 20.93 -40.08 14.36<br />
CLASS C — -26.29 -23.11 -36.19 42.94 16.52 10.28 5.99 20.10 -40.54 14.07<br />
ADVISOR — -25.57 -22.35 -35.57 44.34 17.69 11.40 7.04 21.28 -39.88 14.56<br />
AVERAGE ANNUAL TOTAL RETURN – AVERAGE ANNUAL TOTAL RETURN–<br />
WITHOUT SALES CHARGES5, 13 6, 13<br />
WITH SALES CHARGES<br />
1 YR 3 YR 5 YR 10 YR INCEPTION 1 YR 3 YR 5 YR 10 YR INCEPTION<br />
CLASS A -25.97 -4.97 1.83 3.36 4.13 -30.24 -6.82 0.63 2.75 3.52<br />
CLASS C -26.50 -5.63 1.12 2.66 3.43 -27.24 -5.63 1.12 2.66 3.43<br />
ADVISOR -25.71 -4.67 2.14 3.68 4.46 -25.71 -4.67 2.14 3.68 4.46<br />
Advisor Class shares are only offered to certain eligible investors as stated in the prospectus.<br />
CLASS A CLASS C ADVISOR<br />
$14,138 $14,016 $15,478<br />
CLASS A CLASS C ADVISOR<br />
$120.1 $31.7 $156.4<br />
1.29% 2.01% 1.01%<br />
$14.65 $13.70 $15.11<br />
$15.54 $13.70 $15.11<br />
1.07 1.07 1.07<br />
23.34 23.34 23.31<br />
CLASS A CLASS C ADVISOR<br />
— — —<br />
— — —<br />
— — —<br />
— — —<br />
— — —<br />
ASSET ALLOCATION 29, 60 6/30<br />
Stocks 97%<br />
Cash 3%<br />
28 <strong>Dealer</strong> <strong>Facts</strong> <strong>Guide</strong> Go to franklintempleton.com or call (800) 223-2141 DEALER USE ONLY/NOT FOR DISTRIBUTION TO THE PUBLIC
<strong>Franklin</strong> Small Cap Growth Fund<br />
OVERALL MORNINGSTAR<br />
RATINGTM 8, 67<br />
– CLASS A<br />
TM 67<br />
MORNINGSTAR STYLE BOX<br />
STYLE<br />
Value Blend Growth<br />
SIZE<br />
Large<br />
Medium<br />
✕ Current<br />
✕ Small Historical<br />
INVESTMENT CATEGORY<br />
Growth<br />
PRIMARY INVESTMENT 37<br />
The fund invests primarily in small<br />
company stocks.<br />
Effective 3/31/08, <strong>Franklin</strong> Small Cap<br />
Growth Fund II changed its name to <strong>Franklin</strong><br />
Small Cap Growth Fund, and reopened to all<br />
investors.<br />
FUND REFERENCE<br />
CLASS A CLASS C<br />
Fund No. 465 565<br />
CUSIP 354 713 620 354 713 646<br />
Symbol FSGRX FCSGX<br />
Inception1 5/1/00 5/1/00<br />
CLASS R ADVISOR89 Fund No. 865 665<br />
CUSIP 354 713 539 354 713 653<br />
Symbol FSSRX FSSAX<br />
Inception1 5/1/00 5/1/00<br />
ANNUAL PROSPECTUS UPDATE AVAILABLE:<br />
September 1<br />
PORTFOLIO MANAGER PROFILE84 Michael McCarthy, CFA<br />
Joined <strong>Franklin</strong> <strong>Templeton</strong> in 1992<br />
Managed Fund since 2000<br />
Brad Carris, CFA<br />
Joined <strong>Franklin</strong> <strong>Templeton</strong> in 2001<br />
Managed Fund since 2004<br />
MAXIMUM SALES CHARGE & COMMISSION<br />
CLASS A CLASS C73 Sales Charge 5.75% 0.00%<br />
<strong>Dealer</strong> Concession 5.00 1.00<br />
12b-1 Fee to <strong>Dealer</strong> 0.25 1.00<br />
CLASS R ADVISOR89 Sales Charge 0.00% 0.00%<br />
<strong>Dealer</strong> Concession 0.00 0.00<br />
12b-1 Fee to <strong>Dealer</strong> 0.50 0.00<br />
See page 128 for more commission<br />
information and page 125 for footnotes.<br />
PORTFOLIO HOLDINGS 29 6/30<br />
Total Number of Positions 99<br />
PORTFOLIO BREAKDOWN<br />
Information Technology 36.40%<br />
Health Care 19.96<br />
Consumer Discretionary 12.94<br />
Industrials 11.70<br />
Financials 4.68<br />
Energy 4.14<br />
Consumer Staples 3.91<br />
Telecommunication Services 1.60<br />
Materials 0.44<br />
TOP 10 HOLDINGS7 ViaSat Inc. 2.17%<br />
Shuffle Master Inc.<br />
American Medical Systems<br />
2.07<br />
Holdings Ltd. 1.96<br />
Bottomline Technologies Inc. 1.81<br />
Silicon Laboratories Inc. 1.81<br />
Nuance Communications Inc. 1.80<br />
Sapient Corp. 1.76<br />
NetLogic Microsystems Inc. 1.76<br />
PAREXEL International Corp. 1.65<br />
Hain Celestial Group Inc. 1.64<br />
ANNUAL TOTAL RETURN 5 –CLASS A<br />
WITHOUT SALES CHARGES<br />
9.46%<br />
4.48% 3.29%<br />
0<br />
-41.12%<br />
2005 2006 2007 2008<br />
HYPOTHETICAL INVESTMENT 22<br />
$10,000 from Inception<br />
FUND FACTS<br />
Net Assets (millions)<br />
Expense Ratio 2<br />
Net Asset Value<br />
Public Offering Price<br />
Beta 3<br />
Standard Deviation 65<br />
FUND DISTRIBUTIONS<br />
Dividend Frequency<br />
Annually in December.<br />
Dividend History 30<br />
12/08<br />
12/07<br />
12/06<br />
Capital Gains (last 12 mos.) 30<br />
Short-Term<br />
Long-Term<br />
17.36%<br />
YTD 2009 14<br />
CLASS A CLASS C ADVISOR<br />
$9,108 $9,059 $9,930<br />
CLASS A CLASS C ADVISOR<br />
$137.0 $43.6 $66.6<br />
1.17% 1.92% 0.92%<br />
$7.03 $6.46 $7.28<br />
$7.46 $6.46 $7.28<br />
0.99 0.99 0.99<br />
25.59 25.58 25.59<br />
CLASS A CLASS C ADVISOR<br />
— — —<br />
— — —<br />
— — —<br />
$0.0669 $0.0669 $0.0669<br />
0.0071 0.0071 0.0071<br />
ASSET ALLOCATION 29, 60 6/30<br />
Stocks 96%<br />
Cash 4%<br />
6/30/09<br />
PERFORMANCE INFORMATION<br />
5, 13<br />
ANNUAL TOTAL RETURN–WITHOUT SALES CHARGES<br />
1999 2000 2001 2002 2003 2004 2005 2006 2007 2008<br />
YTD<br />
200914 CLASS A — — -3.33 -27.25 48.47 11.07 4.48 9.46 3.29 -41.12 17.36<br />
CLASS C — — -4.03 -27.64 47.24 10.28 3.66 8.56 2.49 -41.54 17.03<br />
ADVISOR — — -3.03 -26.99 48.97 11.30 4.74 9.69 3.54 -40.96 17.61<br />
AVERAGE ANNUAL TOTAL RETURN – AVERAGE ANNUAL TOTAL RETURN–<br />
WITHOUT SALES CHARGES5, 13 6, 13<br />
WITH SALES CHARGES<br />
1 YR 3 YR 5 YR 10 YR INCEPTION 1 YR 3 YR 5 YR 10 YR INCEPTION<br />
CLASS A -19.22 -9.30 -3.03 — -0.37 -23.88 -11.07 -4.17 — -1.01<br />
CLASS C -19.78 -9.94 -3.74 — -1.07 -20.57 -9.94 -3.74 — -1.07<br />
ADVISOR -18.96 -9.03 -2.78 — -0.08 -18.96 -9.03 -2.78 — -0.08<br />
Advisor Class shares are only offered to certain eligible investors as stated in the prospectus.<br />
DEALER USE ONLY/NOT FOR DISTRIBUTION TO THE PUBLIC Go to franklintempleton.com or call (800) 223-2141 <strong>Dealer</strong> <strong>Facts</strong> <strong>Guide</strong> 29<br />
OPEN-END FUNDS VALUE BLEND GROWTH SECTOR GLOBAL INTERNATIONAL HYBRID ASSET ALLOCATION FIXED INCOME TAX-FREE INCOME
OPEN-END FUNDS<br />
VALUE<br />
BLEND<br />
GROWTH<br />
SECTOR<br />
GLOBAL<br />
INTERNATIONAL<br />
HYBRID<br />
ASSET ALLOCATION<br />
FIXED INCOME<br />
TAX-FREE INCOME<br />
52 6/30/09<br />
<strong>Franklin</strong> Small-Mid Cap Growth Fund<br />
OVERALL MORNINGSTAR<br />
RATINGTM 8, 67<br />
– CLASS A<br />
TM 67<br />
MORNINGSTAR STYLE BOX<br />
STYLE<br />
Value Blend Growth<br />
SIZE<br />
Large<br />
✕ Medium<br />
✕ Current<br />
Small Historical<br />
INVESTMENT CATEGORY<br />
Growth<br />
PRIMARY INVESTMENT 37<br />
Stocks of small and mid capitali zation<br />
growth companies that the<br />
fund’s managers believe to be positioned<br />
for rapid growth in revenues<br />
or earnings and assets.<br />
FUND REFERENCE<br />
CLASS A CLASS C<br />
Fund No. 198 298<br />
CUSIP 354 713 109 354 713 802<br />
Symbol FRSGX FRSIX<br />
Inception1 2/14/92 10/2/95<br />
CLASS R ADVISOR89 Fund No. 898 698<br />
CUSIP 354 713 547 354 713 869<br />
Symbol FSMRX FSGAX<br />
Inception1 2/14/92 2/14/92<br />
ANNUAL PROSPECTUS UPDATE AVAILABLE:<br />
September 1<br />
PORTFOLIO MANAGER PROFILE84 Edward B. Jamieson<br />
Joined <strong>Franklin</strong> <strong>Templeton</strong> in 1987<br />
Managed Fund since 1992<br />
Michael McCarthy, CFA<br />
Joined <strong>Franklin</strong> <strong>Templeton</strong> in 1992<br />
Managed Fund since 1993<br />
James Cross, CFA<br />
Joined <strong>Franklin</strong> <strong>Templeton</strong> in 1998<br />
Managed Fund since 2005<br />
MAXIMUM SALES CHARGE & COMMISSION<br />
CLASS A CLASS C73 Sales Charge 5.75% 0.00%<br />
<strong>Dealer</strong> Concession 5.00 1.00<br />
12b-1 Fee to <strong>Dealer</strong> 0.25 1.00<br />
CLASS R ADVISOR89 Sales Charge 0.00% 0.00%<br />
<strong>Dealer</strong> Concession 0.00 0.00<br />
12b-1 Fee to <strong>Dealer</strong> 0.50 0.00<br />
See page 128 for more commission<br />
information and page 125 for footnotes.<br />
PERFORMANCE INFORMATION<br />
5, 13<br />
ANNUAL TOTAL RETURN–WITHOUT SALES CHARGES<br />
1999 2000 2001 2002 2003 2004 2005 2006 2007 2008<br />
YTD<br />
200914 CLASS A<br />
CLASS C<br />
ADVISOR43 97.08 -9.80 -20.53 -29.58 37.68 13.04 10.54 7.52 11.67 -42.51 14.83<br />
95.62 -10.49 -21.12 -30.10 36.62 12.25 9.72 6.69 10.86 -42.93 14.40<br />
97.66 -9.56 -20.37 -29.42 38.01 13.34 10.82 7.77 11.97 -42.34 14.91<br />
AVERAGE ANNUAL TOTAL RETURN – AVERAGE ANNUAL TOTAL RETURN–<br />
WITHOUT SALES CHARGES5, 13 6, 13, 46<br />
WITH SALES CHARGES<br />
1 YR 3 YR 5 YR 10 YR INCEPTION 1 YR 3 YR 5 YR 10 YR INCEPTION<br />
CLASS A<br />
CLASS C<br />
ADVISOR43 -26.12 -7.78 -1.04 1.42 8.60 -30.37 -9.58 -2.20 0.82 8.23<br />
-26.65 -8.46 -1.78 0.66 4.50 -27.38 -8.46 -1.78 0.66 4.50<br />
-25.94 -7.55 -0.79 1.67 8.88 -25.94 -7.55 -0.79 1.67 8.88<br />
Advisor Class shares are only offered to certain eligible investors as stated in the prospectus.<br />
PORTFOLIO HOLDINGS 29 6/30<br />
Total Number of Positions 100<br />
PORTFOLIO BREAKDOWN<br />
Information Technology 25.71%<br />
Health Care 23.42<br />
Consumer Discretionary 14.18<br />
Industrials 12.73<br />
Energy 6.11<br />
Financials 5.38<br />
Consumer Staples 3.07<br />
Telecommunication Services 2.26<br />
Utilities 1.05<br />
Materials 1.01<br />
TOP 10 HOLDINGS 7<br />
Silicon Laboratories Inc. 2.43%<br />
Express Scripts Inc. 2.32<br />
MasterCard Inc. 2.31<br />
Nuance Communications Inc. 2.21<br />
FLIR Systems Inc. 1.85<br />
AMETEK Inc. 1.82<br />
Guess? Inc. 1.72<br />
Waters Corp. 1.66<br />
FMC Technologies Inc. 1.61<br />
Wolverine World Wide Inc. 1.58<br />
ANNUAL TOTAL RETURN 5 –CLASS A<br />
WITHOUT SALES CHARGES<br />
0<br />
10.54%<br />
7.52%<br />
11.67%<br />
-42.51%<br />
2005 2006 2007 2008<br />
HYPOTHETICAL INVESTMENT 22<br />
$10,000 from Inception<br />
FUND FACTS<br />
Net Assets (millions)<br />
Expense Ratio2 Net Asset Value<br />
Public Offering Price<br />
Beta 3<br />
Standard Deviation 65<br />
FUND DISTRIBUTIONS<br />
Dividend Frequency<br />
Annually in December.<br />
4, 30<br />
Dividend History<br />
12/08<br />
12/07<br />
12/06<br />
Capital Gains (last 4, 30 12 mos.)<br />
Short-Term<br />
Long-Term<br />
14.83%<br />
YTD 2009 14<br />
CLASS A CLASS C ADVISOR43 $39,523 $18,323 $43,820<br />
CLASS A CLASS C ADVISOR<br />
$2,275.4 $294.2 $528.3<br />
1.04% 1.79% 0.79%<br />
$23.30 $21.13 $23.89<br />
$24.72 $21.13 $23.89<br />
0.90 0.90 0.90<br />
23.07 23.06 23.07<br />
CLASS A CLASS C ADVISOR<br />
— — —<br />
— — —<br />
— — —<br />
— — —<br />
$0.0620 $0.0620 $0.0620<br />
ASSET ALLOCATION 29, 60 6/30<br />
Stocks 95%<br />
Cash 5%<br />
30 <strong>Dealer</strong> <strong>Facts</strong> <strong>Guide</strong> Go to franklintempleton.com or call (800) 223-2141 DEALER USE ONLY/NOT FOR DISTRIBUTION TO THE PUBLIC
<strong>Franklin</strong> Biotechnology Discovery Fund<br />
OVERALL MORNINGSTAR<br />
8, 67<br />
RATINGTM – CLASS A<br />
TM 67<br />
MORNINGSTAR STYLE BOX<br />
STYLE<br />
Value Blend Growth<br />
SIZE<br />
✕ Large<br />
Medium<br />
Small<br />
INVESTMENT CATEGORY<br />
Sector<br />
PRIMARY INVESTMENT 37<br />
Equity securities of biotechnology<br />
companies and discovery research<br />
firms located in the U.S. and other<br />
countries.<br />
FUND REFERENCE<br />
CLASS A<br />
Fund No. 402<br />
CUSIP 354 713 844<br />
Symbol FBDIX<br />
Inception 1 9/15/97<br />
✕ Current<br />
Historical<br />
ANNUAL PROSPECTUS UPDATE AVAILABLE:<br />
September 1<br />
PORTFOLIO MANAGER PROFILE84 Evan McCulloch, CFA<br />
Joined <strong>Franklin</strong> <strong>Templeton</strong> in 1992<br />
Managed Fund since 1997<br />
Vincent W. Xiang, Ph.D.<br />
Joined <strong>Franklin</strong> <strong>Templeton</strong> in 2004<br />
Managed Fund since 2004<br />
MAXIMUM SALES CHARGE & COMMISSION<br />
CLASS A<br />
Sales Charge 5.75%<br />
<strong>Dealer</strong> Concession 5.00<br />
12b-1 Fee to <strong>Dealer</strong> 0.25<br />
See page 128 for more commission<br />
information and page 125 for footnotes.<br />
PORTFOLIO HOLDINGS 29 6/30<br />
Total Number of Positions 55<br />
PORTFOLIO BREAKDOWN<br />
Biotechnology 71.85%<br />
Pharmaceuticals 16.90<br />
Life Sciences Tools & Services 9.21<br />
TOP 10 HOLDINGS 7<br />
Gilead Sciences Inc. 11.29%<br />
Celgene Corp. 10.17<br />
Genzyme Corporation - General<br />
Division 9.43<br />
Amgen Inc. 9.17<br />
Teva Pharmaceutical Industries Ltd. 4.63<br />
Life Technologies Corp. 4.62<br />
Roche Holding AG 3.93<br />
Biogen Idec Inc. 3.77<br />
Cephalon Inc. 3.34<br />
Biomarin Pharmaceutical Inc. 3.22<br />
ANNUAL TOTAL RETURN 5 –CLASS A<br />
WITHOUT SALES CHARGES<br />
5.55% 5.03%<br />
0<br />
-1.60% -10.64%<br />
2005 2006 2007 2008<br />
2.77%<br />
YTD 2009 14<br />
6/30/09<br />
PERFORMANCE INFORMATION<br />
5, 13<br />
ANNUAL TOTAL RETURN–WITHOUT SALES CHARGES<br />
1999 2000 2001 2002 2003 2004 2005 2006 2007 2008<br />
YTD<br />
200914 CLASS A 97.91 46.58 -20.48 -42.48 43.55 11.96 5.55 5.03 -1.60 -10.64 2.77<br />
AVERAGE ANNUAL TOTAL RETURN – AVERAGE ANNUAL TOTAL RETURN–<br />
WITHOUT SALES CHARGES5, 13 6, 13, 46<br />
WITH SALES CHARGES<br />
1 YR 3 YR 5 YR 10 YR INCEPTION 1 YR 3 YR 5 YR 10 YR INCEPTION<br />
CLASS A -6.68 0.56 0.66 7.62 6.93 -12.04 -1.40 -0.52 6.99 6.39<br />
HYPOTHETICAL INVESTMENT 22<br />
$10,000 from Inception<br />
FUND FACTS<br />
Net Assets (millions)<br />
Expense Ratio2 Net Asset Value<br />
Public Offering Price<br />
Beta 3<br />
Standard Deviation 65<br />
FUND DISTRIBUTIONS<br />
Dividend Frequency<br />
Annually in December.<br />
Dividend History 30<br />
12/08<br />
12/07<br />
12/06<br />
Capital Gains (last 12 mos.) 30<br />
Short-Term<br />
Long-Term<br />
ASSET ALLOCATION 29, 60 6/30<br />
Stocks 98%<br />
Cash 2%<br />
CLASS A<br />
$20,755<br />
CLASS A<br />
$291.2<br />
1.27%<br />
$53.76<br />
$57.04<br />
0.85<br />
18.50<br />
DEALER USE ONLY/NOT FOR DISTRIBUTION TO THE PUBLIC Go to franklintempleton.com or call (800) 223-2141 <strong>Dealer</strong> <strong>Facts</strong> <strong>Guide</strong> 31<br />
CLASS A<br />
—<br />
—<br />
—<br />
—<br />
—<br />
OPEN-END FUNDS VALUE BLEND GROWTH SECTOR GLOBAL INTERNATIONAL HYBRID ASSET ALLOCATION FIXED INCOME TAX-FREE INCOME
OPEN-END FUNDS<br />
VALUE<br />
BLEND<br />
GROWTH<br />
SECTOR<br />
GLOBAL<br />
INTERNATIONAL<br />
HYBRID<br />
ASSET ALLOCATION<br />
FIXED INCOME<br />
TAX-FREE INCOME<br />
<strong>Franklin</strong> DynaTech Fund<br />
OVERALL MORNINGSTAR RATING TM<br />
CLASS A 8<br />
★★★★<br />
MORNINGSTAR STYLE BOX<br />
STYLE<br />
Value Blend Growth<br />
SIZE<br />
✕ Large<br />
Medium<br />
Small<br />
✕ Current<br />
Historical<br />
INVESTMENT CATEGORY<br />
Sector<br />
TM 67<br />
PRIMARY INVESTMENT 37<br />
Securities of domestic and foreign<br />
companies that management considers<br />
undervalued, emphasizing<br />
technological development in<br />
fast-growing industries.<br />
FUND REFERENCE<br />
CLASS A CLASS C<br />
Fund No. 108 208<br />
CUSIP 353 496 201 353 496 870<br />
Symbol FKDNX FDYNX<br />
Inception1 1/1/68 9/16/96<br />
CLASS R ADVISOR89 Fund No. 818 628<br />
CUSIP 353 496 672 353 496 680<br />
Symbol — —<br />
Inception1 1/1/68 1/1/68<br />
ANNUAL PROSPECTUS UPDATE AVAILABLE:<br />
February 1<br />
PORTFOLIO MANAGER PROFILE84 Rupert H. Johnson Jr.<br />
Joined <strong>Franklin</strong> <strong>Templeton</strong> in 1965<br />
Managed Fund since 1968<br />
Matt Moberg, CPA<br />
Joined <strong>Franklin</strong> <strong>Templeton</strong> in 1998<br />
Managed Fund since 2004<br />
MAXIMUM SALES CHARGE & COMMISSION<br />
CLASS A CLASS C73 Sales Charge 5.75% 0.00%<br />
<strong>Dealer</strong> Concession 5.00 1.00<br />
12b-1 Fee to <strong>Dealer</strong> 0.25 1.00<br />
CLASS R ADVISOR89 Sales Charge 0.00% 0.00%<br />
<strong>Dealer</strong> Concession 0.00 0.00<br />
12b-1 Fee to <strong>Dealer</strong> 0.50 0.00<br />
See page 128 for more commission<br />
information and page 125 for footnotes.<br />
PORTFOLIO HOLDINGS 29 6/30<br />
Total Number of Positions 77<br />
PORTFOLIO BREAKDOWN<br />
Information Technology 45.55%<br />
Health Care 25.13<br />
Industrials 6.03<br />
Energy 5.59<br />
Financials 4.82<br />
Materials 3.96<br />
Consumer Discretionary 3.47<br />
Telecommunication Services 3.17<br />
TOP 10 HOLDINGS 7<br />
Apple Inc. 5.81%<br />
Google Inc. 3.93<br />
Intel Corp. 3.45<br />
Gilead Sciences Inc. 3.21<br />
Teva Pharmaceutical Industries Ltd. 3.20<br />
Visa Inc. 2.89<br />
Qualcomm Inc. 2.60<br />
Amazon.com Inc. 2.33<br />
Celgene Corp. 2.17<br />
Hewlett-Packard Co. 2.15<br />
ANNUAL TOTAL RETURN 5 –CLASS A<br />
WITHOUT SALES CHARGES<br />
0<br />
7.18%<br />
23.08%<br />
2.64% -41.01%<br />
2005 2006 2007 2008<br />
HYPOTHETICAL INVESTMENT 22<br />
$10,000 from Inception<br />
FUND FACTS<br />
Net Assets (millions)<br />
Expense Ratio2 Net Asset Value<br />
Public Offering Price<br />
Beta 3<br />
Standard Deviation 65<br />
FUND DISTRIBUTIONS<br />
Dividend Frequency<br />
Annually in December.<br />
4, 30<br />
Dividend History<br />
12/08<br />
12/07<br />
12/06<br />
Capital Gains (last 4, 30 12 mos.)<br />
Short-Term<br />
Long-Term<br />
16.01%<br />
YTD 2009 14<br />
6/30/09<br />
PERFORMANCE INFORMATION<br />
ANNUAL TOTAL RETURN–WITHOUT SALES CHARGES5 1999 2000 2001 2002 2003 2004 2005 2006 2007 2008<br />
YTD<br />
200914 CLASS A<br />
CLASS C<br />
ADVISOR43 37.19 -12.24 -13.11 -19.87 38.64 7.69 7.18 2.64 23.08 -41.01 16.01<br />
36.20 -12.91 -13.76 -20.41 37.62 6.79 6.44 1.88 22.10 -41.43 15.55<br />
37.19 -12.24 -13.11 -19.87 38.64 7.69 7.18 2.64 23.08 -40.92 16.16<br />
AVERAGE ANNUAL TOTAL RETURN – AVERAGE ANNUAL TOTAL RETURN–<br />
WITHOUT SALES CHARGES5 6, 47<br />
WITH SALES CHARGES<br />
1 YR 3 YR 5 YR 10 YR INCEPTION 1 YR 3 YR 5 YR 10 YR INCEPTION<br />
CLASS A<br />
CLASS C<br />
ADVISOR43 -24.86 -3.46 -0.82 0.52 7.77 -29.17 -5.35 -1.99 -0.07 7.77<br />
-25.44 -4.19 -1.57 -0.23 4.49 -26.11 -4.19 -1.57 -0.23 4.49<br />
-24.68 -3.37 -0.76 0.55 7.78 -24.68 -3.37 -0.76 0.55 7.78<br />
Advisor Class shares are only offered to certain eligible investors as stated in the prospectus.<br />
CLASS A CLASS C ADVISOR43 $223,538 $17,545 $224,167<br />
CLASS A CLASS C ADVISOR<br />
$441.8 $72.9 $5.9<br />
0.99% 1.75% 0.75%<br />
$20.07 $18.50 $20.13<br />
$21.29 $18.50 $20.13<br />
0.89 0.89 0.89<br />
22.12 22.12 22.11<br />
CLASS A CLASS C ADVISOR<br />
— — —<br />
— — —<br />
— — —<br />
— — —<br />
$1.5822 $1.5822 $1.5822<br />
ASSET ALLOCATION 29, 60 6/30<br />
Stocks 98%<br />
Cash 2%<br />
32 <strong>Dealer</strong> <strong>Facts</strong> <strong>Guide</strong> Go to franklintempleton.com or call (800) 223-2141 DEALER USE ONLY/NOT FOR DISTRIBUTION TO THE PUBLIC
<strong>Franklin</strong> Global Real Estate Fund<br />
OVERALL MORNINGSTAR<br />
8, 67<br />
RATINGTM – CLASS A<br />
TM 67<br />
MORNINGSTAR STYLE BOX<br />
STYLE<br />
Value Blend Growth<br />
SIZE<br />
Large<br />
✕<br />
Medium<br />
Small<br />
INVESTMENT CATEGORY<br />
Sector<br />
PRIMARY INVESTMENT 37<br />
Securities of companies located<br />
anywhere in the world that operate<br />
in the real estate sector, mainly Real<br />
Estate Investment Trusts (REITs)<br />
and similar REIT-like entities.<br />
FUND REFERENCE<br />
CLASS A CLASS C<br />
Fund No. 495 595<br />
CUSIP 353 533 797 353 533 789<br />
Symbol FAGRX —<br />
Inception1 6/16/06 6/16/06<br />
ADVISOR 89<br />
Fund No. 695<br />
CUSIP 353 533 771<br />
Symbol FVGRX<br />
Inception 1 6/16/06<br />
✕ Current<br />
Historical<br />
ANNUAL PROSPECTUS UPDATE AVAILABLE:<br />
December 1<br />
PORTFOLIO MANAGER PROFILE84 Jack Foster<br />
Joined <strong>Franklin</strong> <strong>Templeton</strong> in 1987<br />
Managed Fund since 2007<br />
David Levy<br />
Joined <strong>Franklin</strong> <strong>Templeton</strong> in 2007<br />
Managed Fund since 2007<br />
MAXIMUM SALES CHARGE & COMMISSION<br />
CLASS A CLASS C73 Sales Charge 5.75% 0.00%<br />
<strong>Dealer</strong> Concession 5.00 1.00<br />
12b-1 Fee to <strong>Dealer</strong> 0.25 1.00<br />
ADVISOR89 Sales Charge 0.00%<br />
<strong>Dealer</strong> Concession 0.00<br />
12b-1 Fee to <strong>Dealer</strong> 0.00<br />
See page 128 for more commission<br />
information and page 125 for footnotes.<br />
PORTFOLIO HOLDINGS 29 6/30<br />
Total Number of Positions 87<br />
PROPERTY BREAKDOWN<br />
Retail Property 34.07%<br />
Office Space 26.11<br />
Healthcare Property 8.41<br />
Mall/Outlet Property 7.71<br />
Residential 6.25<br />
Diversified 4.97<br />
Industrial Property<br />
Hotel/Resort & Entertainment<br />
4.31<br />
Property 2.39<br />
Storage Property 2.09<br />
Manufactured Home Property 0.94<br />
TOP 5 COUNTRIES<br />
United States 48.93%<br />
Australia 14.33<br />
Japan 9.48<br />
United Kingdom 7.95<br />
France 6.22<br />
TOP 10 HOLDINGS7 Westfield Group Australia 9.01%<br />
Unibail-Rodamco SA 4.38<br />
Simon Property Group Inc. 4.30<br />
Boston Properties Inc. 3.17<br />
British Land Company PLC 2.71<br />
Ventas Inc. 2.71<br />
Vornado Realty Trust 2.33<br />
Public Storage 2.09<br />
Host Hotels & Resorts Inc. 2.03<br />
HCP Inc. 2.03<br />
ANNUAL TOTAL RETURN 5, 9 –CLASS A<br />
WITHOUT SALES CHARGES<br />
0<br />
-12.10%<br />
2005 2006 2007 2008<br />
-42.49% -9.98%<br />
6/30/09<br />
PERFORMANCE INFORMATION<br />
5, 9<br />
ANNUAL TOTAL RETURN–WITHOUT SALES CHARGES<br />
1999 2000 2001 2002 2003 2004 2005 2006 2007 2008<br />
YTD<br />
200914 CLASS A — — — — — — — — -12.10 -42.49 -9.98<br />
CLASS C — — — — — — — — -12.68 -42.88 -10.38<br />
ADVISOR — — — — — — — — -11.79 -42.24 -9.96<br />
AVERAGE ANNUAL TOTAL RETURN – AVERAGE ANNUAL TOTAL RETURN–<br />
WITHOUT SALES CHARGES5, 9 6, 9<br />
WITH SALES CHARGES<br />
1 YR 3 YR 5 YR 10 YR INCEPTION 1 YR 3 YR 5 YR 10 YR INCEPTION<br />
CLASS A -39.70 -18.58 — — -17.96 -43.19 -20.17 — — -19.55<br />
CLASS C -40.20 -19.14 — — -18.53 -40.76 -19.14 — — -18.53<br />
ADVISOR -39.58 -18.34 — — -17.70 -39.58 -18.34 — — -17.70<br />
Advisor Class shares are only offered to certain eligible investors as stated in the prospectus.<br />
9, 22<br />
HYPOTHETICAL INVESTMENT<br />
CLASS A CLASS C ADVISOR<br />
$10,000 from Inception $5,164 $5,366 $5,533<br />
FUND FACTS<br />
Net Assets (millions)<br />
2, 9<br />
Expense Ratio<br />
without waiver<br />
with waiver<br />
Net Asset Value<br />
Public Offering Price<br />
YTD 2009 14<br />
CLASS A CLASS C ADVISOR<br />
$14.0 $3.4 $32.3<br />
1.61% 2.27% 1.28%<br />
1.38% 2.04% 1.05%<br />
$4.69 $4.66 $4.70<br />
$4.98 $4.66 $4.70<br />
— — —<br />
— — —<br />
ASSET ALLOCATION 29, 60 6/30<br />
Stocks 98%<br />
Cash 2%<br />
DEALER USE ONLY/NOT FOR DISTRIBUTION TO THE PUBLIC Go to franklintempleton.com or call (800) 223-2141 <strong>Dealer</strong> <strong>Facts</strong> <strong>Guide</strong> 33<br />
Beta 3<br />
Standard Deviation 65<br />
FUND DISTRIBUTIONS<br />
Dividend Frequency<br />
Quarterly in March, June, September and December.<br />
CLASS A CLASS C ADVISOR<br />
9, 15<br />
Distribution Rate<br />
Dividend History<br />
9.29% 9.21% 10.12%<br />
— — —<br />
— — —<br />
$0.4039 $0.3801 $0.4129<br />
— — —<br />
— — —<br />
30<br />
6/09<br />
3/09<br />
12/08<br />
Capital Gains (last 12 mos.) 30<br />
Short-Term<br />
Long-Term<br />
OPEN-END FUNDS VALUE BLEND GROWTH SECTOR GLOBAL INTERNATIONAL HYBRID ASSET ALLOCATION FIXED INCOME TAX-FREE INCOME
OPEN-END FUNDS<br />
VALUE<br />
BLEND<br />
GROWTH<br />
SECTOR<br />
GLOBAL<br />
INTERNATIONAL<br />
HYBRID<br />
ASSET ALLOCATION<br />
FIXED INCOME<br />
TAX-FREE INCOME<br />
42 6/30/09<br />
<strong>Franklin</strong> Gold and Precious Metals Fund<br />
TM 67<br />
MORNINGSTAR STYLE BOX<br />
STYLE<br />
Value Blend Growth<br />
SIZE<br />
✕ Large<br />
Medium<br />
Small<br />
INVESTMENT CATEGORY<br />
Sector<br />
PRIMARY INVESTMENT 37<br />
Securities of domestic and foreign<br />
companies engaged in mining,<br />
processing or dealing in gold and<br />
other precious metals.<br />
FUND REFERENCE<br />
CLASS A CLASS C<br />
Fund No. 132 232<br />
CUSIP 353 535 107 353 535 206<br />
Symbol FKRCX FRGOX<br />
Inception1 5/19/69 5/1/95<br />
ADVISOR 89<br />
Fund No. 632<br />
CUSIP 353 535 305<br />
Symbol FGADX<br />
Inception 1 5/19/69<br />
✕ Current<br />
Historical<br />
ANNUAL PROSPECTUS UPDATE AVAILABLE:<br />
December 1<br />
PORTFOLIO MANAGER PROFILE84 Steve Land, CFA<br />
Joined <strong>Franklin</strong> <strong>Templeton</strong> in 1997<br />
Managed Fund since 1999<br />
Frederick G. Fromm, CFA<br />
Joined <strong>Franklin</strong> <strong>Templeton</strong> in 1992<br />
Managed Fund since 1993<br />
MAXIMUM SALES CHARGE & COMMISSION<br />
CLASS A CLASS C73 Sales Charge 5.75% 0.00%<br />
<strong>Dealer</strong> Concession 5.00 1.00<br />
12b-1 Fee to <strong>Dealer</strong> 0.25 1.00<br />
ADVISOR89 Sales Charge 0.00%<br />
<strong>Dealer</strong> Concession 0.00<br />
12b-1 Fee to <strong>Dealer</strong> 0.00<br />
See page 128 for more commission<br />
information and page 125 for footnotes.<br />
PERFORMANCE INFORMATION<br />
5, 13<br />
ANNUAL TOTAL RETURN–WITHOUT SALES CHARGES<br />
1999 2000 2001 2002 2003 2004 2005 2006 2007 2008<br />
YTD<br />
200914 CLASS A<br />
CLASS C<br />
ADVISOR43 25.39 -7.38 10.00 37.38 52.32 -5.47 40.59 31.70 25.59 -30.89 25.87<br />
24.46 -7.95 9.19 36.49 51.13 -6.15 39.49 30.78 24.68 -31.41 25.38<br />
25.95 -7.26 10.26 37.79 52.70 -5.23 40.87 32.06 25.89 -30.71 26.02<br />
AVERAGE ANNUAL TOTAL RETURN – AVERAGE ANNUAL TOTAL RETURN–<br />
WITHOUT SALES CHARGES5, 13 6, 13, 47<br />
WITH SALES CHARGES<br />
1 YR 3 YR 5 YR 10 YR INCEPTION 1 YR 3 YR 5 YR 10 YR INCEPTION<br />
CLASS A<br />
CLASS C<br />
ADVISOR43 -21.04 6.11 18.18 16.51 6.35 -25.59 4.04 16.79 15.83 6.20<br />
-21.63 5.32 17.30 15.66 7.35 -22.41 5.32 17.30 15.66 7.35<br />
-20.84 6.37 18.46 16.80 6.53 -20.84 6.37 18.46 16.80 6.53<br />
Advisor Class shares are only offered to certain eligible investors as stated in the prospectus.<br />
PORTFOLIO HOLDINGS 29 6/30<br />
Total Number of Positions 102<br />
TOP 5 COUNTRIES<br />
Canada 39.48%<br />
South Africa 22.66<br />
Australia 14.03<br />
United Kingdom 10.48<br />
Peru 3.76<br />
TOP 10 HOLDINGS7 Randgold Resources Ltd. 7.21%<br />
AngloGold Ashanti Ltd. 7.08<br />
Newcrest Mining Ltd. 6.74<br />
Goldcorp Inc. 6.15<br />
Impala Platinum Holdings Ltd. 5.90<br />
Barrick Gold Corp. 4.66<br />
Compania de Minas Buenaventura SA 3.76<br />
Kinross Gold Corp. 3.71<br />
Yamana Gold Inc. 3.22<br />
Gold Fields Ltd. 3.10<br />
ANNUAL TOTAL RETURN 5 –CLASS A<br />
WITHOUT SALES CHARGES<br />
0<br />
40.59%<br />
31.70%<br />
25.59%<br />
-30.89%<br />
2005 2006 2007 2008<br />
HYPOTHETICAL INVESTMENT 22<br />
$10,000 from Inception<br />
FUND FACTS<br />
Net Assets (millions)<br />
Expense Ratio 2<br />
Net Asset Value<br />
Public Offering Price<br />
Beta 3<br />
Standard Deviation 65<br />
FUND DISTRIBUTIONS<br />
Dividend Frequency<br />
Annually in December.<br />
4, 30<br />
Dividend History<br />
12/08<br />
12/07<br />
12/06<br />
Capital Gains (last 4, 30 12 mos.)<br />
Short-Term<br />
Long-Term<br />
25.87%<br />
YTD 2009 14<br />
CLASS A CLASS C ADVISOR43 $111,513 $27,303 $126,249<br />
CLASS A CLASS C ADVISOR<br />
$1,247.9 $291.2 $124.5<br />
0.91% 1.66% 0.66%<br />
$31.43 $30.33 $32.50<br />
$33.35 $30.33 $32.50<br />
1.00 1.00 1.00<br />
49.06 49.06 49.06<br />
CLASS A CLASS C ADVISOR<br />
— — —<br />
$1.9717 $1.7317 $2.0599<br />
0.7618 0.4672 0.8527<br />
— — —<br />
0.1215 0.1215 0.1215<br />
ASSET ALLOCATION 29, 60 6/30<br />
Stocks 98%<br />
Cash 2%<br />
34 <strong>Dealer</strong> <strong>Facts</strong> <strong>Guide</strong> Go to franklintempleton.com or call (800) 223-2141 DEALER USE ONLY/NOT FOR DISTRIBUTION TO THE PUBLIC
<strong>Franklin</strong> Natural Resources Fund<br />
OVERALL MORNINGSTAR<br />
8, 67<br />
RATINGTM – CLASS A<br />
TM 67<br />
MORNINGSTAR STYLE BOX<br />
STYLE<br />
Value Blend Growth<br />
SIZE<br />
✕ Large<br />
Medium<br />
Small<br />
INVESTMENT CATEGORY<br />
Sector<br />
PRIMARY INVESTMENT 37<br />
Securities of companies that<br />
own, produce, refine and market<br />
natural resources, as well as those<br />
that provide support services for<br />
natural resources companies. The<br />
fund may also invest in securities<br />
of issuers outside the U.S.<br />
FUND REFERENCE<br />
CLASS A CLASS C<br />
Fund No. 403 503<br />
CUSIP 354 713 604 354 713 455<br />
Symbol FRNRX FNCRX<br />
Inception1 6/5/95 9/1/05<br />
ADVISOR 89<br />
Fund No. 613<br />
CUSIP 354 713 851<br />
Symbol FNRAX<br />
Inception 1 6/5/95<br />
✕ Current<br />
Historical<br />
ANNUAL PROSPECTUS UPDATE AVAILABLE:<br />
September 1<br />
PORTFOLIO MANAGER PROFILE84 Frederick G. Fromm, CFA<br />
Joined <strong>Franklin</strong> <strong>Templeton</strong> in 1992<br />
Managed Fund since 2003<br />
Matthew Adams, CFA<br />
Joined <strong>Franklin</strong> <strong>Templeton</strong> in 2005<br />
Managed Fund since 2008<br />
Steve Land, CFA<br />
Joined <strong>Franklin</strong> <strong>Templeton</strong> in 1997<br />
Managed Fund since 1999<br />
MAXIMUM SALES CHARGE & COMMISSION<br />
CLASS A CLASS C73 Sales Charge 5.75% 0.00%<br />
<strong>Dealer</strong> Concession 5.00 1.00<br />
12b-1 Fee to <strong>Dealer</strong> 0.25 1.00<br />
ADVISOR89 Sales Charge 0.00%<br />
<strong>Dealer</strong> Concession 0.00<br />
12b-1 Fee to <strong>Dealer</strong> 0.00<br />
See page 128 for more commission<br />
information and page 125 for footnotes.<br />
PORTFOLIO HOLDINGS 29 6/30<br />
Total Number of Positions 111<br />
PORTFOLIO BREAKDOWN<br />
Energy 70.81%<br />
Materials 18.01<br />
Software & Services 1.38<br />
Food, Beverage & Tobacco 0.78<br />
Transportation 0.42<br />
Capital Goods 0.20<br />
TOP 10 HOLDINGS7 XTO Energy Inc. 3.41%<br />
Occidental Petroleum Corp. 3.30<br />
Devon Energy Corp. 3.28<br />
Southwestern Energy Co. 2.82<br />
Marathon Oil Corp. 2.70<br />
Range Resources Corp. 2.66<br />
Noble Energy Inc. 2.56<br />
EOG Resources Inc. 2.44<br />
Petrohawk Energy Corp. 2.31<br />
Chevron Corp. 2.10<br />
ANNUAL TOTAL RETURN 5 –CLASS A<br />
WITHOUT SALES CHARGES<br />
37.50%<br />
38.87%<br />
0<br />
14.24%<br />
-51.18%<br />
HYPOTHETICAL INVESTMENT 22<br />
$10,000 from Inception<br />
FUND FACTS<br />
Net Assets (millions)<br />
Expense Ratio 2<br />
Net Asset Value<br />
Public Offering Price<br />
Beta 3<br />
Standard Deviation 65<br />
FUND DISTRIBUTIONS<br />
Dividend Frequency<br />
Annually in December.<br />
Dividend History 30<br />
12/08<br />
12/07<br />
12/06<br />
Capital Gains (last 12 mos.) 30<br />
Short-Term<br />
Long-Term<br />
27.02%<br />
2005 2006 2007 2008 YTD 2009 14<br />
6/30/09<br />
PERFORMANCE INFORMATION<br />
5, 13<br />
ANNUAL TOTAL RETURN–WITHOUT SALES CHARGES<br />
1999 2000 2001 2002 2003 2004 2005 2006 2007 2008<br />
YTD<br />
200914 CLASS A<br />
CLASS C<br />
ADVISOR43 33.52 34.82 -16.70 -5.24 24.98 31.23 37.50 14.24 38.87 -51.18 27.02<br />
— — — — — — — 13.39 37.96 -51.53 26.56<br />
38.00 35.30 -16.43 -4.93 25.57 31.74 37.96 14.59 39.27 -51.03 27.18<br />
AVERAGE ANNUAL TOTAL RETURN – AVERAGE ANNUAL TOTAL RETURN–<br />
WITHOUT SALES CHARGES5, 13 6, 13, 46<br />
WITH SALES CHARGES<br />
1 YR 3 YR 5 YR 10 YR INCEPTION 1 YR 3 YR 5 YR 10 YR INCEPTION<br />
CLASS A<br />
CLASS C<br />
ADVISOR43 -47.91 -3.97 9.62 9.37 9.83 -50.91 -5.85 8.32 8.72 9.36<br />
-48.29 -4.65 — — -0.49 -48.77 -4.65 — — -0.49<br />
-47.77 -3.70 9.95 9.74 10.47 -47.77 -3.70 9.95 9.74 10.47<br />
Advisor Class shares are only offered to certain eligible investors as stated in the prospectus.<br />
CLASS A CLASS C ADVISOR43 $35,229 $9,814 $40,593<br />
CLASS A CLASS C ADVISOR<br />
$462.0 $74.7 $61.7<br />
0.99% 1.70% 0.70%<br />
$24.63 $24.16 $26.16<br />
$26.13 $24.16 $26.16<br />
1.27 1.27 1.27<br />
35.89 35.90 35.90<br />
CLASS A CLASS C ADVISOR<br />
— — —<br />
$0.5173 $0.3229 $0.6218<br />
0.2471 0.0719 0.3452<br />
0.6640 0.6640 0.6640<br />
0.8367 0.8367 0.8367<br />
ASSET ALLOCATION 29, 60 6/30<br />
Stocks 92%<br />
Cash 8%<br />
DEALER USE ONLY/NOT FOR DISTRIBUTION TO THE PUBLIC Go to franklintempleton.com or call (800) 223-2141 <strong>Dealer</strong> <strong>Facts</strong> <strong>Guide</strong> 35<br />
OPEN-END FUNDS VALUE BLEND GROWTH SECTOR GLOBAL INTERNATIONAL HYBRID ASSET ALLOCATION FIXED INCOME TAX-FREE INCOME
OPEN-END FUNDS<br />
VALUE<br />
BLEND<br />
GROWTH<br />
SECTOR<br />
GLOBAL<br />
INTERNATIONAL<br />
HYBRID<br />
ASSET ALLOCATION<br />
FIXED INCOME<br />
TAX-FREE INCOME<br />
<strong>Franklin</strong> Real Estate Securities Fund<br />
OVERALL MORNINGSTAR<br />
8, 67<br />
RATINGTM – CLASS A<br />
TM 67<br />
MORNINGSTAR STYLE BOX<br />
STYLE<br />
Value Blend Growth<br />
SIZE<br />
Large<br />
✕<br />
Medium<br />
Small<br />
✕ Current<br />
Historical<br />
INVESTMENT CATEGORY<br />
Sector<br />
PRIMARY INVESTMENT 37<br />
Securities of companies, including<br />
small cap, operating in the real<br />
estate industry, focusing on equity<br />
real estate investment trusts (REITs).<br />
FUND REFERENCE<br />
CLASS A CLASS C<br />
Fund No. 192 292<br />
CUSIP 354 602 104 354 602 203<br />
Symbol FREEX FRRSX<br />
Inception1 1/3/94 5/1/95<br />
ADVISOR 89<br />
Fund No. 692<br />
CUSIP 354 602 302<br />
Symbol FRLAX<br />
Inception 1 1/3/94<br />
ANNUAL PROSPECTUS UPDATE AVAILABLE:<br />
September 1<br />
PORTFOLIO MANAGER PROFILE84 Jack Foster<br />
Joined <strong>Franklin</strong> <strong>Templeton</strong> in 1987<br />
Managed Fund since 2008<br />
David Levy<br />
Joined <strong>Franklin</strong> <strong>Templeton</strong> in 2007<br />
Managed Fund since 2008<br />
MAXIMUM SALES CHARGE & COMMISSION<br />
CLASS A CLASS C73 Sales Charge 5.75% 0.00%<br />
<strong>Dealer</strong> Concession 5.00 1.00<br />
12b-1 Fee to <strong>Dealer</strong> 0.25 1.00<br />
ADVISOR89 Sales Charge 0.00%<br />
<strong>Dealer</strong> Concession 0.00<br />
12b-1 Fee to <strong>Dealer</strong> 0.00<br />
See page 128 for more commission<br />
information and page 125 for footnotes.<br />
PORTFOLIO HOLDINGS 29 6/30<br />
Total Number of Positions 39<br />
PROPERTY BREAKDOWN<br />
Retail REITs 31.00%<br />
Specialized REITs 25.01<br />
Office REITs 15.95<br />
Residential REITs 11.60<br />
Diversified REITs 8.26<br />
Industrial REITs 5.23<br />
TOP 10 HOLDINGS7 Simon Property Group Inc. 8.51%<br />
Boston Properties Inc. 6.16<br />
Ventas Inc. 5.35<br />
Vornado Realty Trust 4.71<br />
Public Storage 4.10<br />
HCP Inc. 3.95<br />
Host Hotels & Resorts Inc. 3.75<br />
Kimco Realty Corp. 3.61<br />
Equity Residential 3.24<br />
Health Care REIT Inc. 3.23<br />
ANNUAL TOTAL RETURN 5 –CLASS A<br />
WITHOUT SALES CHARGES<br />
21.28%<br />
13.22%<br />
0<br />
-27.78%<br />
-38.12%<br />
2005 2006 2007 2008<br />
HYPOTHETICAL INVESTMENT 22<br />
$10,000 from Inception<br />
FUND FACTS<br />
Net Assets (millions)<br />
Expense Ratio 2<br />
Net Asset Value<br />
Public Offering Price<br />
Beta 3<br />
Standard Deviation 65<br />
FUND DISTRIBUTIONS<br />
6/30/09<br />
PERFORMANCE INFORMATION<br />
5, 13<br />
ANNUAL TOTAL RETURN–WITHOUT SALES CHARGES<br />
1999 2000 2001 2002 2003 2004 2005 2006 2007 2008<br />
YTD<br />
200914 CLASS A<br />
CLASS C<br />
ADVISOR43 -5.63 30.84 7.64 1.70 37.64 32.13 13.22 21.28 -27.78 -38.12 -17.43<br />
-6.31 29.88 6.93 0.89 36.66 31.14 12.37 20.40 -28.32 -38.58 -17.76<br />
-5.38 31.19 7.90 2.00 37.94 32.47 13.50 21.61 -27.60 -37.99 -17.35<br />
AVERAGE ANNUAL TOTAL RETURN – AVERAGE ANNUAL TOTAL RETURN–<br />
WITHOUT SALES CHARGES5, 13 6, 13, 46<br />
WITH SALES CHARGES<br />
1 YR 3 YR 5 YR 10 YR INCEPTION 1 YR 3 YR 5 YR 10 YR INCEPTION<br />
CLASS A<br />
CLASS C<br />
ADVISOR43 -46.80 -24.11 -8.62 1.67 5.12 -49.87 -25.59 -9.70 1.07 4.72<br />
-47.21 -24.68 -9.30 0.91 4.21 -47.68 -24.68 -9.30 0.91 4.21<br />
-46.69 -23.93 -8.40 1.92 5.45 -46.69 -23.93 -8.40 1.92 5.45<br />
Advisor Class shares are only offered to certain eligible investors as stated in the prospectus.<br />
CLASS A CLASS C ADVISOR43 $20,423 $17,925 $22,752<br />
CLASS A CLASS C ADVISOR<br />
$135.5 $26.8 $1.9<br />
1.03% 1.78% 0.78%<br />
$7.71 $7.52 $7.75<br />
$8.18 $7.52 $7.75<br />
0.93 0.93 0.93<br />
39.40 39.42 39.44<br />
Dividend Frequency<br />
Quarterly on the 15 th of March, June, September and December.<br />
CLASS A CLASS C ADVISOR<br />
Distribution Rate15 4, 30<br />
Dividend History<br />
3.20% 2.49% 3.71%<br />
6/09<br />
$0.0355 $0.0128 $0.0440<br />
3/09<br />
— — —<br />
12/08<br />
Capital Gains (last 4, 30 12 mos.)<br />
0.0830 0.0625 0.0898<br />
Short-Term<br />
— — —<br />
Long-Term<br />
0.9353 0.9353 0.9353<br />
-17.43%<br />
YTD 2009 14<br />
ASSET ALLOCATION 29, 60 6/30<br />
Stocks 97%<br />
Cash 3%<br />
36 <strong>Dealer</strong> <strong>Facts</strong> <strong>Guide</strong> Go to franklintempleton.com or call (800) 223-2141 DEALER USE ONLY/NOT FOR DISTRIBUTION TO THE PUBLIC
<strong>Franklin</strong> Utilities Fund<br />
OVERALL MORNINGSTAR RATING TM<br />
CLASS A 8<br />
★★★★<br />
MORNINGSTAR STYLE BOX<br />
STYLE<br />
Value Blend Growth<br />
SIZE<br />
✕<br />
Large<br />
Medium<br />
Small<br />
✕ Current<br />
Historical<br />
INVESTMENT CATEGORY<br />
Sector<br />
TM 67<br />
PRIMARY INVESTMENT 37<br />
Securities of domestic and foreign<br />
public utility companies located in<br />
high growth areas.<br />
FUND REFERENCE<br />
CLASS A CLASS C<br />
Fund No. 107 207<br />
CUSIP 353 496 409 353 496 706<br />
Symbol FKUTX FRUSX<br />
Inception1 9/30/48 5/1/95<br />
CLASS R ADVISOR 89<br />
Fund No. 807 607<br />
CUSIP 353 496 698 353 496 854<br />
Symbol FRURX FRUAX<br />
Inception1 9/30/48 9/30/48<br />
ANNUAL PROSPECTUS UPDATE AVAILABLE:<br />
February 1<br />
PORTFOLIO MANAGER PROFILE 84<br />
John Kohli, CFA, CPA<br />
Joined <strong>Franklin</strong> <strong>Templeton</strong> in 1992<br />
Managed Fund since 1998<br />
MAXIMUM SALES CHARGE & COMMISSION<br />
CLASS A CLASS C73 Sales Charge 4.25% 0.00%<br />
<strong>Dealer</strong> Concession 4.00 1.00<br />
12b-1 Fee to <strong>Dealer</strong> 0.15 0.65<br />
CLASS R ADVISOR 89<br />
Sales Charge 0.00% 0.00%<br />
<strong>Dealer</strong> Concession 0.00 0.00<br />
12b-1 Fee to <strong>Dealer</strong> 0.50 0.00<br />
See page 128 for more commission<br />
information and page 125 for footnotes.<br />
PORTFOLIO HOLDINGS 29 6/30<br />
Total Number of Positions 55<br />
PORTFOLIO BREAKDOWN<br />
Electric Utilities 47.78%<br />
Multi-Utilities 35.85<br />
Independent Power Producers &<br />
Energy Traders 2.92<br />
Oil & Gas Storage & Transportation 2.85<br />
Integrated Telecommunication<br />
Services 2.59<br />
Gas Utilities 1.49<br />
Water Utilities 1.00<br />
TOP 10 HOLDINGS 7<br />
Exelon Corp. 5.63%<br />
Entergy Corp. 4.46<br />
PG&E Corp. 4.23<br />
FPL Group Inc. 4.17<br />
Sempra Energy 4.16<br />
Southern Co. 4.08<br />
Public Service Enterprise Group Inc. 3.59<br />
PPL Corp. 3.45<br />
FirstEnergy Corp. 3.25<br />
Progress Energy Inc. 2.97<br />
ANNUAL TOTAL RETURN 5 –CLASS A<br />
WITHOUT SALES CHARGES<br />
23.89%<br />
16.42%<br />
10.74%<br />
0<br />
-25.60%<br />
2005 2006 2007 2008<br />
-0.79%<br />
YTD 2009 14<br />
6/30/09<br />
PERFORMANCE INFORMATION<br />
ANNUAL TOTAL RETURN–WITHOUT SALES CHARGES5 1999 2000 2001 2002 2003 2004 2005 2006 2007 2008<br />
YTD<br />
2009 14<br />
CLASS A<br />
CLASS C<br />
ADVISOR43 -15.00 41.61 -8.09 -10.48 19.30 23.14 10.74 23.89 16.42 -25.60 -0.79<br />
-15.45 40.95 -8.54 -10.89 18.56 22.70 10.16 23.17 15.90 -26.00 -0.97<br />
-14.76 41.66 -7.94 -10.32 19.39 23.39 10.94 23.97 16.67 -25.50 -0.71<br />
AVERAGE ANNUAL TOTAL RETURN– AVERAGE ANNUAL TOTAL RETURN–<br />
WITHOUT SALES CHARGES5 6, 10<br />
WITH SALES CHARGES<br />
1 YR 3 YR 5 YR 10 YR INCEPTION 1 YR 3 YR 5 YR 10 YR INCEPTION<br />
CLASS A<br />
CLASS C<br />
ADVISOR43 -22.49 0.28 6.73 6.09 9.51 -25.77 -1.15 5.81 5.62 9.43<br />
-22.85 -0.20 6.22 5.56 7.26 -23.58 -0.20 6.22 5.56 7.26<br />
-22.35 0.43 6.91 6.24 9.57 -22.35 0.43 6.91 6.24 9.57<br />
Advisor Class shares are only offered to certain eligible investors as stated in the prospectus.<br />
HYPOTHETICAL INVESTMENT 22<br />
CLASS A CLASS C ADVISOR 43<br />
$10,000 from Inception $2,389,295 $26,974 $2,573,155<br />
FUND FACTS<br />
Net Assets (millions)<br />
Expense Ratio2 Net Asset Value<br />
Public Offering Price<br />
Beta 3<br />
Standard Deviation 65<br />
ASSET ALLOCATION 29, 60 6/30<br />
Stocks 94%<br />
Bonds 4%<br />
Cash 2%<br />
CLASS A CLASS C ADVISOR<br />
$1,471.5 $283.0 $59.1<br />
0.74% 1.24% 0.59%<br />
$10.21 $10.18 $10.26<br />
$10.66 $10.18 $10.26<br />
0.89 0.89 0.89<br />
16.29 16.26 16.27<br />
FUND DISTRIBUTIONS<br />
Dividend Frequency<br />
Quarterly on the 15th of March, June, September and December.<br />
CLASS A CLASS C ADVISOR<br />
Distribution Rate15 4, 30<br />
Dividend History<br />
3.94% 3.67% 4.22%<br />
6/09<br />
$0.1050 $0.0934 $0.1083<br />
3/09<br />
0.1010 0.0871 0.1049<br />
12/08<br />
Capital Gains (last 4, 30 12 mos.)<br />
0.1010 0.0872 0.1051<br />
Short-Term<br />
— — —<br />
Long-Term<br />
0.0773 0.0773 0.0773<br />
DEALER USE ONLY/NOT FOR DISTRIBUTION TO THE PUBLIC Go to franklintempleton.com or call (800) 223-2141 <strong>Dealer</strong> <strong>Facts</strong> <strong>Guide</strong> 37<br />
OPEN-END FUNDS VALUE BLEND GROWTH SECTOR GLOBAL INTERNATIONAL HYBRID ASSET ALLOCATION FIXED INCOME TAX-FREE INCOME
OPEN-END FUNDS<br />
VALUE<br />
BLEND<br />
GROWTH<br />
SECTOR<br />
GLOBAL<br />
INTERNATIONAL<br />
HYBRID<br />
ASSET ALLOCATION<br />
FIXED INCOME<br />
TAX-FREE INCOME<br />
Mutual Financial Services Fund<br />
OVERALL MORNINGSTAR RATING TM<br />
CLASS A 8<br />
★★★★<br />
INVESTMENT CATEGORY<br />
Sector<br />
PRIMARY INVESTMENT 37<br />
Common and preferred stock, as<br />
well as debt securities, including<br />
high-yield, lower-rated securities of<br />
domestic and foreign companies<br />
that the fund’s manager believes are<br />
undervalued. These companies may<br />
be involved in mergers, consolidations,<br />
liquidations, and reorganizations.<br />
The fund focuses primarily on<br />
companies, including smallcapitalization<br />
companies, in the<br />
financial services industry.<br />
FUND REFERENCE<br />
CLASS A CLASS C<br />
Fund No. 479 579<br />
CUSIP 354 026 106 354 026 205<br />
Symbol TFSIX TMFSX<br />
Inception1 8/19/97 8/19/97<br />
CLASS Z 89<br />
Fund No. 079<br />
CUSIP 354 026 304<br />
Symbol TEFAX<br />
Inception 1 8/19/97<br />
ANNUAL PROSPECTUS UPDATE AVAILABLE:<br />
May 1<br />
PORTFOLIO MANAGER PROFILE 84<br />
Charles M. Lahr, CFA<br />
Joined Mutual Series in 2003<br />
Managed Fund since 2004<br />
MAXIMUM SALES CHARGE & COMMISSION<br />
CLASS A CLASS C73 Sales Charge 5.75% 0.00%<br />
<strong>Dealer</strong> Concession 5.00 1.00<br />
12b-1 Fee to <strong>Dealer</strong> 0.25 1.00<br />
CLASS Z89 Sales Charge 0.00%<br />
<strong>Dealer</strong> Concession 0.00<br />
12b-1 Fee to <strong>Dealer</strong> 0.00<br />
See page 128 for more commission<br />
information and page 125 for footnotes.<br />
PORTFOLIO HOLDINGS 29 6/30<br />
Total Number of Positions 122<br />
PORTFOLIO BREAKDOWN<br />
Insurance 33.76%<br />
Banks 17.84<br />
Diversified Financials 15.45<br />
Real Estate 5.35<br />
Media 0.95<br />
Consumer Durables & Apparel 0.74<br />
Food, Beverage & Tobacco 0.54<br />
Commercial & Professional Services 0.35<br />
Food & Staples Retailing<br />
Pharmaceuticals, Biotechnology &<br />
0.33<br />
Life Sciences 0.28<br />
TOP 10 HOLDINGS7 Deutsche Boerse AG 3.45%<br />
Symetra Financial 3.30<br />
Maiden Holdings Ltd. 2.99<br />
Intesa Sanpaolo SpA 2.64<br />
BNP Paribas 2.32<br />
Hellenic Exchanges SA Holding 2.31<br />
CNinsure Inc. 2.31<br />
Lancashire Holdings Ltd. 2.23<br />
AmTrust Financial Services Inc. 2.12<br />
Bolsas y Mercados Espanoles 2.02<br />
ANNUAL TOTAL RETURN 5 –CLASS A<br />
WITHOUT SALES CHARGES<br />
19.35%<br />
13.82%<br />
0<br />
-8.99% -40.23%<br />
2005 2006 2007 2008<br />
HYPOTHETICAL INVESTMENT 22<br />
$10,000 from Inception<br />
FUND FACTS<br />
Net Assets (millions)<br />
Expense Ratio 2<br />
Net Asset Value<br />
Public Offering Price<br />
Beta 3<br />
Standard Deviation 65<br />
FUND DISTRIBUTIONS<br />
6/30/09<br />
PERFORMANCE INFORMATION<br />
5, 13<br />
ANNUAL TOTAL RETURN–WITHOUT SALES CHARGES<br />
1999 2000 2001 2002 2003 2004 2005 2006 2007 2008<br />
YTD<br />
2009 14<br />
CLASS A 4.35 31.90 11.85 -0.57 29.79 15.17 13.82 19.35 -8.99 -40.23 3.60<br />
CLASS C 3.67 31.08 11.15 -1.20 28.87 14.46 13.06 18.52 -9.60 -40.63 3.24<br />
CLASS Z 4.70 32.29 12.31 -0.27 30.23 15.62 14.14 19.73 -8.71 -40.08 3.80<br />
AVERAGE ANNUAL TOTAL RETURN– AVERAGE ANNUAL TOTAL RETURN–<br />
WITHOUT SALES CHARGES5, 13 6, 13, 46<br />
WITH SALES CHARGES<br />
1 YR 3 YR 5 YR 10 YR INCEPTION 1 YR 3 YR 5 YR 10 YR INCEPTION<br />
CLASS A -20.31 -13.84 -3.02 4.53 7.35 -24.91 -15.52 -4.16 3.91 6.81<br />
CLASS C -20.83 -14.43 -3.68 3.83 6.64 -21.61 -14.43 -3.68 3.83 6.64<br />
CLASS Z -20.04 -13.58 -2.72 4.87 7.69 -20.04 -13.58 -2.72 4.87 7.69<br />
Class Z shares are only offered to certain eligible investors as stated in the prospectus.<br />
CLASS A CLASS C CLASS Z<br />
$21,856 $21,446 $24,072<br />
CLASS A CLASS C CLASS Z<br />
$253.0 $98.4 $90.3<br />
1.49% 2.19% 1.19%<br />
$11.22 $11.15 $11.21<br />
$11.90 $11.15 $11.21<br />
0.44 0.44 0.44<br />
16.60 16.61 16.62<br />
Dividend Frequency<br />
Semiannually in September and December.<br />
CLASS A<br />
Dividend History<br />
CLASS C CLASS Z<br />
30<br />
12/08<br />
9/08<br />
12/07<br />
Capital Gains (last 12 mos.) 30<br />
$0.3080 $0.2114 $0.3503<br />
0.0473 0.0377 0.0512<br />
0.4190 0.2657 0.4853<br />
Short-Term<br />
— — —<br />
Long-Term<br />
— — —<br />
3.60%<br />
YTD 2009 14<br />
ASSET ALLOCATION 29, 60 6/30<br />
Stocks 76%<br />
Cash 19%<br />
Bonds 5%<br />
38 <strong>Dealer</strong> <strong>Facts</strong> <strong>Guide</strong> Go to franklintempleton.com or call (800) 223-2141 DEALER USE ONLY/NOT FOR DISTRIBUTION TO THE PUBLIC
92 6/30/09<br />
Mutual Global Discovery Fund<br />
OVERALL MORNINGSTAR RATING TM<br />
CLASS A 8<br />
★★★★★<br />
INVESTMENT CATEGORY<br />
Global<br />
PRIMARY INVESTMENT 37<br />
Common and preferred stock, as<br />
well as debt securities, including<br />
high yield, lower-rated securities of<br />
domestic and foreign companies,<br />
that the fund’s manager believes are<br />
available at prices less than their<br />
intrinsic value. Investments include<br />
securities of smaller capitalization<br />
companies and companies involved<br />
in mergers, consolidations, liquidations,<br />
and reorganizations.<br />
Effective 5/1/09, Mutual Discovery Fund<br />
changed its name to Mutual Global Discovery<br />
Fund. The fund’s investment goal and strategy<br />
remained unchanged.<br />
FUND REFERENCE<br />
CLASS A CLASS C<br />
Fund No. 477 577<br />
CUSIP 628 380 859 628 380 842<br />
Symbol TEDIX TEDSX<br />
Inception1 12/31/92 12/31/92<br />
CLASS R CLASS Z89 Fund No. 877 077<br />
CUSIP 354 026 601 628 380 404<br />
Symbol TEDRX MDISX<br />
Inception1 12/31/92 12/31/92<br />
ANNUAL PROSPECTUS UPDATE AVAILABLE:<br />
May 1<br />
PORTFOLIO MANAGER PROFILE84 Anne E. Gudefin, CFA<br />
Joined Mutual Series in 2000<br />
Managed Fund since 2005<br />
Charles M. Lahr, CFA<br />
Joined Mutual Series in 2003<br />
Managed Fund since 2007<br />
MAXIMUM SALES CHARGE & COMMISSION<br />
CLASS A CLASS C73 Sales Charge 5.75% 0.00%<br />
<strong>Dealer</strong> Concession 5.00 1.00<br />
12b-1 Fee to <strong>Dealer</strong> 0.25 1.00<br />
CLASS R CLASS Z89 Sales Charge 0.00% 0.00%<br />
<strong>Dealer</strong> Concession 0.00 0.00<br />
12b-1 Fee to <strong>Dealer</strong> 0.50 0.00<br />
See page 128 for more commission<br />
information and page 125 for footnotes.<br />
PERFORMANCE INFORMATION<br />
5, 13, 27<br />
ANNUAL TOTAL RETURN–WITHOUT SALES CHARGES<br />
1999 2000 2001 2002 2003 2004 2005 2006 2007 2008<br />
YTD<br />
200914 CLASS A 26.38 12.26 0.86 -9.39 31.13 18.98 15.29 23.02 10.96 -26.73 7.62<br />
CLASS C 25.50 11.53 0.25 -9.98 30.29 18.17 14.56 22.17 10.24 -27.27 7.22<br />
CLASS Z 26.80 12.59 1.26 -9.06 31.55 19.39 15.70 23.43 11.32 -26.55 7.76<br />
AVERAGE ANNUAL TOTAL RETURN – AVERAGE ANNUAL TOTAL RETURN–<br />
WITHOUT SALES CHARGES5, 13, 27 6, 13, 23<br />
WITH SALES CHARGES<br />
1 YR 3 YR 5 YR 10 YR INCEPTION 1 YR 3 YR 5 YR 10 YR INCEPTION<br />
CLASS A -12.41 -0.15 7.26 8.12 12.21 -17.44 -2.11 6.00 7.48 11.80<br />
CLASS C -13.06 -0.86 6.52 7.40 11.46 -13.89 -0.86 6.52 7.40 11.46<br />
CLASS Z -12.19 0.14 7.59 8.48 12.61 -12.19 0.14 7.59 8.48 12.61<br />
Class Z shares are only offered to certain eligible investors as stated in the prospectus.<br />
PORTFOLIO HOLDINGS 29 6/30<br />
Total Number of Positions 223<br />
PORTFOLIO BREAKDOWN<br />
Food, Beverage & Tobacco 25.53%<br />
Capital Goods 5.87<br />
Energy<br />
Pharmaceuticals, Biotechnology &<br />
5.48<br />
Life Sciences 3.43<br />
Insurance 3.23<br />
Banks 3.17<br />
Real Estate 3.09<br />
Utilities 2.65<br />
Media 2.45<br />
Diversified Financials 2.33<br />
TOP 5 COUNTRIES<br />
United States 15.47%<br />
France 11.33<br />
United Kingdom 10.25<br />
Hong Kong 4.56<br />
Germany 4.47<br />
TOP 10 HOLDINGS7 Schering-Plough Corp. 3.38%<br />
Wyeth 3.28<br />
British American Tobacco PLC 3.25<br />
Imperial Tobacco Group PLC 2.74<br />
Danone 2.39<br />
Lorillard Inc. 2.08<br />
Carlsberg AS 2.04<br />
Pernod Ricard SA 1.90<br />
Eutelsat Communications 1.71<br />
Berkshire Hathaway Inc. 1.70<br />
ANNUAL TOTAL RETURN 5, 27 –CLASS A<br />
WITHOUT SALES CHARGES<br />
23.02%<br />
15.29%<br />
10.96%<br />
0<br />
-26.73%<br />
2005 2006 2007 2008<br />
22, 27<br />
HYPOTHETICAL INVESTMENT<br />
CLASS A CLASS C CLASS Z<br />
$10,000 from Inception $63,010 $59,901 $70,881<br />
FUND FACTS<br />
Net Assets (millions)<br />
Expense Ratio 2<br />
Net Asset Value<br />
Public Offering Price<br />
Beta 3<br />
Standard Deviation 65<br />
FUND DISTRIBUTIONS<br />
CLASS A CLASS C CLASS Z<br />
$6,534.8 $2,116.3 $4,133.7<br />
1.30% 2.01% 1.02%<br />
$24.00 $23.76 $24.29<br />
$25.46 $23.76 $24.29<br />
0.48 0.48 0.48<br />
12.31 12.31 12.30<br />
Dividend Frequency<br />
Semiannually in September and December.<br />
CLASS A<br />
Dividend History<br />
CLASS C CLASS Z<br />
30<br />
12/08<br />
9/08<br />
12/07<br />
Capital Gains (last 12 mos.) 30<br />
$0.3287 $0.1334 $0.4031<br />
0.0348 0.0170 0.0430<br />
0.6229 0.4306 0.7089<br />
Short-Term<br />
0.7715 0.7715 0.7715<br />
Long-Term<br />
0.0951 0.0951 0.0951<br />
7.62%<br />
YTD 2009 14<br />
ASSET ALLOCATION 29, 60 6/30<br />
Stocks 64%<br />
Cash 32%<br />
Bonds 4%<br />
DEALER USE ONLY/NOT FOR DISTRIBUTION TO THE PUBLIC Go to franklintempleton.com or call (800) 223-2141 <strong>Dealer</strong> <strong>Facts</strong> <strong>Guide</strong> 39<br />
OPEN-END FUNDS VALUE BLEND GROWTH SECTOR GLOBAL INTERNATIONAL HYBRID ASSET ALLOCATION FIXED INCOME TAX-FREE INCOME
OPEN-END FUNDS<br />
VALUE<br />
BLEND<br />
GROWTH<br />
SECTOR<br />
GLOBAL<br />
INTERNATIONAL<br />
HYBRID<br />
ASSET ALLOCATION<br />
FIXED INCOME<br />
TAX-FREE INCOME<br />
<strong>Templeton</strong> Global Long-Short Fund<br />
INVESTMENT CATEGORY<br />
Global<br />
PRIMARY INVESTMENT37 Seeks to achieve long-term capital<br />
appreciation in both up and down<br />
markets with less volatility than the<br />
overall global stock market.<br />
The minimum initial purchase is $10,000<br />
and the minimum subsequent investment in<br />
the continuous offering is $1,000.<br />
FUND REFERENCE<br />
CLASS A ADVISOR89 Fund No. 467 697<br />
CUSIP 353 61F 881 353 61F 865<br />
Symbol TLSAX —<br />
Inception1 7/31/01 7/31/01<br />
ANNUAL PROSPECTUS UPDATE AVAILABLE:<br />
March 1<br />
PORTFOLIO MANAGER PROFILE 84<br />
Matthew Nagle, CFA, CPA<br />
Joined <strong>Franklin</strong> <strong>Templeton</strong> in 2003<br />
Managed Fund since 2007<br />
MAXIMUM SALES CHARGE & COMMISSION<br />
CLASS A ADVISOR89 Sales Charge 5.75% 0.00%<br />
<strong>Dealer</strong> Concession 5.00 0.00<br />
12b-1 Fee to <strong>Dealer</strong> 0.25 0.00<br />
See page 128 for more commission<br />
information and page 125 for footnotes.<br />
PORTFOLIO HOLDINGS 29 6/30<br />
Total Number of Positions 104<br />
TOP 5 LONG INDUSTRY BREAKDOWN<br />
Telecommunication Services<br />
Pharmaceuticals, Biotechnology &<br />
12.97%<br />
Life Sciences 10.81<br />
Energy 8.96<br />
Media 7.66<br />
Technology Hardware & Equipment 6.22<br />
TOP 5 SHORT INDUSTRY BREAKDOWN<br />
Diversified Financials -13.25%<br />
Media -2.57<br />
Commercial & Professional Services -2.40<br />
Capital Goods -2.15<br />
Consumer Durables & Apparel -1.00<br />
GEOGRAPHIC BREAKDOWN<br />
Europe 54.14%<br />
North America 51.19<br />
Asia 11.59<br />
Australia/New Zealand 1.70<br />
Latin America/Caribbean 0.99<br />
The geographic breakdown reflects long and short<br />
positions and may not total 100%.<br />
TOP 10 HOLDINGS7 Merck & Company Inc. 2.30%<br />
Microsoft Corp. 2.19<br />
Roche Holding AG 2.16<br />
BP PLC 2.12<br />
Vodafone Group PLC 2.03<br />
Cisco Systems Inc. 2.00<br />
Comcast Corp. 1.97<br />
Gazprom 1.88<br />
Flextronics International Ltd. 1.87<br />
Telekom Austria AG 1.85<br />
ANNUAL TOTAL RETURN 5 –CLASS A<br />
WITHOUT SALES CHARGES<br />
0<br />
3.33%<br />
14.35%<br />
9.24%<br />
-37.56%<br />
2005 2006 2007 2008<br />
HYPOTHETICAL INVESTMENT 22<br />
$10,000 from Inception<br />
FUND FACTS<br />
Net Assets (millions)<br />
Expense Ratio 2<br />
Net Asset Value<br />
Public Offering Price<br />
Beta 3<br />
Standard Deviation 65<br />
FUND DISTRIBUTIONS<br />
Dividend Frequency<br />
Annually.<br />
Dividend History 30<br />
6/09<br />
12/08<br />
12/07<br />
Capital Gains (last 12 mos.) 30<br />
Short-Term<br />
Long-Term<br />
4.51%<br />
YTD 2009 14<br />
6/30/09<br />
PERFORMANCE INFORMATION<br />
5, 13<br />
ANNUAL TOTAL RETURN–WITHOUT SALES CHARGES<br />
1999 2000 2001 2002 2003 2004 2005 2006 2007 2008<br />
YTD<br />
200914 CLASS A<br />
ADVISOR43 — — — -1.18 10.64 4.65 3.33 14.35 9.24 -37.56 4.51<br />
— — — -1.18 10.64 4.77 3.66 14.73 9.61 -37.38 4.64<br />
AVERAGE ANNUAL TOTAL RETURN – AVERAGE ANNUAL TOTAL RETURN–<br />
WITHOUT SALES CHARGES5, 13 6, 13<br />
WITH SALES CHARGES<br />
CLASS A<br />
ADVISOR 43<br />
1 YR 3 YR 5 YR 10 YR INCEPTION 1 YR 3 YR 5 YR 10 YR INCEPTION<br />
-25.29 -8.44 -2.53 — -0.24 -29.60 -10.23 -3.68 — -0.99<br />
-25.14 -8.16 -2.23 — -0.05 -25.14 -8.16 -2.23 — -0.05<br />
Advisor Class shares are only offered to certain eligible investors as stated in the prospectus.<br />
CLASS A ADVISOR43 $9,246 $ 9,961<br />
CLASS A ADVISOR<br />
$50.6 $1.3<br />
2.46% 2.16%<br />
$7.02 $7.05<br />
$7.45 $7.05<br />
1.23 1.23<br />
18.06 18.07<br />
CLASS A ADVISOR<br />
— —<br />
— —<br />
$0.1369 $0.1732<br />
0.5294 0.5294<br />
1.6635 1.6635<br />
ASSET ALLOCATION 29, 60 6/30<br />
Net Stock<br />
Exposure 70%<br />
Long 95%<br />
Short -25%<br />
Cash 30%<br />
40 <strong>Dealer</strong> <strong>Facts</strong> <strong>Guide</strong> Go to franklintempleton.com or call (800) 223-2141 DEALER USE ONLY/NOT FOR DISTRIBUTION TO THE PUBLIC
<strong>Templeton</strong> Global Opportunities Trust<br />
OVERALL MORNINGSTAR RATING TM<br />
CLASS A 8<br />
★★★★<br />
MORNINGSTAR STYLE BOX<br />
STYLE<br />
Value Blend Growth<br />
SIZE<br />
✕ Large<br />
Medium<br />
Small<br />
INVESTMENT CATEGORY<br />
Global<br />
PRIMARY INVESTMENT 37<br />
Stocks and bonds, including high<br />
yield, lower-rated bonds, issued<br />
by companies and governments of<br />
any nation, including developing<br />
markets.<br />
FUND REFERENCE<br />
CLASS A CLASS C<br />
Fund No. 415 515<br />
CUSIP 880 20E 100 880 20E 209<br />
Symbol TEGOX TEGPX<br />
Inception1 2/28/90 5/1/95<br />
ADVISOR 89<br />
Fund No. 678<br />
CUSIP 880 20E 407<br />
Symbol —<br />
Inception 1 2/28/90<br />
✕ Current<br />
Historical<br />
TM 67<br />
ANNUAL PROSPECTUS UPDATE AVAILABLE:<br />
May 1<br />
PORTFOLIO MANAGER PROFILE84 Guang Yang, CFA<br />
Joined <strong>Franklin</strong> <strong>Templeton</strong> in 1995<br />
Managed Fund since 2001<br />
Tina Sadler, CFA<br />
Joined <strong>Templeton</strong> in 1997<br />
Managed Fund since 2004<br />
Peter A. Nori, CFA<br />
Joined <strong>Franklin</strong> <strong>Templeton</strong> in 1987<br />
Managed Fund since 2004<br />
MAXIMUM SALES CHARGE & COMMISSION<br />
CLASS A CLASS C73 Sales Charge 5.75% 0.00%<br />
<strong>Dealer</strong> Concession 5.00 1.00<br />
12b-1 Fee to <strong>Dealer</strong> 0.25 1.00<br />
ADVISOR89 Sales Charge 0.00%<br />
<strong>Dealer</strong> Concession 0.00<br />
12b-1 Fee to <strong>Dealer</strong> 0.00<br />
See page 128 for more commission<br />
information and page 125 for footnotes.<br />
PORTFOLIO HOLDINGS 29 6/30<br />
Total Number of Positions 145<br />
INDUSTRY BREAKDOWN<br />
Pharmaceuticals, Biotechnology<br />
& Life Sciences 14.97%<br />
Energy 10.19<br />
Telecommunication Services 7.88<br />
Banks 7.68<br />
Media 6.14<br />
Utilities 6.06<br />
Technology Hardware & Equipment 5.92<br />
Capital Goods 5.21<br />
Software & Services 5.19<br />
Insurance 3.00<br />
GEOGRAPHIC BREAKDOWN<br />
Europe 33.56%<br />
Asia 27.05<br />
North America 24.85<br />
Latin America/Caribbean 5.03<br />
Australia/New Zealand 1.65<br />
Mid-East/Africa 0.73<br />
TOP 10 HOLDINGS 7<br />
China Resources Power Company Ltd. 2.56%<br />
Petroleo Brasileiro SA (Petrobras) 2.53<br />
Amgen Inc. 2.26<br />
BYD Company Ltd. 1.97<br />
Telefonica SA 1.85<br />
Accenture Ltd. 1.75<br />
Inspur International Ltd. 1.73<br />
Sanofi-Aventis 1.68<br />
Watson Pharmaceuticals Inc. 1.67<br />
Roche Holding AG 1.59<br />
ANNUAL TOTAL RETURN 5 –CLASS A<br />
WITHOUT SALES CHARGES<br />
27.87%<br />
0<br />
12.63%<br />
17.44%<br />
-42.54%<br />
2005 2006 2007 2008<br />
10.51%<br />
YTD 2009 14<br />
6/30/09<br />
PERFORMANCE INFORMATION<br />
ANNUAL TOTAL RETURN–WITHOUT SALES CHARGES5 1999 2000 2001 2002 2003 2004 2005 2006 2007 2008<br />
YTD<br />
200914 CLASS A<br />
CLASS C<br />
ADVISOR43 27.17 -3.16 -8.97 -21.79 36.74 16.55 12.63 27.87 17.44 -42.54 10.51<br />
26.28 -3.83 -9.68 -22.33 35.58 15.74 11.79 26.86 16.60 -42.96 10.05<br />
27.17 -3.16 -8.97 -21.79 36.74 16.55 12.63 27.87 17.44 -42.54 10.51<br />
AVERAGE ANNUAL TOTAL RETURN – AVERAGE ANNUAL TOTAL RETURN–<br />
WITHOUT SALES CHARGES5 6, 21<br />
WITH SALES CHARGES<br />
1 YR 3 YR 5 YR 10 YR INCEPTION 1 YR 3 YR 5 YR 10 YR INCEPTION<br />
CLASS A<br />
CLASS C<br />
ADVISOR43 -27.09 -4.22 3.76 3.12 7.63 -31.28 -6.10 2.54 2.51 7.30<br />
-27.65 -4.94 2.98 2.35 5.25 -28.35 -4.94 2.98 2.35 5.25<br />
-27.09 -4.22 3.76 3.12 7.63 -27.09 -4.22 3.76 3.12 7.63<br />
Advisor Class shares are offered only to certain eligible investors as stated in the prospectus.<br />
HYPOTHETICAL INVESTMENT 22<br />
CLASS A CLASS C ADVISOR43 $10,000 from Inception $39,071 $20,637 $41,440<br />
FUND FACTS<br />
Net Assets (millions)<br />
Expense Ratio2 Net Asset Value<br />
Public Offering Price<br />
ASSET ALLOCATION 29, 60 6/30<br />
Stocks 93%<br />
Cash 7%<br />
CLASS A CLASS C ADVISOR<br />
$722.8 $34.2 $0.4<br />
1.34% 2.08% 1.09%<br />
$14.30 $14.02 $14.30<br />
$15.17 $14.02 $14.30<br />
0.99 0.99 —<br />
23.41 23.41 —<br />
DEALER USE ONLY/NOT FOR DISTRIBUTION TO THE PUBLIC Go to franklintempleton.com or call (800) 223-2141 <strong>Dealer</strong> <strong>Facts</strong> <strong>Guide</strong> 41<br />
Beta 3<br />
Standard Deviation 65<br />
FUND DISTRIBUTIONS<br />
Dividend Frequency<br />
Annually in September and if necessary, December.<br />
CLASS A CLASS C ADVISOR<br />
Dividend History 30<br />
12/08<br />
9/08<br />
12/07<br />
Capital Gains (last 12 mos.) 30<br />
$0.2484 $0.1390 —<br />
— — —<br />
0.2246 0.0881 —<br />
Short-Term<br />
0.2894 0.2894 —<br />
Long-Term<br />
0.2041 0.2041 —<br />
OPEN-END FUNDS VALUE BLEND GROWTH SECTOR GLOBAL INTERNATIONAL HYBRID ASSET ALLOCATION FIXED INCOME TAX-FREE INCOME
OPEN-END FUNDS<br />
VALUE<br />
BLEND<br />
GROWTH<br />
SECTOR<br />
GLOBAL<br />
INTERNATIONAL<br />
HYBRID<br />
ASSET ALLOCATION<br />
FIXED INCOME<br />
TAX-FREE INCOME<br />
<strong>Templeton</strong> Global Smaller Companies Fund<br />
TM 67<br />
MORNINGSTAR STYLE BOX<br />
STYLE<br />
Value Blend Growth<br />
SIZE<br />
Large<br />
✕<br />
Medium<br />
Small<br />
MAXIMUM SALES CHARGE & COMMISSION<br />
CLASS A CLASS C 73<br />
Sales Charge 5.75% 0.00%<br />
<strong>Dealer</strong> Concession 5.00 1.00<br />
12b-1 Fee to <strong>Dealer</strong> 0.25 1.00<br />
ADVISOR 89<br />
Sales Charge 0.00%<br />
<strong>Dealer</strong> Concession 0.00<br />
12b-1 Fee to <strong>Dealer</strong> 0.00<br />
✕ Current<br />
Historical<br />
INVESTMENT CATEGORY<br />
Global<br />
PRIMARY INVESTMENT 37<br />
Stocks of smaller companies of<br />
any nation.<br />
FUND REFERENCE<br />
CLASS A CLASS C<br />
Fund No. 103 203<br />
CUSIP 880 22L 102 880 22L 201<br />
Symbol TEMGX TESGX<br />
Inception1 6/1/81 5/1/95<br />
ADVISOR 89<br />
Fund No. 603<br />
CUSIP 880 22L 300<br />
Symbol TGSAX<br />
Inception 1 6/1/81<br />
ANNUAL PROSPECTUS UPDATE AVAILABLE:<br />
January 1<br />
PORTFOLIO MANAGER PROFILE84 Bradley Radin, CFA<br />
Joined <strong>Franklin</strong> <strong>Templeton</strong> in 1995<br />
Managed Fund since 2007<br />
Harlan Hodes, CPA<br />
Joined <strong>Franklin</strong> <strong>Templeton</strong> in 2001<br />
Managed Fund since 2007<br />
See page 128 for more commission<br />
information and page 125 for footnotes.<br />
PORTFOLIO HOLDINGS 29 6/30<br />
Total Number of Positions 102<br />
INDUSTRY BREAKDOWN<br />
Consumer Durables & Apparel 20.66%<br />
Retailing 12.31<br />
Banks 8.69<br />
Technology Hardware & Equipment 8.55<br />
Diversified Financials 7.94<br />
Capital Goods 7.02<br />
Commercial & Professional Services 5.37<br />
Materials 4.66<br />
Transportation 2.84<br />
Consumer Services 2.75<br />
GEOGRAPHIC BREAKDOWN<br />
Asia 39.12%<br />
North America 26.95<br />
Europe 23.82<br />
Australia/New Zealand 6.10<br />
Latin America/Caribbean 1.24<br />
TOP 10 HOLDINGS 7<br />
Tempur-Pedic International Inc. 3.07%<br />
Chico’s FAS Inc. 3.03<br />
Legg Mason Inc. 2.35<br />
Dah Sing Financial Holdings Ltd. 2.31<br />
Barco NV 2.04<br />
Sinotrans Ltd. 2.01<br />
Sealy Corp. 2.00<br />
Hibbett Sports Inc. 1.98<br />
Bank of Ayudhya Public Company Ltd. 1.94<br />
Glow Energy Public Company Ltd. 1.93<br />
ANNUAL TOTAL RETURN 5 –CLASS A<br />
WITHOUT SALES CHARGES<br />
0<br />
7.70%<br />
24.30%<br />
0.93%<br />
-50.28%<br />
2005 2006 2007 2008<br />
28.57%<br />
YTD 2009 14<br />
6/30/09<br />
PERFORMANCE INFORMATION<br />
ANNUAL TOTAL RETURN–WITHOUT SALES CHARGES5 1999 2000 2001 2002 2003 2004 2005 2006 2007 2008<br />
YTD<br />
200914 CLASS A<br />
CLASS C<br />
ADVISOR43 10.11 -8.38 -1.71 -8.79 53.36 26.27 7.70 24.30 0.93 -50.28 28.57<br />
9.19 -8.94 -2.55 -9.36 52.22 25.27 6.78 23.62 0.02 -50.63 27.99<br />
10.35 -8.04 -1.55 -8.51 53.95 26.43 7.98 24.66 1.16 -50.05 28.49<br />
AVERAGE ANNUAL TOTAL RETURN – AVERAGE ANNUAL TOTAL RETURN–<br />
WITHOUT SALES CHARGES5 6, 21<br />
WITH SALES CHARGES<br />
1 YR 3 YR 5 YR 10 YR INCEPTION 1 YR 3 YR 5 YR 10 YR INCEPTION<br />
CLASS A<br />
CLASS C<br />
ADVISOR43 -26.33 -9.19 0.34 3.66 9.39 -30.56 -10.95 -0.84 3.05 9.15<br />
-27.00 -9.88 -0.44 2.89 4.02 -27.63 -9.88 -0.44 2.89 4.02<br />
-26.17 -8.94 0.58 3.93 9.53 -26.17 -8.94 0.58 3.93 9.53<br />
Advisor Class shares are only offered to certain eligible investors as stated in the prospectus.<br />
HYPOTHETICAL INVESTMENT 22<br />
CLASS A CLASS C ADVISOR43 $10,000 from Inception $117,011 $17,486 $128,820<br />
FUND FACTS<br />
Net Assets (millions)<br />
Expense Ratio2 Net Asset Value<br />
Public Offering Price<br />
Beta 3<br />
Standard Deviation 65<br />
FUND DISTRIBUTIONS<br />
Dividend Frequency<br />
Annually in December.<br />
Dividend History 30<br />
12/08<br />
12/07<br />
10/07<br />
Capital Gains (last 12 mos.) 30<br />
Short-Term<br />
Long-Term<br />
ASSET ALLOCATION 29, 60 6/30<br />
Stocks 97%<br />
Cash 3%<br />
CLASS A CLASS C ADVISOR<br />
$599.9 $27.7 $116.7<br />
1.35% 2.09% 1.12%<br />
$4.50 $4.39 $4.51<br />
$4.77 $4.39 $4.51<br />
1.13 1.13 1.13<br />
30.34 30.29 30.38<br />
CLASS A CLASS C ADVISOR<br />
$0.0853 $0.0227 $0.1019<br />
— — —<br />
0.0983 0.0312 0.1216<br />
— — —<br />
0.5427 0.5427 0.5427<br />
42 <strong>Dealer</strong> <strong>Facts</strong> <strong>Guide</strong> Go to franklintempleton.com or call (800) 223-2141 DEALER USE ONLY/NOT FOR DISTRIBUTION TO THE PUBLIC
<strong>Templeton</strong> Growth Fund<br />
TM 67<br />
MORNINGSTAR STYLE BOX<br />
STYLE<br />
Value Blend Growth<br />
SIZE<br />
✕<br />
Large<br />
Medium<br />
Small<br />
✕ Current<br />
Historical<br />
INVESTMENT CATEGORY<br />
Global<br />
PRIMARY INVESTMENT 37<br />
Equity securities of companies of<br />
any nation.<br />
FUND REFERENCE<br />
CLASS A CLASS C<br />
Fund No. 101 201<br />
CUSIP 880 199 104 880 199 203<br />
Symbol TEPLX TEGTX<br />
Inception1 11/29/54 5/1/95<br />
CLASS R ADVISOR89 Fund No. 801 601<br />
CUSIP 880 199 500 880 199 302<br />
Symbol TEGRX TGADX<br />
Inception1 11/29/54 11/29/54<br />
ANNUAL PROSPECTUS UPDATE AVAILABLE:<br />
January 1<br />
PORTFOLIO MANAGER PROFILE84 Cindy L. Sweeting, CFA<br />
Joined <strong>Franklin</strong> <strong>Templeton</strong> in 1997<br />
Managed Fund since 2007<br />
Lisa F. Myers, CFA<br />
Joined <strong>Franklin</strong> <strong>Templeton</strong> in 1996<br />
Managed Fund since 2003<br />
Tucker Scott, CFA<br />
Joined <strong>Franklin</strong> <strong>Templeton</strong> in 1996<br />
Managed Fund since 2007<br />
MAXIMUM SALES CHARGE & COMMISSION<br />
CLASS A CLASS C73 Sales Charge 5.75% 0.00%<br />
<strong>Dealer</strong> Concession 5.00 1.00<br />
12b-1 Fee to <strong>Dealer</strong> 0.25 1.00<br />
CLASS R ADVISOR89 Sales Charge 0.00% 0.00%<br />
<strong>Dealer</strong> Concession 0.00 0.00<br />
12b-1 Fee to <strong>Dealer</strong> 0.50 0.00<br />
See page 128 for more commission<br />
information and page 125 for footnotes.<br />
PORTFOLIO HOLDINGS 29 6/30<br />
Total Number of Positions 107<br />
INDUSTRY BREAKDOWN<br />
Pharmaceuticals, Biotechnology<br />
& Life Sciences 13.96%<br />
Software & Services 10.43<br />
Energy 10.11<br />
Media 9.63<br />
Telecommunication Services 9.09<br />
Capital Goods 5.27<br />
Technology Hardware & Equipment 4.98<br />
Insurance 3.97<br />
Banks 3.97<br />
Automobiles & Components 3.86<br />
GEOGRAPHIC BREAKDOWN<br />
Europe 44.13%<br />
North America 40.15<br />
Asia 12.39<br />
Latin America/Caribbean 0.39<br />
Australia/New Zealand 0.31<br />
TOP 10 HOLDINGS7 Microsoft Corp. 3.41%<br />
Oracle Corp. 3.26<br />
Accenture Ltd. 2.76<br />
Amgen Inc. 2.62<br />
Pfizer Inc. 2.55<br />
Siemens AG 2.02<br />
Vodafone Group PLC 2.02<br />
GlaxoSmithKline PLC 1.99<br />
BP PLC 1.94<br />
Total SA 1.91<br />
ANNUAL TOTAL RETURN 5 –CLASS A<br />
WITHOUT SALES CHARGES<br />
21.81%<br />
0<br />
8.15%<br />
2.19%<br />
-43.47%<br />
2005 2006 2007 2008<br />
HYPOTHETICAL INVESTMENT 22<br />
$10,000 from Inception<br />
FUND FACTS<br />
Net Assets (millions)<br />
Expense Ratio 2<br />
Net Asset Value<br />
Public Offering Price<br />
Beta 3<br />
Standard Deviation 65<br />
FUND DISTRIBUTIONS<br />
Dividend Frequency<br />
Annually in December.<br />
Dividend History 30<br />
12/08<br />
12/07<br />
10/07<br />
Capital Gains (last 12 mos.) 30<br />
Short-Term<br />
Long-Term<br />
4.90%<br />
YTD 2009 14<br />
6/30/09<br />
PERFORMANCE INFORMATION<br />
ANNUAL TOTAL RETURN–WITHOUT SALES CHARGES5 1999 2000 2001 2002 2003 2004 2005 2006 2007 2008<br />
YTD<br />
200914 CLASS A<br />
CLASS C<br />
ADVISOR43 30.44 1.74 0.54 -9.48 32.85 17.00 8.15 21.81 2.19 -43.47 4.90<br />
29.45 0.96 -0.18 -10.17 31.86 16.15 7.34 20.94 1.40 -43.88 4.46<br />
30.85 1.96 0.86 -9.28 33.15 17.28 8.45 22.12 2.44 -43.32 4.98<br />
AVERAGE ANNUAL TOTAL RETURN – AVERAGE ANNUAL TOTAL RETURN–<br />
WITHOUT SALES CHARGES5 6, 21<br />
WITH SALES CHARGES<br />
1 YR 3 YR 5 YR 10 YR INCEPTION 1 YR 3 YR 5 YR 10 YR INCEPTION<br />
CLASS A<br />
CLASS C<br />
ADVISOR43 -29.96 -11.48 -2.23 2.29 12.34 -33.98 -13.21 -3.38 1.68 12.22<br />
-30.52 -12.14 -2.96 1.53 5.19 -31.20 -12.14 -2.96 1.53 5.19<br />
-29.84 -11.26 -1.99 2.54 12.42 -29.84 -11.26 -1.99 2.54 12.42<br />
Advisor Class shares are only offered to certain eligible investors as stated in the prospectus.<br />
CLASS A CLASS C ADVISOR43 $5,395,852 $20,470 $5,956,859<br />
CLASS A CLASS C ADVISOR<br />
$11,955.5 $983.6 $3,013.8<br />
1.03% 1.77% 0.78%<br />
$13.69 $13.34 $13.69<br />
$14.53 $13.34 $13.69<br />
0.98 0.98 0.98<br />
22.81 22.79 22.77<br />
CLASS A CLASS C ADVISOR<br />
$0.5363 $0.3715 $0.5906<br />
0.0621 0.0017 0.0831<br />
0.3104 0.1824 0.3551<br />
— — —<br />
— — —<br />
ASSET ALLOCATION 29, 60 6/30<br />
Stocks 97%<br />
Cash 2%<br />
DEALER USE ONLY/NOT FOR DISTRIBUTION TO THE PUBLIC Go to franklintempleton.com or call (800) 223-2141 <strong>Dealer</strong> <strong>Facts</strong> <strong>Guide</strong> 43<br />
OPEN-END FUNDS VALUE BLEND GROWTH SECTOR GLOBAL INTERNATIONAL HYBRID ASSET ALLOCATION FIXED INCOME TAX-FREE INCOME
OPEN-END FUNDS<br />
VALUE<br />
BLEND<br />
GROWTH<br />
SECTOR<br />
GLOBAL<br />
INTERNATIONAL<br />
HYBRID<br />
ASSET ALLOCATION<br />
FIXED INCOME<br />
TAX-FREE INCOME<br />
<strong>Templeton</strong> World Fund<br />
OVERALL MORNINGSTAR RATING TM<br />
CLASS A 8<br />
★★★★<br />
MORNINGSTAR STYLE BOX<br />
STYLE<br />
Value Blend Growth<br />
SIZE<br />
✕ Large<br />
Medium<br />
Small<br />
INVESTMENT CATEGORY<br />
Global<br />
PRIMARY INVESTMENT 37<br />
Equity securities of companies of<br />
any nation.<br />
FUND REFERENCE<br />
CLASS A CLASS C<br />
Fund No. 102 202<br />
CUSIP 880 196 100 880 196 308<br />
Symbol TEMWX TEWTX<br />
Inception1 1/17/78 5/1/95<br />
ADVISOR 89<br />
Fund No. 602<br />
CUSIP 880 196 886<br />
Symbol TWDAX<br />
Inception 1 1/17/78<br />
✕ Current<br />
Historical<br />
TM 67<br />
ANNUAL PROSPECTUS UPDATE AVAILABLE:<br />
January 1<br />
PORTFOLIO MANAGER PROFILE84 Cindy L. Sweeting, CFA<br />
Joined <strong>Franklin</strong> <strong>Templeton</strong> in 1997<br />
Managed Fund since 2007<br />
Lisa F. Myers, CFA<br />
Joined <strong>Franklin</strong> <strong>Templeton</strong> in 1996<br />
Managed Fund since 2003<br />
Tucker Scott, CFA<br />
Joined <strong>Franklin</strong> <strong>Templeton</strong> in 1996<br />
Managed Fund since 2007<br />
MAXIMUM SALES CHARGE & COMMISSION<br />
CLASS A CLASS C73 Sales Charge 5.75% 0.00%<br />
<strong>Dealer</strong> Concession 5.00 1.00<br />
12b-1 Fee to <strong>Dealer</strong> 0.25 1.00<br />
ADVISOR89 Sales Charge 0.00%<br />
<strong>Dealer</strong> Concession 0.00<br />
12b-1 Fee to <strong>Dealer</strong> 0.00<br />
See page 128 for more commission<br />
information and page 125 for footnotes.<br />
PORTFOLIO HOLDINGS 29 6/30<br />
Total Number of Positions 97<br />
INDUSTRY BREAKDOWN<br />
Pharmaceuticals, Biotechnology<br />
& Life Sciences 14.30%<br />
Software & Services 11.74<br />
Energy 10.70<br />
Telecommunication Services 10.53<br />
Media 7.73<br />
Capital Goods<br />
Semiconductors & Semiconductor<br />
5.92<br />
Equipment 4.32<br />
Diversified Financials 3.40<br />
Retailing 3.10<br />
Technology Hardware & Equipment 3.08<br />
GEOGRAPHIC BREAKDOWN<br />
North America 37.60%<br />
Europe 33.03<br />
Asia 21.70<br />
Latin America/Caribbean 2.09<br />
Mid-East/Africa 1.63<br />
Australia/New Zealand 0.06<br />
TOP 10 HOLDINGS7 Microsoft Corp. 4.10%<br />
Accenture Ltd. 2.67<br />
Oracle Corp.<br />
Taiwan Semiconductor<br />
2.41<br />
Manufacturing Company Ltd. 2.31<br />
Amgen Inc. 2.20<br />
Cheung Kong Holdings Ltd. 2.09<br />
Samsung Electronics Company Ltd. 2.01<br />
Sanofi-Aventis 1.99<br />
UPS Inc. 1.89<br />
Telefonica SA 1.85<br />
ANNUAL TOTAL RETURN 5 –CLASS A<br />
WITHOUT SALES CHARGES<br />
0<br />
11.67%<br />
20.89%<br />
HYPOTHETICAL INVESTMENT 22<br />
$10,000 from Inception<br />
FUND FACTS<br />
Net Assets (millions)<br />
Expense Ratio 2<br />
Net Asset Value<br />
Public Offering Price<br />
Beta 3<br />
8.49% 6.99%<br />
-39.52%<br />
2005 2006 2007 2008<br />
Standard Deviation 65<br />
FUND DISTRIBUTIONS<br />
Dividend Frequency<br />
Annually in December.<br />
Dividend History 30<br />
12/08<br />
12/07<br />
10/07<br />
Capital Gains (last 12 mos.) 30<br />
Short-Term<br />
Long-Term<br />
YTD 2009 14<br />
6/30/09<br />
PERFORMANCE INFORMATION<br />
ANNUAL TOTAL RETURN–WITHOUT SALES CHARGES5 1999 2000 2001 2002 2003 2004 2005 2006 2007 2008<br />
YTD<br />
200914 CLASS A<br />
CLASS C<br />
ADVISOR43 28.12 -3.99 -8.10 -12.15 33.38 15.63 11.67 20.89 8.49 -39.52 6.99<br />
27.16 -4.68 -8.83 -12.79 32.41 14.79 10.79 19.98 7.73 -39.98 6.61<br />
28.12 -3.99 -8.10 -12.15 33.38 15.63 11.67 21.11 8.75 -39.38 7.19<br />
AVERAGE ANNUAL TOTAL RETURN – AVERAGE ANNUAL TOTAL RETURN–<br />
WITHOUT SALES CHARGES5 6, 21<br />
WITH SALES CHARGES<br />
1 YR 3 YR 5 YR 10 YR INCEPTION 1 YR 3 YR 5 YR 10 YR INCEPTION<br />
CLASS A<br />
CLASS C<br />
ADVISOR43 -25.00 -7.07 1.27 2.31 11.68 -29.31 -8.88 0.07 1.70 11.47<br />
-25.53 -7.76 0.51 1.54 5.87 -26.24 -7.76 0.51 1.54 5.87<br />
-24.78 -6.83 1.43 2.39 11.71 -24.78 -6.83 1.43 2.39 11.71<br />
Advisor Class shares are only offered to certain eligible investors as stated in the prospectus.<br />
CLASS A CLASS C ADVISOR43 $304,195 $22,431 $325,441<br />
CLASS A CLASS C ADVISOR<br />
$4,930.1 $214.4 $141.5<br />
1.05% 1.80% 0.81%<br />
$11.48 $11.13 $11.48<br />
$12.18 $11.13 $11.48<br />
0.95 0.95 0.95<br />
21.19 21.19 21.16<br />
CLASS A CLASS C ADVISOR<br />
$0.3006 $0.1742 $0.3401<br />
0.0799 0.0331 0.0945<br />
0.2446 0.1449 0.2778<br />
— — —<br />
0.3343 0.3343 0.3343<br />
ASSET ALLOCATION 29, 60 6/30<br />
Stocks 96%<br />
Cash 3%<br />
Bonds 1%<br />
44 <strong>Dealer</strong> <strong>Facts</strong> <strong>Guide</strong> Go to franklintempleton.com or call (800) 223-2141 DEALER USE ONLY/NOT FOR DISTRIBUTION TO THE PUBLIC
<strong>Franklin</strong> India Growth Fund<br />
OVERALL MORNINGSTAR<br />
RATING TM – CLASS A 8<br />
INVESTMENT CATEGORY<br />
International<br />
PRIMARY INVESTMENT 37<br />
<strong>Franklin</strong> India Growth Fund seeks<br />
long-term capital appreciation by<br />
investing primarily in equity<br />
securities of companies based<br />
in India, companies that derive<br />
a majority of their revenues or<br />
profits from the Indian economy,<br />
or companies with a majority of<br />
their assets in India.<br />
FUND REFERENCE<br />
CLASS A CLASS C<br />
Fund No. 141 241<br />
CUSIP 353 61F 857 353 61F 840<br />
Symbol — —<br />
Inception1 1/31/08 1/31/08<br />
ADVISOR 89<br />
Fund No. 644<br />
CUSIP 353 61F 832<br />
Symbol FIGZX<br />
Inception 1 1/31/08<br />
ANNUAL PROSPECTUS UPDATE AVAILABLE:<br />
March 1<br />
PORTFOLIO MANAGER PROFILE84 Stephen H. Dover, CFA<br />
Joined <strong>Franklin</strong> <strong>Templeton</strong> in 1997<br />
Managed Fund since 2008<br />
Purav A. Jhaveri, CFA, FRM<br />
Joined <strong>Franklin</strong> <strong>Templeton</strong> in 2000<br />
Managed Fund since 2008<br />
MAXIMUM SALES CHARGE & COMMISSION<br />
CLASS A CLASS C73 Sales Charge 5.75% 0.00%<br />
<strong>Dealer</strong> Concession 5.00 1.00<br />
12b-1 Fee to <strong>Dealer</strong> 0.25 1.00<br />
ADVISOR89 Sales Charge 0.00%<br />
<strong>Dealer</strong> Concession 0.00<br />
12b-1 Fee to <strong>Dealer</strong> 0.00<br />
See page 128 for more commission<br />
information and page 125 for footnotes.<br />
PERFORMANCE INFORMATION<br />
5, 9<br />
ANNUAL TOTAL RETURN–WITHOUT SALES CHARGES<br />
1999 2000 2001 2002 2003 2004 2005 2006 2007 2008<br />
YTD<br />
200914 CLASS A — — — — — — — — — — 44.11<br />
CLASS C — — — — — — — — — — 43.57<br />
ADVISOR — — — — — — — — — — 44.42<br />
AVERAGE ANNUAL TOTAL RETURN – AVERAGE ANNUAL TOTAL RETURN–<br />
WITHOUT SALES CHARGES5, 9 6, 9<br />
WITH SALES CHARGES<br />
CLASS A<br />
CLASS C<br />
ADVISOR<br />
1 YR 3 YR 5 YR 10 YR INCEPTION 1 YR 3 YR 5 YR 10 YR INCEPTION<br />
3.59 — — — -20.58 -2.43 — — — -23.84<br />
2.88 — — — -21.12 1.88 — — — -21.12<br />
3.89 — — — -20.33 3.89 — — — -20.33<br />
Advisor Class shares are only offered to certain eligible investors as stated in the prospectus.<br />
PORTFOLIO HOLDINGS 29 6/30<br />
Total Number of Positions 49<br />
PORTFOLIO BREAKDOWN<br />
Banks 20.47%<br />
Energy 12.99<br />
Capital Goods 12.65<br />
Diversified Financials 7.70<br />
Materials 7.50<br />
Software & Services 6.64<br />
Telecommunication Services 5.51<br />
Food, Beverage & Tobacco 5.44<br />
Household & Personal Products<br />
Pharmaceuticals, Biotechnology &<br />
5.25<br />
Life Sciences 4.47<br />
TOP 10 HOLDINGS7 Reliance Industries Ltd. 7.16%<br />
Infosys Technologies Ltd. 5.31<br />
HDFC Bank Ltd. 5.21<br />
Kotak Mahindra Bank Ltd.<br />
Housing Development Finance<br />
4.97<br />
Corporation Ltd. 4.72<br />
Nestle India Ltd. 4.34<br />
Bharti Airtel Ltd. 3.98<br />
Icici Bank Ltd. 3.36<br />
Hindustan Unilever Ltd. 3.12<br />
Asian Paints Ltd. 2.60<br />
ANNUAL TOTAL RETURN 5, 9 –CLASS A<br />
WITHOUT SALES CHARGES<br />
0<br />
2005 2006 2007 2008<br />
6/30/09<br />
9, 22<br />
HYPOTHETICAL INVESTMENT<br />
CLASS A CLASS C ADVISOR<br />
$10,000 from Inception $6,805 $7,150 $7,252<br />
44.11%<br />
FUND FACTS<br />
Net Assets (millions)<br />
2, 9<br />
Expense Ratio<br />
without waiver<br />
with waiver<br />
Net Asset Value<br />
Public Offering Price<br />
Beta 3<br />
Standard Deviation 65<br />
FUND DISTRIBUTIONS<br />
Dividend Frequency<br />
Annually in December.<br />
Dividend History 30<br />
12/08<br />
Capital Gains (last 12 mos.) 30<br />
Short-Term<br />
Long-Term<br />
YTD 2009 14<br />
ASSET ALLOCATION 29, 60 6/30<br />
Stocks 93%<br />
Cash 7%<br />
CLASS A CLASS C ADVISOR<br />
$7.2 $2.1 $45.0<br />
2.78% 3.48% 2.48%<br />
1.70% 2.40% 1.40%<br />
$7.22 $7.15 $7.25<br />
$7.66 $7.15 $7.25<br />
— — —<br />
— — —<br />
CLASS A CLASS C ADVISOR<br />
— — $0.0013<br />
— — —<br />
— — —<br />
DEALER USE ONLY/NOT FOR DISTRIBUTION TO THE PUBLIC Go to franklintempleton.com or call (800) 223-2141 <strong>Dealer</strong> <strong>Facts</strong> <strong>Guide</strong> 45<br />
OPEN-END FUNDS VALUE BLEND GROWTH SECTOR GLOBAL INTERNATIONAL HYBRID ASSET ALLOCATION FIXED INCOME TAX-FREE INCOME
OPEN-END FUNDS<br />
VALUE<br />
BLEND<br />
GROWTH<br />
SECTOR<br />
GLOBAL<br />
INTERNATIONAL<br />
HYBRID<br />
ASSET ALLOCATION<br />
FIXED INCOME<br />
TAX-FREE INCOME<br />
<strong>Franklin</strong> International Growth Fund<br />
OVERALL MORNINGSTAR<br />
RATING TM – CLASS A 8<br />
INVESTMENT CATEGORY<br />
International<br />
PRIMARY INVESTMENT 37<br />
Predominantly in mid- and largecapitalization<br />
companies outside the<br />
U.S. with strong growth potential.<br />
FUND REFERENCE<br />
CLASS A CLASS C<br />
Fund No. 429 248<br />
CUSIP 353 533 730 353 533 722<br />
Symbol — —<br />
Inception1 6/3/08 6/3/08<br />
CLASS R ADVISOR89 Fund No. 868 649<br />
CUSIP 353 533 714 353 533 698<br />
Symbol — —<br />
Inception1 6/3/08 6/3/08<br />
ANNUAL PROSPECTUS UPDATE AVAILABLE:<br />
December 1<br />
PORTFOLIO MANAGER PROFILE84 Coleen F. Barbeau<br />
Joined <strong>Franklin</strong> <strong>Templeton</strong> in 1983<br />
Managed Fund since 2008<br />
M. Par Rostom, CFA<br />
Joined <strong>Franklin</strong> <strong>Templeton</strong> in 2005<br />
Managed Fund since 2008<br />
John P. Remmert<br />
Joined <strong>Franklin</strong> <strong>Templeton</strong> in 2001<br />
Managed Fund since 2008<br />
MAXIMUM SALES CHARGE & COMMISSION<br />
CLASS A CLASS C73 Sales Charge 5.75% 0.00%<br />
<strong>Dealer</strong> Concession 5.00 1.00<br />
12b-1 Fee to <strong>Dealer</strong> 0.25 1.00<br />
CLASS R ADVISOR89 Sales Charge 0.00% 0.00%<br />
<strong>Dealer</strong> Concession 0.00 0.00<br />
12b-1 Fee to <strong>Dealer</strong> 0.50 0.00<br />
See page 128 for more commission<br />
information and page 125 for footnotes.<br />
PERFORMANCE INFORMATION<br />
5, 9<br />
ANNUAL TOTAL RETURN–WITHOUT SALES CHARGES<br />
1999 2000 2001 2002 2003 2004 2005 2006 2007 2008<br />
YTD<br />
200914 CLASS A — — — — — — — — — — 25.41<br />
CLASS C — — — — — — — — — — 24.91<br />
ADVISOR — — — — — — — — — — 25.59<br />
AVERAGE ANNUAL TOTAL RETURN – AVERAGE ANNUAL TOTAL RETURN–<br />
WITHOUT SALES CHARGES5, 9 6, 9<br />
WITH SALES CHARGES<br />
1 YR 3 YR 5 YR 10 YR INCEPTION 1 YR 3 YR 5 YR 10 YR INCEPTION<br />
CLASS A -24.13 — — — -29.32 -28.47 — — — -33.11<br />
CLASS C -24.61 — — — -29.81 -25.36 — — — -29.81<br />
ADVISOR -23.86 — — — -29.08 -23.86 — — — -29.08<br />
Advisor Class shares are only offered to certain eligible investors as stated in the prospectus.<br />
PORTFOLIO HOLDINGS 29 6/30<br />
Total Number of Positions 41<br />
PORTFOLIO BREAKDOWN<br />
Health Care Equipment & Services 9.37%<br />
Capital Goods<br />
Pharmaceuticals, Biotechnology &<br />
8.66<br />
Life Sciences 8.11<br />
Diversified Financials 7.63<br />
Energy 7.63<br />
Consumer Durables & Apparel 6.45<br />
Real Estate 5.12<br />
Retailing 4.64<br />
Food & Staples Retailing 4.63<br />
Media 4.50<br />
TOP 5 COUNTRIES<br />
United Kingdom 18.28%<br />
Australia 15.95<br />
Hong Kong 13.34<br />
Switzerland 8.68<br />
Germany 5.30<br />
TOP 10 HOLDINGS<br />
Noble Group Ltd. 3.58%<br />
CSL Ltd. 3.40<br />
National Bank of Greece SA 3.02<br />
Deutsche Boerse AG 2.76<br />
Macquarie Group Ltd. 2.71<br />
Qiagen NV 2.69<br />
WorleyParsons Ltd. 2.65<br />
Hang Lung Properties Ltd. 2.60<br />
Li & Fung Ltd. 2.55<br />
ARM Holdings PLC 2.54<br />
ANNUAL TOTAL RETURN 5, 9 –CLASS A<br />
WITHOUT SALES CHARGES<br />
0<br />
2005 2006 2007 2008<br />
25.41%<br />
YTD 2009 14<br />
6/30/09<br />
9, 22<br />
HYPOTHETICAL INVESTMENT<br />
CLASS A CLASS C ADVISOR<br />
$10,000 from Inception $6,493 $6,838 $6,914<br />
FUND FACTS<br />
Net Assets (millions)<br />
2, 9<br />
Expense Ratio<br />
without waiver<br />
with waiver<br />
Net Asset Value<br />
Public Offering Price<br />
Beta 3<br />
Standard Deviation 65<br />
FUND DISTRIBUTIONS<br />
Dividend Frequency<br />
Annually in December.<br />
Dividend History 30<br />
12/08<br />
Capital Gains (last 12 mos.) 30<br />
Short-Term<br />
Long-Term<br />
CLASS A CLASS C ADVISOR<br />
$4.8 $0.4 $1.5<br />
CLASS A CLASS C ADVISOR<br />
ASSET ALLOCATION 29, 60 6/30<br />
Stocks 92%<br />
Cash 8%<br />
1.86% 2.51% 1.51%<br />
1.50% 2.15% 1.15%<br />
$6.86 $6.82 $6.87<br />
$7.28 $6.82 $6.87<br />
— — —<br />
— — —<br />
$0.0226 $0.0140 $0.0342<br />
— — —<br />
— — —<br />
46 <strong>Dealer</strong> <strong>Facts</strong> <strong>Guide</strong> Go to franklintempleton.com or call (800) 223-2141 DEALER USE ONLY/NOT FOR DISTRIBUTION TO THE PUBLIC
<strong>Franklin</strong> International Small Cap Growth Fund<br />
OVERALL MORNINGSTAR RATING TM<br />
CLASS A 8<br />
★★★★★<br />
MORNINGSTAR STYLE BOX<br />
STYLE<br />
Value Blend Growth<br />
SIZE<br />
Large<br />
✕ Medium<br />
Small<br />
✕ Current<br />
Historical<br />
INVESTMENT CATEGORY<br />
International<br />
TM 67<br />
PRIMARY INVESTMENT 37<br />
Predominantly in equity securities<br />
of smaller international companies<br />
that the managers feel are poised<br />
for long-term dynamic growth.<br />
FUND REFERENCE<br />
CLASS A CLASS C<br />
Fund No. 195 257<br />
CUSIP 353 533 763 353 533 755<br />
Symbol — —<br />
Inception1 10/15/02 10/15/02<br />
CLASS R ADVISOR89 Fund No. 857 681<br />
CUSIP 353 533 748 353 533 888<br />
Symbol — FKSCX<br />
Inception1 10/15/02 10/15/02<br />
ANNUAL PROSPECTUS UPDATE AVAILABLE:<br />
December 1<br />
PORTFOLIO MANAGER PROFILE84 Edwin Lugo II, CFA<br />
Joined <strong>Franklin</strong> <strong>Templeton</strong> in 2006<br />
Managed Fund since 2006<br />
David Glazer, CFA<br />
Joined <strong>Franklin</strong> <strong>Templeton</strong> in 2005<br />
Managed Fund since 2007<br />
MAXIMUM SALES CHARGE & COMMISSION<br />
CLASS A CLASS C73 Sales Charge 5.75% 0.00%<br />
<strong>Dealer</strong> Concession 5.00 1.00<br />
12b-1 Fee to <strong>Dealer</strong> 0.25 1.00<br />
CLASS R ADVISOR89 Sales Charge 0.00% 0.00%<br />
<strong>Dealer</strong> Concession 0.00 0.00<br />
12b-1 Fee to <strong>Dealer</strong> 0.50 0.00<br />
See page 127 for more commission<br />
information and page 124 for footnotes.<br />
PERFORMANCE INFORMATION<br />
5, 9<br />
ANNUAL TOTAL RETURN–WITHOUT SALES CHARGES<br />
1999 2000 2001 2002 2003 2004 2005 2006 2007 2008<br />
YTD<br />
200914 CLASS A — — — — 52.81 23.71 43.34 24.54 8.06 -37.41 25.49<br />
CLASS C — — — — 51.72 22.64 42.31 23.69 7.28 -37.68 25.03<br />
ADVISOR — — — — 53.39 24.30 43.90 25.00 8.48 -37.35 25.65<br />
AVERAGE ANNUAL TOTAL RETURN – AVERAGE ANNUAL TOTAL RETURN–<br />
WITHOUT SALES CHARGES5, 9 6, 9<br />
WITH SALES CHARGES<br />
1 YR 3 YR 5 YR 10 YR INCEPTION 1 YR 3 YR 5 YR 10 YR INCEPTION<br />
CLASS A -14.27 -2.79 11.07 — 17.33 -19.20 -4.69 9.76 — 16.30<br />
CLASS C -14.67 -3.40 10.30 — 16.52 -15.23 -3.40 10.30 — 16.52<br />
ADVISOR -14.19 -2.53 11.44 — 17.73 -14.19 -2.53 11.44 — 17.73<br />
Advisor Class shares are only offered to certain eligible investors as stated in the prospectus.<br />
PORTFOLIO HOLDINGS 29 6/30<br />
Total Number of Positions 29<br />
PORTFOLIO BREAKDOWN<br />
Retailing 12.24%<br />
Technology Hardware & Equipment 9.31<br />
Commercial & Professional Services 8.97<br />
Food, Beverage & Tobacco 8.51<br />
Media 8.15<br />
Diversified Financials 6.81<br />
Real Estate 6.71<br />
Consumer Services 6.64<br />
Capital Goods 6.33<br />
Insurance 5.62<br />
TOP 5 COUNTRIES<br />
United Kingdom 40.97%<br />
Germany 8.51<br />
Japan 8.47<br />
Switzerland 7.62<br />
France 4.81<br />
TOP 10 HOLDINGS7 Signet Jewelers Ltd. 5.02%<br />
Neopost SA 4.81<br />
HomeServe 4.73<br />
Daibiru Corp. 4.41<br />
Carpetright PLC 4.40<br />
Vitasoy International Holdings Ltd. 4.25<br />
Experian PLC 4.24<br />
RHJ International 4.20<br />
Dignity PLC 3.60<br />
Rotork PLC 3.59<br />
ANNUAL TOTAL RETURN 5, 9 –CLASS A<br />
WITHOUT SALES CHARGES<br />
43.34%<br />
0<br />
24.54%<br />
8.06%<br />
-37.41%<br />
2005 2006 2007 2008<br />
25.49%<br />
YTD 2009 14<br />
6/30/09<br />
9, 22<br />
HYPOTHETICAL INVESTMENT<br />
CLASS A CLASS C ADVISOR<br />
$10,000 from Inception $27,529 $27,878 $29,885<br />
FUND FACTS<br />
Net Assets (millions)<br />
2, 9<br />
Expense Ratio<br />
without waiver<br />
with waiver<br />
Net Asset Value<br />
Public Offering Price<br />
Beta 3<br />
Standard Deviation 65<br />
FUND DISTRIBUTIONS<br />
Dividend Frequency<br />
Annually in December.<br />
Dividend History 30<br />
12/08<br />
12/07<br />
12/06<br />
Capital Gains (last 12 mos.) 30<br />
Short-Term<br />
Long-Term<br />
ASSET ALLOCATION 29, 60 6/30<br />
Stocks 91%<br />
Cash 9%<br />
CLASS A CLASS C ADVISOR<br />
$7.6 $1.3 $11.7<br />
1.78% 2.43% 1.43%<br />
1.30% 1.95% 0.95%<br />
$11.62 $11.59 $11.61<br />
$12.33 $11.59 $11.61<br />
0.82 0.82 0.82<br />
23.45 23.46 23.51<br />
CLASS A CLASS C ADVISOR<br />
$0.4041 $0.3616 $0.4118<br />
— — 0.2023<br />
— — 0.0937<br />
— — —<br />
4.3970 4.3970 4.3970<br />
DEALER USE ONLY/NOT FOR DISTRIBUTION TO THE PUBLIC Go to franklintempleton.com or call (800) 223-2141 <strong>Dealer</strong> <strong>Facts</strong> <strong>Guide</strong> 47<br />
OPEN-END FUNDS VALUE BLEND GROWTH SECTOR GLOBAL INTERNATIONAL HYBRID ASSET ALLOCATION FIXED INCOME TAX-FREE INCOME
OPEN-END FUNDS<br />
VALUE<br />
BLEND<br />
GROWTH<br />
SECTOR<br />
GLOBAL<br />
INTERNATIONAL<br />
HYBRID<br />
ASSET ALLOCATION<br />
FIXED INCOME<br />
TAX-FREE INCOME<br />
Mutual European Fund<br />
OVERALL MORNINGSTAR RATING TM<br />
CLASS A 8<br />
★★★★★<br />
INVESTMENT CATEGORY<br />
International<br />
PRIMARY INVESTMENT 37<br />
Common and preferred stock, as<br />
well as debt securities, including<br />
high-yield, lower-rated securities,<br />
that the fund’s manager believes<br />
are undervalued. These companies<br />
may be involved in mergers,<br />
consolidations, liquidations, and<br />
reorganizations. The fund focuses<br />
on European companies and may<br />
invest in small cap stocks.<br />
FUND REFERENCE<br />
CLASS A CLASS C<br />
Fund No. 478 578<br />
CUSIP 628 380 834 628 380 826<br />
Symbol TEMIX TEURX<br />
Inception1 7/3/96 7/3/96<br />
CLASS Z 89<br />
Fund No. 078<br />
CUSIP 628 380 503<br />
Symbol MEURX<br />
Inception 1 7/3/96<br />
ANNUAL PROSPECTUS UPDATE AVAILABLE:<br />
May 1<br />
PORTFOLIO MANAGER PROFILE84 Philippe Brugere-Trelat<br />
Joined Mutual Series in 2004<br />
Managed Fund since 2004<br />
Katrina Dudley, CFA<br />
Joined Mutual Series in 2002<br />
Managed Fund since 2007<br />
MAXIMUM SALES CHARGE & COMMISSION<br />
CLASS A CLASS C73 Sales Charge 5.75% 0.00%<br />
<strong>Dealer</strong> Concession 5.00 1.00<br />
12b-1 Fee to <strong>Dealer</strong> 0.25 1.00<br />
CLASS Z89 Sales Charge 0.00%<br />
<strong>Dealer</strong> Concession 0.00<br />
12b-1 Fee to <strong>Dealer</strong> 0.00<br />
See page 128 for more commission<br />
information and page 125 for footnotes.<br />
PERFORMANCE INFORMATION<br />
5, 13, 27<br />
ANNUAL TOTAL RETURN–WITHOUT SALES CHARGES<br />
1999 2000 2001 2002 2003 2004 2005 2006 2007 2008<br />
YTD<br />
200914 CLASS A 46.05 14.07 -5.05 -8.05 32.34 21.23 17.56 26.96 16.86 -32.68 2.90<br />
CLASS C 45.40 13.42 -5.65 -8.65 31.49 20.43 16.78 26.10 16.03 -33.14 2.51<br />
CLASS Z 46.81 14.46 -4.74 -7.71 32.84 21.58 18.03 27.30 17.15 -32.47 3.01<br />
AVERAGE ANNUAL TOTAL RETURN – AVERAGE ANNUAL TOTAL RETURN–<br />
WITHOUT SALES CHARGES5, 13, 27 6, 13, 23<br />
WITH SALES CHARGES<br />
CLASS A<br />
CLASS C<br />
CLASS Z<br />
1 YR 3 YR 5 YR 10 YR INCEPTION 1 YR 3 YR 5 YR 10 YR INCEPTION<br />
-19.63 -1.95 6.74 9.51 11.51 -24.25 -3.86 5.49 8.87 11.00<br />
-20.21 -2.63 6.01 8.80 10.82 -20.99 -2.63 6.01 8.80 10.82<br />
-19.41 -1.68 7.06 9.87 11.92 -19.41 -1.68 7.06 9.87 11.92<br />
Advisor Class shares are only offered to certain eligible investors as stated in the prospectus.<br />
PORTFOLIO HOLDINGS 29 6/30<br />
Total Number of Positions 92<br />
PORTFOLIO BREAKDOWN<br />
Food, Beverage & Tobacco 13.94%<br />
Materials 11.30<br />
Capital Goods 8.06<br />
Energy 7.88<br />
Utilities 7.84<br />
Telecommunication Services 7.69<br />
Diversified Financials 6.42<br />
Insurance 6.32<br />
Banks<br />
Pharmaceuticals, Biotechnology &<br />
4.89<br />
Life Sciences 3.96<br />
TOP 5 COUNTRIES<br />
France 21.59%<br />
United Kingdom 18.97<br />
Germany 16.82<br />
Switzerland 11.76<br />
Netherlands 8.15<br />
TOP 10 HOLDINGS7 Schindler Holding AG 3.11%<br />
Nestle SA 3.05<br />
Anglo American PLC 2.73<br />
British American Tobacco PLC 2.67<br />
Telefonica SA 2.64<br />
Linde AG 2.59<br />
Koninklijke KPN NV 2.52<br />
E.ON AG 2.49<br />
GDF Suez 2.45<br />
Eutelsat Communications 2.40<br />
ANNUAL TOTAL RETURN 5, 27 –CLASS A<br />
WITHOUT SALES CHARGES<br />
26.96%<br />
17.56%<br />
16.86%<br />
0<br />
-32.68%<br />
2005 2006 2007 2008<br />
22, 27<br />
HYPOTHETICAL INVESTMENT<br />
CLASS A CLASS C CLASS Z<br />
$10,000 from Inception $38,807 $37,984 $43,196<br />
FUND FACTS<br />
Net Assets (millions)<br />
Expense Ratio 2<br />
Net Asset Value<br />
Public Offering Price<br />
Beta 3<br />
Standard Deviation 65<br />
FUND DISTRIBUTIONS<br />
6/30/09<br />
CLASS A CLASS C CLASS Z<br />
$666.3 $171.5 $827.8<br />
1.38% 2.08% 1.09%<br />
$17.38 $17.18 $17.77<br />
$18.44 $17.18 $17.77<br />
0.57 0.57 0.57<br />
16.25 16.24 16.24<br />
Dividend Frequency<br />
Semiannually in September and December.<br />
CLASS A<br />
Dividend History<br />
CLASS C CLASS Z<br />
30<br />
12/08<br />
9/08<br />
12/07<br />
Capital Gains (last 12 mos.) 30<br />
— — —<br />
$0.0221 $0.0056 $0.0286<br />
0.5721 0.4023 0.6424<br />
Short-Term<br />
0.1512 0.1512 0.1512<br />
Long-Term<br />
0.4671 0.4671 0.4671<br />
2.90%<br />
YTD 2009 14<br />
ASSET ALLOCATION 29, 60 6/30<br />
Stocks 99%<br />
Cash 1%<br />
48 <strong>Dealer</strong> <strong>Facts</strong> <strong>Guide</strong> Go to franklintempleton.com or call (800) 223-2141 DEALER USE ONLY/NOT FOR DISTRIBUTION TO THE PUBLIC
Mutual International Fund<br />
INVESTMENT CATEGORY<br />
International<br />
PRIMARY INVESTMENT 37<br />
Mutual International Fund seeks<br />
capital appreciation, with income as<br />
a secondary goal, by investing predominantly<br />
in the securities of companies<br />
located outside the United<br />
States, primarily developed Asia and<br />
Europe. It will focus primarily on<br />
undervalued securities of mid- and<br />
large-capitalization companies and,<br />
to a lesser extent, distressed securities<br />
and merger arbitrage.<br />
FUND REFERENCE<br />
CLASS A CLASS C<br />
Fund No. 373 573<br />
CUSIP 354 026 700 354 026 809<br />
Symbol — —<br />
Inception1 5/1/09 5/1/09<br />
CLASS R CLASS Z89 Fund No. 873 073<br />
CUSIP 354 026 882 354 026 874<br />
Symbol — —<br />
Inception1 5/1/09 5/1/09<br />
ANNUAL PROSPECTUS UPDATE AVAILABLE:<br />
May 1<br />
PORTFOLIO MANAGER PROFILE84 Phillip Brugere-Trelat<br />
Managed Fund since 2009<br />
Tenure at Mutual Series<br />
1984-1994, 2004-Present<br />
Andrew Sleeman, CFA<br />
Joined Mutual Series in 2007<br />
Managed Fund since 2009<br />
MAXIMUM SALES CHARGE & COMMISSION<br />
CLASS A CLASS C73 Sales Charge 5.75% 0.00%<br />
<strong>Dealer</strong> Concession 5.00 1.00<br />
12b-1 Fee to <strong>Dealer</strong> 0.25 1.00<br />
CLASS R CLASS Z89 Sales Charge 0.00% 0.00%<br />
<strong>Dealer</strong> Concession 0.00 0.00<br />
12b-1 Fee to <strong>Dealer</strong> 0.50 0.00<br />
See page 128 for more commission<br />
information and page 125 for footnotes.<br />
PERFORMANCE INFORMATION<br />
5, 9<br />
ANNUAL TOTAL RETURN–WITHOUT SALES CHARGES<br />
1999 2000 2001 2002 2003 2004 2005 2006 2007 2008<br />
YTD<br />
2009 14<br />
CLASS A — — — — — — — — — — —<br />
CLASS C — — — — — — — — — — —<br />
CLASS Z — — — — — — — — — — —<br />
AVERAGE ANNUAL TOTAL RETURN– AVERAGE ANNUAL TOTAL RETURN–<br />
WITHOUT SALES CHARGES5, 9 6, 9<br />
WITH SALES CHARGES<br />
6/30/09<br />
1 YR 3 YR 5 YR 10 YR INCEPTION 1 YR 3 YR 5 YR 10 YR INCEPTION<br />
CLASS A — — — — 5.30 — — — — -0.75<br />
CLASS C — — — — 5.10 — — — — 4.10<br />
CLASS Z — — — — 5.30 — — — — 5.30<br />
Class Z shares are only offered to certain eligible investors as stated in the prospectus.<br />
PORTFOLIO HOLDINGS 29 6/30<br />
Total Number of Positions 85<br />
INDUSTRY BREAKDOWN<br />
Food, Beverage & Tobacco 13.10%<br />
Insurance 10.11<br />
Banks 7.49<br />
Utilities 6.56<br />
Capital Goods 6.53<br />
Materials 6.52<br />
Media 6.42<br />
Food & Staples Retailing 5.78<br />
Diversified Financials 5.52<br />
Telecommunication Services 4.28<br />
TOP 5 COUNTRIES<br />
France 13.95%<br />
Germany 11.41<br />
China 10.72<br />
United Kingdom 10.52<br />
Italy 5.43<br />
TOP 10 HOLDINGS<br />
CNinsure Inc. 1.80%<br />
Intesa Sanpaolo SpA 1.76<br />
Nestle SA 1.55<br />
China Digital TV Holding Co. 1.53<br />
Koninklijke KPN NV 1.52<br />
Barclays PLC 1.52<br />
Fortis 1.52<br />
Zurich Financial Services AG 1.52<br />
VisionChina Media Inc. 1.50<br />
Telefonica SA 1.50<br />
9, 22<br />
HYPOTHETICAL INVESTMENT<br />
CLASS A CLASS C CLASS Z<br />
$10,000 from Inception $9,925 $10,410 $10,530<br />
FUND FACTS<br />
Net Assets (millions)<br />
2, 9<br />
Expense Ratio<br />
without waiver<br />
with waiver<br />
Net Asset Value<br />
Public Offering Price<br />
Beta 3<br />
Standard Deviation 65<br />
FUND DISTRIBUTIONS<br />
Dividend Frequency<br />
Annually.<br />
CLASS A CLASS C CLASS Z<br />
$2.6 $0.2 $1.2<br />
1.91% 2.61% 1.61%<br />
1.47% 2.17% 1.17%<br />
$10.53 $10.51 $10.53<br />
$11.17 $10.51 $10.53<br />
— — —<br />
— — —<br />
ASSET ALLOCATION 29, 60 6/30<br />
Stocks 90%<br />
Bonds 1%<br />
Cash 10%<br />
DEALER USE ONLY/NOT FOR DISTRIBUTION TO THE PUBLIC Go to franklintempleton.com or call (800) 223-2141 <strong>Dealer</strong> <strong>Facts</strong> <strong>Guide</strong> 49<br />
OPEN-END FUNDS VALUE BLEND GROWTH SECTOR GLOBAL INTERNATIONAL HYBRID ASSET ALLOCATION FIXED INCOME TAX-FREE INCOME
OPEN-END FUNDS<br />
VALUE<br />
BLEND<br />
GROWTH<br />
SECTOR<br />
GLOBAL<br />
INTERNATIONAL<br />
HYBRID<br />
ASSET ALLOCATION<br />
FIXED INCOME<br />
TAX-FREE INCOME<br />
<strong>Templeton</strong> BRIC Fund<br />
OVERALL MORNINGSTAR<br />
RATING TM – CLASS A 8<br />
TM 67<br />
MORNINGSTAR STYLE BOX<br />
STYLE<br />
Value Blend Growth<br />
SIZE<br />
✕ Large<br />
Medium<br />
Small<br />
INVESTMENT CATEGORY<br />
International<br />
PRIMARY INVESTMENT 37<br />
The fund seeks long-term capital<br />
appreciation by normally investing<br />
at least 80% of its net assets in<br />
securities of “BRIC companies”—<br />
those companies that are organized<br />
under the laws of, have a principal<br />
office in, or have its principal trading<br />
market in Brazil, Russia, India or<br />
China (including the People’s Republic<br />
of China, Hong Kong and Taiwan);<br />
or derive a significant share of their<br />
total revenue or profit from, or have<br />
a significant portion of their assets<br />
in, BRIC countries.<br />
FUND REFERENCE<br />
CLASS A CLASS C<br />
Fund No. 405 505<br />
CUSIP 880 19R 757 880 19R 740<br />
Symbol TABRX TPBRX<br />
Inception1 6/1/06 6/1/06<br />
ADVISOR 89<br />
Fund No. 655<br />
CUSIP 880 19R 682<br />
Symbol —<br />
Inception 1 6/1/06<br />
✕ Current<br />
Historical<br />
ANNUAL PROSPECTUS UPDATE AVAILABLE:<br />
August 1<br />
PORTFOLIO MANAGER PROFILE84 Mark Mobius, Ph.D.<br />
Joined <strong>Franklin</strong> <strong>Templeton</strong> in 1987<br />
Managed Fund since 2006<br />
Dennis Lim<br />
Joined <strong>Franklin</strong> <strong>Templeton</strong> in 1990<br />
Managed Fund since 2006<br />
Tom Wu<br />
Joined <strong>Franklin</strong> <strong>Templeton</strong> in 1987<br />
Managed Fund since 2006<br />
MAXIMUM SALES CHARGE & COMMISSION<br />
CLASS A CLASS C73 Sales Charge 5.75% 0.00%<br />
<strong>Dealer</strong> Concession 5.00 1.00<br />
12b-1 Fee to <strong>Dealer</strong> 0.25 1.00<br />
ADVISOR 89<br />
Sales Charge 0.00%<br />
<strong>Dealer</strong> Concession 0.00<br />
12b-1 Fee to <strong>Dealer</strong> 0.00<br />
See page 128 for more commission<br />
information and page 125 for footnotes.<br />
PERFORMANCE INFORMATION<br />
5, 13<br />
ANNUAL TOTAL RETURN–WITHOUT SALES CHARGES<br />
1999 2000 2001 2002 2003 2004 2005 2006 2007 2008<br />
YTD<br />
2009 14<br />
CLASS A<br />
CLASS C<br />
ADVISOR43 — — — — — — — — 50.28 -61.39 44.15<br />
— — — — — — — — 49.32 -61.63 43.71<br />
— — — — — — — — 50.28 -61.38 44.48<br />
AVERAGE ANNUAL TOTAL RETURN– AVERAGE ANNUAL TOTAL RETURN–<br />
WITHOUT SALES CHARGES5, 13 6, 13, 21<br />
WITH SALES CHARGES<br />
6/30/09<br />
1 YR 3 YR 5 YR 10 YR INCEPTION 1 YR 3 YR 5 YR 10 YR INCEPTION<br />
CLASS A<br />
CLASS C<br />
ADVISOR43 -34.43 1.46 — — 2.50 -38.21 -0.52 — — 0.55<br />
-34.81 0.81 — — 1.86 -35.46 0.81 — — 1.86<br />
-34.27 1.55 — — 2.58 -34.27 1.55 — — 2.58<br />
Advisor Class shares are only offered to certain eligible investors as stated in the prospectus.<br />
PORTFOLIO HOLDINGS 29 6/30<br />
Total Number of Positions 69<br />
INDUSTRY BREAKDOWN<br />
Energy 33.33%<br />
Banks 18.33<br />
Materials 16.37<br />
Telecommunication Services 12.79<br />
Real Estate 5.76<br />
Transportation 2.72<br />
Insurance 2.39<br />
Food, Beverage & Tobacco 2.34<br />
Capital Goods 2.20<br />
Utilities 1.77<br />
COUNTRY BREAKDOWN<br />
China 39.97%<br />
Brazil 30.75<br />
Russia 16.12<br />
India 11.54<br />
Other 0.52<br />
TOP 10 HOLDINGS7 Petroleo Brasileiro SA (Petrobras) 8.86%<br />
China Mobile Ltd. 6.90<br />
Vale SA 5.78<br />
Itau Unibanco Holding SA 5.09<br />
Gazprom 4.57<br />
Yanzhou Coal Mining Company Ltd. 4.35<br />
PetroChina Company Ltd. 4.27<br />
SOHO China Ltd.<br />
Industrial and Commercial Bank of<br />
4.07<br />
China Ltd. 3.59<br />
Banco Bradesco SA 3.10<br />
ANNUAL TOTAL RETURN 5 –CLASS A<br />
WITHOUT SALES CHARGES<br />
50.28%<br />
0<br />
-61.39%<br />
2005 2006 2007 2008<br />
HYPOTHETICAL INVESTMENT 22<br />
CLASS A CLASS C ADVISOR 43<br />
$10,000 from Inception $10,170 $10,582 $10,817<br />
FUND FACTS<br />
Net Assets (millions)<br />
Expense Ratio2 Net Asset Value<br />
Public Offering Price<br />
Beta 3<br />
Standard Deviation 65<br />
FUND DISTRIBUTIONS<br />
Dividend Frequency<br />
Annually in December.<br />
Dividend History 30<br />
12/08<br />
12/07<br />
5/07<br />
Capital Gains (last 12 mos.) 30<br />
Short-Term<br />
Long-Term<br />
44.15%<br />
YTD 2009 14<br />
ASSET ALLOCATION 29, 60 6/30<br />
Stocks 99%<br />
Cash 1%<br />
CLASS A CLASS C ADVISOR<br />
$377.7 $118.4 $2.7<br />
2.09% 2.75% 1.75%<br />
$10.22 $10.16 $10.20<br />
$10.84 $10.16 $10.20<br />
— — —<br />
— — —<br />
CLASS A CLASS C ADVISOR<br />
$0.1416 $0.0722 $0.1746<br />
0.0580 — —<br />
— — —<br />
— — —<br />
— — —<br />
50 <strong>Dealer</strong> <strong>Facts</strong> <strong>Guide</strong> Go to franklintempleton.com or call (800) 223-2141 DEALER USE ONLY/NOT FOR DISTRIBUTION TO THE PUBLIC
<strong>Templeton</strong> China World Fund<br />
OVERALL MORNINGSTAR RATING TM<br />
CLASS A 8<br />
★★★★<br />
MORNINGSTAR STYLE BOX<br />
STYLE<br />
Value Blend Growth<br />
SIZE<br />
✕<br />
Large<br />
Medium<br />
Small<br />
INVESTMENT CATEGORY<br />
International<br />
TM 67<br />
PRIMARY INVESTMENT 37<br />
Equity securities of issuers located<br />
in or deriving a significant portion<br />
of their revenues from, or for which<br />
the principal securities trading market<br />
is China, Hong Kong or Taiwan.<br />
These companies may be smaller,<br />
newly organized, and relatively<br />
unseasoned companies.<br />
FUND REFERENCE<br />
CLASS A CLASS C<br />
Fund No. 188 288<br />
CUSIP 880 18X 201 880 18X 409<br />
Symbol TCWAX TCWCX<br />
Inception1 9/9/93 9/9/93<br />
ADVISOR 89<br />
Fund No. 680<br />
CUSIP 880 18X 102<br />
Symbol TACWX<br />
Inception 1 9/9/93<br />
✕ Current<br />
Historical<br />
ANNUAL PROSPECTUS UPDATE AVAILABLE:<br />
January 1<br />
PORTFOLIO MANAGER PROFILE84 Mark Mobius, Ph.D.<br />
Joined <strong>Franklin</strong> <strong>Templeton</strong> in 1987<br />
Managed Fund since 1993<br />
Eddie Chow, CFA<br />
Joined <strong>Franklin</strong> <strong>Templeton</strong> in 1994<br />
Managed Fund since 2002<br />
MAXIMUM SALES CHARGE & COMMISSION<br />
CLASS A CLASS C73 Sales Charge 5.75% 0.00%<br />
<strong>Dealer</strong> Concession 5.00 1.00<br />
12b-1 Fee to <strong>Dealer</strong> 0.25 1.00<br />
ADVISOR89 Sales Charge 0.00%<br />
<strong>Dealer</strong> Concession 0.00<br />
12b-1 Fee to <strong>Dealer</strong> 0.00<br />
See page 128 for more commission<br />
information and page 125 for footnotes.<br />
PERFORMANCE INFORMATION<br />
5, 72<br />
ANNUAL TOTAL RETURN–WITHOUT SALES CHARGES<br />
1999 2000 2001 2002 2003 2004 2005 2006 2007 2008<br />
YTD<br />
200914 CLASS A 39.66 -11.39 -1.14 16.95 67.78 13.06 17.63 40.86 44.08 -44.69 35.21<br />
CLASS C 38.65 -11.99 -1.82 16.19 66.71 12.34 16.91 39.95 43.15 -45.08 34.73<br />
ADVISOR 40.20 -11.06 -0.77 17.36 68.43 13.45 18.08 41.34 44.56 -44.54 35.44<br />
AVERAGE ANNUAL TOTAL RETURN – AVERAGE ANNUAL TOTAL RETURN–<br />
WITHOUT SALES CHARGES5, 72 6, 72<br />
WITH SALES CHARGES<br />
1 YR 3 YR 5 YR 10 YR INCEPTION 1 YR 3 YR 5 YR 10 YR INCEPTION<br />
CLASS A -9.08 11.27 15.45 13.97 8.40 -14.31 9.10 14.09 13.30 7.99<br />
CLASS C -9.73 10.51 14.72 13.21 7.59 -10.52 10.51 14.72 13.21 7.59<br />
ADVISOR -8.82 11.62 15.84 14.38 8.83 -8.82 11.62 15.84 14.38 8.83<br />
Advisor Class shares are only offered to certain eligible investors as stated in the prospectus.<br />
PORTFOLIO HOLDINGS 29 6/30<br />
Total Number of Positions 85<br />
INDUSTRY BREAKDOWN<br />
Energy 27.64%<br />
Food & Staples Retailing 10.13<br />
Banks 9.81<br />
Telecommunication Services 8.03<br />
Utilities 6.30<br />
Technology Hardware & Equipment 5.86<br />
Automobiles & Components 4.91<br />
Capital Goods<br />
Semiconductors & Semiconductor<br />
4.60<br />
Equipment 4.40<br />
Real Estate 4.38<br />
TOP 5 COUNTRIES<br />
China 65.89%<br />
Hong Kong 18.93<br />
Taiwan 12.33<br />
United States 0.41<br />
Cambodia 0.32<br />
TOP 10 HOLDINGS7 Dairy Farm International Holdings Ltd. 9.05%<br />
China Mobile Ltd.<br />
China Petroleum & Chemical Corp.<br />
7.19<br />
(Sinopec) 7.00<br />
CNOOC Ltd. 6.86<br />
PetroChina Company Ltd. 6.07<br />
Bank of China Ltd. 4.76<br />
China Shenhua Energy Company Ltd.<br />
Taiwan Semiconductor<br />
4.19<br />
Manufacturing Company Ltd. 3.80<br />
China Construction Bank 3.30<br />
Yanzhou Coal Mining Company Ltd. 2.99<br />
ANNUAL TOTAL RETURN 5, 72 –CLASS A<br />
WITHOUT SALES CHARGES<br />
40.86% 44.08%<br />
0<br />
17.63%<br />
-44.69%<br />
2005 2006 2007 2008<br />
22, 72<br />
HYPOTHETICAL INVESTMENT<br />
CLASS A CLASS C ADVISOR<br />
$10,000 from Inception $33,722 $31,775 $38,121<br />
FUND FACTS<br />
Net Assets (millions)<br />
Expense Ratio2 Net Asset Value<br />
Public Offering Price<br />
Beta 3<br />
Standard Deviation 65<br />
FUND DISTRIBUTIONS<br />
Dividend Frequency<br />
Annually in December.<br />
Dividend History 30<br />
12/08<br />
12/07<br />
10/07<br />
Capital Gains (last 12 mos.) 30<br />
Short-Term<br />
Long-Term<br />
35.21%<br />
YTD 2009 14<br />
6/30/09<br />
CLASS A CLASS C ADVISOR<br />
$349.9 $125.5 $247.6<br />
1.98% 2.67% 1.68%<br />
$28.53 $28.24 $28.66<br />
$30.27 $28.24 $28.66<br />
0.99 0.99 0.99<br />
33.66 33.66 33.66<br />
CLASS A CLASS C ADVISOR<br />
$0.3029 $0.0247 $0.4348<br />
0.0973 0.0059 0.1486<br />
0.3153 0.1704 0.3913<br />
0.5143 0.5143 0.5143<br />
2.4917 2.4917 2.4917<br />
ASSET ALLOCATION 29, 60 6/30<br />
Stocks 98%<br />
Cash 2%<br />
DEALER USE ONLY/NOT FOR DISTRIBUTION TO THE PUBLIC Go to franklintempleton.com or call (800) 223-2141 <strong>Dealer</strong> <strong>Facts</strong> <strong>Guide</strong> 51<br />
OPEN-END FUNDS VALUE BLEND GROWTH SECTOR GLOBAL INTERNATIONAL HYBRID ASSET ALLOCATION FIXED INCOME TAX-FREE INCOME
OPEN-END FUNDS<br />
VALUE<br />
BLEND<br />
GROWTH<br />
SECTOR<br />
GLOBAL<br />
INTERNATIONAL<br />
HYBRID<br />
ASSET ALLOCATION<br />
FIXED INCOME<br />
TAX-FREE INCOME<br />
<strong>Templeton</strong> Developing Markets Trust<br />
OVERALL MORNINGSTAR<br />
RATING TM – CLASS A 8<br />
TM 67<br />
MORNINGSTAR STYLE BOX<br />
STYLE<br />
Value Blend Growth<br />
SIZE<br />
✕ Large<br />
Medium<br />
Small<br />
✕ Current<br />
Historical<br />
INVESTMENT CATEGORY<br />
International<br />
PRIMARY INVESTMENT 37<br />
Developing or emerging market<br />
companies’ common stocks.<br />
FUND REFERENCE<br />
CLASS A CLASS C<br />
Fund No. 711 791<br />
CUSIP 88018W 104 880 18W 203<br />
Symbol TEDMX TDMTX<br />
Inception1 10/16/91 5/1/95<br />
CLASS R ADVISOR89 Fund No. 891 611<br />
CUSIP 880 18W 500 880 18W 302<br />
Symbol TDMRX TDADX<br />
Inception1 10/16/91 10/16/91<br />
ANNUAL PROSPECTUS UPDATE AVAILABLE:<br />
May 1<br />
PORTFOLIO MANAGER PROFILE84 Mark Mobius, Ph.D.<br />
Joined <strong>Franklin</strong> <strong>Templeton</strong> in 1987<br />
Managed Fund since 1991<br />
Tom Wu<br />
Joined <strong>Franklin</strong> <strong>Templeton</strong> in 1987<br />
Managed Fund since 1991<br />
Dennis Lim<br />
Joined <strong>Franklin</strong> <strong>Templeton</strong> in 1990<br />
Managed Fund since 2001<br />
MAXIMUM SALES CHARGE & COMMISSION<br />
CLASS A CLASS C73 Sales Charge 5.75% 0.00%<br />
<strong>Dealer</strong> Concession 5.00 1.00<br />
12b-1 Fee to <strong>Dealer</strong> 0.25 1.00<br />
CLASS R ADVISOR89 Sales Charge 0.00% 0.00%<br />
<strong>Dealer</strong> Concession 0.00 0.00<br />
12b-1 Fee to <strong>Dealer</strong> 0.50 0.00<br />
See page 128 for more commission<br />
information and page 125 for footnotes.<br />
PERFORMANCE INFORMATION<br />
5, 13<br />
ANNUAL TOTAL RETURN–WITHOUT SALES CHARGES<br />
1999 2000 2001 2002 2003 2004 2005 2006 2007 2008<br />
YTD<br />
200914 CLASS A<br />
CLASS C<br />
ADVISOR43 51.55 -31.85 -5.76 1.68 53.14 25.45 28.20 28.29 28.77 -53.91 29.04<br />
50.44 -32.36 -6.34 0.98 52.25 24.72 27.31 27.38 27.87 -54.27 28.63<br />
51.95 -31.67 -5.43 2.20 53.72 25.98 28.63 28.63 29.12 -53.79 29.21<br />
AVERAGE ANNUAL TOTAL RETURN – AVERAGE ANNUAL TOTAL RETURN–<br />
WITHOUT SALES CHARGES5, 13 6, 13<br />
WITH SALES CHARGES<br />
1 YR 3 YR 5 YR 10 YR INCEPTION 1 YR 3 YR 5 YR 10 YR INCEPTION<br />
CLASS A -28.78 -2.54 9.34 5.79 6.66 -32.86 -4.45 8.05 5.16 6.30<br />
CLASS C -29.30 -3.25 8.56 5.07 5.02 -29.96 -3.25 8.56 5.07 5.02<br />
ADVISOR -28.57 -2.26 9.66 6.14 6.89 -28.57 -2.26 9.66 6.14 6.89<br />
43<br />
Advisor Class shares are only offered to certain eligible investors as stated in the prospectus.<br />
PORTFOLIO HOLDINGS 29 6/30<br />
Total Number of Positions 122<br />
INDUSTRY BREAKDOWN<br />
Energy 24.46%<br />
Materials 15.26<br />
Banks 13.91<br />
Telecommunication Services 10.54<br />
Food, Beverage & Tobacco 5.70<br />
Household & Personal Products 4.24<br />
Food & Staples Retailing 3.65<br />
Media 2.95<br />
Software & Services 2.49<br />
Capital Goods 2.38<br />
GEOGRAPHIC BREAKDOWN<br />
Asia 39.49%<br />
Latin America/Caribbean 24.90<br />
Europe 24.25<br />
Mid-East/Africa 8.60<br />
TOP 10 HOLDINGS7 Petroleo Brasileiro SA (Petrobras) 3.84%<br />
PetroChina Company Ltd. 3.47<br />
Vale SA 3.23<br />
Gazprom 3.16<br />
China Mobile Ltd. 3.07<br />
Lukoil Holdings 2.93<br />
America Movil SAB de CV 2.42<br />
Anglo American PLC 2.09<br />
Itau Unibanco Holding SA 1.89<br />
OTP Bank 1.84<br />
HYPOTHETICAL INVESTMENT 22<br />
CLASS A CLASS C ADVISOR43 $10,000 from Inception $29,522 $20,023 $32,542<br />
FUND FACTS<br />
Net Assets (millions)<br />
Expense Ratio2 Net Asset Value<br />
Public Offering Price<br />
Beta 3<br />
ANNUAL TOTAL RETURN 5 –CLASS A<br />
WITHOUT SALES CHARGES<br />
28.20% 28.29% 28.77% 29.04%<br />
0<br />
-53.91%<br />
2005 2006 2007 2008<br />
Standard Deviation 65<br />
6/30/09<br />
CLASS A CLASS C ADVISOR<br />
$1,873.3 $244.3 $225.3<br />
1.89% 2.62% 1.63%<br />
$16.62 $16.22 $16.59<br />
$17.63 $16.22 $16.59<br />
0.96 0.96 0.96<br />
33.62 33.61 33.60<br />
FUND DISTRIBUTIONS<br />
Dividend Frequency<br />
Annually, in September and, if necessary, December.<br />
CLASS A CLASS C ADVISOR<br />
Dividend History 30<br />
12/08<br />
9/08<br />
12/07<br />
Capital Gains (last 12 mos.) 30<br />
$0.5274 $0.3412 $0.5985<br />
0.0680 0.0690 0.0674<br />
0.6062 0.3929 0.7041<br />
Short-Term<br />
0.2007 0.2007 0.2007<br />
Long-Term<br />
0.6919 0.6919 0.6919<br />
YTD 2009 14<br />
ASSET ALLOCATION 29, 60 6/30<br />
Stocks 97%<br />
Cash 3%<br />
52 <strong>Dealer</strong> <strong>Facts</strong> <strong>Guide</strong> Go to franklintempleton.com or call (800) 223-2141 DEALER USE ONLY/NOT FOR DISTRIBUTION TO THE PUBLIC
<strong>Templeton</strong> Emerging Markets Small Cap Fund<br />
OVERALL MORNINGSTAR<br />
RATING TM – CLASS A 8<br />
TM 67<br />
MORNINGSTAR STYLE BOX<br />
STYLE<br />
Value Blend Growth<br />
SIZE<br />
Large<br />
✕<br />
Medium<br />
Small<br />
✕ Current<br />
Historical<br />
INVESTMENT CATEGORY<br />
International<br />
PRIMARY INVESTMENT 37<br />
The fund seeks long-term capital<br />
appreciation by investing at least<br />
80% of its net assets in securities<br />
of small-cap companies (market<br />
capitalization between $100 million<br />
and $1 billion) located in emerging<br />
market countries.<br />
FUND REFERENCE<br />
CLASS A CLASS C<br />
Fund No. 426 526<br />
CUSIP 880 19R 732 880 19R 724<br />
Symbol TEMMX TCEMX<br />
Inception1 10/2/06 10/2/06<br />
CLASS R ADVISOR89 Fund No. 826 626<br />
CUSIP 88019R 716 880 19R 690<br />
Symbol — —<br />
Inception1 10/2/06 10/2/06<br />
ANNUAL PROSPECTUS UPDATE AVAILABLE:<br />
August 1<br />
PORTFOLIO MANAGER PROFILE84 Mark Mobius, Ph.D.<br />
Joined <strong>Franklin</strong> <strong>Templeton</strong> in 1987<br />
Managed Fund since 2006<br />
Dennis Lim<br />
Joined <strong>Franklin</strong> <strong>Templeton</strong> in 1990<br />
Managed Fund since 2006<br />
Tom Wu<br />
Joined <strong>Franklin</strong> <strong>Templeton</strong> in 1987<br />
Managed Fund since 2006<br />
MAXIMUM SALES CHARGE & COMMISSION<br />
CLASS A CLASS C73 Sales Charge 5.75% 0.00%<br />
<strong>Dealer</strong> Concession 5.00 1.00<br />
12b-1 Fee to <strong>Dealer</strong> 0.25 1.00<br />
CLASS R ADVISOR89 Sales Charge 0.00% 0.00%<br />
<strong>Dealer</strong> Concession 0.00 0.00<br />
12b-1 Fee to <strong>Dealer</strong> 0.50 0.00<br />
See page 128 for more commission<br />
information and page 125 for footnotes.<br />
PERFORMANCE INFORMATION<br />
5, 9<br />
ANNUAL TOTAL RETURN–WITHOUT SALES CHARGES<br />
1999 2000 2001 2002 2003 2004 2005 2006 2007 2008<br />
YTD<br />
200914 CLASS A — — — — — — — — 29.19 -60.36 49.79<br />
CLASS C — — — — — — — — 28.42 -60.66 49.25<br />
ADVISOR — — — — — — — — 29.60 -60.30 50.21<br />
AVERAGE ANNUAL TOTAL RETURN – AVERAGE ANNUAL TOTAL RETURN–<br />
WITHOUT SALES CHARGES5, 9 6, 9<br />
WITH SALES CHARGES<br />
1 YR 3 YR 5 YR 10 YR INCEPTION 1 YR 3 YR 5 YR 10 YR INCEPTION<br />
CLASS A -23.71 — — — -6.20 -28.09 — — — -8.21<br />
CLASS C -24.33 — — — -6.83 -25.01 — — — -6.83<br />
ADVISOR -23.52 — — — -5.92 -23.52 — — — -5.92<br />
Advisor Class shares are only offered to certain eligible investors as stated in the prospectus.<br />
PORTFOLIO HOLDINGS 29 6/30<br />
Total Number of Positions 86<br />
INDUSTRY BREAKDOWN<br />
Food, Beverage & Tobacco 13.50%<br />
Pharmaceuticals, Biotechnology &<br />
Life Sciences 12.48<br />
Capital Goods 10.12<br />
Materials 10.07<br />
Consumer Durables & Apparel 7.01<br />
Technology Hardware & Equipment 6.48<br />
Energy 5.57<br />
Banks 5.31<br />
Software & Services 4.96<br />
Media 3.23<br />
GEOGRAPHIC BREAKDOWN<br />
Asia 48.48%<br />
Europe 25.77<br />
Mid-East/Africa 10.46<br />
Latin America/Caribbean 5.68<br />
North America 4.66<br />
TOP 10 HOLDINGS 7<br />
Pinar Sut Mamulleri Sanayii AS 3.04%<br />
JK Cements Ltd. 2.95<br />
CTC Media Inc. 2.84<br />
Chongqing Machinery and Electric<br />
Company Ltd. 2.70<br />
Wasion Group Holdings Ltd. 2.61<br />
American BankNote SA 2.58<br />
Sesa Goa Ltd. 2.29<br />
Selcuk Ecza Deposu 2.24<br />
Veropharm 2.21<br />
Dragon Oil PLC 2.12<br />
ANNUAL TOTAL RETURN 5, 9 –CLASS A<br />
WITHOUT SALES CHARGES<br />
0<br />
29.19%<br />
-60.36%<br />
2005 2006 2007 2008<br />
9, 22<br />
HYPOTHETICAL INVESTMENT<br />
CLASS A CLASS C ADVISOR<br />
$10,000 from Inception $7,907 $8,237 $8,459<br />
FUND FACTS<br />
Net Assets (millions)<br />
2, 9<br />
Expense Ratio<br />
without waiver<br />
with waiver<br />
Net Asset Value<br />
Public Offering Price<br />
Beta 3<br />
Standard Deviation 65<br />
FUND DISTRIBUTIONS<br />
Dividend Frequency<br />
Annually in December.<br />
Dividend History 30<br />
12/08<br />
12/07<br />
5/07<br />
Capital Gains (last 12 mos.) 30<br />
Short-Term<br />
Long-Term<br />
49.79%<br />
YTD 2009 14<br />
6/30/09<br />
CLASS A CLASS C ADVISOR<br />
$62.0 $15.9 $2.3<br />
2.37% 3.02% 2.02%<br />
2.15% 2.80% 1.80%<br />
$7.04 $6.97 $7.06<br />
$7.47 $6.97 $7.06<br />
— — —<br />
— — —<br />
CLASS A CLASS C ADVISOR<br />
$0.0615 $0.0382 $0.0738<br />
0.0784 0.0328 0.1037<br />
0.0367 0.0284 0.0447<br />
0.4773 0.4773 0.4773<br />
— — —<br />
ASSET ALLOCATION 29, 60 6/30<br />
Stocks 95%<br />
Cash 5%<br />
DEALER USE ONLY/NOT FOR DISTRIBUTION TO THE PUBLIC Go to franklintempleton.com or call (800) 223-2141 <strong>Dealer</strong> <strong>Facts</strong> <strong>Guide</strong> 53<br />
OPEN-END FUNDS VALUE BLEND GROWTH SECTOR GLOBAL INTERNATIONAL HYBRID ASSET ALLOCATION FIXED INCOME TAX-FREE INCOME
OPEN-END FUNDS<br />
VALUE<br />
BLEND<br />
GROWTH<br />
SECTOR<br />
GLOBAL<br />
INTERNATIONAL<br />
HYBRID<br />
ASSET ALLOCATION<br />
FIXED INCOME<br />
TAX-FREE INCOME<br />
<strong>Templeton</strong> Foreign Fund<br />
OVERALL MORNINGSTAR<br />
RATING TM – CLASS A 8<br />
TM 67<br />
MORNINGSTAR STYLE BOX<br />
STYLE<br />
Value Blend Growth<br />
SIZE<br />
✕<br />
Large<br />
Medium<br />
Small<br />
✕ Current<br />
Historical<br />
INVESTMENT CATEGORY<br />
International<br />
PRIMARY INVESTMENT 37<br />
Equity securities of foreign issuers.<br />
FUND REFERENCE<br />
CLASS A CLASS C<br />
Fund No. 104 204<br />
CUSIP 880 196 209 880 196 407<br />
Symbol TEMFX TEFTX<br />
Inception1 10/5/82 5/1/95<br />
CLASS R ADVISOR89 Fund No. 804 604<br />
CUSIP 880 196 803 880 196 506<br />
Symbol TEFRX TFFAX<br />
Inception1 10/5/82 10/5/82<br />
ANNUAL PROSPECTUS UPDATE AVAILABLE:<br />
January 1<br />
PORTFOLIO MANAGER PROFILE84 Tucker Scott, CFA<br />
Joined <strong>Franklin</strong> <strong>Templeton</strong> in 1996<br />
Managed Fund since 2007<br />
Cindy L. Sweeting, CFA<br />
Joined <strong>Franklin</strong> <strong>Templeton</strong> in 1997<br />
Managed Fund since 2007<br />
Lisa F. Myers, CFA<br />
Joined <strong>Franklin</strong> <strong>Templeton</strong> in 1996<br />
Managed Fund since 2002<br />
MAXIMUM SALES CHARGE & COMMISSION<br />
CLASS A CLASS C73 Sales Charge 5.75% 0.00%<br />
<strong>Dealer</strong> Concession 5.00 1.00<br />
12b-1 Fee to <strong>Dealer</strong> 0.25 1.00<br />
CLASS R ADVISOR89 Sales Charge 0.00% 0.00%<br />
<strong>Dealer</strong> Concession 0.00 0.00<br />
12b-1 Fee to <strong>Dealer</strong> 0.50 0.00<br />
See page 128 for more commission<br />
information and page 125 for footnotes.<br />
PERFORMANCE INFORMATION<br />
ANNUAL TOTAL RETURN–WITHOUT SALES CHARGES5 1999 2000 2001 2002 2003 2004 2005 2006 2007 2008<br />
YTD<br />
200914 CLASS A<br />
CLASS C<br />
ADVISOR43 39.21 -3.67 -7.92 -8.64 30.51 18.14 10.63 19.93 17.24 -46.09 18.24<br />
38.10 -4.42 -8.58 -9.25 29.46 17.21 9.89 19.07 16.31 -46.46 17.66<br />
39.54 -3.50 -7.68 -8.42 30.87 18.37 10.94 20.14 17.56 -45.98 18.22<br />
AVERAGE ANNUAL TOTAL RETURN – AVERAGE ANNUAL TOTAL RETURN–<br />
WITHOUT SALES CHARGES5 6, 21<br />
WITH SALES CHARGES<br />
1 YR 3 YR 5 YR 10 YR INCEPTION 1 YR 3 YR 5 YR 10 YR INCEPTION<br />
CLASS A<br />
CLASS C<br />
ADVISOR43 -25.06 -5.48 2.68 3.46 11.06 -29.37 -7.33 1.47 2.85 10.81<br />
-25.70 -6.21 1.90 2.69 4.97 -26.19 -6.21 1.90 2.69 4.97<br />
-25.00 -5.29 2.89 3.69 11.21 -25.00 -5.29 2.89 3.69 11.21<br />
Advisor Class shares are only offered to certain eligible investors as stated in the prospectus.<br />
PORTFOLIO HOLDINGS 29 6/30<br />
Total Number of Positions 95<br />
INDUSTRY BREAKDOWN<br />
Telecommunication Services 14.28%<br />
Energy<br />
Pharmaceuticals, Biotechnology &<br />
11.72<br />
Life Sciences 8.29<br />
Insurance 7.14<br />
Technology Hardware & Equipment 6.26<br />
Diversified Financials 5.71<br />
Capital Goods 5.64<br />
Commercial & Professional Services<br />
Semiconductors & Semiconductor<br />
5.34<br />
Equipment 4.94<br />
Software & Services 4.34<br />
GEOGRAPHIC BREAKDOWN<br />
Europe 63.68%<br />
Asia 26.69<br />
North America 4.54<br />
Latin America/Caribbean 1.87<br />
Mid-East/Africa 0.85<br />
Australia/New Zealand 0.63<br />
TOP 10 HOLDINGS7 ING Groep NV 3.17%<br />
Vodafone Group PLC<br />
Taiwan Semiconductor<br />
2.90<br />
Manufacturing Company Ltd. 2.20<br />
Adecco SA 2.14<br />
Siemens AG 2.09<br />
BP PLC 2.08<br />
Samsung Electronics Company Ltd. 1.97<br />
Total SA 1.92<br />
Lite-On Technology 1.92<br />
Sanofi-Aventis 1.90<br />
HYPOTHETICAL INVESTMENT 22<br />
CLASS A CLASS C ADVISOR43 $10,000 from Inception $155,550 $19,881 $171,305<br />
FUND FACTS<br />
Net Assets (millions)<br />
Expense Ratio2 Net Asset Value<br />
Public Offering Price<br />
Beta 3<br />
ANNUAL TOTAL RETURN 5 –CLASS A<br />
WITHOUT SALES CHARGES<br />
10.63%<br />
19.93% 17.24% 18.24%<br />
0<br />
-46.09%<br />
2005 2006 2007 2008<br />
Standard Deviation 65<br />
FUND DISTRIBUTIONS<br />
Dividend Frequency<br />
Annually in December.<br />
Dividend History 30<br />
12/08<br />
12/07<br />
10/07<br />
Capital Gains (last 12 mos.) 30<br />
Short-Term<br />
Long-Term<br />
YTD 2009 14<br />
6/30/09<br />
CLASS A CLASS C ADVISOR<br />
$3,660.5 $575.5 $818.8<br />
1.14% 1.88% 0.89%<br />
$5.25 $5.13 $5.19<br />
$5.57 $5.13 $5.19<br />
1.08 1.08 1.08<br />
27.19 27.15 27.23<br />
CLASS A CLASS C ADVISOR<br />
$0.3151 $0.2257 $0.3468<br />
0.0352 0.0035 0.0465<br />
0.2019 0.1319 0.2312<br />
— — —<br />
1.9998 1.9998 1.9998<br />
ASSET ALLOCATION 29, 60 6/30<br />
Stocks 98%<br />
Cash 2%<br />
54 <strong>Dealer</strong> <strong>Facts</strong> <strong>Guide</strong> Go to franklintempleton.com or call (800) 223-2141 DEALER USE ONLY/NOT FOR DISTRIBUTION TO THE PUBLIC
<strong>Templeton</strong> Foreign Smaller Companies Fund<br />
OVERALL MORNINGSTAR<br />
RATING TM – CLASS A 8<br />
TM 67<br />
MORNINGSTAR STYLE BOX<br />
STYLE<br />
Value Blend Growth<br />
SIZE<br />
Large<br />
✕<br />
Medium<br />
Small<br />
INVESTMENT CATEGORY<br />
International<br />
PRIMARY INVESTMENT 37<br />
Equity securities of foreign smaller<br />
capitalization issuers located in or<br />
deriving a significant portion of their<br />
revenues from, or for which the<br />
principal securities trading market<br />
is in any foreign country.<br />
FUND REFERENCE<br />
CLASS A CLASS C<br />
Fund No. 191 291<br />
CUSIP 353 61F 303 353 61F 709<br />
Symbol FINEX FCFSX<br />
Inception1 9/20/91 7/1/98<br />
ADVISOR 89<br />
Fund No. 691<br />
CUSIP 353 61F 501<br />
Symbol FTFAX<br />
Inception 1 9/20/91<br />
✕ Current<br />
Historical<br />
ANNUAL PROSPECTUS UPDATE AVAILABLE:<br />
March 1<br />
PORTFOLIO MANAGER PROFILE84 Bradley Radin, CFA<br />
Joined <strong>Franklin</strong> <strong>Templeton</strong> in 1995<br />
Managed Fund since 2007<br />
Harlan Hodes, CPA<br />
Joined <strong>Franklin</strong> <strong>Templeton</strong> in 2001<br />
Managed Fund since 2007<br />
MAXIMUM SALES CHARGE & COMMISSION<br />
CLASS A CLASS C73 Sales Charge 5.75% 0.00%<br />
<strong>Dealer</strong> Concession 5.00 1.00<br />
12b-1 Fee to <strong>Dealer</strong> 0.25 1.00<br />
ADVISOR89 Sales Charge 0.00%<br />
<strong>Dealer</strong> Concession 0.00<br />
12b-1 Fee to <strong>Dealer</strong> 0.00<br />
See page 128 for more commission<br />
information and page 125 for footnotes.<br />
PERFORMANCE INFORMATION<br />
5, 13<br />
ANNUAL TOTAL RETURN–WITHOUT SALES CHARGES<br />
1999 2000 2001 2002 2003 2004 2005 2006 2007 2008<br />
YTD<br />
200914 CLASS A<br />
CLASS C<br />
ADVISOR43 25.27 -3.25 -6.73 -3.57 46.66 19.81 11.22 23.86 8.10 -52.21 30.03<br />
24.24 -4.18 -7.44 -4.22 45.31 18.93 10.36 22.93 7.31 -52.56 29.54<br />
25.52 -3.04 -6.59 -3.32 47.16 20.19 11.49 24.17 8.37 -52.07 30.10<br />
AVERAGE ANNUAL TOTAL RETURN – AVERAGE ANNUAL TOTAL RETURN–<br />
WITHOUT SALES CHARGES5, 13 6, 13, 21<br />
WITH SALES CHARGES<br />
1 YR 3 YR 5 YR 10 YR INCEPTION 1 YR 3 YR 5 YR 10 YR INCEPTION<br />
CLASS A<br />
CLASS C<br />
ADVISOR43 -28.77 -8.09 1.10 4.27 6.87 -32.86 -9.89 -0.09 3.66 6.51<br />
-29.35 -8.78 0.34 3.47 3.42 -29.94 -8.78 0.34 3.47 3.42<br />
-28.66 -7.88 1.33 4.53 7.09 -28.66 -7.88 1.33 4.53 7.09<br />
Advisor Class shares are only offered to certain eligible investors as stated in the prospectus.<br />
PORTFOLIO HOLDINGS 29 6/30<br />
Total Number of Positions 86<br />
INDUSTRY BREAKDOWN<br />
Consumer Durables & Apparel 13.34%<br />
Technology Hardware & Equipment 11.25<br />
Banks 10.89<br />
Capital Goods 7.57<br />
Diversified Financials 7.27<br />
Commercial & Professional Services 6.53<br />
Retailing 6.22<br />
Materials 5.63<br />
Consumer Services 3.45<br />
Food, Beverage & Tobacco 2.98<br />
GEOGRAPHIC BREAKDOWN<br />
Asia 48.95%<br />
Europe 28.41<br />
Australia/New Zealand 8.34<br />
North America 7.46<br />
Latin America/Caribbean 1.33<br />
TOP 10 HOLDINGS7 Texwinca Holdings Ltd. 2.48%<br />
Barco NV<br />
Bank of Ayudhya Public<br />
2.32<br />
Company Ltd. 2.22<br />
Yule Catto & Company PLC 2.18<br />
Dah Sing Financial Holdings Ltd. 2.17<br />
Henderson Group PLC 2.17<br />
Fiberweb PLC 2.09<br />
Busan Bank 2.02<br />
Glow Energy Public Company Ltd. 1.98<br />
Canaccord Capital Inc. 1.95<br />
ANNUAL TOTAL RETURN 5 –CLASS A<br />
WITHOUT SALES CHARGES<br />
0<br />
11.22%<br />
23.86%<br />
8.10%<br />
-52.21%<br />
2005 2006 2007 2008<br />
HYPOTHETICAL INVESTMENT 22<br />
CLASS A CLASS C ADVISOR43 $10,000 from Inception $30,708 $14,471 $33,812<br />
FUND FACTS<br />
Net Assets (millions)<br />
Expense Ratio2 Net Asset Value<br />
Public Offering Price<br />
Beta 3<br />
Standard Deviation 65<br />
FUND DISTRIBUTIONS<br />
Dividend Frequency<br />
Annually in December.<br />
Dividend History 30<br />
12/08<br />
10/08<br />
12/07<br />
Capital Gains (last 12 mos.) 30<br />
Short-Term<br />
Long-Term<br />
30.03%<br />
YTD 2009 14<br />
6/30/09<br />
CLASS A CLASS C ADVISOR<br />
$99.0 $11.2 $9.7<br />
1.53% 2.28% 1.28%<br />
$10.09 $9.78 $10.07<br />
$10.71 $9.78 $10.07<br />
1.08 1.08 1.08<br />
31.31 31.34 31.34<br />
CLASS A CLASS C ADVISOR<br />
$0.4470 $0.3384 $0.5082<br />
— — —<br />
0.2791 0.1595 0.3217<br />
— — —<br />
1.2861 1.2861 1.2861<br />
ASSET ALLOCATION 29, 60 6/30<br />
Stocks 94%<br />
Cash 6%<br />
DEALER USE ONLY/NOT FOR DISTRIBUTION TO THE PUBLIC Go to franklintempleton.com or call (800) 223-2141 <strong>Dealer</strong> <strong>Facts</strong> <strong>Guide</strong> 55<br />
OPEN-END FUNDS VALUE BLEND GROWTH SECTOR GLOBAL INTERNATIONAL HYBRID ASSET ALLOCATION FIXED INCOME TAX-FREE INCOME
OPEN-END FUNDS<br />
VALUE<br />
BLEND<br />
GROWTH<br />
SECTOR<br />
GLOBAL<br />
INTERNATIONAL<br />
HYBRID<br />
ASSET ALLOCATION<br />
FIXED INCOME<br />
TAX-FREE INCOME<br />
<strong>Templeton</strong> Frontier Markets Fund<br />
INVESTMENT CATEGORY<br />
International<br />
PRIMARY INVESTMENT 37<br />
Seeks long-term capital appreciation<br />
by normally investing at least 80%<br />
of its net assets in securities of<br />
companies located in “frontier<br />
market countries”—those companies<br />
that are organized under the laws<br />
of, have a principal office in, or<br />
have their principal trading market<br />
in frontier market countries; or<br />
derive a substantial share of their<br />
total revenue or profit from either<br />
goods or services produced or sales<br />
made in, frontier market countries.<br />
FUND REFERENCE<br />
CLASS A CLASS C<br />
Fund No. 096 296<br />
CUSIP 880 19R 674 880 19R 666<br />
Symbol — —<br />
Inception1 10/14/08 10/14/08<br />
CLASS R ADVISOR89 Fund No. 896 674<br />
CUSIP 880 19R 658 880 19R 641<br />
Symbol — —<br />
Inception1 10/14/08 10/14/08<br />
ANNUAL PROSPECTUS UPDATE AVAILABLE:<br />
October 14<br />
PORTFOLIO MANAGER PROFILE<br />
Mark Mobius, Ph.D.<br />
Joined <strong>Franklin</strong> <strong>Templeton</strong> in 1987<br />
Managed Fund since 2008<br />
Sven Richter<br />
Joined <strong>Franklin</strong> <strong>Templeton</strong> in 1995<br />
Managed Fund since 2008<br />
Johan Meyer<br />
Joined <strong>Franklin</strong> <strong>Templeton</strong> in 2004<br />
Managed Fund since 2008<br />
MAXIMUM SALES CHARGE & COMMISSION<br />
CLASS A CLASS C73 Sales Charge 5.75% 0.00%<br />
<strong>Dealer</strong> Concession 5.00 1.00<br />
12b-1 Fee to <strong>Dealer</strong> 0.25 1.00<br />
CLASS R ADVISOR89 Sales Charge 0.00% 0.00%<br />
<strong>Dealer</strong> Concession 0.00 0.00<br />
12b-1 Fee to <strong>Dealer</strong> 0.50 0.00<br />
See page 128 for more commission<br />
information and page 125 for footnotes.<br />
PERFORMANCE INFORMATION<br />
5 ,9<br />
ANNUAL TOTAL RETURN–WITHOUT SALES CHARGES<br />
1999 2000 2001 2002 2003 2004 2005 2006 2007 2008<br />
YTD<br />
200914 CLASS A — — — — — — — — — — 22.99<br />
CLASS C — — — — — — — — — — 22.51<br />
ADVISOR — — — — — — — — — — 22.94<br />
AVERAGE ANNUAL TOTAL RETURN – AVERAGE ANNUAL TOTAL RETURN–<br />
WITHOUT SALES CHARGES5, 9 6, 9<br />
WITH SALES CHARGES<br />
6/30/09<br />
1 YR 3 YR 5 YR 10 YR INCEPTION 1 YR 3 YR 5 YR 10 YR INCEPTION<br />
CLASS A — — — — 20.90 — — — — 13.95<br />
CLASS C — — — — 20.30 — — — — 19.30<br />
ADVISOR — — — — 21.10 — — — — 21.10<br />
Advisor Class shares are only offered to certain eligible investors as stated in the prospectus.<br />
PORTFOLIO HOLDINGS 29 6/30<br />
Total Number of Positions 82<br />
INDUSTRY BREAKDOWN<br />
Banks 18.86%<br />
Telecommunication Services 15.59<br />
Food, Beverage & Tobacco 12.23<br />
Materials 7.70<br />
Transportation<br />
Pharmaceuticals, Biotechnology &<br />
4.60<br />
Life Sciences 3.54<br />
Consumer Services 3.46<br />
Diversified Financials 3.04<br />
Energy 2.90<br />
Household & Personal Products 2.15<br />
GEOGRAPHIC BREAKDOWN<br />
Mid-East/Africa 46.56%<br />
Asia 12.32<br />
Europe 11.00<br />
Latin America/Caribbean 7.58<br />
TOP 10 HOLDINGS7 MTN Group Ltd. 4.31%<br />
Arab Bank PLC 2.98<br />
East African Breweries 2.62<br />
Grindeks<br />
British American Tobacco Kenya<br />
2.36<br />
Limited Corp. 2.30<br />
PZ Cussons PLC 2.15<br />
Credicorp Ltd. 1.80<br />
Qatar National Bank 1.78<br />
Mauritius Commercial Bank 1.70<br />
Press Corp Ltd. 1.69<br />
ANNUAL TOTAL RETURN 5, 9 –CLASS A<br />
WITHOUT SALES CHARGES<br />
0<br />
2005 2006 2007 2008<br />
9, 22<br />
HYPOTHETICAL INVESTMENT<br />
CLASS A CLASS C ADVISOR<br />
$10,000 from Inception $11,395 $11,930 $12,110<br />
22.99%<br />
YTD 2009 14<br />
FUND FACTS<br />
Net Assets (millions)<br />
2, 9<br />
Expense Ratio<br />
without waiver<br />
with waiver<br />
Net Asset Value<br />
Public Offering Price<br />
ASSET ALLOCATION 29, 60 6/30<br />
Stocks 77%<br />
Cash 23%<br />
CLASS A CLASS C ADVISOR<br />
$7.7 $0.4 $1.6<br />
— — —<br />
— — —<br />
— — —<br />
56 <strong>Dealer</strong> <strong>Facts</strong> <strong>Guide</strong> Go to franklintempleton.com or call (800) 223-2141 DEALER USE ONLY/NOT FOR DISTRIBUTION TO THE PUBLIC<br />
Beta 3<br />
Standard Deviation 65<br />
FUND DISTRIBUTIONS<br />
Dividend Frequency<br />
Annually.<br />
Dividend History 30<br />
12/08<br />
Capital Gains (last 12 mos.) 30<br />
Short-Term<br />
Long-Term<br />
2.40% 3.10% 2.10%<br />
2.15% 2.85% 1.85%<br />
$12.09 $12.03 $12.11<br />
$12.83 $12.03 $12.11<br />
— — —<br />
— — —<br />
CLASS A CLASS C ADVISOR
<strong>Franklin</strong> Balanced Fund<br />
OVERALL MORNINGSTAR<br />
RATINGTM 8, 67<br />
– CLASS A<br />
TM 67<br />
MORNINGSTAR STYLE BOX<br />
STYLE<br />
Value Blend Growth<br />
SIZE<br />
✕<br />
Large<br />
Medium<br />
Small<br />
✕ Current<br />
Historical<br />
INVESTMENT CATEGORY<br />
Hybrid<br />
PRIMARY INVESTMENT 37<br />
The fund will invest in a diversified<br />
portfolio of common stocks (mostly<br />
dividend paying), convertible<br />
securities, and investment grade<br />
fixed income securities.<br />
FUND REFERENCE<br />
CLASS A CLASS C<br />
Fund No. 424 517<br />
CUSIP 353 612 682 353 612 674<br />
Symbol FBLAX FBMCX<br />
Inception1 7/3/06 7/3/06<br />
CLASS R ADVISOR 89<br />
Fund No. 817 624<br />
CUSIP 353 612 666 353 612 658<br />
Symbol — —<br />
Inception1 7/3/06 7/3/06<br />
ANNUAL PROSPECTUS UPDATE AVAILABLE:<br />
March 1<br />
PORTFOLIO MANAGER PROFILE84 Edward D. Perks, CFA<br />
Joined <strong>Franklin</strong> <strong>Templeton</strong> in 1992<br />
Managed Fund since 2006<br />
Alan E. Muschott, CFA<br />
Joined <strong>Franklin</strong> <strong>Templeton</strong> in 1998<br />
Managed Fund since 2006<br />
Shawn Lyons, CFA<br />
Joined <strong>Franklin</strong> <strong>Templeton</strong> in 1996<br />
Managed Fund since 2006<br />
MAXIMUM SALES CHARGE & COMMISSION<br />
CLASS A CLASS C73 Sales Charge 5.75% 0.00%<br />
<strong>Dealer</strong> Concession 5.00 1.00<br />
12b-1 Fee to <strong>Dealer</strong> 0.25 1.00<br />
CLASS R ADVISOR 89<br />
Sales Charge 0.00% 0.00%<br />
<strong>Dealer</strong> Concession 0.00 0.00<br />
12b-1 Fee to <strong>Dealer</strong> 0.50 0.00<br />
See page 128 for more commission<br />
information and page 125 for footnotes.<br />
PERFORMANCE INFORMATION<br />
5, 9<br />
ANNUAL TOTAL RETURN–WITHOUT SALES CHARGES<br />
1999 2000 2001 2002 2003 2004 2005 2006 2007 2008<br />
YTD<br />
2009 14<br />
CLASS A — — — — — — — — 4.15 -32.82 14.69<br />
CLASS C — — — — — — — — 3.46 -33.29 14.31<br />
ADVISOR — — — — — — — — 4.56 -32.64 14.81<br />
AVERAGE ANNUAL TOTAL RETURN– AVERAGE ANNUAL TOTAL RETURN–<br />
WITHOUT SALES CHARGES5, 9 6, 9<br />
WITH SALES CHARGES<br />
1 YR 3 YR 5 YR 10 YR INCEPTION 1 YR 3 YR 5 YR 10 YR INCEPTION<br />
CLASS A -18.53 — — — -4.18 -23.19 — — — -6.06<br />
CLASS C -19.16 — — — -4.83 -19.93 — — — -4.83<br />
ADVISOR -18.36 — — — -3.88 -18.36 — — — -3.88<br />
Advisor Class shares are only offered to certain eligible investors as stated in the prospectus.<br />
PORTFOLIO HOLDINGS 29 5/31<br />
Total Number of Positions 118<br />
PORTFOLIO BREAKDOWN<br />
Information Technology 11.33%<br />
Health Care 7.99<br />
Utilities 7.38<br />
Financials 6.35<br />
Industrials 6.21<br />
Materials 6.01<br />
Energy 5.25<br />
Consumer Staples 2.75<br />
Consumer Discretionary 2.49<br />
Telecommunication Services 1.34<br />
TOP 5 STOCK HOLDINGS<br />
Microsoft Corp. 2.84%<br />
CVS Caremark Corp. 1.82<br />
Halliburton Co. 1.56<br />
Southern Co. 1.55<br />
Johnson & Johnson 1.50<br />
TOP 5 BOND HOLDINGS<br />
J.P. Morgan Chase & Co. 1.65%<br />
Altria Group Inc. 1.55<br />
Illinois Power Co. 1.52<br />
Target Corp. 1.43<br />
Weatherford International Ltd. 1.34<br />
ANNUAL TOTAL RETURN 5, 9 –CLASS A<br />
WITHOUT SALES CHARGES<br />
0<br />
4.15%<br />
-32.82%<br />
2005 2006 2007 2008<br />
9, 22<br />
HYPOTHETICAL INVESTMENT<br />
CLASS A CLASS C ADVISOR<br />
$10,000 from Inception $8,294 $8,622 $8,882<br />
FUND FACTS<br />
Net Assets (millions)<br />
2, 9<br />
Expense Ratio<br />
without waiver<br />
with waiver<br />
Net Asset Value<br />
Public Offering Price<br />
Beta 3<br />
Standard Deviation 65<br />
FUND DISTRIBUTIONS<br />
Dividend Frequency<br />
Monthly.<br />
9, 15<br />
Distribution Rate<br />
Dividend History 30<br />
6/09<br />
5/09<br />
4/09<br />
Capital Gains (last 12 mos.) 30<br />
Short-Term<br />
Long-Term<br />
14.69%<br />
YTD 2009 14<br />
6/30/09<br />
CLASS A CLASS C ADVISOR<br />
$65.4 $12.8 $1.3<br />
1.38% 2.04% 1.08%<br />
1.03% 1.69% 0.73%<br />
$7.63 $7.58 $7.64<br />
$8.10 $7.58 $7.64<br />
— — —<br />
— — —<br />
CLASS A CLASS C ADVISOR<br />
4.44% 4.05% 4.93%<br />
$0.0300 $0.0256 $0.0314<br />
0.0300 0.0267 0.0313<br />
0.0300 0.0267 0.0313<br />
— — —<br />
— — —<br />
ASSET ALLOCATION 29, 60 5/31<br />
Stocks 57%<br />
Bonds 36%<br />
Cash 7%<br />
DEALER USE ONLY/NOT FOR DISTRIBUTION TO THE PUBLIC Go to franklintempleton.com or call (800) 223-2141 <strong>Dealer</strong> <strong>Facts</strong> <strong>Guide</strong> 57<br />
OPEN-END FUNDS VALUE BLEND GROWTH SECTOR GLOBAL INTERNATIONAL HYBRID ASSET ALLOCATION FIXED INCOME TAX-FREE INCOME
OPEN-END FUNDS<br />
VALUE<br />
BLEND<br />
GROWTH<br />
SECTOR<br />
GLOBAL<br />
INTERNATIONAL<br />
HYBRID<br />
ASSET ALLOCATION<br />
FIXED INCOME<br />
TAX-FREE INCOME<br />
<strong>Franklin</strong> Convertible Securities Fund<br />
INVESTMENT CATEGORY<br />
Hybrid<br />
PRIMARY INVESTMENT 37<br />
Domestic or foreign convertible<br />
securities and common stocks<br />
received upon conversion or<br />
exchange of such securities.<br />
FUND REFERENCE<br />
CLASS A CLASS C<br />
Fund No. 137 237<br />
CUSIP 353 612 104 353 612 880<br />
Symbol FISCX FROTX<br />
Inception1 4/15/87 10/2/95<br />
ADVISOR 89<br />
Fund No. 637<br />
CUSIP 353 612 641<br />
Symbol —<br />
Inception 1 4/15/87<br />
ANNUAL PROSPECTUS UPDATE AVAILABLE:<br />
March 1<br />
PORTFOLIO MANAGER PROFILE84 Alan E. Muschott, CFA<br />
Joined <strong>Franklin</strong> <strong>Templeton</strong> in 1998<br />
Managed Fund since 2002<br />
Edward D. Perks, CFA<br />
Joined <strong>Franklin</strong> <strong>Templeton</strong> in 1992<br />
Managed Fund since 1998<br />
Matt Quinlan, CFA<br />
Joined <strong>Franklin</strong> <strong>Templeton</strong> in 2005<br />
Managed Fund since 2007<br />
MAXIMUM SALES CHARGE & COMMISSION<br />
CLASS A CLASS C73 Sales Charge 5.75% 0.00%<br />
<strong>Dealer</strong> Concession 5.00 1.00<br />
12b-1 Fee to <strong>Dealer</strong> 0.25 1.00<br />
ADVISOR89 Sales Charge 0.00%<br />
<strong>Dealer</strong> Concession 0.00<br />
12b-1 Fee to <strong>Dealer</strong> 0.00<br />
See page 127 for more commission<br />
information and page 124 for footnotes.<br />
PORTFOLIO HOLDINGS 29 5/31<br />
Total Number of Positions 64<br />
PORTFOLIO BREAKDOWN<br />
Health Care 24.08%<br />
Information Technology 16.56<br />
Consumer Discretionary 12.04<br />
Financials 10.86<br />
Materials 7.13<br />
Industrials 6.80<br />
Utilities 6.79<br />
Energy 4.98<br />
Consumer Staples 2.27<br />
Telecommunication Services 2.20<br />
TOP 10 HOLDINGS7 Carnival Corp. 2.77%<br />
Mylan Inc. 2.58<br />
Medtronic Inc. 2.57<br />
Schering-Plough Corp. 2.52<br />
Best Buy Company Inc. 2.49<br />
CapitalSource Inc. 2.47<br />
Intel Corp. 2.44<br />
Cephalon Inc. 2.42<br />
L-3 Communications Corp. 2.33<br />
Celanese Corp. 2.30<br />
ANNUAL TOTAL RETURN 5 –CLASS A<br />
WITHOUT SALES CHARGES<br />
0<br />
6.93%<br />
12.15%<br />
0.50% -35.38%<br />
2005 2006 2007 2008<br />
HYPOTHETICAL INVESTMENT 22<br />
$10,000 from Inception<br />
FUND FACTS<br />
Net Assets (millions)<br />
Expense Ratio 2<br />
Net Asset Value<br />
Public Offering Price<br />
Beta 3<br />
Standard Deviation 65<br />
6/30/09<br />
PERFORMANCE INFORMATION<br />
5, 13<br />
ANNUAL TOTAL RETURN–WITHOUT SALES CHARGES<br />
1999 2000 2001 2002 2003 2004 2005 2006 2007 2008<br />
YTD<br />
200914 CLASS A<br />
CLASS C<br />
ADVISOR43 21.15 15.36 0.81 -15.55 35.44 16.02 6.93 12.15 0.50 -35.38 19.84<br />
20.27 14.60 0.00 -16.17 34.51 15.10 6.16 11.30 -0.19 -35.88 19.45<br />
21.15 15.36 0.81 -15.55 35.44 16.02 6.93 12.15 0.50 -35.23 19.96<br />
AVERAGE ANNUAL TOTAL RETURN – AVERAGE ANNUAL TOTAL RETURN–<br />
WITHOUT SALES CHARGES5, 13 6, 13, 47<br />
WITH SALES CHARGES<br />
1 YR 3 YR 5 YR 10 YR INCEPTION 1 YR 3 YR 5 YR 10 YR INCEPTION<br />
CLASS A<br />
CLASS C<br />
ADVISOR43 -19.13 -5.44 0.25 4.97 8.13 -23.76 -7.28 -0.93 4.36 7.84<br />
-19.73 -6.14 -0.49 4.20 5.55 -20.48 -6.14 -0.49 4.20 5.55<br />
-18.91 -5.34 0.32 5.01 8.15 -18.91 -5.34 0.32 5.01 8.15<br />
Advisor Class shares are only offered to certain eligible investors as stated in the prospectus.<br />
CLASS A CLASS C ADVISOR43 $53,485 $21,027 $56,923<br />
CLASS A CLASS C ADVISOR<br />
$475.9 $168.3 $9.5<br />
0.91% 1.65% 0.66%<br />
$10.81 $10.71 $10.81<br />
$11.47 $10.71 $10.81<br />
1.14 1.14 1.14<br />
20.18 20.14 20.17<br />
FUND DISTRIBUTIONS<br />
Dividend Frequency<br />
Quarterly.<br />
CLASS A CLASS C ADVISOR<br />
Distribution Rate15 4, 30<br />
Dividend History<br />
7.49% 7.26% 8.21%<br />
6/09<br />
$0.1326 $0.1145 $0.1385<br />
3/09<br />
0.0967 0.0858 0.1005<br />
12/08<br />
Capital Gains (last 4, 30<br />
12 mos.)<br />
0.1963 0.1709 0.2049<br />
Short-Term<br />
— — —<br />
Long-Term<br />
— — —<br />
19.84%<br />
YTD 2009 14<br />
ASSET ALLOCATION 29, 60 5/31<br />
Convertible Bonds 69%<br />
Convertible Preferred 26%<br />
Cash 3%<br />
Stocks 2%<br />
58 <strong>Dealer</strong> <strong>Facts</strong> <strong>Guide</strong> Go to franklintempleton.com or call (800) 223-2141 DEALER USE ONLY/NOT FOR DISTRIBUTION TO THE PUBLIC
<strong>Franklin</strong> Equity Income Fund<br />
OVERALL MORNINGSTAR<br />
RATINGTM 8, 67<br />
– CLASS A<br />
TM 67<br />
MORNINGSTAR STYLE BOX<br />
STYLE<br />
Value Blend Growth<br />
SIZE<br />
✕<br />
Large<br />
Medium<br />
Small<br />
✕ Current<br />
Historical<br />
INVESTMENT CATEGORY<br />
Hybrid<br />
PRIMARY INVESTMENT 37<br />
Common stocks of financially strong<br />
domestic and foreign companies<br />
with high current dividend yields<br />
relative to the average dividend yield<br />
of the general U.S. stock market, as<br />
measured by the S&P 500 ® Index.<br />
The fund also invests in securities<br />
convertible to common stock.<br />
FUND REFERENCE<br />
CLASS A CLASS C<br />
Fund No. 139 239<br />
CUSIP 353 612 401 353 612 807<br />
Symbol FISEX FRETX<br />
Inception1 3/15/88 10/2/95<br />
CLASS R ADVISOR 89<br />
Fund No. 839 639<br />
CUSIP 353 612 740 353 612 633<br />
Symbol FREIX —<br />
Inception1 3/15/88 3/15/88<br />
ANNUAL PROSPECTUS UPDATE AVAILABLE:<br />
March 1<br />
PORTFOLIO MANAGER PROFILE84 Alan E. Muschott, CFA<br />
Joined <strong>Franklin</strong> <strong>Templeton</strong> in 1998<br />
Managed Fund since 2005<br />
Edward D. Perks, CFA<br />
Joined <strong>Franklin</strong> <strong>Templeton</strong> in 1992<br />
Managed Fund since 2005<br />
Frank Felicelli, CFA<br />
Joined <strong>Franklin</strong> <strong>Templeton</strong> in 1986<br />
Managed Fund since 1988<br />
MAXIMUM SALES CHARGE & COMMISSION<br />
CLASS A CLASS C73 Sales Charge 5.75% 0.00%<br />
<strong>Dealer</strong> Concession 5.00 1.00<br />
12b-1 Fee to <strong>Dealer</strong> 0.25 1.00<br />
CLASS R ADVISOR 89<br />
Sales Charge 0.00% 0.00%<br />
<strong>Dealer</strong> Concession 0.00 0.00<br />
12b-1 Fee to <strong>Dealer</strong> 0.50 0.00<br />
See page 128 for more commission<br />
information and page 125 for footnotes.<br />
PERFORMANCE INFORMATION<br />
5, 13<br />
ANNUAL TOTAL RETURN–WITHOUT SALES CHARGES<br />
1999 2000 2001 2002 2003 2004 2005 2006 2007 2008<br />
YTD<br />
2009 14<br />
CLASS A<br />
CLASS C<br />
ADVISOR43 0.80 18.60 -1.33 -15.11 24.89 10.47 3.21 16.36 -3.55 -35.36 3.18<br />
0.05 17.75 -2.09 -15.72 23.95 9.64 2.45 15.52 -4.29 -35.84 2.84<br />
0.80 18.60 -1.33 -15.11 24.89 10.47 3.21 16.36 -3.55 -35.25 3.38<br />
AVERAGE ANNUAL TOTAL RETURN– AVERAGE ANNUAL TOTAL RETURN–<br />
WITHOUT SALES CHARGES5, 13 6, 13, 47<br />
WITH SALES CHARGES<br />
1 YR 3 YR 5 YR 10 YR INCEPTION 1 YR 3 YR 5 YR 10 YR INCEPTION<br />
CLASS A<br />
CLASS C<br />
ADVISOR43 -24.49 -10.41 -3.73 -0.10 7.09 -28.84 -12.16 -4.86 -0.69 6.79<br />
-25.03 -11.05 -4.43 -0.84 3.35 -25.75 -11.05 -4.43 -0.84 3.35<br />
-24.23 -10.30 -3.66 -0.06 7.11 -24.23 -10.30 -3.66 -0.06 7.11<br />
Advisor Class shares are only offered to certain eligible investors as stated in the prospectus.<br />
PORTFOLIO HOLDINGS 29 6/30<br />
Total Number of Positions 52<br />
PORTFOLIO BREAKDOWN<br />
Health Care 15.44%<br />
Information Technology 14.12<br />
Industrials 12.87<br />
Energy 10.96<br />
Financials 10.37<br />
Utilities 7.91<br />
Consumer Staples 7.13<br />
Consumer Discretionary 5.53<br />
Materials 3.21<br />
Telecommunication Services 1.65<br />
TOP 10 HOLDINGS7 Wells Fargo & Co. 3.31%<br />
Microsoft Corp. 3.13<br />
Johnson & Johnson 3.06<br />
Schering-Plough Corp. 3.02<br />
Roche Holding AG 2.99<br />
Mylan Inc. 2.96<br />
Coca-Cola Co. 2.78<br />
Bank of America Corp. 2.64<br />
Microchip Technology Inc. 2.59<br />
IBM Corp. 2.56<br />
ANNUAL TOTAL RETURN 5 –CLASS A<br />
WITHOUT SALES CHARGES<br />
16.36%<br />
3.21%<br />
0<br />
-3.55%<br />
-35.36%<br />
2005 2006 2007 2008<br />
HYPOTHETICAL INVESTMENT 22<br />
$10,000 from Inception<br />
FUND FACTS<br />
Net Assets (millions)<br />
Expense Ratio 2<br />
Net Asset Value<br />
Public Offering Price<br />
Beta 3<br />
Standard Deviation 65<br />
6/30/09<br />
CLASS A CLASS C ADVISOR 43<br />
$40,539 $15,741 $43,166<br />
CLASS A CLASS C ADVISOR<br />
$469.5 $78.7 $1.3<br />
0.97% 1.72% 0.72%<br />
$12.46 $12.41 $12.47<br />
$13.22 $12.41 $12.47<br />
0.87 0.87 0.87<br />
19.09 19.10 19.07<br />
FUND DISTRIBUTIONS<br />
Dividend Frequency<br />
Monthly.<br />
CLASS A CLASS C ADVISOR<br />
Distribution Rate15 4, 30<br />
Dividend History<br />
3.18% 2.75% 3.58%<br />
6/09<br />
$0.0350 $0.0284 $0.0372<br />
5/09<br />
0.0350 0.0290 0.0370<br />
4/09<br />
Capital Gains (last 4, 30<br />
12 mos.)<br />
0.0350 0.0290 0.0370<br />
Short-Term<br />
— — —<br />
Long-Term<br />
— — —<br />
3.18%<br />
YTD 2009 14<br />
ASSET ALLOCATION 29, 60 6/30<br />
Stocks 89%<br />
Bonds 6%<br />
Cash 5%<br />
DEALER USE ONLY/NOT FOR DISTRIBUTION TO THE PUBLIC Go to franklintempleton.com or call (800) 223-2141 <strong>Dealer</strong> <strong>Facts</strong> <strong>Guide</strong> 59<br />
OPEN-END FUNDS VALUE BLEND GROWTH SECTOR GLOBAL INTERNATIONAL HYBRID ASSET ALLOCATION FIXED INCOME TAX-FREE INCOME
OPEN-END FUNDS<br />
VALUE<br />
BLEND<br />
GROWTH<br />
SECTOR<br />
GLOBAL<br />
INTERNATIONAL<br />
HYBRID<br />
ASSET ALLOCATION<br />
FIXED INCOME<br />
TAX-FREE INCOME<br />
<strong>Franklin</strong> Income Fund<br />
OVERALL MORNINGSTAR<br />
RATINGTM 8, 67<br />
– CLASS A<br />
TM 67<br />
MORNINGSTAR STYLE BOX<br />
STYLE<br />
Value Blend Growth<br />
SIZE<br />
✕<br />
Large<br />
Medium<br />
Small<br />
✕ Current<br />
Historical<br />
INVESTMENT CATEGORY<br />
Hybrid<br />
PRIMARY INVESTMENT 37<br />
Stocks and bonds, including foreign<br />
and higher-yielding, lower-rated<br />
securities, selected with particular<br />
consideration for their incomeproducing<br />
potential.<br />
FUND REFERENCE<br />
CLASS A CLASS C<br />
Fund No. 109 209<br />
CUSIP 353 496 300 353 496 805<br />
Symbol FKINX FCISX<br />
Inception1 8/31/48 5/1/95<br />
CLASS R ADVISOR89 Fund No. 809 609<br />
CUSIP 353 496 722 353 496 847<br />
Symbol FISRX FRIAX<br />
Inception1 8/31/48 8/31/48<br />
ANNUAL PROSPECTUS UPDATE AVAILABLE:<br />
February 1<br />
PORTFOLIO MANAGER PROFILE84 Edward D. Perks, CFA<br />
Joined <strong>Franklin</strong> <strong>Templeton</strong> in 1992<br />
Managed Fund since 2002<br />
Charles B. Johnson<br />
Joined <strong>Franklin</strong> <strong>Templeton</strong> in 1957<br />
Managed Fund since 1957<br />
MAXIMUM SALES CHARGE & COMMISSION<br />
CLASS A CLASS C73 Sales Charge 4.25% 0.00%<br />
<strong>Dealer</strong> Concession 4.00 1.00<br />
12b-1 Fee to <strong>Dealer</strong> 0.15 0.65<br />
CLASS R ADVISOR89 Sales Charge 0.00% 0.00%<br />
<strong>Dealer</strong> Concession 0.00 0.00<br />
12b-1 Fee to <strong>Dealer</strong> 0.50 0.00<br />
See page 128 for more commission<br />
information and page 125 for footnotes.<br />
PERFORMANCE INFORMATION<br />
ANNUAL TOTAL RETURN–WITHOUT SALES CHARGES5 YTD<br />
1999 2000 2001 2002 2003 2004 2005 2006 2007 2008 200914 CLASS A<br />
CLASS C<br />
ADVISOR43 -0.74 20.59 0.65 -1.06 30.96 12.17 1.85 19.12 5.31 -30.51 12.91<br />
-0.81 19.89 0.14 -1.54 30.16 11.56 1.32 18.89 4.35 -30.77 12.55<br />
-0.58 20.29 0.81 -0.92 31.32 12.40 2.01 19.39 5.08 -30.27 13.08<br />
AVERAGE ANNUAL TOTAL RETURN – AVERAGE ANNUAL TOTAL RETURN–<br />
WITHOUT SALES CHARGES5 6, 10<br />
WITH SALES CHARGES<br />
CLASS A<br />
CLASS C<br />
ADVISOR 43<br />
1 YR 3 YR 5 YR 10 YR INCEPTION 1 YR 3 YR 5 YR 10 YR INCEPTION<br />
-17.12 -2.57 2.14 5.51 10.29 -20.79 -3.97 1.29 5.07 10.21<br />
-17.83 -3.07 1.52 4.95 6.41 -18.59 -3.07 1.52 4.95 6.41<br />
-17.07 -2.31 2.30 5.64 10.34 -17.07 -2.31 2.30 5.64 10.34<br />
Advisor Class shares are only offered to certain eligible investors as stated in the prospectus.<br />
PORTFOLIO HOLDINGS 29 6/30<br />
Total Number of Positions 329<br />
PORTFOLIO BREAKDOWN<br />
Corporate Bonds 62.00%<br />
Utilities 12.46<br />
Financials 9.51<br />
Corporate Loans 5.84<br />
Energy 3.62<br />
Health Care 2.23<br />
Information Technology 1.34<br />
Materials 1.08<br />
Telecommunication Services 0.74<br />
TOP 10 STOCK HOLDINGS<br />
Bank of America Corp. 1.59%<br />
Merck & Company Inc. 1.55<br />
Canadian Oil Sands Trust 1.49<br />
Wells Fargo & Co. 1.32<br />
Public Service Enterprise Group Inc. 1.27<br />
Duke Energy Corp. 1.18<br />
Southern Co. 1.01<br />
PG&E Corp. 0.94<br />
Progress Energy Inc. 0.86<br />
Dominion Resources Inc. 0.85<br />
TOP 5 BOND HOLDINGS<br />
Ford Motor Credit Co. 4.84%<br />
Energy Future Holdings Corp. 3.47<br />
Tenet Healthcare Corp. 3.32<br />
Dynegy Holdings Inc. 2.60<br />
HCA Inc. 2.08<br />
ANNUAL TOTAL RETURN 5 –CLASS A<br />
WITHOUT SALES CHARGES<br />
19.12%<br />
1.85%<br />
0<br />
5.31%<br />
-30.51%<br />
2005 2006 2007 2008<br />
12.91%<br />
YTD 2009 14<br />
HYPOTHETICAL INVESTMENT 22<br />
$10,000 from Inception<br />
FUND FACTS<br />
Net Assets (millions)<br />
Expense Ratio 2<br />
Net Asset Value<br />
Public Offering Price<br />
Beta 3<br />
Standard Deviation 65<br />
FUND DISTRIBUTIONS<br />
6/30/09<br />
CLASS A CLASS C ADVISOR43 $3,710,139 $24,116 $3,970,694<br />
CLASS A CLASS C ADVISOR<br />
$24,447.3 $11,308.2 $3,398.3<br />
Dividend Frequency<br />
Monthly on the 3rd business day.<br />
CLASS A CLASS C ADVISOR<br />
Distribution Rate15 4, 30<br />
Dividend History<br />
7.98% 7.89% 8.51%<br />
6/09<br />
$0.0125 $0.0119 $0.0127<br />
5/09<br />
0.0125 0.0119 0.0127<br />
4/09<br />
Capital Gains (last 4, 30<br />
12 mos.)<br />
0.0125 0.0119 0.0127<br />
Short-Term<br />
0.0012 0.0012 0.0012<br />
Long-Term<br />
— — —<br />
ASSET ALLOCATION 29, 60 6/30<br />
Bonds 68%<br />
Stocks 32%<br />
Cash 1%<br />
0.62% 1.12% 0.47%<br />
$1.80 $1.81 $1.79<br />
$1.88 $1.81 $1.79<br />
1.18 1.18 1.19<br />
17.15 17.35 17.43<br />
60 <strong>Dealer</strong> <strong>Facts</strong> <strong>Guide</strong> Go to franklintempleton.com or call (800) 223-2141 DEALER USE ONLY/NOT FOR DISTRIBUTION TO THE PUBLIC
<strong>Templeton</strong> Income Fund<br />
OVERALL MORNINGSTAR<br />
RATINGTM 8, 67<br />
– CLASS A<br />
TM 67<br />
MORNINGSTAR STYLE BOX<br />
STYLE<br />
Value Blend Growth<br />
SIZE<br />
✕<br />
Large<br />
Medium<br />
Small<br />
✕ Current<br />
Historical<br />
INVESTMENT CATEGORY<br />
Hybrid<br />
PRIMARY INVESTMENT 37<br />
Stocks with attractive dividend<br />
yields and bonds, worldwide. The<br />
fund’s equity component generally<br />
is comprised of dividend-yielding<br />
stocks on <strong>Templeton</strong>’s approved list.<br />
The fund’s fixed income component<br />
primarily is comprised of both<br />
developed and developing country<br />
government and agency bonds and<br />
investment grade and less than<br />
investment grade corporate and<br />
emerging market debt securities.<br />
FUND REFERENCE<br />
CLASS A CLASS C<br />
Fund No. 425 525<br />
CUSIP 880 19R 799 880 19R 781<br />
Symbol TINCX TCINX<br />
Inception1 7/1/05 7/1/05<br />
CLASS R ADVISOR 89<br />
Fund No. 825 625<br />
CUSIP 880 19R 773 880 19R 765<br />
Symbol — TZINX<br />
Inception1 7/1/05 7/1/05<br />
ANNUAL PROSPECTUS UPDATE AVAILABLE:<br />
August 1<br />
PORTFOLIO MANAGER PROFILE84 Lisa F. Myers, CFA<br />
Joined <strong>Franklin</strong> <strong>Templeton</strong> in 1996<br />
Managed Fund since 2005<br />
Cindy L. Sweeting, CFA<br />
Joined <strong>Franklin</strong> <strong>Templeton</strong> in 1997<br />
Managed Fund since 2007<br />
Michael Hasenstab, Ph.D.<br />
Joined <strong>Franklin</strong> <strong>Templeton</strong> in 1995<br />
Managed Fund since 2005<br />
Christopher J. Molumphy, CFA<br />
Joined <strong>Franklin</strong> <strong>Templeton</strong> in 1988<br />
Managed Fund since 2005<br />
MAXIMUM SALES CHARGE & COMMISSION<br />
CLASS A CLASS C73 Sales Charge 4.25% 0.00%<br />
<strong>Dealer</strong> Concession 4.00 1.00<br />
12b-1 Fee to <strong>Dealer</strong> 0.25 0.65<br />
CLASS R ADVISOR 89<br />
Sales Charge 0.00% 0.00%<br />
<strong>Dealer</strong> Concession 0.00 0.00<br />
12b-1 Fee to <strong>Dealer</strong> 0.50 0.00<br />
See page 128 for more commission<br />
information and page 125 for footnotes.<br />
PERFORMANCE INFORMATION<br />
5, 9<br />
ANNUAL TOTAL RETURN–WITHOUT SALES CHARGES<br />
1999 2000 2001 2002 2003 2004 2005 2006 2007 2008<br />
YTD<br />
2009 14<br />
CLASS A — — — — — — — 21.30 10.42 -24.71 9.10<br />
CLASS C — — — — — — — 20.91 10.02 -25.01 8.92<br />
ADVISOR — — — — — — — 21.96 10.64 -24.40 8.69<br />
AVERAGE ANNUAL TOTAL RETURN– AVERAGE ANNUAL TOTAL RETURN–<br />
WITHOUT SALES CHARGES5, 9 6, 9<br />
WITH SALES CHARGES<br />
CLASS A<br />
CLASS C<br />
ADVISOR<br />
1 YR 3 YR 5 YR 10 YR INCEPTION 1 YR 3 YR 5 YR 10 YR INCEPTION<br />
-9.23 0.84 — — 3.16 -13.05 -0.63 — — 2.06<br />
-9.25 0.47 — — 2.81 -10.07 0.47 — — 2.81<br />
-9.32 0.94 — — 3.38 -9.32 0.94 — — 3.38<br />
Advisor Class shares are only offered to certain eligible investors as stated in the prospectus.<br />
PORTFOLIO HOLDINGS 29 6/30<br />
Total Number of Positions 339<br />
PORTFOLIO BREAKDOWN<br />
Government Securities 22.22%<br />
Consumer Discretionary 11.86<br />
Financials 10.79<br />
Telecommunication Services 7.31<br />
Health Care 7.14<br />
Energy 6.95<br />
Information Technology 6.16<br />
Industrials 5.65<br />
Materials 3.14<br />
Consumer Staples 2.16<br />
TOP 5 STOCK HOLDINGS<br />
Vodafone Group PLC 1.46%<br />
Singapore Telecommunications Ltd. 1.31<br />
Accenture Ltd. 1.22<br />
Vivendi 1.20<br />
Microsoft Corp. 1.19<br />
TOP 5 BOND HOLDINGS<br />
Government of Mexico 3.63%<br />
Korea Treasury Bond, 0475–1112 2.57<br />
Nota do Tesouro Nacional 1.70<br />
Korea Treasury Bond, senior note 1.41<br />
Queensland Treasury Corp. 1.18<br />
ANNUAL TOTAL RETURN 5, 9 –CLASS A<br />
WITHOUT SALES CHARGES<br />
21.30%<br />
0<br />
10.42%<br />
-24.71%<br />
2005 2006 2007 2008<br />
9.10%<br />
YTD 2009 14<br />
ASSET ALLOCATION 29, 60 6/30<br />
Bonds 46%<br />
Stocks 40%<br />
Cash 14%<br />
6/30/09<br />
9, 22<br />
HYPOTHETICAL INVESTMENT<br />
CLASS A CLASS C ADVISOR<br />
$10,000 from Inception $10,847 $11,169 $11,422<br />
FUND FACTS<br />
Net Assets (millions)<br />
2, 9<br />
Expense Ratio<br />
without waiver<br />
with waiver<br />
Net Asset Value<br />
Public Offering Price<br />
Beta 3<br />
Standard Deviation 65<br />
FUND DISTRIBUTIONS<br />
Dividend Frequency<br />
Quarterly.<br />
9, 15<br />
Distribution Rate<br />
Dividend History 30<br />
6/09<br />
3/09<br />
12/08<br />
Capital Gains (last 12 mos.) 30<br />
Short-Term<br />
Long-Term<br />
CLASS A CLASS C ADVISOR<br />
$485.8 $293.5 $23.3<br />
1.27% 1.67% 1.02%<br />
1.22% 1.62% 0.97%<br />
$2.24 $2.24 $2.24<br />
$2.34 $2.24 $2.24<br />
0.94 0.94 0.94<br />
13.80 13.76 13.77<br />
CLASS A CLASS C ADVISOR<br />
3.04% 2.80% 3.41%<br />
$0.0178 $0.0157 $0.0191<br />
0.0185 0.0172 0.0193<br />
0.0249 0.0219 0.0269<br />
— — —<br />
— — —<br />
DEALER USE ONLY/NOT FOR DISTRIBUTION TO THE PUBLIC Go to franklintempleton.com or call (800) 223-2141 <strong>Dealer</strong> <strong>Facts</strong> <strong>Guide</strong> 61<br />
OPEN-END FUNDS VALUE BLEND GROWTH SECTOR GLOBAL INTERNATIONAL HYBRID ASSET ALLOCATION FIXED INCOME TAX-FREE INCOME
OPEN-END FUNDS<br />
VALUE<br />
BLEND<br />
GROWTH<br />
SECTOR<br />
GLOBAL<br />
INTERNATIONAL<br />
HYBRID<br />
ASSET ALLOCATION<br />
FIXED INCOME<br />
TAX-FREE INCOME<br />
<strong>Franklin</strong> <strong>Templeton</strong> Corefolio Allocation Fund<br />
INVESTMENT CATEGORY<br />
Asset Allocation<br />
PRIMARY INVESTMENT 37<br />
<strong>Franklin</strong> <strong>Templeton</strong> Corefolio<br />
Allocation Fund seeks capital<br />
appreciation through a diversified,<br />
multi-disciplined approach. It targets<br />
both growth- and value-style<br />
investments by allocating approximately<br />
50% of its assets to <strong>Franklin</strong><br />
Growth Fund and approximately<br />
25% of its assets to Mutual Shares<br />
Fund and <strong>Templeton</strong> Growth<br />
Fund, respectively.<br />
FUND REFERENCE<br />
CLASS A CLASS C<br />
Fund No. 470 570<br />
CUSIP 354 72P 786 354 72P 760<br />
Symbol FTCOX FTCLX<br />
Inception1 8/15/03 8/15/03<br />
CLASS R ADVISOR 89<br />
Fund No. 870 670<br />
CUSIP 354 72P 752 354 72P 745<br />
Symbol — —<br />
Inception 1 8/15/03 8/15/03<br />
ANNUAL PROSPECTUS UPDATE AVAILABLE:<br />
May 1<br />
PORTFOLIO MANAGER PROFILE 84<br />
T. Anthony Coffey, CFA<br />
Joined <strong>Franklin</strong> <strong>Templeton</strong> in 1989<br />
Managed Fund since 2003<br />
MAXIMUM SALES CHARGE & COMMISSION<br />
CLASS A CLASS C73 Sales Charge 5.75% 0.00%<br />
<strong>Dealer</strong> Concession 5.00 1.00<br />
12b-1 Fee to <strong>Dealer</strong> 0.25 1.00<br />
CLASS R ADVISOR89 Sales Charge 0.00% 0.00%<br />
<strong>Dealer</strong> Concession 0.00 0.00<br />
12b-1 Fee to <strong>Dealer</strong> 0.50 0.00<br />
See page 128 for more commission<br />
information and page 125 for footnotes.<br />
PORTFOLIO HOLDINGS29 TOP 10 HOLDINGS<br />
6/30<br />
7<br />
Apple Inc. 2.36%<br />
Microsoft Corp. 1.59<br />
Amgen Inc. 1.59<br />
Johnson & Johnson 1.36<br />
Wyeth 1.24<br />
Cisco Systems Inc. 1.18<br />
IBM Corp. 1.15<br />
Pfizer Inc. 1.10<br />
General Dynamics Corp. 1.05<br />
United Technologies Corp. 1.05<br />
ANNUAL TOTAL RETURN 5, 9 –CLASS A<br />
WITHOUT SALES CHARGES<br />
15.25%<br />
6.63%<br />
5.20%<br />
-38.13%<br />
0<br />
2005 2006 2007 2008<br />
ASSET ALLOCATION 29, 60 6/30<br />
<strong>Franklin</strong> Growth Fund 50%<br />
<strong>Templeton</strong><br />
Growth Fund 25%<br />
Mutual Shares Fund 25%<br />
6/30/09<br />
PERFORMANCE INFORMATION<br />
5, 9<br />
ANNUAL TOTAL RETURN–WITHOUT SALES CHARGES<br />
1999 2000 2001 2002 2003 2004 2005 2006 2007 2008<br />
YTD<br />
200914 CLASS A — — — — — 11.67 6.63 15.25 5.20 -38.13 6.33<br />
CLASS C — — — — — 10.88 6.02 14.48 4.50 -38.58 6.02<br />
ADVISOR — — — — — 11.98 6.93 15.65 5.53 -37.92 6.44<br />
AVERAGE ANNUAL TOTAL RETURN – AVERAGE ANNUAL TOTAL RETURN–<br />
WITHOUT SALES CHARGES5, 9 6, 9<br />
WITH SALES CHARGES<br />
1 YR 3 YR 5 YR 10 YR INCEPTION 1 YR 3 YR 5 YR 10 YR INCEPTION<br />
CLASS A -24.91 -8.35 -1.81 — 0.89 -29.22 -10.14 -2.97 — -0.12<br />
CLASS C -25.45 -8.96 -2.46 — 0.21 -26.19 -8.96 -2.46 — 0.21<br />
ADVISOR -24.72 -8.06 -1.50 — 1.19 -24.72 -8.06 -1.50 — 1.19<br />
Advisor Class shares are only offered to certain eligible investors as stated in the prospectus.<br />
9, 22<br />
HYPOTHETICAL INVESTMENT<br />
CLASS A CLASS C ADVISOR<br />
$10,000 from Inception $9,932 $10,122 $10,722<br />
FUND FACTS<br />
Net Assets (millions)<br />
9, 76<br />
Expense Ratio<br />
without waiver<br />
with waiver<br />
Net Asset Value<br />
Public Offering Price<br />
Beta 3<br />
Standard Deviation 65<br />
FUND DISTRIBUTIONS<br />
Dividend Frequency<br />
Semiannually.<br />
Dividend History 30<br />
6/09<br />
12/08<br />
3/08<br />
Capital Gains (last 12 mos.) 30<br />
Short-Term<br />
Long-Term<br />
6.33%<br />
YTD 2009 14<br />
CLASS A CLASS C ADVISOR<br />
$267.2 $94.6 $1.5<br />
1.34% 2.04% 1.04%<br />
1.12% 1.82% 0.82%<br />
$8.96 $8.87 $8.98<br />
$9.51 $8.87 $8.98<br />
0.98 0.98 0.98<br />
20.29 20.28 20.29<br />
CLASS A CLASS C ADVISOR<br />
$0.0354 $0.0354 $0.0354<br />
0.1162 0.0304 0.1529<br />
0.0155 0.0155 0.0155<br />
— — —<br />
— — —<br />
62 <strong>Dealer</strong> <strong>Facts</strong> <strong>Guide</strong> Go to franklintempleton.com or call (800) 223-2141 DEALER USE ONLY/NOT FOR DISTRIBUTION TO THE PUBLIC
<strong>Franklin</strong> <strong>Templeton</strong> Founding Funds Allocation Fund<br />
INVESTMENT CATEGORY<br />
Asset Allocation<br />
PRIMARY INVESTMENT 37<br />
<strong>Franklin</strong> <strong>Templeton</strong> Founding<br />
Funds Allocation Fund seeks capital<br />
appreciation through a diversified,<br />
value- oriented approach—investing<br />
in an equally weighted combination<br />
of <strong>Franklin</strong> Income Fund, Mutual<br />
Shares Fund and <strong>Templeton</strong><br />
Growth Fund. The fund seeks<br />
income as a secondary goal.<br />
FUND REFERENCE<br />
CLASS A CLASS C<br />
Fund No. 481 282<br />
CUSIP 354 72P 844 354 72P 828<br />
Symbol FFALX FFACX<br />
Inception1 8/15/03 8/15/03<br />
CLASS R ADVISOR89 Fund No. 871 671<br />
CUSIP 354 72P 810 354 72P 794<br />
Symbol FFARX FFAAX<br />
Inception1 8/15/03 8/15/03<br />
ANNUAL PROSPECTUS UPDATE AVAILABLE:<br />
May 1<br />
PORTFOLIO MANAGER PROFILE 84<br />
T. Anthony Coffey, CFA<br />
Joined <strong>Franklin</strong> <strong>Templeton</strong> in 1989<br />
Managed Fund since 2003<br />
MAXIMUM SALES CHARGE & COMMISSION<br />
CLASS A CLASS C 73<br />
Sales Charge 5.75% 0.00%<br />
<strong>Dealer</strong> Concession 5.00 1.00<br />
12b-1 Fee to <strong>Dealer</strong> 0.25 1.00<br />
CLASS R ADVISOR 89<br />
Sales Charge 0.00% 0.00%<br />
<strong>Dealer</strong> Concession 0.00 0.00<br />
12b-1 Fee to <strong>Dealer</strong> 0.50 0.00<br />
See page 128 for more commission<br />
information and page 125 for footnotes.<br />
PERFORMANCE INFORMATION<br />
5, 9<br />
ANNUAL TOTAL RETURN–WITHOUT SALES CHARGES<br />
1999 2000 2001 2002 2003 2004 2005 2006 2007 2008<br />
YTD<br />
200914 CLASS A — — — — — 13.58 6.31 19.34 3.12 -37.66 7.59<br />
CLASS C — — — — — 12.91 5.63 18.50 2.47 -38.04 7.19<br />
ADVISOR — — — — — 14.04 6.63 19.73 3.48 -37.44 7.69<br />
AVERAGE ANNUAL TOTAL RETURN – AVERAGE ANNUAL TOTAL RETURN–<br />
WITHOUT SALES CHARGES5, 9 6, 9<br />
WITH SALES CHARGES<br />
CLASS A<br />
CLASS C<br />
ADVISOR<br />
1 YR 3 YR 5 YR 10 YR INCEPTION 1 YR 3 YR 5 YR 10 YR INCEPTION<br />
-23.92 -7.93 -0.60 — 1.83 -28.30 -9.72 -1.76 — 0.80<br />
-24.43 -8.54 -1.25 — 1.16 -25.14 -8.54 -1.25 — 1.16<br />
-23.71 -7.65 -0.29 — 2.17 -23.71 -7.65 -0.29 — 2.17<br />
Advisor Class shares are only offered to certain eligible investors as stated in the prospectus.<br />
PORTFOLIO HOLDINGS 29 6/30<br />
TOP 10 HOLDINGS 7<br />
Microsoft Corp. 1.93%<br />
Comcast Corp. 1.31<br />
Oracle Corp. 1.09<br />
News Corp Inc. 1.07<br />
Siemens AG 1.03<br />
Bank of America Corp. 0.99<br />
Wyeth 0.97<br />
Nestle SA 0.96<br />
Berkshire Hathaway Inc. 0.94<br />
Accenture Ltd. 0.92<br />
ANNUAL TOTAL RETURN 5, 9 –CLASS A<br />
WITHOUT SALES CHARGES<br />
19.34%<br />
0<br />
6.31%<br />
3.12%<br />
-37.66%<br />
2005 2006 2007 2008<br />
9, 22<br />
HYPOTHETICAL INVESTMENT<br />
CLASS A CLASS C ADVISOR<br />
$10,000 from Inception $10,482 $10,704 $11,343<br />
FUND FACTS<br />
Net Assets (millions)<br />
9, 76<br />
Expense Ratio<br />
without waiver<br />
with waiver<br />
Net Asset Value<br />
Public Offering Price<br />
Beta 3<br />
Standard Deviation 65<br />
FUND DISTRIBUTIONS<br />
Dividend Frequency<br />
Semiannually.<br />
Dividend History 30<br />
6/09<br />
12/08<br />
3/08<br />
Capital Gains (last 12 mos.) 30<br />
Short-Term<br />
Long-Term<br />
7.59%<br />
YTD 2009 14<br />
CLASS A CLASS C ADVISOR<br />
$4,672.3 $2,266.4 $32.4<br />
CLASS A CLASS C ADVISOR<br />
$0.2045 $0.1768 $0.2149<br />
0.3681 0.2808 0.4065<br />
0.0083 0.0083 0.0083<br />
— — —<br />
— — —<br />
ASSET ALLOCATION 29, 60 6/30<br />
<strong>Franklin</strong><br />
Income Fund 33 1 ⁄3%<br />
<strong>Templeton</strong><br />
Growth Fund 33 1 ⁄3%<br />
Mutual<br />
Shares Fund 33 1 ⁄3%<br />
6/30/09<br />
1.21% 1.91% 0.91%<br />
1.07% 1.77% 0.77%<br />
$8.22 $8.12 $8.26<br />
$8.72 $8.12 $8.26<br />
1.26 1.25 1.26<br />
19.22 19.21 19.22<br />
DEALER USE ONLY/NOT FOR DISTRIBUTION TO THE PUBLIC Go to franklintempleton.com or call (800) 223-2141 <strong>Dealer</strong> <strong>Facts</strong> <strong>Guide</strong> 63<br />
OPEN-END FUNDS VALUE BLEND GROWTH SECTOR GLOBAL INTERNATIONAL HYBRID ASSET ALLOCATION FIXED INCOME TAX-FREE INCOME
OPEN-END FUNDS<br />
VALUE<br />
BLEND<br />
GROWTH<br />
SECTOR<br />
GLOBAL<br />
INTERNATIONAL<br />
HYBRID<br />
ASSET ALLOCATION<br />
FIXED INCOME<br />
TAX-FREE INCOME<br />
<strong>Franklin</strong> <strong>Templeton</strong> Perspectives Allocation Fund<br />
INVESTMENT CATEGORY<br />
Asset Allocation<br />
PRIMARY INVESTMENT 37<br />
<strong>Franklin</strong> <strong>Templeton</strong> Perspectives<br />
Allocation Fund seeks capital appreciation<br />
by investing in fixed, equal<br />
allocations to three underlying<br />
<strong>Franklin</strong> <strong>Templeton</strong> equity funds—<br />
<strong>Franklin</strong> Flex Cap Growth Fund,<br />
<strong>Templeton</strong> Growth Fund and Mutual<br />
Shares Fund—each offering its own<br />
distinct investment perspective.<br />
Together, they form a portfolio diversified<br />
among growth and value-style<br />
equity securities from around the<br />
world with a broad range of market<br />
capitalizations.<br />
FUND REFERENCE<br />
CLASS A CLASS C<br />
Fund No. 185 285<br />
CUSIP 354 72P 695 354 72P 687<br />
Symbol FPAAX FPCAX<br />
Inception1 8/2/04 8/2/04<br />
CLASS R ADVISOR89 Fund No. 893 693<br />
CUSIP 354 72P 679 354 72P 661<br />
Symbol — —<br />
Inception1 8/2/04 8/2/04<br />
ANNUAL PROSPECTUS UPDATE AVAILABLE:<br />
May 1<br />
PORTFOLIO MANAGER PROFILE 84<br />
T. Anthony Coffey, CFA<br />
Joined <strong>Franklin</strong> <strong>Templeton</strong> in 1989<br />
Managed Fund since 2004<br />
MAXIMUM SALES CHARGE & COMMISSION<br />
CLASS A CLASS C 73<br />
Sales Charge 5.75% 0.00%<br />
<strong>Dealer</strong> Concession 5.00 1.00<br />
12b-1 Fee to <strong>Dealer</strong> 0.25 1.00<br />
CLASS R ADVISOR 89<br />
Sales Charge 0.00% 0.00%<br />
<strong>Dealer</strong> Concession 0.00 0.00<br />
12b-1 Fee to <strong>Dealer</strong> 0.50 0.00<br />
See page 128 for more commission<br />
information and page 125 for footnotes.<br />
PORTFOLIO HOLDINGS 29 6/30<br />
TOP 10 HOLDINGS 7<br />
Microsoft Corp. 1.93%<br />
Oracle Corp. 1.84<br />
CVS Caremark Corp. 1.56<br />
Comcast Corp. 1.30<br />
Accenture Ltd. 1.30<br />
Cisco Systems Inc. 1.22<br />
Schering-Plough Corp. 1.20<br />
Qualcomm Inc. 1.11<br />
News Corp Inc. 1.07<br />
Siemens AG 1.03<br />
ANNUAL TOTAL RETURN 5, 9 –CLASS A<br />
WITHOUT SALES CHARGES<br />
0<br />
7.93%<br />
14.69%<br />
6.79%<br />
-39.29%<br />
6.15%<br />
2005 2006 2007 2008 YTD 2009 14<br />
6/30/09<br />
PERFORMANCE INFORMATION<br />
5, 9<br />
ANNUAL TOTAL RETURN–WITHOUT SALES CHARGES<br />
1999 2000 2001 2002 2003 2004 2005 2006 2007 2008<br />
YTD<br />
200914 CLASS A — — — — — — 7.93 14.69 6.79 -39.29 6.15<br />
CLASS C — — — — — — 7.22 13.92 6.11 -39.75 5.92<br />
ADVISOR — — — — — — 8.31 15.07 7.26 -39.10 6.27<br />
AVERAGE ANNUAL TOTAL RETURN – AVERAGE ANNUAL TOTAL RETURN–<br />
WITHOUT SALES CHARGES5, 9 6, 9<br />
WITH SALES CHARGES<br />
1 YR 3 YR 5 YR 10 YR INCEPTION 1 YR 3 YR 5 YR 10 YR INCEPTION<br />
CLASS A -26.08 -8.77 — — -0.79 -30.31 -10.56 — — -1.97<br />
CLASS C -26.53 -9.37 — — -1.43 -27.26 -9.37 — — -1.43<br />
ADVISOR -25.88 -8.46 — — -0.46 -25.88 -8.46 — — -0.46<br />
Advisor Class shares are only offered to certain eligible investors as stated in the prospectus.<br />
9, 22<br />
HYPOTHETICAL INVESTMENT<br />
CLASS A CLASS C ADVISOR<br />
$10,000 from Inception $9,067 $9,318 $9,776<br />
FUND FACTS<br />
Net Assets (millions)<br />
9, 76<br />
Expense Ratio<br />
without waiver<br />
with waiver<br />
Net Asset Value<br />
Public Offering Price<br />
Beta 3<br />
Standard Deviation 65<br />
FUND DISTRIBUTIONS<br />
Dividend Frequency<br />
Semiannually.<br />
Dividend History 30<br />
6/09<br />
12/08<br />
3/08<br />
Capital Gains (last 12 mos.) 30<br />
Short-Term<br />
Long-Term<br />
ASSET ALLOCATION 29, 60 6/30<br />
<strong>Franklin</strong> Flex Cap<br />
Growth Fund 33 1 ⁄3%<br />
<strong>Templeton</strong><br />
Growth Fund 33 1 ⁄3%<br />
Mutual Shares<br />
Fund 33 1 ⁄3%<br />
CLASS A CLASS C ADVISOR<br />
$139.9 $45.1 $3.0<br />
1.42% 2.12% 1.12%<br />
1.14% 1.84% 0.84%<br />
$8.14 $8.09 $8.17<br />
$8.64 $8.09 $8.17<br />
0.97 0.97 0.97<br />
20.19 20.17 20.20<br />
CLASS A CLASS C ADVISOR<br />
$0.0231 $0.0231 $0.0231<br />
0.1124 0.0314 0.1456<br />
0.0055 0.0055 0.0055<br />
— — —<br />
— — —<br />
64 <strong>Dealer</strong> <strong>Facts</strong> <strong>Guide</strong> Go to franklintempleton.com or call (800) 223-2141 DEALER USE ONLY/NOT FOR DISTRIBUTION TO THE PUBLIC
<strong>Franklin</strong> <strong>Templeton</strong> Conservative Target Fund<br />
OVERALL MORNINGSTAR RATING TM<br />
CLASS A 8<br />
★★★★<br />
INVESTMENT CATEGORY<br />
Asset Allocation<br />
PRIMARY INVESTMENT 37<br />
A combination of <strong>Franklin</strong> <strong>Templeton</strong><br />
mutual funds. The fund will generally<br />
invest 40% in equity funds, 40% in<br />
fixed income funds and 20% in shortterm<br />
investments.<br />
FUND REFERENCE<br />
CLASS A CLASS C<br />
Fund No. 484 584<br />
CUSIP 354 72P 109 354 72P 208<br />
Symbol FTCIX FTCCX<br />
Inception1 12/31/96 12/31/96<br />
CLASS R ADVISOR89 Fund No. 884 641<br />
CUSIP 354 72P 703 354 72P 851<br />
Symbol FTCRX —<br />
Inception1 12/31/96 12/31/96<br />
ANNUAL PROSPECTUS UPDATE AVAILABLE:<br />
May 1<br />
PORTFOLIO MANAGER PROFILE 84<br />
T. Anthony Coffey, CFA<br />
Joined <strong>Franklin</strong> <strong>Templeton</strong> in 1989<br />
Managed Fund since 2000<br />
MAXIMUM SALES CHARGE & COMMISSION<br />
CLASS A CLASS C 73<br />
Sales Charge 5.75% 0.00%<br />
<strong>Dealer</strong> Concession 5.00 1.00<br />
12b-1 Fee to <strong>Dealer</strong> 0.25 1.00<br />
CLASS R ADVISOR 89<br />
Sales Charge 0.00% 0.00%<br />
<strong>Dealer</strong> Concession 0.00 0.00<br />
12b-1 Fee to <strong>Dealer</strong> 0.50 0.00<br />
See page 128 for more commission<br />
information and page 125 for footnotes.<br />
PORTFOLIO HOLDINGS29 6/30<br />
TOP 10 HOLDINGS7 <strong>Templeton</strong> Global Bond Fund 13.59%<br />
<strong>Franklin</strong> U.S. Government<br />
Securities Fund 13.37<br />
<strong>Franklin</strong> Total Return Fund 10.98<br />
<strong>Franklin</strong> Flex Cap Growth Fund 10.38<br />
Mutual Shares Fund 8.48<br />
Mutual European Fund 4.46<br />
<strong>Franklin</strong> Growth Opportunities Fund 4.22<br />
<strong>Templeton</strong> Foreign Fund 2.95<br />
<strong>Templeton</strong> China World Fund 2.50<br />
<strong>Franklin</strong> Gold and Precious<br />
Metals Fund 2.23<br />
ANNUAL TOTAL RETURN 5, 9 –CLASS A<br />
WITHOUT SALES CHARGES<br />
0<br />
4.70%<br />
9.92%<br />
8.29%<br />
-15.41%<br />
2005 2006 2007 2008<br />
6.80%<br />
YTD 2009 14<br />
6/30/09<br />
PERFORMANCE INFORMATION<br />
5, 9<br />
ANNUAL TOTAL RETURN–WITHOUT SALES CHARGES<br />
1999 2000 2001 2002 2003 2004 2005 2006 2007 2008<br />
YTD<br />
200914 CLASS A<br />
CLASS C<br />
ADVISOR43 20.28 3.05 -0.92 -3.79 17.35 7.98 4.70 9.92 8.29 -15.41 6.80<br />
19.40 2.26 -1.58 -4.55 16.45 7.20 3.83 9.16 7.48 -16.04 6.44<br />
20.28 3.05 -0.92 -3.79 17.35 7.98 4.62 10.28 8.48 -15.15 6.93<br />
AVERAGE ANNUAL TOTAL RETURN – AVERAGE ANNUAL TOTAL RETURN–<br />
WITHOUT SALES CHARGES5, 9 6, 9, 46<br />
WITH SALES CHARGES<br />
1 YR 3 YR 5 YR 10 YR INCEPTION 1 YR 3 YR 5 YR 10 YR INCEPTION<br />
CLASS A<br />
CLASS C<br />
ADVISOR43 -6.24 1.38 3.76 4.93 5.43 -11.66 -0.61 2.54 4.31 4.93<br />
-6.90 0.62 3.01 4.16 4.62 -7.81 0.62 3.01 4.16 4.62<br />
-6.02 1.63 3.94 5.02 5.50 -6.02 1.63 3.94 5.02 5.50<br />
Advisor Class shares are only offered to certain eligible investors as stated in the prospectus.<br />
9, 22<br />
HYPOTHETICAL INVESTMENT<br />
CLASS A CLASS C ADVISOR<br />
$18,249 $17,588 $19,528<br />
43<br />
$10,000 from Inception<br />
FUND FACTS<br />
Net Assets (millions)<br />
9, 76<br />
Expense Ratio<br />
without waiver<br />
with waiver<br />
Net Asset Value<br />
Public Offering Price<br />
ASSET ALLOCATION 29, 60 6/30<br />
Domestic<br />
Equity Funds 29%<br />
Foreign Equity<br />
Funds 13%<br />
Fixed Income<br />
Funds 39%<br />
Cash Equivalents/<br />
Short-Term 20%<br />
CLASS A CLASS C ADVISOR<br />
$333.6 $186.4 $5.8<br />
1.37% 2.12% 1.12%<br />
1.17% 1.92% 0.92%<br />
$11.49 $11.33 $11.48<br />
$12.19 $11.33 $11.48<br />
0.95 0.96 0.95<br />
9.16 9.18 9.15<br />
CLASS A CLASS C ADVISOR<br />
2.77% 2.28% 3.18%<br />
$0.0363 $0.0166 $0.0430<br />
0.0515 0.0337 0.0579<br />
0.1855 0.1663 0.1923<br />
— — —<br />
0.2407 0.2407 0.2407<br />
DEALER USE ONLY/NOT FOR DISTRIBUTION TO THE PUBLIC Go to franklintempleton.com or call (800) 223-2141 <strong>Dealer</strong> <strong>Facts</strong> <strong>Guide</strong> 65<br />
Beta 3<br />
Standard Deviation 65<br />
FUND DISTRIBUTIONS<br />
Dividend Frequency<br />
Quarterly.<br />
9, 15<br />
Distribution Rate<br />
Dividend History 30<br />
6/09<br />
3/09<br />
12/08<br />
Capital Gains (last 12 mos.) 30<br />
Short-Term<br />
Long-Term<br />
OPEN-END FUNDS VALUE BLEND GROWTH SECTOR GLOBAL INTERNATIONAL HYBRID ASSET ALLOCATION FIXED INCOME TAX-FREE INCOME
OPEN-END FUNDS<br />
VALUE<br />
BLEND<br />
GROWTH<br />
SECTOR<br />
GLOBAL<br />
INTERNATIONAL<br />
HYBRID<br />
ASSET ALLOCATION<br />
FIXED INCOME<br />
TAX-FREE INCOME<br />
<strong>Franklin</strong> <strong>Templeton</strong> Moderate Target Fund<br />
OVERALL MORNINGSTAR RATING TM<br />
CLASS A 8<br />
★★★★<br />
INVESTMENT CATEGORY<br />
Asset Allocation<br />
PRIMARY INVESTMENT 37<br />
A combination of <strong>Franklin</strong><br />
<strong>Templeton</strong> mutual funds. The fund<br />
will generally invest 55% in equity<br />
funds, 35% in fixed income funds<br />
and 10% in short-term investments.<br />
FUND REFERENCE<br />
CLASS A CLASS C<br />
Fund No. 485 585<br />
CUSIP 354 72P 307 354 72P 406<br />
Symbol FMTIX FTMTX<br />
Inception1 12/31/96 12/31/96<br />
CLASS R ADVISOR89 Fund No. 885 642<br />
CUSIP 354 72P 885 354 72P 869<br />
Symbol FTMRX FMTZX<br />
Inception1 12/31/96 12/31/96<br />
ANNUAL PROSPECTUS UPDATE AVAILABLE:<br />
May 1<br />
PORTFOLIO MANAGER PROFILE 84<br />
T. Anthony Coffey, CFA<br />
Joined <strong>Franklin</strong> <strong>Templeton</strong> in 1989<br />
Managed Fund since 2000<br />
MAXIMUM SALES CHARGE & COMMISSION<br />
CLASS A CLASS C 73<br />
Sales Charge 5.75% 0.00%<br />
<strong>Dealer</strong> Concession 5.00 1.00<br />
12b-1 Fee to <strong>Dealer</strong> 0.25 1.00<br />
CLASS R ADVISOR 89<br />
Sales Charge 0.00% 0.00%<br />
<strong>Dealer</strong> Concession 0.00 0.00<br />
12b-1 Fee to <strong>Dealer</strong> 0.50 0.00<br />
See page 128 for more commission<br />
information and page 125 for footnotes.<br />
PORTFOLIO HOLDINGS29 6/30<br />
TOP 10 HOLDINGS7 <strong>Franklin</strong> Flex Cap Growth Fund 14.02%<br />
<strong>Templeton</strong> Global Bond Fund 11.86<br />
Mutual Shares Fund 11.32<br />
<strong>Franklin</strong> U.S. Government<br />
Securities Fund 11.31<br />
<strong>Franklin</strong> Total Return Fund 9.59<br />
Mutual European Fund 6.29<br />
<strong>Franklin</strong> Growth Opportunities Fund 6.17<br />
<strong>Templeton</strong> Foreign Fund 3.78<br />
<strong>Templeton</strong> China World Fund 3.40<br />
<strong>Franklin</strong> Gold and Precious<br />
Metals Fund 3.10<br />
ANNUAL TOTAL RETURN 5, 9 –CLASS A<br />
WITHOUT SALES CHARGES<br />
11.57%<br />
9.40%<br />
5.94%<br />
0<br />
-21.22%<br />
2005 2006 2007 2008<br />
8.22%<br />
YTD 2009 14<br />
6/30/09<br />
PERFORMANCE INFORMATION<br />
5, 9<br />
ANNUAL TOTAL RETURN–WITHOUT SALES CHARGES<br />
1999 2000 2001 2002 2003 2004 2005 2006 2007 2008<br />
YTD<br />
200914 CLASS A<br />
CLASS C<br />
ADVISOR43 27.25 -1.09 -4.18 -7.53 22.38 9.64 5.94 11.57 9.40 -21.22 8.22<br />
26.30 -1.83 -4.94 -8.20 21.52 8.73 5.25 10.72 8.61 -21.87 7.91<br />
27.25 -1.09 -4.18 -7.53 22.38 9.64 6.01 11.87 9.66 -21.02 8.35<br />
AVERAGE ANNUAL TOTAL RETURN – AVERAGE ANNUAL TOTAL RETURN–<br />
WITHOUT SALES CHARGES5, 9 6, 9, 46<br />
WITH SALES CHARGES<br />
1 YR 3 YR 5 YR 10 YR INCEPTION 1 YR 3 YR 5 YR 10 YR INCEPTION<br />
CLASS A<br />
CLASS C<br />
ADVISOR43 -10.07 0.07 3.53 4.60 5.22 -15.24 -1.88 2.32 3.98 4.72<br />
-10.67 -0.67 2.76 3.83 4.38 -11.54 -0.67 2.76 3.83 4.38<br />
-9.85 0.30 3.73 4.70 5.30 -9.85 0.30 3.73 4.70 5.30<br />
Advisor Class shares are only offered to certain eligible investors as stated in the prospectus.<br />
9, 22<br />
HYPOTHETICAL INVESTMENT<br />
CLASS A CLASS C ADVISOR43 $10,000 from Inception $17,795 $17,087 $19,058<br />
FUND FACTS<br />
Net Assets (millions)<br />
9, 76<br />
Expense Ratio<br />
without waiver<br />
with waiver<br />
Net Asset Value<br />
Public Offering Price<br />
Beta 3<br />
Standard Deviation 65<br />
FUND DISTRIBUTIONS<br />
Dividend Frequency<br />
Quarterly.<br />
9, 15<br />
Distribution Rate<br />
Dividend History 30<br />
6/09<br />
3/09<br />
12/08<br />
Capital Gains (last 12 mos.) 30<br />
Short-Term<br />
Long-Term<br />
ASSET ALLOCATION 29, 60 6/30<br />
Domestic<br />
Equity Funds 39%<br />
Foreign Equity<br />
Funds 18%<br />
Fixed Income<br />
Funds 34%<br />
Cash Equivalents/<br />
Short-Term 10%<br />
CLASS A CLASS C ADVISOR<br />
$559.3 $202.5 $16.1<br />
1.43% 2.18% 1.18%<br />
1.23% 1.98% 0.98%<br />
$11.37 $11.16 $11.37<br />
$12.06 $11.16 $11.37<br />
0.86 0.86 0.86<br />
12.06 12.07 12.08<br />
CLASS A CLASS C ADVISOR<br />
2.58% 2.08% 2.98%<br />
$0.0292 $0.0100 $0.0359<br />
0.0473 0.0295 0.0535<br />
0.1808 0.1619 0.1872<br />
— — —<br />
0.3712 0.3712 0.3712<br />
66 <strong>Dealer</strong> <strong>Facts</strong> <strong>Guide</strong> Go to franklintempleton.com or call (800) 223-2141 DEALER USE ONLY/NOT FOR DISTRIBUTION TO THE PUBLIC
<strong>Franklin</strong> <strong>Templeton</strong> Growth Target Fund<br />
INVESTMENT CATEGORY<br />
Asset Allocation<br />
PRIMARY INVESTMENT 37<br />
A combination of <strong>Franklin</strong><br />
<strong>Templeton</strong> mutual funds. The fund<br />
will generally invest 80% in equity<br />
funds, 15% in fixed income funds<br />
and 5% in short-term investments.<br />
FUND REFERENCE<br />
CLASS A CLASS C<br />
Fund No. 486 586<br />
CUSIP 354 72P 505 354 72P 604<br />
Symbol FGTIX FTGTX<br />
Inception1 12/31/96 12/31/96<br />
CLASS R ADVISOR89 Fund No. 886 643<br />
CUSIP 354 72P 802 354 72P 877<br />
Symbol FGTRX FGTZX<br />
Inception1 12/31/96 12/31/96<br />
ANNUAL PROSPECTUS UPDATE AVAILABLE:<br />
May 1<br />
PORTFOLIO MANAGER PROFILE 84<br />
T. Anthony Coffey, CFA<br />
Joined <strong>Franklin</strong> <strong>Templeton</strong> in 1989<br />
Managed Fund since 2000<br />
MAXIMUM SALES CHARGE & COMMISSION<br />
CLASS A CLASS C73 Sales Charge 5.75% 0.00%<br />
<strong>Dealer</strong> Concession 5.00 1.00<br />
12b-1 Fee to <strong>Dealer</strong> 0.25 1.00<br />
CLASS R ADVISOR89 Sales Charge 0.00% 0.00%<br />
<strong>Dealer</strong> Concession 0.00 0.00<br />
12b-1 Fee to <strong>Dealer</strong> 0.50 0.00<br />
See page 128 for more commission<br />
information and page 125 for footnotes.<br />
PORTFOLIO HOLDINGS29 6/30<br />
TOP 10 HOLDINGS7 <strong>Franklin</strong> Flex Cap Growth Fund 19.70%<br />
Mutual Shares Fund 15.94<br />
Mutual European Fund 8.56<br />
<strong>Franklin</strong> Growth Opportunities Fund 8.36<br />
<strong>Templeton</strong> Foreign Fund 5.36<br />
<strong>Templeton</strong> Global Bond Fund 5.31<br />
<strong>Franklin</strong> U.S. Government<br />
Securities Fund 5.14<br />
<strong>Franklin</strong> Gold and Precious<br />
Metals Fund 4.79<br />
<strong>Templeton</strong> China World Fund 4.66<br />
<strong>Franklin</strong> Total Return Fund 4.28<br />
ANNUAL TOTAL RETURN 5, 9 –CLASS A<br />
WITHOUT SALES CHARGES<br />
0<br />
8.47%<br />
13.90%<br />
10.58%<br />
-30.75%<br />
2005 2006 2007 2008<br />
9.55%<br />
YTD 2009 14<br />
6/30/09<br />
PERFORMANCE INFORMATION<br />
5, 9<br />
ANNUAL TOTAL RETURN–WITHOUT SALES CHARGES<br />
1999 2000 2001 2002 2003 2004 2005 2006 2007 2008<br />
YTD<br />
200914 CLASS A<br />
CLASS C<br />
ADVISOR43 41.17 -5.13 -11.33 -14.65 30.11 11.28 8.47 13.90 10.58 -30.75 9.55<br />
40.06 -5.83 -11.97 -15.18 28.98 10.46 7.63 13.08 9.72 -31.26 9.13<br />
41.17 -5.13 -11.33 -14.65 30.11 11.28 8.48 14.26 10.80 -30.56 9.64<br />
AVERAGE ANNUAL TOTAL RETURN – AVERAGE ANNUAL TOTAL RETURN–<br />
WITHOUT SALES CHARGES5, 9 6, 9, 46<br />
WITH SALES CHARGES<br />
1 YR 3 YR 5 YR 10 YR INCEPTION 1 YR 3 YR 5 YR 10 YR INCEPTION<br />
CLASS A<br />
CLASS C<br />
ADVISOR43 -17.43 -3.06 2.38 3.46 4.42 -22.20 -4.95 1.19 2.85 3.93<br />
-18.07 -3.80 1.62 2.69 3.66 -18.88 -3.80 1.62 2.69 3.66<br />
-17.26 -2.84 2.56 3.55 4.50 -17.26 -2.84 2.56 3.55 4.50<br />
Advisor Class shares are only offered to certain eligible investors as stated in the prospectus.<br />
9, 22<br />
HYPOTHETICAL INVESTMENT<br />
CLASS A CLASS C ADVISOR43 $10,000 from Inception $16,189 $15,669 $17,326<br />
FUND FACTS<br />
Net Assets (millions)<br />
9, 76<br />
Expense Ratio<br />
without waiver<br />
with waiver<br />
Net Asset Value<br />
Public Offering Price<br />
Beta 3<br />
Standard Deviation 65<br />
FUND DISTRIBUTIONS<br />
Dividend Frequency<br />
Quarterly.<br />
9, 15<br />
Distribution Rate<br />
Dividend History 30<br />
6/09<br />
3/09<br />
12/08<br />
Capital Gains (last 12 mos.) 30<br />
Short-Term<br />
Long-Term<br />
ASSET ALLOCATION 29, 60 6/30<br />
Domestic<br />
Equity Funds 55%<br />
Foreign Equity<br />
Funds 25%<br />
Fixed Income<br />
Funds 15%<br />
Cash Equivalents/<br />
Short-Term 5%<br />
CLASS A CLASS C ADVISOR<br />
$319.7 $120.7 $13.6<br />
1.58% 2.33% 1.33%<br />
1.31% 2.06% 1.06%<br />
$11.45 $11.22 $11.47<br />
$12.15 $11.22 $11.47<br />
1.08 1.08 1.08<br />
16.71 16.67 16.67<br />
CLASS A CLASS C ADVISOR<br />
1.91% 1.23% 2.31%<br />
— — —<br />
$0.0231 $0.0231 $0.0231<br />
0.2090 0.1149 0.2419<br />
— — —<br />
0.6580 0.6580 0.6580<br />
DEALER USE ONLY/NOT FOR DISTRIBUTION TO THE PUBLIC Go to franklintempleton.com or call (800) 223-2141 <strong>Dealer</strong> <strong>Facts</strong> <strong>Guide</strong> 67<br />
OPEN-END FUNDS VALUE BLEND GROWTH SECTOR GLOBAL INTERNATIONAL HYBRID ASSET ALLOCATION FIXED INCOME TAX-FREE INCOME
OPEN-END FUNDS<br />
VALUE<br />
BLEND<br />
GROWTH<br />
SECTOR<br />
GLOBAL<br />
INTERNATIONAL<br />
HYBRID<br />
ASSET ALLOCATION<br />
FIXED INCOME<br />
TAX-FREE INCOME<br />
<strong>Franklin</strong> <strong>Templeton</strong> 2015 Retirement Target Fund<br />
INVESTMENT CATEGORY<br />
Asset Allocation<br />
PRIMARY INVESTMENT 37<br />
A distinctly weighted combination<br />
of <strong>Franklin</strong> <strong>Templeton</strong> mutual funds<br />
which, in turn, invest in a variety of<br />
U.S. and foreign equity, fixed income<br />
and money market securities. The<br />
asset mix of underlying funds will<br />
become increasingly conservative as<br />
the stated target retirement year<br />
approaches.<br />
FUND REFERENCE<br />
CLASS A CLASS C<br />
Fund No. 427 527<br />
CUSIP 354 72P 653 354 72P 646<br />
Symbol FTRAX —<br />
Inception 1 8/1/06 8/1/06<br />
CLASS R ADVISOR 89<br />
Fund No. 827 627<br />
CUSIP 354 72P 638 354 72P 620<br />
Symbol — —<br />
Inception 1 8/1/06 8/1/06<br />
ANNUAL PROSPECTUS UPDATE AVAILABLE:<br />
May 1<br />
PORTFOLIO MANAGER PROFILE 84<br />
T. Anthony Coffey, CFA<br />
Joined <strong>Franklin</strong> <strong>Templeton</strong> in 1989<br />
Managed Fund since 2006<br />
FUND FACTS<br />
Net Assets (millions)<br />
9, 76<br />
Expense Ratio<br />
without waiver<br />
with waiver<br />
Net Asset Value<br />
Public Offering Price<br />
Beta 3<br />
Standard Deviation 65<br />
CLASS A CLASS C ADVISOR<br />
$12.1 $4.8 $0.2<br />
PORTFOLIO ALLOCATION 29, 60 6/30<br />
Domestic Equity Funds 45%<br />
Foreign Equity Funds 21%<br />
Fixed Income Funds 26%<br />
Cash Equivalents/Short-Term 7%<br />
See page 128 for more commission information and page 125 for footnotes.<br />
<strong>Franklin</strong> <strong>Templeton</strong> 2025 Retirement Target Fund<br />
INVESTMENT CATEGORY<br />
Asset Allocation<br />
PRIMARY INVESTMENT 37<br />
A distinctly weighted combination<br />
of <strong>Franklin</strong> <strong>Templeton</strong> mutual funds<br />
which, in turn, invest in a variety of<br />
U.S. and foreign equity, fixed income<br />
and money market securities. The<br />
asset mix of underlying funds will<br />
become increasingly conservative as<br />
the stated target retirement year<br />
approaches.<br />
FUND REFERENCE<br />
CLASS A CLASS C<br />
Fund No. 445 545<br />
CUSIP 354 72P 612 354 72P 596<br />
Symbol FTRTX —<br />
Inception 1 8/1/06 8/1/06<br />
CLASS R ADVISOR 89<br />
Fund No. 845 645<br />
CUSIP 354 72P 588 354 72P 570<br />
Symbol — —<br />
Inception 1 8/1/06 8/1/06<br />
ANNUAL PROSPECTUS UPDATE AVAILABLE:<br />
May 1<br />
PORTFOLIO MANAGER PROFILE 84<br />
T. Anthony Coffey, CFA<br />
Joined <strong>Franklin</strong> <strong>Templeton</strong> in 1989<br />
Managed Fund since 2006<br />
PERFORMANCE INFORMATION<br />
AVERAGE ANNUAL TOTAL RETURN– AVERAGE ANNUAL TOTAL RETURN–<br />
WITHOUT SALES CHARGES5, 9 6, 9<br />
WITH SALES CHARGES<br />
CLASS A<br />
CLASS C<br />
ADVISOR<br />
PORTFOLIO ALLOCATION 29, 60 6/30<br />
Domestic Equity Funds 54%<br />
Foreign Equity Funds 25%<br />
Fixed Income Funds 16%<br />
Cash Equivalents/Short-Term 6%<br />
See page 128 for more commission information and page 125 for footnotes.<br />
6/30/09<br />
1 YR 3 YR 5 YR 10 YR INCEPTION 1 YR 3 YR 5 YR 10 YR INCEPTION<br />
-12.51 — — — -0.88 -17.51 — — — -2.88<br />
-13.13 — — — -1.57 -13.98 — — — -1.57<br />
-12.23 — — — -0.56 -12.23 — — — -0.56<br />
Advisor Class shares are only offered to certain eligible investors as stated in the prospectus.<br />
2.14% 2.84% 1.84%<br />
1.21% 1.91% 0.91%<br />
$8.80 $8.74 $8.82<br />
$9.34 $8.74 $8.82<br />
— — —<br />
— — —<br />
MAXIMUM SALES CHARGE & COMMISSION<br />
CLASS A CLASS C73 Sales Charge 5.75% 0.00%<br />
<strong>Dealer</strong> Concession 5.00 1.00<br />
12b-1 Fee to <strong>Dealer</strong> 0.25 1.00<br />
CLASS R ADVISOR89 Sales Charge 0.00% 0.00%<br />
<strong>Dealer</strong> Concession 0.00 0.00<br />
12b-1 Fee to <strong>Dealer</strong> 0.50 0.00<br />
6/30/09<br />
MAXIMUM SALES CHARGE & COMMISSION<br />
CLASS A CLASS C73 Sales Charge 5.75% 0.00%<br />
<strong>Dealer</strong> Concession 5.00 1.00<br />
12b-1 Fee to <strong>Dealer</strong> 0.25 1.00<br />
CLASS R ADVISOR89 PERFORMANCE INFORMATION<br />
AVERAGE ANNUAL TOTAL RETURN– AVERAGE ANNUAL TOTAL RETURN–<br />
WITHOUT SALES CHARGES<br />
Sales Charge 0.00% 0.00%<br />
<strong>Dealer</strong> Concession 0.00 0.00<br />
12b-1 Fee to <strong>Dealer</strong> 0.50 0.00<br />
5, 9 6, 9<br />
WITH SALES CHARGES<br />
1 YR 3 YR 5 YR 10 YR INCEPTION 1 YR 3 YR 5 YR 10 YR INCEPTION<br />
CLASS A -18.10 — — — -3.41 -22.79 — — — -5.35<br />
CLASS C -18.69 — — — -4.05 -19.48 — — — -4.05<br />
ADVISOR -17.93 — — — -3.16 -17.93 — — — -3.16<br />
Advisor Class shares are only offered to certain eligible investors as stated in the prospectus.<br />
FUND FACTS<br />
CLASS A CLASS C ADVISOR<br />
Net Assets (millions)<br />
9, 76<br />
Expense Ratio<br />
without waiver<br />
with waiver<br />
Net Asset Value<br />
Public Offering Price<br />
Beta3 Standard Deviation65 $14.0 $3.9 $0.4<br />
2.32% 3.02% 2.02%<br />
1.26% 1.96% 0.96%<br />
$8.09 $8.01 $8.10<br />
$8.58 $8.01 $8.10<br />
— — —<br />
— — —<br />
68 <strong>Dealer</strong> <strong>Facts</strong> <strong>Guide</strong> Go to franklintempleton.com or call (800) 223-2141 DEALER USE ONLY/NOT FOR DISTRIBUTION TO THE PUBLIC
<strong>Franklin</strong> <strong>Templeton</strong> 2035 Retirement Target Fund<br />
INVESTMENT CATEGORY<br />
Asset Allocation<br />
PRIMARY INVESTMENT 37<br />
A distinctly weighted combination<br />
of <strong>Franklin</strong> <strong>Templeton</strong> mutual funds<br />
which, in turn, invest in a variety of<br />
U.S. and foreign equity, fixed income<br />
and money market securities. The<br />
asset mix of underlying funds will<br />
become increasingly conservative as<br />
the stated target retirement year<br />
approaches.<br />
FUND REFERENCE<br />
CLASS A CLASS C<br />
Fund No. 446 546<br />
CUSIP 354 72P 562 354 72P 554<br />
Symbol — —<br />
Inception 1 8/1/06 8/1/06<br />
CLASS R ADVISOR 89<br />
Fund No. 846 646<br />
CUSIP 354 72P 547 354 72P 539<br />
Symbol — —<br />
Inception 1 8/1/06 8/1/06<br />
ANNUAL PROSPECTUS UPDATE AVAILABLE:<br />
May 1<br />
PORTFOLIO MANAGER PROFILE 84<br />
T. Anthony Coffey, CFA<br />
Joined <strong>Franklin</strong> <strong>Templeton</strong> in 1989<br />
Managed Fund since 2006<br />
FUND FACTS<br />
Net Assets (millions)<br />
9, 76<br />
Expense Ratio<br />
without waiver<br />
with waiver<br />
Net Asset Value<br />
Public Offering Price<br />
Beta 3<br />
Standard Deviation 65<br />
CLASS A CLASS C ADVISOR<br />
$7.6 $2.5 $0.4<br />
See page 128 for more commission information and page 125 for footnotes.<br />
<strong>Franklin</strong> <strong>Templeton</strong> 2045 Retirement Target Fund<br />
INVESTMENT CATEGORY<br />
Asset Allocation<br />
PRIMARY INVESTMENT 37<br />
A distinctly weighted combination<br />
of <strong>Franklin</strong> <strong>Templeton</strong> mutual funds<br />
which, in turn, invest in a variety of<br />
U.S. and foreign equity, fixed income<br />
and money market securities. The<br />
asset mix of underlying funds will<br />
become increasingly conservative as<br />
the stated target retirement year<br />
approaches.<br />
FUND REFERENCE<br />
CLASS A CLASS C<br />
Fund No. 451 551<br />
CUSIP 354 72P 521 354 72P 513<br />
Symbol — —<br />
Inception 1 8/1/06 8/1/06<br />
CLASS R ADVISOR 89<br />
Fund No. 851 651<br />
CUSIP 354 72P 497 354 72P 489<br />
Symbol — —<br />
Inception 1 8/1/06 8/1/06<br />
ANNUAL PROSPECTUS UPDATE AVAILABLE:<br />
May 1<br />
PORTFOLIO MANAGER PROFILE 84<br />
T. Anthony Coffey, CFA<br />
Joined <strong>Franklin</strong> <strong>Templeton</strong> in 1989<br />
Managed Fund since 2006<br />
2.99% 3.69% 2.69%<br />
1.30% 2.00% 1.00%<br />
$7.77 $7.67 $7.80<br />
$8.24 $7.67 $7.80<br />
— — —<br />
— — —<br />
6/30/09<br />
PERFORMANCE INFORMATION<br />
AVERAGE ANNUAL TOTAL RETURN– AVERAGE ANNUAL TOTAL RETURN–<br />
WITHOUT SALES CHARGES5, 9 6, 9<br />
WITH SALES CHARGES<br />
1 YR 3 YR 5 YR 10 YR INCEPTION 1 YR 3 YR 5 YR 10 YR INCEPTION<br />
CLASS A -21.35 — — — -4.68 -25.88 — — — -6.60<br />
CLASS C -21.91 — — — -5.37 -22.68 — — — -5.37<br />
ADVISOR -21.12 — — — -4.39 -21.12 — — — -4.39<br />
Advisor Class shares are only offered to certain eligible investors as stated in the prospectus.<br />
PORTFOLIO ALLOCATION 29, 60 6/30<br />
Domestic Equity Funds 65%<br />
Foreign Equity Funds 30%<br />
Fixed Income Funds 5%<br />
MAXIMUM SALES CHARGE & COMMISSION<br />
CLASS A CLASS C73 Sales Charge 5.75% 0.00%<br />
<strong>Dealer</strong> Concession 5.00 1.00<br />
12b-1 Fee to <strong>Dealer</strong> 0.25 1.00<br />
CLASS R ADVISOR89 Sales Charge 0.00% 0.00%<br />
<strong>Dealer</strong> Concession 0.00 0.00<br />
12b-1 Fee to <strong>Dealer</strong> 0.50 0.00<br />
6/30/09<br />
MAXIMUM SALES CHARGE & COMMISSION<br />
CLASS A CLASS C73 Sales Charge 5.75% 0.00%<br />
<strong>Dealer</strong> Concession 5.00 1.00<br />
12b-1 Fee to <strong>Dealer</strong> 0.25 1.00<br />
CLASS R ADVISOR89 PERFORMANCE INFORMATION<br />
AVERAGE ANNUAL TOTAL RETURN– AVERAGE ANNUAL TOTAL RETURN–<br />
WITHOUT SALES CHARGES<br />
Sales Charge 0.00% 0.00%<br />
<strong>Dealer</strong> Concession 0.00 0.00<br />
12b-1 Fee to <strong>Dealer</strong> 0.50 0.00<br />
5, 9 6, 9<br />
WITH SALES CHARGES<br />
1 YR 3 YR 5 YR 10 YR INCEPTION 1 YR 3 YR 5 YR 10 YR INCEPTION<br />
CLASS A -22.95 — — — -5.26 -27.36 — — — -7.17<br />
CLASS C -23.56 — — — -5.92 -24.30 — — — -5.92<br />
ADVISOR -22.73 — — — -4.95 -22.73 — — — -4.95<br />
Advisor Class shares are only offered to certain eligible investors as stated in the prospectus.<br />
FUND FACTS<br />
CLASS A CLASS C ADVISOR<br />
Net Assets (millions)<br />
9, 76<br />
Expense Ratio<br />
without waiver<br />
with waiver<br />
Net Asset Value<br />
Public Offering Price<br />
Beta3 Standard Deviation65 $4.8 $1.4 $0.1<br />
3.99% 4.69% 3.69%<br />
1.32% 2.02% 1.02%<br />
$7.50 $7.39 $7.53<br />
$7.96 $7.39 $7.53<br />
— — —<br />
— — —<br />
PORTFOLIO ALLOCATION 29, 60 6/30<br />
Domestic Equity Funds 69%<br />
Foreign Equity Funds 32%<br />
Cash Equivalents/Short Term -1%<br />
See page 128 for more commission information and page 125 for footnotes.<br />
DEALER USE ONLY/NOT FOR DISTRIBUTION TO THE PUBLIC Go to franklintempleton.com or call (800) 223-2141 <strong>Dealer</strong> <strong>Facts</strong> <strong>Guide</strong> 69<br />
OPEN-END FUNDS VALUE BLEND GROWTH SECTOR GLOBAL INTERNATIONAL HYBRID ASSET ALLOCATION FIXED INCOME TAX-FREE INCOME
OPEN-END FUNDS<br />
VALUE<br />
BLEND<br />
GROWTH<br />
SECTOR<br />
GLOBAL<br />
INTERNATIONAL<br />
HYBRID<br />
ASSET ALLOCATION<br />
FIXED INCOME<br />
TAX-FREE INCOME<br />
<strong>Franklin</strong> Adjustable U.S. Government Securities Fund<br />
OVERALL MORNINGSTAR RATING TM<br />
CLASS A 8<br />
★★★★<br />
MORNINGSTAR STYLE BOX<br />
DURATION<br />
Short Int Long<br />
✕<br />
QUALITY<br />
High<br />
Medium<br />
Low<br />
INVESTMENT CATEGORY<br />
Fixed Income<br />
37, 75<br />
PRIMARY INVESTMENT<br />
Adjustable-rate, mortgage-backed<br />
securities (ARMS), or other securities<br />
collateralized by, or representing<br />
an interest in, mortgages, issued or<br />
guaranteed by the U.S. government,<br />
its agencies or instrumentalities.<br />
Some of the fund’s investments may<br />
include securities issued by U.S.<br />
government-sponsored entities, such<br />
as Fannie Mae and Freddie Mac.<br />
FUND REFERENCE<br />
CLASS A CLASS C<br />
Fund No. 138 238<br />
CUSIP 353 612 302 353 612 732<br />
Symbol FISAX FCSCX<br />
Inception1 10/20/87 7/1/03<br />
ADVISOR 89<br />
Fund No. 638<br />
CUSIP 353 612 625<br />
Symbol —<br />
Inception 1 10/20/87<br />
✕ Current<br />
Historical<br />
TM 67<br />
ANNUAL PROSPECTUS UPDATE AVAILABLE:<br />
March 1<br />
PORTFOLIO MANAGER PROFILE84 Paul Varunok<br />
Joined <strong>Franklin</strong> <strong>Templeton</strong> in 2001<br />
Managed Fund since 2003<br />
T. Anthony Coffey, CFA<br />
Joined <strong>Franklin</strong> <strong>Templeton</strong> in 1989<br />
Managed Fund since 1991<br />
MAXIMUM SALES CHARGE & COMMISSION<br />
CLASS A CLASS C73 Sales Charge 2.25% 0.00%<br />
<strong>Dealer</strong> Concession 2.00 1.00<br />
12b-1 Fee to <strong>Dealer</strong> 0.25 0.65<br />
ADVISOR 89<br />
Sales Charge 0.00%<br />
<strong>Dealer</strong> Concession 0.00<br />
12b-1 Fee to <strong>Dealer</strong> 0.00<br />
See page 128 for more commission<br />
information and page 125 for footnotes.<br />
PORTFOLIO HOLDINGS 29 6/30<br />
Average Duration32 1.20 years<br />
Average Credit Quality AAA<br />
CREDIT QUALITY<br />
AAA 100.0%<br />
INDEX BREAKDOWN<br />
LIBOR 60.40%<br />
Constant Maturity Treasury Index 20.71<br />
11th District Cost of Funds Index 3.88<br />
6-Month Treasury Bill Index 0.17<br />
National Median Cost of Funds Index 0.14<br />
TOP HOLDINGS<br />
FNMA 67.48%<br />
FHLMC 16.13<br />
GNMA 1.68<br />
Other 14.71<br />
ANNUAL TOTAL RETURN 5 –CLASS A<br />
WITHOUT SALES CHARGES<br />
5.03%<br />
4.15%<br />
3.58%<br />
0<br />
2.06%<br />
2005 2006 2007 2008<br />
2.91%<br />
YTD 2009 14<br />
6/30/09<br />
PERFORMANCE INFORMATION<br />
5, 13<br />
ANNUAL TOTAL RETURN–WITHOUT SALES CHARGES<br />
1999 2000 2001 2002 2003 2004 2005 2006 2007 2008<br />
YTD<br />
2009 14<br />
CLASS A<br />
CLASS C<br />
ADVISOR43 4.38 6.68 6.43 3.41 1.23 1.79 2.06 4.15 5.03 3.58 2.91<br />
— — — — — 1.38 1.68 3.75 4.48 3.29 2.60<br />
4.38 6.68 6.43 3.41 1.23 1.79 2.06 4.15 5.03 3.86 3.04<br />
AVERAGE ANNUAL TOTAL RETURN– AVERAGE ANNUAL TOTAL RETURN–<br />
WITHOUT SALES CHARGES5, 13 6, 13<br />
WITH SALES CHARGES<br />
1 YR 3 YR 5 YR 10 YR INCEPTION 1 YR 3 YR 5 YR 10 YR INCEPTION<br />
CLASS A<br />
CLASS C<br />
ADVISOR43 4.46 4.75 3.80 3.93 4.88 2.16 3.98 3.32 3.69 4.77<br />
3.93 4.34 3.37 — 2.84 2.93 4.34 3.37 — 2.84<br />
4.72 4.89 3.88 3.97 4.90 4.72 4.89 3.88 3.97 4.90<br />
Advisor Class shares are only offered to certain eligible investors as stated in the prospectus.<br />
HYPOTHETICAL INVESTMENT 22<br />
CLASS A CLASS C ADVISOR 43<br />
$10,000 from Inception $27,467 $11,833 $28,209<br />
FUND FACTS<br />
Net Assets (millions)<br />
Expense Ratio2 Net Asset Value<br />
Public Offering Price<br />
Beta 3<br />
Standard Deviation 65<br />
ASSET ALLOCATION 29, 60 6/30<br />
Bonds 85%<br />
Cash 15%<br />
CLASS A CLASS C ADVISOR<br />
$1,057.2 $357.6 $41.4<br />
0.94% 1.34% 0.69%<br />
$8.98 $8.97 $8.99<br />
$9.19 $8.97 $8.99<br />
0.06 0.05 0.05<br />
0.65 0.63 0.65<br />
FUND DISTRIBUTIONS<br />
Dividend Frequency<br />
Accrued daily and paid monthly on the last business day.<br />
CLASS A CLASS C ADVISOR<br />
Distribution Rate15 4, 30<br />
Dividend History<br />
2.77% 2.42% 3.08%<br />
6/09<br />
$0.0224 $0.0191 $0.0244<br />
5/09<br />
0.0197 0.0169 0.0215<br />
4/09<br />
Capital Gains (last 4, 30 12 mos.)<br />
0.0224 0.0195 0.0243<br />
Short-Term<br />
— — —<br />
Long-Term<br />
— — —<br />
70 <strong>Dealer</strong> <strong>Facts</strong> <strong>Guide</strong> Go to franklintempleton.com or call (800) 223-2141 DEALER USE ONLY/NOT FOR DISTRIBUTION TO THE PUBLIC
<strong>Franklin</strong> Floating Rate Daily Access Fund<br />
OVERALL MORNINGSTAR RATING TM<br />
CLASS A 8<br />
★★★★<br />
MORNINGSTAR STYLE BOX<br />
DURATION<br />
Short Int Long<br />
✕<br />
QUALITY<br />
High<br />
Medium<br />
Low<br />
INVESTMENT CATEGORY<br />
Fixed Income<br />
PRIMARY INVESTMENT 37<br />
Invests in floating interest rate senior<br />
secured corporate loans (floatingrate<br />
loans) and debt securities that<br />
usually pay interest at favorable<br />
spreads to such widely recognized<br />
lending interest rate benchmarks as<br />
the London Interbank Offered Rate<br />
(LIBOR) or a designated bank’s<br />
prime rate. Floating-rate loans and<br />
debt securities in which the fund<br />
invests tend to be rated below<br />
investment-grade.<br />
FUND REFERENCE<br />
CLASS A CLASS C<br />
Fund No. 489 589<br />
CUSIP 353 612 823 353 612 799<br />
Symbol FAFRX FCFRX<br />
Inception1 5/1/01 5/1/01<br />
ADVISOR 89<br />
Fund No. 689<br />
CUSIP 353 612 781<br />
Symbol FDAAX<br />
Inception 1 5/1/01<br />
ANNUAL PROSPECTUS UPDATE AVAILABLE:<br />
March 1<br />
PORTFOLIO MANAGER PROFILE84 Richard S. Hsu, CFA<br />
Joined <strong>Franklin</strong> <strong>Templeton</strong> in 1996<br />
Manager or analyst since 2001<br />
Madeline Lam<br />
Joined <strong>Franklin</strong> <strong>Templeton</strong> in 1998<br />
Manager or analyst since 2001<br />
MAXIMUM SALES CHARGE & COMMISSION<br />
CLASS A CLASS C 74<br />
Sales Charge 2.25% 0.00%<br />
<strong>Dealer</strong> Concession 2.00 1.00<br />
12b-1 Fee to <strong>Dealer</strong> 0.25 0.65<br />
ADVISOR 89<br />
Sales Charge 0.00%<br />
<strong>Dealer</strong> Concession 0.00<br />
12b-1 Fee to <strong>Dealer</strong> 0.00<br />
✕ Current<br />
Historical<br />
TM 67<br />
See page 128 for more commission<br />
information and page 125 for footnotes.<br />
PORTFOLIO HOLDINGS 29 5/31<br />
Total Number of Positions 217<br />
TOP 10 INDUSTRIES<br />
Health Care Facilities 6.35%<br />
Specialty Chemicals 4.60<br />
Cable & Satellite 4.57<br />
Broadcasting 4.22<br />
Data Processing & Outsourced<br />
Services 3.42<br />
Casinos & Gaming 3.09<br />
Health Care Services 3.05<br />
Publishing 3.01<br />
Integrated Telecommunication<br />
Services 2.92<br />
Packaged Foods & Meats 2.70<br />
TOP 10 HOLDINGS 7<br />
VML US Finance LLC (Venetian<br />
Macau US) 1.62%<br />
Community Health Systems Inc. 1.48<br />
Davita Inc. 1.39<br />
R.H. Donnelley Inc./Dex Media 1.39<br />
Dean Foods Co. 1.36<br />
NRG Energy Inc. 1.34<br />
HCA Inc. 1.29<br />
Aramark Corp. 1.29<br />
Discovery Communications Inc. 1.28<br />
Univision Communications Inc. 1.27<br />
The fund offers investors the opportunity to buy<br />
and sell shares daily. In order to be able to offer<br />
daily liquidity, the fund is managed to hold up to<br />
20% of the fund’s assets in cash, depending on<br />
the market.<br />
ANNUAL TOTAL RETURN 5<br />
WITHOUT SALES CHARGES<br />
0<br />
4.20%<br />
6.02%<br />
1.78%<br />
-22.83%<br />
2005 2006 2007 2008<br />
19.91%<br />
YTD 2009 14<br />
6/30/09<br />
PERFORMANCE INFORMATION<br />
5, 13<br />
ANNUAL TOTAL RETURN–WITHOUT SALES CHARGES<br />
1999 2000 2001 2002 2003 2004 2005 2006 2007 2008<br />
YTD<br />
200914 CLASS A — — — 1.98 6.57 3.67 4.20 6.02 1.78 -22.83 19.91<br />
CLASS C — — — 1.69 6.11 3.25 3.79 5.71 1.27 -23.13 19.68<br />
ADVISOR — — — 2.22 6.95 3.94 4.46 6.28 1.94 -22.64 20.20<br />
AVERAGE ANNUAL TOTAL RETURN – AVERAGE ANNUAL TOTAL RETURN–<br />
WITHOUT SALES CHARGES5, 13 6, 13<br />
WITH SALES CHARGES<br />
1 YR 3 YR 5 YR 10 YR INCEPTION 1 YR 3 YR 5 YR 10 YR INCEPTION<br />
CLASS A -8.02 -0.92 1.13 — 2.48 -10.12 -1.67 0.68 — 2.19<br />
CLASS C -8.38 -1.35 0.74 — 2.08 -9.26 -1.35 0.74 — 2.08<br />
ADVISOR -7.68 -0.67 1.39 — 2.75 -7.68 -0.67 1.39 — 2.75<br />
Advisor Class shares are only offered to certain eligible investors as stated in the prospectus.<br />
HYPOTHETICAL INVESTMENT 22<br />
CLASS A CLASS C ADVISOR<br />
$10,000 from Inception $11,935 $11,830 $12,475<br />
FUND FACTS<br />
Net Assets (millions)<br />
Expense Ratio2 Net Asset Value<br />
Public Offering Price<br />
Beta 3<br />
Standard Deviation 65<br />
ASSET ALLOCATION 29, 60 5/31<br />
Senior Loans 79%<br />
Cash 21%<br />
CLASS A CLASS C ADVISOR<br />
$901.2 $196.8 $150.6<br />
1.01% 1.40% 0.76%<br />
$8.30 $8.30 $8.31<br />
$8.49 $8.30 $8.31<br />
0.56 0.56 0.56<br />
11.01 10.99 11.01<br />
FUND DISTRIBUTIONS<br />
Dividend Frequency<br />
Accrued daily and paid monthly on the last business day.<br />
CLASS A CLASS C ADVISOR<br />
Distribution Rate15 Dividend History 30<br />
6/09<br />
5/09<br />
4/09<br />
Capital Gains (last 12 mos.) 30<br />
2.72% 2.39% 3.03%<br />
$0.0202 $0.0174 $0.0220<br />
0.0223 0.0199 0.0239<br />
0.0206 0.0180 0.0222<br />
Short-Term<br />
— — —<br />
Long-Term<br />
— — —<br />
DEALER USE ONLY/NOT FOR DISTRIBUTION TO THE PUBLIC Go to franklintempleton.com or call (800) 223-2141 <strong>Dealer</strong> <strong>Facts</strong> <strong>Guide</strong> 71<br />
OPEN-END FUNDS VALUE BLEND GROWTH SECTOR GLOBAL INTERNATIONAL HYBRID ASSET ALLOCATION FIXED INCOME TAX-FREE INCOME
OPEN-END FUNDS<br />
VALUE<br />
BLEND<br />
GROWTH<br />
SECTOR<br />
GLOBAL<br />
INTERNATIONAL<br />
HYBRID<br />
ASSET ALLOCATION<br />
FIXED INCOME<br />
TAX-FREE INCOME<br />
<strong>Franklin</strong> High Income Fund<br />
OVERALL MORNINGSTAR<br />
8, 67<br />
RATINGTM – CLASS A<br />
TM 67<br />
MORNINGSTAR STYLE BOX<br />
DURATION<br />
Short Int Long<br />
QUALITY<br />
High<br />
✕<br />
Medium<br />
Low<br />
✕ Current<br />
Historical<br />
INVESTMENT CATEGORY<br />
Fixed Income<br />
PRIMARY INVESTMENT 37<br />
Domestic and foreign higheryielding,<br />
lower-rated corporate<br />
bonds, and dividend-paying<br />
common or preferred stocks.<br />
FUND REFERENCE<br />
CLASS A CLASS C<br />
Fund No. 105 205<br />
CUSIP 353 538 101 353 538 200<br />
Symbol FHAIX FCHIX<br />
Inception1 12/31/69 5/16/95<br />
CLASS R ADVISOR89 Fund No. 805 605<br />
CUSIP 353 538 507 353 538 309<br />
Symbol FHIRX FVHIX<br />
Inception1 12/31/69 12/31/69<br />
ANNUAL PROSPECTUS UPDATE AVAILABLE:<br />
October 1<br />
PORTFOLIO MANAGER PROFILE84 Christopher J. Molumphy, CFA<br />
Joined <strong>Franklin</strong> <strong>Templeton</strong> in 1988<br />
Managed Fund since 1991<br />
Eric G. Takaha, CFA<br />
Joined <strong>Franklin</strong> <strong>Templeton</strong> in 1989<br />
Managed Fund since 2005<br />
MAXIMUM SALES CHARGE & COMMISSION<br />
CLASS A CLASS C73 Sales Charge 4.25% 0.00%<br />
<strong>Dealer</strong> Concession 4.00 1.00<br />
12b-1 Fee to <strong>Dealer</strong> 0.15 0.65<br />
CLASS R ADVISOR89 Sales Charge 0.00% 0.00%<br />
<strong>Dealer</strong> Concession 0.00 0.00<br />
12b-1 Fee to <strong>Dealer</strong> 0.50 0.00<br />
See page 128 for more commission<br />
information and page 125 for footnotes.<br />
PORTFOLIO HOLDINGS 29 5/31<br />
Total Number of Positions 189<br />
Average Maturity 5.68 years<br />
Average Duration 32 4.02 years<br />
Average Credit Quality B+<br />
CREDIT QUALITY<br />
AAA 4.39%<br />
AA 0.01<br />
A 2.73<br />
BBB 7.00<br />
BB 26.83<br />
B 34.07<br />
CCC 19.77<br />
CC 2.01<br />
C 0.30<br />
D 2.18<br />
Not Rated 0.71<br />
TOP 10 HOLDINGS 7<br />
Ford Motor Credit Company LLC 2.14%<br />
HCA Inc. 2.08<br />
Charter Communications Holdings 1.68<br />
Intelsat Bermuda 1.59<br />
Chesapeake Energy Corp. 1.52<br />
GMAC LLC 1.51<br />
Qwest Communications International 1.43<br />
NRG Energy LLC 1.33<br />
Texas Competitive Electric Holdings 1.26<br />
Host Hotels & Resorts LP 1.22<br />
ANNUAL TOTAL RETURN 5 –CLASS A<br />
WITHOUT SALES CHARGES<br />
0<br />
3.91%<br />
9.23%<br />
3.18%<br />
-22.54%<br />
2005 2006 2007 2008<br />
22.86%<br />
YTD 2009 14<br />
6/30/09<br />
PERFORMANCE INFORMATION<br />
ANNUAL TOTAL RETURN–WITHOUT SALES CHARGES5 1999 2000 2001 2002 2003 2004 2005 2006 2007 2008<br />
YTD<br />
200914 CLASS A<br />
CLASS C<br />
ADVISOR43 0.48 -7.37 2.92 -3.43 35.29 11.59 3.91 9.23 3.18 -22.54 22.86<br />
-0.03 -8.23 2.88 -4.45 34.56 11.50 3.36 8.64 2.64 -22.83 22.41<br />
0.61 -7.24 3.04 -3.32 35.47 11.74 4.06 9.40 3.31 -22.43 22.94<br />
AVERAGE ANNUAL TOTAL RETURN – AVERAGE ANNUAL TOTAL RETURN–<br />
WITHOUT SALES CHARGES5 6, 10<br />
WITH SALES CHARGES<br />
1 YR 3 YR 5 YR 10 YR INCEPTION 1 YR 3 YR 5 YR 10 YR INCEPTION<br />
CLASS A<br />
CLASS C<br />
ADVISOR43 -3.62 1.80 4.21 4.37 7.55 -7.90 0.36 3.31 3.91 7.42<br />
-4.10 1.28 3.66 3.82 5.10 -4.97 1.28 3.66 3.82 5.10<br />
-3.51 1.94 4.36 4.51 7.60 -3.51 1.94 4.36 4.51 7.60<br />
Advisor Class shares are only offered to certain eligible investors as stated in the prospectus.<br />
HYPOTHETICAL INVESTMENT 22<br />
CLASS A CLASS C ADVISOR43 $10,000 from Inception $169,243 $20,177 $180,444<br />
FUND FACTS<br />
Net Assets (millions)<br />
Expense Ratio2 Net Asset Value<br />
Public Offering Price<br />
Beta 3<br />
Standard Deviation 65<br />
ASSET ALLOCATION 29, 60 5/31<br />
Bonds 93%<br />
Cash 6%<br />
Stocks 1%<br />
CLASS A CLASS C ADVISOR<br />
$1,886.0 $326.4 $174.9<br />
0.76% 1.27% 0.62%<br />
$1.70 $1.71 $1.70<br />
$1.78 $1.71 $1.70<br />
0.89 0.90 0.89<br />
14.92 15.08 15.07<br />
FUND DISTRIBUTIONS<br />
Dividend Frequency<br />
Monthly on or near the 3rd business day.<br />
CLASS A CLASS C ADVISOR<br />
Distribution Rate15 4, 30<br />
Dividend History<br />
7.75% 7.65% 8.26%<br />
6/09<br />
$0.0115 $0.0109 $0.0117<br />
5/09<br />
0.0115 0.0109 0.0117<br />
4/09<br />
Capital Gains (last 4, 30 12 mos.)<br />
0.0115 0.0109 0.0117<br />
Short-Term<br />
— — —<br />
Long-Term<br />
— — —<br />
72 <strong>Dealer</strong> <strong>Facts</strong> <strong>Guide</strong> Go to franklintempleton.com or call (800) 223-2141 DEALER USE ONLY/NOT FOR DISTRIBUTION TO THE PUBLIC
78 6/30/09<br />
<strong>Franklin</strong> Limited Maturity U.S. Government Securities Fund<br />
OVERALL MORNINGSTAR<br />
8, 67<br />
RATINGTM – CLASS A<br />
TM 67<br />
MORNINGSTAR STYLE BOX<br />
DURATION<br />
Short Int Long<br />
✕<br />
QUALITY<br />
High<br />
Medium<br />
Low<br />
✕ Current<br />
Historical<br />
INVESTMENT CATEGORY<br />
Fixed Income<br />
37, 75<br />
PRIMARY INVESTMENT<br />
U.S. government securities including<br />
U.S. Treasury securities and other<br />
securities issued or guaranteed by<br />
the U.S. government, its agencies or<br />
instrumentalities. Some of the fund’s<br />
investments may include secu rities<br />
issued by U.S. government-sponsored<br />
entities, such as Fannie Mae and<br />
Freddie Mac.<br />
FUND REFERENCE<br />
CLASS A ADVISOR89 Fund No. 136 636<br />
CUSIP 353 612 203 353 612 864<br />
Symbol FRGVX FSUAX<br />
Inception1 4/15/87 4/15/87<br />
ANNUAL PROSPECTUS UPDATE AVAILABLE:<br />
March 1<br />
PORTFOLIO MANAGER PROFILE84 Kent C. Burns, CFA<br />
Joined <strong>Franklin</strong> <strong>Templeton</strong> in 1994<br />
Managed Fund since 2003<br />
Paul Varunok<br />
Joined <strong>Franklin</strong> <strong>Templeton</strong> in 2001<br />
Managed Fund since 2005<br />
MAXIMUM SALES CHARGE & COMMISSION<br />
CLASS A ADVISOR89 Sales Charge 2.25% 0.00%<br />
<strong>Dealer</strong> Concession 2.00 0.00<br />
12b-1 Fee to <strong>Dealer</strong> 0.10 0.00<br />
See page 128 for more commission<br />
information and page 125 for footnotes.<br />
PERFORMANCE INFORMATION<br />
5, 13, 33<br />
ANNUAL TOTAL RETURN–WITHOUT SALES CHARGES<br />
1999 2000 2001 2002 2003 2004 2005 2006 2007 2008<br />
YTD<br />
200914 CLASS A<br />
ADVISOR43 1.51 8.39 6.64 7.36 1.73 1.21 0.72 3.57 6.65 7.18 1.41<br />
1.63 8.40 6.84 7.46 1.83 1.31 0.82 3.68 6.77 7.30 1.47<br />
AVERAGE ANNUAL TOTAL RETURN – AVERAGE ANNUAL TOTAL RETURN–<br />
WITHOUT SALES CHARGES5, 13, 33 6, 13, 33<br />
WITH SALES CHARGES<br />
1 YR 3 YR 5 YR 10 YR INCEPTION 1 YR 3 YR 5 YR 10 YR INCEPTION<br />
CLASS A<br />
ADVISOR43 6.96 6.14 4.19 4.60 5.71 4.58 5.36 3.73 4.36 5.61<br />
7.07 6.25 4.30 4.70 5.77 7.07 6.25 4.30 4.70 5.77<br />
Advisor Class shares are only offered to certain eligible investors as stated in the prospectus.<br />
PORTFOLIO HOLDINGS 29 6/30<br />
Total Number of Positions 221<br />
Average Coupon 4.57%<br />
Average Life 3.05 years<br />
Average Duration 32 2.60 years<br />
Average Credit Quality AAA<br />
MATURITY BREAKDOWN<br />
0–1 year 3.12%<br />
1–2 years 12.27<br />
2–3 years 22.63<br />
3–5 years 24.95<br />
5–7 years 5.40<br />
7–10 years 2.83<br />
10–15 years 11.03<br />
15–20 years 1.28<br />
20–30 years 16.49<br />
PORTFOLIO BREAKDOWN<br />
U.S. Agency 63.63%<br />
Mortgage-Backed Securities 21.18<br />
Global Government 1.76<br />
Other 10.31<br />
ANNUAL TOTAL RETURN 5, 33 –CLASS A<br />
WITHOUT SALES CHARGES<br />
0<br />
0.72%<br />
3.57%<br />
6.65%<br />
7.18%<br />
2005 2006 2007 2008<br />
1.41%<br />
YTD 2009 14<br />
22, 33<br />
HYPOTHETICAL INVESTMENT<br />
$10,000 from Inception<br />
FUND FACTS<br />
Net Assets (millions)<br />
Expense Ratio2 Net Asset Value<br />
Public Offering Price<br />
Beta 3<br />
Standard Deviation 65<br />
ASSET ALLOCATION 29, 60 6/30<br />
Bonds 97%<br />
Cash 3%<br />
CLASS A ADVISOR43 $33,575 $34,764<br />
CLASS A ADVISOR<br />
$355.6 $44.2<br />
0.88% 0.78%<br />
$10.41 $10.40<br />
$10.65 $10.40<br />
1.21 1.21<br />
2.28 2.28<br />
FUND DISTRIBUTIONS<br />
Dividend Frequency<br />
Accrued daily and paid monthly on the last business day.<br />
CLASS A ADVISOR<br />
Distribution Rate15 4, 30<br />
Dividend History<br />
3.14% 3.32%<br />
6/09<br />
$0.0279 $0.0287<br />
5/09<br />
0.0279 0.0288<br />
4/09<br />
Capital Gains (last 4, 30<br />
12 mos.)<br />
0.0279 0.0288<br />
Short-Term<br />
— —<br />
Long-Term<br />
— —<br />
DEALER USE ONLY/NOT FOR DISTRIBUTION TO THE PUBLIC Go to franklintempleton.com or call (800) 223-2141 <strong>Dealer</strong> <strong>Facts</strong> <strong>Guide</strong> 73<br />
OPEN-END FUNDS VALUE BLEND GROWTH SECTOR GLOBAL INTERNATIONAL HYBRID ASSET ALLOCATION FIXED INCOME TAX-FREE INCOME
OPEN-END FUNDS<br />
VALUE<br />
BLEND<br />
GROWTH<br />
SECTOR<br />
GLOBAL<br />
INTERNATIONAL<br />
HYBRID<br />
ASSET ALLOCATION<br />
FIXED INCOME<br />
TAX-FREE INCOME<br />
<strong>Franklin</strong> Low Duration Total Return Fund<br />
TM 67<br />
MORNINGSTAR STYLE BOX<br />
DURATION<br />
Short Int Long<br />
✕<br />
QUALITY<br />
High<br />
Medium<br />
✕ Current<br />
Low Historical<br />
INVESTMENT CATEGORY<br />
Fixed Income<br />
37, 75<br />
PRIMARY INVESTMENT<br />
The fund seeks to provide a high<br />
level of current income consistent<br />
with prudent investing, while seeking<br />
preservation of capital. The fund<br />
invests primarily in investment-grade<br />
debt securities, targeting an estimated<br />
average portfolio duration of three<br />
years or less. Managers strategically<br />
allocate investments across different<br />
debt sectors, including government<br />
and corporate debt securities and<br />
mortgage and asset-backed securities.<br />
Some of the fund’s investments may<br />
include securities issued by U.S.<br />
government-sponsored entities, such<br />
as Fannie Mae and Freddie Mac.<br />
FUND REFERENCE<br />
CLASS A ADVISOR89 Fund No. 401 621<br />
CUSIP 353 612 690 353 612 617<br />
Symbol FLDAX —<br />
Inception1 11/17/04 11/17/04<br />
ANNUAL PROSPECTUS UPDATE AVAILABLE:<br />
March 1<br />
PORTFOLIO MANAGER PROFILE84 Roger Bayston, CFA<br />
Joined <strong>Franklin</strong> <strong>Templeton</strong> in 1991<br />
Managed Fund since 2004<br />
Kent C. Burns, CFA<br />
Joined <strong>Franklin</strong> <strong>Templeton</strong> in 1994<br />
Managed Fund since 2004<br />
Christopher J. Molumphy, CFA<br />
Joined <strong>Franklin</strong> <strong>Templeton</strong> in 1988<br />
Managed Fund since 2004<br />
MAXIMUM SALES CHARGE & COMMISSION<br />
CLASS A ADVISOR89 Sales Charge 2.25% 0.00%<br />
<strong>Dealer</strong> Concession 2.00 0.00<br />
12b-1 Fee to <strong>Dealer</strong> 0.25 0.00<br />
See page 128 for more commission<br />
information and page 125 for footnotes.<br />
PORTFOLIO HOLDINGS29 6/30<br />
Total Number of Positions 266<br />
Average Coupon 4.29%<br />
Average Life 2.64 years<br />
Average Duration32 1.90 years<br />
Average Credit Quality AA-<br />
MATURITY BREAKDOWN<br />
0–1 year 13.28%<br />
1–2 years 17.51<br />
2–3 years 21.23<br />
3–5 years 22.17<br />
5–7 years 2.82<br />
7–10 years 0.04<br />
10–15 years 4.89<br />
15–20 years 0.07<br />
20–30 years 17.99<br />
PORTFOLIO BREAKDOWN<br />
U.S. Agency 32.80%<br />
Corporate Bonds 31.01<br />
Mortgage-Backed Securities 9.14<br />
Asset-Backed Securities 4.89<br />
Global Government<br />
Commercial Mortgage-Backed<br />
3.00<br />
Securities 0.90<br />
Other 12.62<br />
9, 22<br />
HYPOTHETICAL INVESTMENT<br />
$10,000 from Inception<br />
FUND FACTS<br />
Net Assets (millions)<br />
2, 9<br />
Expense Ratio<br />
without waiver<br />
with waiver<br />
Net Asset Value<br />
Public Offering Price<br />
Beta 3<br />
Standard Deviation 65<br />
6/30/09<br />
PERFORMANCE INFORMATION<br />
5, 9<br />
ANNUAL TOTAL RETURN–WITHOUT SALES CHARGES<br />
1999 2000 2001 2002 2003 2004 2005 2006 2007 2008<br />
YTD<br />
200914 CLASS A<br />
ADVISOR43 — — — — — — 1.26 4.26 5.86 2.32 3.97<br />
— — — — — — 1.26 4.26 5.86 2.45 4.08<br />
AVERAGE ANNUAL TOTAL RETURN – AVERAGE ANNUAL TOTAL RETURN–<br />
WITHOUT SALES CHARGES5, 9 6, 9<br />
WITH SALES CHARGES<br />
1 YR 3 YR 5 YR 10 YR INCEPTION 1 YR 3 YR 5 YR 10 YR INCEPTION<br />
CLASS A<br />
ADVISOR43 4.80 5.12 — — 3.82 2.42 4.34 — — 3.31<br />
5.02 5.21 — — 3.87 5.02 5.21 — — 3.87<br />
Advisor Class shares are only offered to certain eligible investors as stated in the prospectus.<br />
ANNUAL TOTAL RETURN 5, 9 –CLASS A<br />
WITHOUT SALES CHARGES<br />
5.86%<br />
0<br />
1.26%<br />
4.26%<br />
2.32%<br />
2005 2006 2007 2008<br />
CLASS A ADVISOR43 $11,622 $11,918<br />
CLASS A ADVISOR<br />
$107.8 $0.3<br />
1.55% 1.30%<br />
0.94% 0.69%<br />
$9.97 $9.97<br />
$10.20 $9.97<br />
0.70 0.70<br />
2.10 2.08<br />
FUND DISTRIBUTIONS<br />
Dividend Frequency<br />
Accrued daily and paid monthly on the last business day.<br />
CLASS A ADVISOR<br />
9, 15<br />
Distribution Rate<br />
Dividend History 30<br />
6/09<br />
5/09<br />
4/09<br />
Capital Gains (last 12 mos.) 30<br />
2.82% 3.11%<br />
$0.0240 $0.0258<br />
0.0225 0.0245<br />
0.0164 0.0178<br />
Short-Term<br />
— —<br />
Long-Term<br />
— —<br />
3.97%<br />
YTD 2009 14<br />
ASSET ALLOCATION 29, 60 6/30<br />
Bonds 94%<br />
Cash 6%<br />
74 <strong>Dealer</strong> <strong>Facts</strong> <strong>Guide</strong> Go to franklintempleton.com or call (800) 223-2141 DEALER USE ONLY/NOT FOR DISTRIBUTION TO THE PUBLIC
<strong>Franklin</strong> Real Return Fund<br />
OVERALL MORNINGSTAR<br />
RATINGTM – CLASS A X<br />
TM 67<br />
MORNINGSTAR STYLE BOX<br />
DURATION<br />
Short Int Long<br />
✕<br />
QUALITY<br />
High<br />
Medium<br />
Low<br />
INVESTMENT CATEGORY<br />
Fixed Income<br />
PRIMARY INVESTMENT 37<br />
The fund seeks to achieve total return<br />
that exceeds the rate of inflation over<br />
an economic cycle. The fund seeks to<br />
allocate assets among investments to<br />
achieve the highest level of real return<br />
(total return less inflation) consistent<br />
with an acceptable level of risk. It is<br />
expected that the fund will generally<br />
invest a substantial portion of its<br />
assets in inflation-protected securities.<br />
Managers also have the flexibility to<br />
invest in other sectors of the market<br />
to increase real return potential and<br />
offer greater diversification.<br />
FUND REFERENCE<br />
CLASS A CLASS C<br />
Fund No. 423 213<br />
CUSIP 353 612 724 353 612 591<br />
Symbol FRRAX —<br />
Inception1 11/17/04 11/17/04<br />
ADVISOR 89<br />
Fund No. 623<br />
CUSIP 353 612 716<br />
Symbol FARRX<br />
Inception 1 11/17/04<br />
✕ Current<br />
Historical<br />
ANNUAL PROSPECTUS UPDATE AVAILABLE:<br />
March 1<br />
PORTFOLIO MANAGER PROFILE84 T. Anthony Coffey, CFA<br />
Joined <strong>Franklin</strong> <strong>Templeton</strong> in 1989<br />
Managed Fund since 2004<br />
Kent C. Burns, CFA<br />
Joined <strong>Franklin</strong> <strong>Templeton</strong> in 1994<br />
Managed Fund since 2004<br />
MAXIMUM SALES CHARGE & COMMISSION<br />
CLASS A CLASS C73 Sales Charge 4.25% 0.00%<br />
<strong>Dealer</strong> Concession 4.00 1.00<br />
12b-1 Fee to <strong>Dealer</strong> 0.25 0.65<br />
ADVISOR89 Sales Charge 0.00%<br />
<strong>Dealer</strong> Concession 0.00<br />
12b-1 Fee to <strong>Dealer</strong> 0.00<br />
See page 128 for more commission<br />
information and page 125 for footnotes.<br />
PORTFOLIO HOLDINGS 29 6/30<br />
Total Number of Positions 105<br />
Average Coupon 2.19%<br />
Average Duration 32 1.59 years<br />
Average Life 2.70 years<br />
MATURITY BREAKDOWN<br />
0–1 year 16.14%<br />
1–3 years 24.65<br />
3–5 years 14.47<br />
5–7 years 13.30<br />
7–10 years 1.24<br />
10–30 years 1.30<br />
PORTFOLIO BREAKDOWN<br />
Treasury Inflation-Protected<br />
Securities 65.91%<br />
Foreign Debt Securities 15.35<br />
Natural Resources 5.82<br />
High Yield Bonds 4.37<br />
REITs 0.58<br />
ANNUAL TOTAL RETURN 5, 9 –CLASS A<br />
WITHOUT SALES CHARGES<br />
0<br />
3.81%<br />
5.20%<br />
10.21%<br />
-4.49%<br />
2005 2006 2007 2008<br />
5.54%<br />
YTD 2009 14<br />
6/30/09<br />
PERFORMANCE INFORMATION<br />
5, 9<br />
ANNUAL TOTAL RETURN–WITHOUT SALES CHARGES<br />
1999 2000 2001 2002 2003 2004 2005 2006 2007 2008<br />
YTD<br />
200914 CLASS A — — — — — — 3.81 5.20 10.21 -4.49 5.54<br />
CLASS C — — — — — — 2.93 4.38 9.24 -5.33 5.34<br />
ADVISOR — — — — — — 4.12 5.51 10.40 -4.30 5.74<br />
AVERAGE ANNUAL TOTAL RETURN – AVERAGE ANNUAL TOTAL RETURN–<br />
WITHOUT SALES CHARGES5, 9 6, 9<br />
WITH SALES CHARGES<br />
1 YR 3 YR 5 YR 10 YR INCEPTION 1 YR 3 YR 5 YR 10 YR INCEPTION<br />
CLASS A -4.22 4.40 — — 4.51 -8.32 2.89 — — 3.54<br />
CLASS C -4.86 3.60 — — 3.67 -5.79 3.60 — — 3.67<br />
ADVISOR -3.95 4.66 — — 4.77 -3.95 4.66 — — 4.77<br />
Advisor Class shares are only offered to certain eligible investors as stated in the prospectus.<br />
9, 22<br />
HYPOTHETICAL INVESTMENT<br />
CLASS A CLASS C ADVISOR<br />
$10,000 from Inception $11,742 $11,810 $12,401<br />
FUND FACTS<br />
Net Assets (millions)<br />
2, 9<br />
Expense Ratio<br />
without waiver<br />
with waiver<br />
Net Asset Value<br />
Public Offering Price<br />
Beta 3<br />
Standard Deviation 65<br />
FUND DISTRIBUTIONS<br />
Dividend Frequency<br />
Monthly.<br />
, 9, 15<br />
Distribution Rate*<br />
Dividend History 30<br />
6/09<br />
5/09<br />
4/09<br />
Capital Gains (last 12 mos.) 30<br />
Short-Term<br />
Long-Term<br />
ASSET ALLOCATION 29, 60 6/30<br />
Bonds 86%<br />
Cash 8%<br />
Stock 6%<br />
CLASS A CLASS C ADVISOR<br />
$321.6 $11.6 $17.7<br />
1.08% 1.48% 0.83%<br />
0.90% 1.30% 0.65%<br />
$10.29 $10.26 $10.32<br />
$10.75 $10.26 $10.32<br />
0.63 — 0.63<br />
6.31 — 6.28<br />
CLASS A CLASS C ADVISOR<br />
— — —<br />
— — —<br />
— — —<br />
— — —<br />
— — —<br />
— — —<br />
*Please note, the fund’s distributions should be expected to vary<br />
significantly from month to month. Because the fund has a significant<br />
investment in Treasury inflation protected securities (TIPS), it is highly<br />
influenced by the TIPS market and the monthly inflation adjustments<br />
on these securities.<br />
DEALER USE ONLY/NOT FOR DISTRIBUTION TO THE PUBLIC Go to franklintempleton.com or call (800) 223-2141 <strong>Dealer</strong> <strong>Facts</strong> <strong>Guide</strong> 75<br />
OPEN-END FUNDS VALUE BLEND GROWTH SECTOR GLOBAL INTERNATIONAL HYBRID ASSET ALLOCATION FIXED INCOME TAX-FREE INCOME
OPEN-END FUNDS<br />
VALUE<br />
BLEND<br />
GROWTH<br />
SECTOR<br />
GLOBAL<br />
INTERNATIONAL<br />
HYBRID<br />
ASSET ALLOCATION<br />
FIXED INCOME<br />
TAX-FREE INCOME<br />
<strong>Franklin</strong> Strategic Income Fund<br />
OVERALL MORNINGSTAR<br />
8, 67<br />
RATINGTM – CLASS A<br />
TM 67<br />
MORNINGSTAR STYLE BOX<br />
DURATION<br />
Short Int Long<br />
QUALITY<br />
High<br />
✕<br />
Medium<br />
Low<br />
✕ Current<br />
Historical<br />
INVESTMENT CATEGORY<br />
Fixed Income<br />
PRIMARY INVESTMENT 37<br />
Fixed-income securities issued<br />
worldwide. The fund seeks to allocate<br />
its investments among several<br />
fixed income sectors, including<br />
foreign government and corporate<br />
securities, higher-yielding, lowerrated<br />
corporate bonds, convertible<br />
bonds, mortgage-backed securities,<br />
and U.S. government bonds.<br />
FUND REFERENCE<br />
CLASS A CLASS C<br />
Fund No. 194 294<br />
CUSIP 354 713 505 354 713 836<br />
Symbol FRSTX FSGCX<br />
Inception1 5/24/94 5/1/98<br />
CLASS R ADVISOR89 Fund No. 894 694<br />
CUSIP 354 713 554 354 713 737<br />
Symbol FKSRX FKSAX<br />
Inception1 5/24/94 5/24/94<br />
ANNUAL PROSPECTUS UPDATE AVAILABLE:<br />
September 1<br />
PORTFOLIO MANAGER PROFILE84 Christopher J. Molumphy, CFA<br />
Joined <strong>Franklin</strong> <strong>Templeton</strong> in 1988<br />
Managed Fund since 1994<br />
Eric G. Takaha, CFA<br />
Joined <strong>Franklin</strong> <strong>Templeton</strong> in 1989<br />
Managed Fund since 1997<br />
MAXIMUM SALES CHARGE & COMMISSION<br />
CLASS A CLASS C73 Sales Charge 4.25% 0.00%<br />
<strong>Dealer</strong> Concession 4.00 1.00<br />
12b-1 Fee to <strong>Dealer</strong> 0.25 0.65<br />
CLASS R ADVISOR89 Sales Charge 0.00% 0.00%<br />
<strong>Dealer</strong> Concession 0.00 0.00<br />
12b-1 Fee to <strong>Dealer</strong> 0.50 0.00<br />
See page 128 for more commission<br />
information and page 125 for footnotes.<br />
PORTFOLIO HOLDINGS29 5/31<br />
Total Number of Positions 714<br />
Average Duration32 4.37 years<br />
Average Credit Quality BBB+<br />
PORTFOLIO BREAKDOWN<br />
High-Yield Corporate Bonds<br />
& Preferred 22.83%<br />
Investment Grade Corporate Bonds 18.20<br />
Mortgages/Other Asset-Backed<br />
Bonds 16.83<br />
Floating Rate Bank Loans 9.47<br />
U.S. Government Bonds 8.85<br />
Other International Bonds<br />
(Non-U.S. Dollar) 90 8.63<br />
Emerging Market Bonds 6.36<br />
Municipal Bonds 2.68<br />
International Developed Market<br />
Bonds (Non-U.S. Dollar) 2.27<br />
Convertible Securities 0.30<br />
TOP 10 HOLDINGS 7<br />
Russian Federation 1.70%<br />
U.S. Treasury Bond 1.07<br />
Mexican Fixed Rate Bonds 1.05<br />
Republic of Argentina 1.03<br />
California State Government<br />
Obligation 0.92<br />
Nota do Tesouro Nacional 0.83<br />
Swedish Government 0.78<br />
FNMA, 5.50% 0.72<br />
U.S. Treasury Note 0.72<br />
FNMA, 5.00% 0.71<br />
ANNUAL TOTAL RETURN 5 –CLASS A<br />
WITHOUT SALES CHARGES<br />
0<br />
1.50%<br />
8.20%<br />
5.87%<br />
-10.94%<br />
2005 2006 2007 2008<br />
12.56%<br />
YTD 2009 14<br />
6/30/09<br />
PERFORMANCE INFORMATION<br />
5, 13<br />
ANNUAL TOTAL RETURN–WITHOUT SALES CHARGES<br />
1999 2000 2001 2002 2003 2004 2005 2006 2007 2008<br />
YTD<br />
200914 CLASS A<br />
CLASS C<br />
ADVISOR43 2.33 2.60 5.40 4.70 22.08 9.86 1.50 8.20 5.87 -10.94 12.56<br />
1.91 2.18 4.99 4.30 21.59 9.43 1.10 7.78 5.35 -11.21 12.34<br />
2.41 2.96 5.67 4.85 22.38 10.23 1.75 8.36 6.12 -10.62 12.68<br />
AVERAGE ANNUAL TOTAL RETURN – AVERAGE ANNUAL TOTAL RETURN–<br />
WITHOUT SALES CHARGES5, 13 6, 13<br />
WITH SALES CHARGES<br />
1 YR 3 YR 5 YR 10 YR INCEPTION 1 YR 3 YR 5 YR 10 YR INCEPTION<br />
CLASS A<br />
CLASS C<br />
ADVISOR43 0.07 4.07 5.04 6.00 7.38 -4.17 2.56 4.14 5.55 7.07<br />
-0.33 3.66 4.63 5.59 5.11 -1.25 3.66 4.63 5.59 5.11<br />
0.32 4.32 5.30 6.27 7.56 0.32 4.32 5.30 6.27 7.56<br />
Advisor Class shares are only offered to certain eligible investors as stated in the prospectus.<br />
HYPOTHETICAL INVESTMENT 22<br />
CLASS A CLASS C ADVISOR43 $10,000 from Inception $28,071 $17,439 $30,054<br />
FUND FACTS<br />
Net Assets (millions)<br />
Expense Ratio2 Net Asset Value<br />
Public Offering Price<br />
Beta 3<br />
Standard Deviation 65<br />
ASSET ALLOCATION 29, 60 5/31<br />
Bonds 96%<br />
Cash 4%<br />
CLASS A CLASS C ADVISOR<br />
$2,230.2 $848.1 $190.7<br />
0.91% 1.31% 0.66%<br />
$9.15 $9.15 $9.16<br />
$9.56 $9.15 $9.16<br />
1.09 1.09 1.09<br />
8.47 8.49 8.51<br />
FUND DISTRIBUTIONS<br />
Dividend Frequency<br />
Monthly on the 3rd business day.<br />
CLASS A CLASS C ADVISOR<br />
Distribution Rate15 4, 30<br />
Dividend History<br />
4.77% 4.62% 5.21%<br />
6/09<br />
$0.0380 $0.0352 $0.0398<br />
5/09<br />
0.0380 0.0352 0.0398<br />
4/09<br />
Capital Gains (last 4, 30 12 mos.)<br />
0.0380 0.0352 0.0398<br />
Short-Term<br />
— — —<br />
Long-Term<br />
— — —<br />
76 <strong>Dealer</strong> <strong>Facts</strong> <strong>Guide</strong> Go to franklintempleton.com or call (800) 223-2141 DEALER USE ONLY/NOT FOR DISTRIBUTION TO THE PUBLIC
<strong>Franklin</strong> Strategic Mortgage Portfolio<br />
OVERALL MORNINGSTAR<br />
8, 67<br />
RATINGTM – CLASS A<br />
TM 79<br />
MORNINGSTAR STYLE BOX<br />
DURATION<br />
Short Int Long<br />
✕<br />
QUALITY<br />
High<br />
Medium<br />
Low<br />
INVESTMENT CATEGORY<br />
Fixed Income<br />
37, 75<br />
PRIMARY INVESTMENT<br />
Mortgage securities which are issued<br />
or guaranteed by the U.S. government,<br />
its agencies or instrumentalities.<br />
The fund may also invest in adjustablerate<br />
securities that are guaranteed<br />
by the U.S. government or issued by<br />
private organizations. Some of the<br />
fund’s investments may include securities<br />
issued by U.S. governmentsponsored<br />
entities, such as Fannie<br />
Mae and Freddie Mac.<br />
FUND REFERENCE<br />
CLASS A<br />
Fund No. 157<br />
CUSIP 354 71H 108<br />
Symbol FSMIX<br />
Inception 1 2/1/93<br />
✕ Current<br />
Historical<br />
ANNUAL PROSPECTUS UPDATE AVAILABLE:<br />
February 1<br />
PORTFOLIO MANAGER PROFILE84 Roger Bayston, CFA<br />
Joined <strong>Franklin</strong> <strong>Templeton</strong> in 1991<br />
Managed Fund since 1993<br />
Paul Varunok<br />
Joined <strong>Franklin</strong> <strong>Templeton</strong> in 2001<br />
Managed Fund since 2001<br />
David Yuen, CFA<br />
Joined <strong>Franklin</strong> <strong>Templeton</strong> in 2000<br />
Managed Fund since 2005<br />
MAXIMUM SALES CHARGE & COMMISSION<br />
CLASS A<br />
Sales Charge 4.25%<br />
<strong>Dealer</strong> Concession 4.00<br />
12b-1 Fee to <strong>Dealer</strong> 0.00<br />
See page 128 for more commission<br />
information and page 125 for footnotes.<br />
PORTFOLIO HOLDINGS 29 6/30<br />
Total Number of Positions 408<br />
Average Coupon 5.12%<br />
Average Life 4.81 years<br />
Average Duration 3.08 years<br />
Average Credit Quality AAA<br />
CREDIT QUALITY<br />
AAA 94.64%<br />
AA 2.38<br />
A 1.02<br />
BBB 0.22<br />
BB 0.26<br />
B 1.48<br />
PORTFOLIO BREAKDOWN 57<br />
Mortgage-Backed Securities 81.11%<br />
Commercial Mortgage-Backed<br />
Securities 14.99<br />
Asset-Backed Securities 8.16<br />
Global Government 0.15<br />
Other 20.94<br />
ANNUAL TOTAL RETURN 5 –CLASS A<br />
WITHOUT SALES CHARGES<br />
0<br />
2.27%<br />
4.60%<br />
4.28%<br />
-6.37%<br />
2005 2006 2007 2008<br />
4.75%<br />
YTD 2009 14<br />
HYPOTHETICAL INVESTMENT 22<br />
$10,000 from Inception<br />
FUND FACTS<br />
Net Assets (millions)<br />
Expense Ratio2 Net Asset Value<br />
Public Offering Price<br />
Beta 3<br />
Standard Deviation 65<br />
6/30/09<br />
PERFORMANCE INFORMATION<br />
ANNUAL TOTAL RETURN–WITHOUT SALES CHARGES5 1999 2000 2001 2002 2003 2004 2005 2006 2007 2008<br />
YTD<br />
200914 CLASS A 1.49 11.93 8.37 8.85 2.88 4.53 2.27 4.60 4.28 -6.37 4.75<br />
AVERAGE ANNUAL TOTAL RETURN – AVERAGE ANNUAL TOTAL RETURN–<br />
WITHOUT SALES CHARGES5 WITH SALES CHARGES6 1 YR 3 YR 5 YR 10 YR INCEPTION 1 YR 3 YR 5 YR 10 YR INCEPTION<br />
CLASS A -0.89 2.39 2.53 4.64 5.42 -5.06 0.91 1.64 4.19 5.15<br />
The negative cash position reflects the temporary<br />
imbalance between cash and securities caused by the<br />
time needed to settle securities transactions.<br />
ASSET ALLOCATION 29, 60 6/30<br />
Bonds 125%<br />
Cash -25%<br />
CLASS A<br />
$22,785<br />
CLASS A<br />
$102.2<br />
0.59%<br />
$8.49<br />
$8.87<br />
0.07<br />
4.03<br />
FUND DISTRIBUTIONS<br />
Dividend Frequency<br />
Accrued daily and paid monthly on the last business day.<br />
CLASS A<br />
Distribution Rate15 5.92%<br />
4, 30<br />
Dividend History<br />
6/09<br />
$0.0459<br />
5/09<br />
0.0399<br />
4/09<br />
0.0450<br />
Capital Gains (last 4, 30<br />
12 mos.)<br />
Short-Term<br />
—<br />
Long-Term<br />
—<br />
DEALER USE ONLY/NOT FOR DISTRIBUTION TO THE PUBLIC Go to franklintempleton.com or call (800) 223-2141 <strong>Dealer</strong> <strong>Facts</strong> <strong>Guide</strong> 77<br />
OPEN-END FUNDS VALUE BLEND GROWTH SECTOR GLOBAL INTERNATIONAL HYBRID ASSET ALLOCATION FIXED INCOME TAX-FREE INCOME
OPEN-END FUNDS<br />
VALUE<br />
BLEND<br />
GROWTH<br />
SECTOR<br />
GLOBAL<br />
INTERNATIONAL<br />
HYBRID<br />
ASSET ALLOCATION<br />
FIXED INCOME<br />
TAX-FREE INCOME<br />
<strong>Franklin</strong> Total Return Fund<br />
OVERALL MORNINGSTAR<br />
RATINGTM – CLASS A X<br />
TM 67<br />
MORNINGSTAR STYLE BOX<br />
DURATION<br />
Short Int Long<br />
✕<br />
QUALITY<br />
High<br />
Medium<br />
Low<br />
✕ Current<br />
Historical<br />
INVESTMENT CATEGORY<br />
Fixed Income<br />
37, 75<br />
PRIMARY INVESTMENT<br />
The fund invests in investment-grade<br />
bonds, including government bonds,<br />
mortgage- and asset-backed securit ies,<br />
as well as corporate bonds issued by<br />
organizations in a wide range of industries,<br />
and financial futures contracts,<br />
or options on such contracts. Some<br />
of the fund’s investments may include<br />
securities issued by U.S. governmentsponsored<br />
entities, such as Fannie<br />
Mae and Freddie Mac.<br />
FUND REFERENCE<br />
CLASS A CLASS C<br />
Fund No. 460 560<br />
CUSIP 353 612 856 353 612 757<br />
Symbol FKBAX FCTLX<br />
Inception1 8/3/98 3/1/02<br />
CLASS R ADVISOR89 Fund No. 860 660<br />
CUSIP 353 612 773 353 612 849<br />
Symbol FTRRX FBDAX<br />
Inception1 8/3/98 8/3/98<br />
ANNUAL PROSPECTUS UPDATE AVAILABLE:<br />
March 1<br />
PORTFOLIO MANAGER PROFILE 84<br />
Roger Bayston, CFA<br />
Joined <strong>Franklin</strong> <strong>Templeton</strong> in 1991<br />
Managed Fund since 1998<br />
Kent C. Burns, CFA<br />
Joined <strong>Franklin</strong> <strong>Templeton</strong> in 1994<br />
Managed Fund since 1998<br />
Christopher J. Molumphy, CFA<br />
Joined <strong>Franklin</strong> <strong>Templeton</strong> in 1988<br />
Managed Fund since 1998<br />
David Yuen, CFA<br />
Joined <strong>Franklin</strong> <strong>Templeton</strong> in 2000<br />
Managed Fund since 2005<br />
Michael J. Materasso<br />
Joined <strong>Franklin</strong> <strong>Templeton</strong> in 1988<br />
Managed Fund since 2008<br />
MAXIMUM SALES CHARGE & COMMISSION<br />
CLASS A CLASS C73 Sales Charge 4.25% 0.00%<br />
<strong>Dealer</strong> Concession 4.00 1.00<br />
12b-1 Fee to <strong>Dealer</strong> 0.25 0.65<br />
CLASS R ADVISOR89 Sales Charge 0.00% 0.00%<br />
<strong>Dealer</strong> Concession 0.00 0.00<br />
12b-1 Fee to <strong>Dealer</strong> 0.50 0.00<br />
See page 128 for more commission<br />
information and page 125 for footnotes.<br />
PORTFOLIO HOLDINGS 29 6/30<br />
Total Number of Positions 684<br />
Average Coupon 5.52%<br />
Average Life 6.15 years<br />
Average Duration 32 4.61 years<br />
Average Credit Quality A+<br />
CREDIT QUALITY<br />
AAA 56.58%<br />
AA 3.87<br />
A 12.01<br />
BBB 15.70<br />
BB 6.64<br />
B 2.76<br />
CCC 1.45<br />
CC 0.65<br />
D 0.16<br />
Not Rated 0.43<br />
N/A -0.25<br />
PORTFOLIO BREAKDOWN85 Mortgage-Backed Securities 39.90%<br />
Investment Grade Corporates 22.51<br />
High Yield Corporates 8.13<br />
International Bonds<br />
Commercial Mortgage-Backed<br />
7.84<br />
Securities 6.97<br />
Asset-Backed Securities 5.33<br />
U.S. Agency Debentures 2.91<br />
U.S. Treasuries 2.66<br />
Floating-Rate Loans 1.91<br />
Other 3.59<br />
ANNUAL TOTAL RETURN 5, 9 –CLASS A<br />
WITHOUT SALES CHARGES<br />
0<br />
1.80%<br />
4.86%<br />
4.86%<br />
-5.48%<br />
2005 2006 2007 2008<br />
7.23%<br />
YTD 2009 14<br />
6/30/09<br />
PERFORMANCE INFORMATION<br />
5, 9<br />
ANNUAL TOTAL RETURN–WITHOUT SALES CHARGES<br />
1999 2000 2001 2002 2003 2004 2005 2006 2007 2008<br />
YTD<br />
200914 CLASS A -0.91 10.64 6.75 8.19 7.90 5.27 1.80 4.86 4.86 -5.48 7.23<br />
CLASS C — — — — 7.47 4.85 1.39 4.55 4.43 -5.85 7.03<br />
ADVISOR -0.74 10.80 7.10 8.47 8.16 5.53 2.06 5.12 5.12 -5.23 7.48<br />
AVERAGE ANNUAL TOTAL RETURN – AVERAGE ANNUAL TOTAL RETURN–<br />
WITHOUT SALES CHARGES5, 9 6, 9<br />
WITH SALES CHARGES<br />
1 YR 3 YR 5 YR 10 YR INCEPTION 1 YR 3 YR 5 YR 10 YR INCEPTION<br />
CLASS A 2.06 3.86 3.62 5.25 5.03 -2.31 2.36 2.73 4.80 4.62<br />
CLASS C 1.66 3.45 3.23 — 4.14 0.71 3.45 3.23 — 4.14<br />
ADVISOR 2.31 4.12 3.90 5.52 5.31 2.31 4.12 3.90 5.52 5.31<br />
Advisor Class shares are only offered to certain eligible investors as stated in the prospectus.<br />
9, 22<br />
HYPOTHETICAL INVESTMENT<br />
CLASS A CLASS C ADVISOR<br />
$10,000 from Inception $16,368 $13,467 $17,587<br />
FUND FACTS<br />
Net Assets (millions)<br />
2, 9<br />
Expense Ratio<br />
without waiver<br />
with waiver<br />
Net Asset Value<br />
Public Offering Price<br />
Beta 3<br />
Standard Deviation 65<br />
The negative cash position reflects the temporary<br />
imbalance between cash and securities caused by the<br />
time needed to settle securities transactions.<br />
ASSET ALLOCATION 29, 60 6/30<br />
Bonds 102%<br />
Cash -2%<br />
CLASS A CLASS C ADVISOR<br />
$1,023.0 $179.6 $525.7<br />
1.07% 1.47% 0.82%<br />
0.88% 1.28% 0.63%<br />
$9.12 $9.12 $9.14<br />
$9.52 $9.12 $9.14<br />
1.03 1.05 1.04<br />
5.56 5.63 5.58<br />
FUND DISTRIBUTIONS<br />
Dividend Frequency<br />
Accrued daily and paid monthly on the last business day.<br />
CLASS A CLASS C ADVISOR<br />
9, 15<br />
Distribution Rate<br />
Dividend History 30<br />
6/09<br />
5/09<br />
4/09<br />
Capital Gains (last 12 mos.) 30<br />
4.66% 4.43% 5.12%<br />
$0.0369 $0.0337 $0.0390<br />
0.0337 0.0308 0.0355<br />
0.0327 0.0301 0.0344<br />
Short-Term<br />
— — —<br />
Long-Term<br />
— — —<br />
78 <strong>Dealer</strong> <strong>Facts</strong> <strong>Guide</strong> Go to franklintempleton.com or call (800) 223-2141 DEALER USE ONLY/NOT FOR DISTRIBUTION TO THE PUBLIC
<strong>Franklin</strong> U.S. Government Securities Fund<br />
OVERALL MORNINGSTAR<br />
8, 67<br />
RATINGTM – CLASS A<br />
TM 67<br />
MORNINGSTAR STYLE BOX<br />
DURATION<br />
Short Int Long<br />
✕<br />
QUALITY<br />
High<br />
Medium<br />
Low<br />
✕ Current<br />
Historical<br />
INVESTMENT CATEGORY<br />
Fixed Income<br />
37, 75<br />
PRIMARY INVESTMENT<br />
Ginnie Mae securities, which carry<br />
a guarantee backed by the full faith<br />
and credit of the U.S. government<br />
as to timely payment of interest<br />
and principal.<br />
FUND REFERENCE<br />
CLASS A CLASS C<br />
Fund No. 110 210<br />
CUSIP 353 496 607 353 496 862<br />
Symbol FKUSX FRUGX<br />
Inception1 5/31/70 5/1/95<br />
CLASS R ADVISOR89 Fund No. 810 610<br />
CUSIP 353 496 714 353 496 821<br />
Symbol FUSRX FUSAX<br />
Inception1 5/31/70 5/31/70<br />
ANNUAL PROSPECTUS UPDATE AVAILABLE:<br />
February 1<br />
PORTFOLIO MANAGER PROFILE84 Roger Bayston, CFA<br />
Joined <strong>Franklin</strong> <strong>Templeton</strong> in 1991<br />
Managed Fund since 1993<br />
Jack Lemein<br />
Joined <strong>Franklin</strong> <strong>Templeton</strong> in 1984<br />
Managed Fund since 1984<br />
Paul Varunok<br />
Joined <strong>Franklin</strong> <strong>Templeton</strong> in 2001<br />
Managed Fund since 2003<br />
MAXIMUM SALES CHARGE & COMMISSION<br />
CLASS A CLASS C73 Sales Charge 4.25% 0.00%<br />
<strong>Dealer</strong> Concession 4.00 1.00<br />
12b-1 Fee to <strong>Dealer</strong> 0.15 0.65<br />
CLASS R ADVISOR89 Sales Charge 0.00% 0.00%<br />
<strong>Dealer</strong> Concession 0.00 0.00<br />
12b-1 Fee to <strong>Dealer</strong> 0.50 0.00<br />
See page 128 for more commission<br />
information and page 125 for footnotes.<br />
PORTFOLIO HOLDINGS29 6/30<br />
Total Number of Positions 15,075<br />
Average Coupon 5.58%<br />
Average Life 3.80 years<br />
Average Duration32 3.08 years<br />
Average Credit Quality AAA<br />
CREDIT QUALITY<br />
AAA 100.00%<br />
COUPON RATE BREAKDOWN<br />
5.00 11.15%<br />
5.50 16.84<br />
6.00 32.90<br />
6.50 26.28<br />
7.00 4.97<br />
7.50 2.63<br />
8.00 0.80<br />
8.50 0.46<br />
9.00 0.11<br />
9.50 0.12<br />
10.00 0.07<br />
10.50 0.10<br />
11.00 0.09<br />
11.50 0.05<br />
12.00 0.02<br />
12.50 0.07<br />
13.00 0.05<br />
13.50 0.05<br />
ANNUAL TOTAL RETURN 5 –CLASS A<br />
WITHOUT SALES CHARGES<br />
6.88%<br />
6.36%<br />
0<br />
2.77%<br />
3.69%<br />
2005 2006 2007 2008<br />
HYPOTHETICAL INVESTMENT 22<br />
CLASS A CLASS C ADVISOR43 $10,000 from Inception $131,455 $21,067 $139,935<br />
FUND FACTS<br />
Net Assets (millions)<br />
Expense Ratio2 Net Asset Value<br />
Public Offering Price<br />
Beta 3<br />
Standard Deviation 65<br />
ASSET ALLOCATION 29, 60 6/30<br />
Bonds 97%<br />
Cash 3%<br />
6/30/09<br />
PERFORMANCE INFORMATION<br />
ANNUAL TOTAL RETURN–WITHOUT SALES CHARGES5 1999 2000 2001 2002 2003 2004 2005 2006 2007 2008<br />
YTD<br />
200914 CLASS A<br />
CLASS C<br />
ADVISOR43 0.82 10.56 7.67 8.58 1.78 3.80 2.77 3.69 6.36 6.88 2.11<br />
0.28 9.84 7.13 8.06 1.25 3.26 2.24 3.17 5.67 6.38 1.86<br />
0.79 10.84 7.78 8.70 1.90 4.07 2.74 3.97 6.30 7.01 2.33<br />
AVERAGE ANNUAL TOTAL RETURN – AVERAGE ANNUAL TOTAL RETURN–<br />
WITHOUT SALES CHARGES5 6, 10<br />
WITH SALES CHARGES<br />
1 YR 3 YR 5 YR 10 YR INCEPTION 1 YR 3 YR 5 YR 10 YR INCEPTION<br />
CLASS A<br />
CLASS C<br />
ADVISOR43 7.49 6.72 5.02 5.50 6.93 2.86 5.19 4.12 5.03 6.81<br />
6.83 6.16 4.43 4.94 5.40 5.83 6.16 4.43 4.94 5.40<br />
7.61 6.90 5.14 5.65 6.98 7.61 6.90 5.14 5.65 6.98<br />
Advisor Class shares are only offered to certain eligible investors as stated in the prospectus.<br />
CLASS A CLASS C ADVISOR<br />
$6,146.2 $1,175.3 $760.1<br />
0.74% 1.26% 0.61%<br />
$6.61 $6.57 $6.63<br />
$6.90 $6.57 $6.63<br />
0.92 0.93 0.92<br />
3.02 3.01 3.00<br />
FUND DISTRIBUTIONS<br />
Dividend Frequency<br />
Monthly on the 3rd business day.<br />
CLASS A CLASS C ADVISOR<br />
Distribution Rate15 4, 30<br />
Dividend History<br />
4.16% 3.87% 4.45%<br />
6/09<br />
$0.0239 $0.0212 $0.0246<br />
5/09<br />
0.0239 0.0211 0.0246<br />
4/09<br />
Capital Gains (last 4, 30 12 mos.)<br />
0.0239 0.0211 0.0246<br />
Short-Term<br />
— — —<br />
Long-Term<br />
— — —<br />
2.11%<br />
YTD 2009 14<br />
DEALER USE ONLY/NOT FOR DISTRIBUTION TO THE PUBLIC Go to franklintempleton.com or call (800) 223-2141 <strong>Dealer</strong> <strong>Facts</strong> <strong>Guide</strong> 79<br />
OPEN-END FUNDS VALUE BLEND GROWTH SECTOR GLOBAL INTERNATIONAL HYBRID ASSET ALLOCATION FIXED INCOME TAX-FREE INCOME
OPEN-END FUNDS<br />
VALUE<br />
BLEND<br />
GROWTH<br />
SECTOR<br />
GLOBAL<br />
INTERNATIONAL<br />
HYBRID<br />
ASSET ALLOCATION<br />
FIXED INCOME<br />
TAX-FREE INCOME<br />
58 6/30/09<br />
<strong>Franklin</strong> <strong>Templeton</strong> Hard Currency Fund<br />
INVESTMENT CATEGORY<br />
Fixed Income<br />
PRIMARY INVESTMENT 37<br />
High-quality money market instruments<br />
denominated in foreign major<br />
currencies which have historically<br />
experienced low rates of inflation. 39<br />
FUND REFERENCE<br />
CLASS A ADVISOR89 Fund No. 412 612<br />
CUSIP 354 728 305 354 728 701<br />
Symbol ICPHX ICHHX<br />
Inception1 11/17/89 11/17/89<br />
ANNUAL PROSPECTUS UPDATE AVAILABLE:<br />
March 1<br />
PORTFOLIO MANAGER PROFILE 84<br />
Michael Hasenstab, Ph.D.<br />
Joined <strong>Franklin</strong> <strong>Templeton</strong> in 1995<br />
Managed Fund since 2001<br />
MAXIMUM SALES CHARGE & COMMISSION<br />
CLASS A ADVISOR89 Sales Charge 2.25% 0.00%<br />
<strong>Dealer</strong> Concession 2.00 0.00<br />
12b-1 Fee to <strong>Dealer</strong> 0.25 0.00<br />
See page 128 for more commission<br />
information and page 125 for footnotes.<br />
PERFORMANCE INFORMATION<br />
5, 13<br />
ANNUAL TOTAL RETURN–WITHOUT SALES CHARGES<br />
1999 2000 2001 2002 2003 2004 2005 2006 2007 2008<br />
YTD<br />
200914 CLASS A<br />
ADVISOR43 -8.39 -6.24 -4.03 17.75 19.27 8.48 -4.24 8.45 11.03 1.08 -2.58<br />
-8.36 -6.10 -3.56 18.16 19.76 8.82 -3.81 8.74 11.30 1.40 -2.47<br />
AVERAGE ANNUAL TOTAL RETURN – AVERAGE ANNUAL TOTAL RETURN–<br />
WITHOUT SALES CHARGES5, 13 6, 13, 48<br />
WITH SALES CHARGES<br />
1 YR 3 YR 5 YR 10 YR INCEPTION 1 YR 3 YR 5 YR 10 YR INCEPTION<br />
CLASS A<br />
ADVISOR43 -5.80 3.59 4.94 4.68 4.56 -7.93 2.80 4.47 4.45 4.44<br />
-5.52 3.88 5.27 5.02 4.78 -5.52 3.88 5.27 5.02 4.78<br />
Advisor Class shares are only offered to certain eligible investors as stated in the prospectus.<br />
PORTFOLIO HOLDINGS 29 6/30<br />
Total Number of Positions 8<br />
Average Maturity 0.17 year<br />
Average Duration 32 0.17 year<br />
Average Credit Quality AAA<br />
TOP 5 CURRENCIES41 Japanese Yen 26.19%<br />
Swedish Krona 20.65<br />
U.S. Dollar 9.30<br />
Australian Dollar 7.86<br />
Swiss Franc 7.69<br />
ANNUAL TOTAL RETURN 5 –CLASS A<br />
WITHOUT SALES CHARGES<br />
11.03%<br />
8.45%<br />
-4.24%<br />
0<br />
1.08%<br />
2005 2006 2007 2008<br />
HYPOTHETICAL INVESTMENT 22<br />
$10,000 from Inception<br />
FUND FACTS<br />
Net Assets (millions)<br />
Expense Ratio2 Net Asset Value<br />
Public Offering Price<br />
Beta 3<br />
Standard Deviation 65<br />
FUND DISTRIBUTIONS<br />
Dividend Frequency<br />
Quarterly.<br />
Distribution Rate15 4, 30<br />
Dividend History<br />
6/09<br />
3/09<br />
12/08<br />
Capital Gains (last 4, 30<br />
12 mos.)<br />
Short-Term<br />
Long-Term<br />
-2.58%<br />
YTD 2009 14<br />
ASSET ALLOCATION 29, 60 6/30<br />
Cash 58%<br />
Bonds 42%<br />
CLASS A ADVISOR43 $23,448 $24,968<br />
CLASS A ADVISOR<br />
$347.7 $96.5<br />
1.09% 0.79%<br />
$9.07 $9.10<br />
$9.28 $9.10<br />
0.78 0.78<br />
7.32 7.33<br />
CLASS A ADVISOR<br />
0.94% 1.36%<br />
— —<br />
— —<br />
$0.2436 0.2508<br />
— —<br />
— —<br />
80 <strong>Dealer</strong> <strong>Facts</strong> <strong>Guide</strong> Go to franklintempleton.com or call (800) 223-2141 DEALER USE ONLY/NOT FOR DISTRIBUTION TO THE PUBLIC
<strong>Templeton</strong> Global Bond Fund<br />
OVERALL MORNINGSTAR RATING TM<br />
CLASS A 8<br />
★★★★★<br />
MORNINGSTAR STYLE BOX<br />
DURATION<br />
Short Int Long<br />
QUALITY<br />
High<br />
✕ Medium<br />
Low<br />
✕ Current<br />
Historical<br />
INVESTMENT CATEGORY<br />
Fixed Income<br />
TM 67<br />
PRIMARY INVESTMENT 37<br />
Bonds issued by companies,<br />
governments and government<br />
agencies around the world.<br />
FUND REFERENCE<br />
CLASS A CLASS C<br />
Fund No. 406 506<br />
CUSIP 880 208 103 880 208 301<br />
Symbol TPINX TEGBX<br />
Inception1 9/18/86 5/1/95<br />
CLASS R ADVISOR89 Fund No. 816 616<br />
CUSIP 880 208 848 880 208 400<br />
Symbol — TGBAX<br />
Inception1 9/18/86 9/18/86<br />
ANNUAL PROSPECTUS UPDATE AVAILABLE:<br />
January 1<br />
PORTFOLIO MANAGER PROFILE 84<br />
Michael Hasenstab, Ph.D.<br />
Joined <strong>Franklin</strong> <strong>Templeton</strong> in 1995<br />
Managed Fund since 2001<br />
MAXIMUM SALES CHARGE & COMMISSION<br />
CLASS A CLASS C73 Sales Charge 4.25% 0.00%<br />
<strong>Dealer</strong> Concession 4.00 1.00<br />
12b-1 Fee to <strong>Dealer</strong> 0.25 0.65<br />
CLASS R ADVISOR89 Sales Charge 0.00% 0.00%<br />
<strong>Dealer</strong> Concession 0.00 0.00<br />
12b-1 Fee to <strong>Dealer</strong> 0.50 0.00<br />
See page 128 for more commission<br />
information and page 125 for footnotes.<br />
PORTFOLIO HOLDINGS 29 6/30<br />
Total Number of Positions 223<br />
Average Maturity 8.68 years<br />
Average Duration 32 5.21 years<br />
Average Credit Quality A<br />
GEOGRAPHIC BREAKDOWN<br />
Asia 31.65%<br />
Europe/Africa/Middle East 30.21<br />
Americas 22.03<br />
Supranational 2.90<br />
TOP 10 HOLDINGS 7<br />
Korea Treasury Bond, 0475-1112 7.27%<br />
Government of Russia 4.47<br />
Government of Sweden, 5.25% 3.34<br />
Government of France 3.29<br />
Government of Mexico, M 20 2.57<br />
Government of Mexico, 10.00% 2.34<br />
Government of Sweden, 4.00% 2.25<br />
Government of The Netherlands 2.05<br />
Government of Poland 1.85<br />
Korea Treasury Bond, 0550-1709 1.72<br />
ANNUAL TOTAL RETURN 5 –CLASS A<br />
WITHOUT SALES CHARGES<br />
-3.07%<br />
0<br />
13.51%<br />
10.86%<br />
6.28%<br />
2005 2006 2007 2008<br />
8.08%<br />
YTD 2009 14<br />
6/30/09<br />
PERFORMANCE INFORMATION<br />
ANNUAL TOTAL RETURN–WITHOUT SALES CHARGES5 1999 2000 2001 2002 2003 2004 2005 2006 2007 2008<br />
YTD<br />
200914 CLASS A<br />
CLASS C<br />
ADVISOR43 -4.83 2.79 4.18 20.03 21.29 14.62 -3.07 13.51 10.86 6.28 8.08<br />
-5.22 2.39 3.87 19.42 20.90 14.04 -3.46 13.05 10.50 5.84 7.85<br />
-4.70 3.06 4.44 20.23 21.64 14.93 -2.84 13.72 11.26 6.47 8.23<br />
AVERAGE ANNUAL TOTAL RETURN – AVERAGE ANNUAL TOTAL RETURN–<br />
WITHOUT SALES CHARGES5 6, 12<br />
WITH SALES CHARGES<br />
1 YR 3 YR 5 YR 10 YR INCEPTION 1 YR 3 YR 5 YR 10 YR INCEPTION<br />
CLASS A<br />
CLASS C<br />
ADVISOR43 13.25 10.87 10.27 9.67 8.23 8.46 9.29 9.30 9.20 8.02<br />
12.78 10.45 9.81 9.23 8.13 11.78 10.45 9.81 9.23 8.13<br />
13.57 11.18 10.52 9.94 8.40 13.57 11.18 10.52 9.94 8.40<br />
Advisor Class shares are only offered to certain eligible investors as stated in the prospectus.<br />
HYPOTHETICAL INVESTMENT 22<br />
CLASS A CLASS C ADVISOR43 $10,000 from Inception $58,018 $30,248 $62,783<br />
FUND FACTS<br />
Net Assets (millions)<br />
Expense Ratio2 Net Asset Value<br />
Public Offering Price<br />
Beta 3<br />
Standard Deviation 65<br />
FUND DISTRIBUTIONS<br />
Dividend Frequency<br />
Monthly on or near the 20th .<br />
Distribution Rate15 Dividend History 30<br />
6/09<br />
5/09<br />
4/09<br />
Capital Gains (last 12 mos.) 30<br />
Short-Term<br />
Long-Term<br />
CLASS A CLASS C ADVISOR<br />
$8,329.5 $2,383.4 $3,615.5<br />
0.92% 1.32% 0.67%<br />
$11.82 $11.84 $11.79<br />
$12.34 $11.84 $11.79<br />
0.64 0.64 0.64<br />
8.53 8.53 8.53<br />
CLASS A CLASS C ADVISOR<br />
4.38% 4.17% 4.84%<br />
$0.0450 $0.0411 $0.0475<br />
0.0450 0.0410 0.0475<br />
0.0450 0.0412 0.0473<br />
— — —<br />
— — —<br />
DEALER USE ONLY/NOT FOR DISTRIBUTION TO THE PUBLIC Go to franklintempleton.com or call (800) 223-2141 <strong>Dealer</strong> <strong>Facts</strong> <strong>Guide</strong> 81<br />
OPEN-END FUNDS VALUE BLEND GROWTH SECTOR GLOBAL INTERNATIONAL HYBRID ASSET ALLOCATION FIXED INCOME TAX-FREE INCOME
OPEN-END FUNDS<br />
VALUE<br />
BLEND<br />
GROWTH<br />
SECTOR<br />
GLOBAL<br />
INTERNATIONAL<br />
HYBRID<br />
ASSET ALLOCATION<br />
FIXED INCOME<br />
TAX-FREE INCOME<br />
<strong>Templeton</strong> Global Total Return Fund<br />
INVESTMENT CATEGORY<br />
Fixed Income<br />
PRIMARY INVESTMENT 37<br />
Seeks total investment return consisting<br />
of a combination of interest<br />
income, capital appreciation and<br />
currency gains. The fund’s manager<br />
strategically allocates assets across<br />
fixed income markets around the<br />
world by tapping the expertise of the<br />
100-plus investment professionals<br />
that compose the <strong>Franklin</strong> <strong>Templeton</strong><br />
Fixed Income Group ® .<br />
FUND REFERENCE<br />
CLASS A CLASS C<br />
Fund No. 407 507<br />
CUSIP 880 208 889 880 208 871<br />
Symbol TGTRX —<br />
Inception1 9/30/08 9/30/08<br />
CLASS R ADVISOR89 Fund No. 808 696<br />
CUSIP 880 208 863 880 208 855<br />
Symbol — —<br />
Inception1 9/30/08 9/30/08<br />
ANNUAL PROSPECTUS UPDATE AVAILABLE:<br />
September 30<br />
PORTFOLIO MANAGER PROFILE<br />
Michael Hasenstab, Ph.D.<br />
Joined <strong>Franklin</strong> <strong>Templeton</strong> in 1995<br />
Managed Fund since 2008<br />
MAXIMUM SALES CHARGE & COMMISSION<br />
CLASS A CLASS C73 Sales Charge 4.25% 0.00%<br />
<strong>Dealer</strong> Concession 4.00 1.00<br />
12b-1 Fee to <strong>Dealer</strong> 0.25 0.65<br />
CLASS R ADVISOR89 Sales Charge 0.00% 0.00%<br />
<strong>Dealer</strong> Concession 0.00 0.00<br />
12b-1 Fee to <strong>Dealer</strong> 0.50 0.00<br />
See page 128 for more commission<br />
information and page 125 for footnotes.<br />
PORTFOLIO HOLDINGS 29 6/30<br />
Total Number of Positions 180<br />
Average Maturity 10.02 years<br />
Average Duration 32 6.03 years<br />
Average Credit Quality BBB+<br />
GEOGRAPHIC BREAKDOWN<br />
Americas 40.12%<br />
Europe/Africa/Middle East 26.78<br />
Asia 20.53<br />
Supranational 1.82<br />
TOP 10 HOLDINGS 7<br />
Government of Indonesia, FR34 5.25%<br />
Government of Indonesia, FR40 3.48<br />
Government of Russia 3.43<br />
Government of Mexico 3.43<br />
Province of Ontario 3.28<br />
KfW Bankengruppe 2.86<br />
Korea Treasury Bond 2.78<br />
General Electric Capital Corp. 1.97<br />
VTB Capital SA 1.73<br />
Government of Poland 1.70<br />
ANNUAL TOTAL RETURN 5, 9 –CLASS A<br />
WITHOUT SALES CHARGES<br />
0<br />
2005 2006 2007 2008<br />
6/30/09<br />
PERFORMANCE INFORMATION<br />
5, 9<br />
ANNUAL TOTAL RETURN–WITHOUT SALES CHARGES<br />
1999 2000 2001 2002 2003 2004 2005 2006 2007 2008<br />
YTD<br />
200914 CLASS A — — — — — — — — — — 9.62<br />
CLASS C — — — — — — — — — — 9.32<br />
ADVISOR — — — — — — — — — — 9.74<br />
AVERAGE ANNUAL TOTAL RETURN – AVERAGE ANNUAL TOTAL RETURN–<br />
WITHOUT SALES CHARGES5, 9 6, 9<br />
WITH SALES CHARGES<br />
1 YR 3 YR 5 YR 10 YR INCEPTION 1 YR 3 YR 5 YR 10 YR INCEPTION<br />
CLASS A — — — — 15.78 — — — — 10.90<br />
CLASS C — — — — 15.46 — — — — 14.46<br />
ADVISOR — — — — 16.01 — — — — 16.01<br />
Advisor Class shares are only offered to certain eligible investors as stated in the prospectus.<br />
9, 22<br />
HYPOTHETICAL INVESTMENT<br />
CLASS A CLASS C ADVISOR<br />
$10,000 from Inception $11,090 $11,446 $11,601<br />
FUND FACTS<br />
Net Assets (millions)<br />
2, 9<br />
Expense Ratio<br />
without waiver<br />
with waiver<br />
Net Asset Value<br />
Public Offering Price<br />
Beta 3<br />
Standard Deviation 65<br />
FUND DISTRIBUTIONS<br />
Dividend Frequency<br />
Monthly.<br />
9, 15<br />
Distribution Rate<br />
Dividend History 30<br />
6/09<br />
5/09<br />
4/09<br />
Capital Gains (last 12 mos.) 30<br />
Short-Term<br />
Long-Term<br />
9.62%<br />
YTD 2009 14<br />
CLASS A CLASS C ADVISOR<br />
$21.2 $2.5 $5.3<br />
1.33% 1.73% 1.08%<br />
1.09% 1.49% 0.84%<br />
$10.78 $10.77 $10.79<br />
$11.26 $10.77 $10.79<br />
— — —<br />
— — —<br />
CLASS A CLASS C ADVISOR<br />
5.28% 5.10% 5.75%<br />
$0.0495 $0.0458 $0.0517<br />
0.0624 0.0602 0.0646<br />
0.0600 0.0567 0.0621<br />
— — —<br />
— — —<br />
82 <strong>Dealer</strong> <strong>Facts</strong> <strong>Guide</strong> Go to franklintempleton.com or call (800) 223-2141 DEALER USE ONLY/NOT FOR DISTRIBUTION TO THE PUBLIC
<strong>Templeton</strong> International Bond Fund<br />
INVESTMENT CATEGORY<br />
Fixed Income<br />
PRIMARY INVESTMENT 37<br />
The fund invests predominantly<br />
in foreign (non-U.S.) bonds.<br />
FUND REFERENCE<br />
CLASS A CLASS C<br />
Fund No. 447 247<br />
CUSIP 880 208 509 880 208 608<br />
Symbol TBOAX —<br />
Inception1 12/3/07 12/3/07<br />
CLASS R ADVISOR 89<br />
Fund No. 847 647<br />
CUSIP 880 208 707 880 208 806<br />
Symbol — —<br />
Inception1 12/3/07 12/3/07<br />
ANNUAL PROSPECTUS UPDATE AVAILABLE:<br />
January 1<br />
PORTFOLIO MANAGER PROFILE 84<br />
Michael Hasenstab, Ph.D.<br />
Joined <strong>Franklin</strong> <strong>Templeton</strong> in 1995<br />
Managed Fund since 2007<br />
MAXIMUM SALES CHARGE & COMMISSION<br />
CLASS A CLASS C73 Sales Charge 4.25% 0.00%<br />
<strong>Dealer</strong> Concession 4.00 1.00<br />
12b-1 Fee to <strong>Dealer</strong> 0.25 0.65<br />
CLASS R ADVISOR 89<br />
Sales Charge 0.00% 0.00%<br />
<strong>Dealer</strong> Concession 0.00 0.00<br />
12b-1 Fee to <strong>Dealer</strong> 0.50 0.00<br />
See page 128 for more commission<br />
information and page 125 for footnotes.<br />
PORTFOLIO HOLDINGS 29 6/30<br />
Total Number of Positions 78<br />
Average Maturity 8.19 years<br />
Average Duration32 4.97 years<br />
Average Credit Quality A<br />
GEOGRAPHIC BREAKDOWN<br />
Europe/Africa/Middle East 33.24%<br />
Asia 28.24<br />
Americas 23.46<br />
Supranational 3.98<br />
TOP 10 HOLDINGS7 Korea Treasury Bond 4.14%<br />
Government of Mexico 3.67<br />
Government of France 2.83<br />
Government of Russia 2.79<br />
Province of Ontario 2.63<br />
Government of Sweden 2.43<br />
Inter-American Development Bank 2.39<br />
Government of Hungary 2.34<br />
Government of the Netherlands 2.28<br />
Government of South Africa 2.17<br />
ANNUAL TOTAL RETURN 5, 9 –CLASS A<br />
WITHOUT SALES CHARGES<br />
0<br />
5.26%<br />
2005 2006 2007 2008<br />
9, 22<br />
HYPOTHETICAL INVESTMENT<br />
CLASS A CLASS C ADVISOR<br />
$10,000 from Inception $10,733 $11,156 $11,257<br />
FUND FACTS<br />
Net Assets (millions)<br />
2, 9<br />
Expense Ratio<br />
without waiver<br />
with waiver<br />
Net Asset Value<br />
Public Offering Price<br />
Beta 3<br />
Standard Deviation 65<br />
FUND DISTRIBUTIONS<br />
Dividend Frequency<br />
Monthly.<br />
9, 15<br />
Distribution Rate<br />
Dividend History 30<br />
6/09<br />
5/09<br />
4/09<br />
Capital Gains(last 12 mos.) 30<br />
Short-Term<br />
Long-Term<br />
6.86%<br />
YTD 2009 14<br />
6/30/09<br />
PERFORMANCE INFORMATION<br />
5, 9<br />
ANNUAL TOTAL RETURN–WITHOUT SALES CHARGES<br />
1999 2000 2001 2002 2003 2004 2005 2006 2007 2008<br />
YTD<br />
2009 14<br />
CLASS A — — — — — — — — — 5.26 6.86<br />
CLASS C — — — — — — — — — 4.85 6.71<br />
ADVISOR — — — — — — — — — 5.51 6.99<br />
AVERAGE ANNUAL TOTAL RETURN– AVERAGE ANNUAL TOTAL RETURN–<br />
WITHOUT SALES CHARGES5, 9 6, 9<br />
WITH SALES CHARGES<br />
1 YR 3 YR 5 YR 10 YR INCEPTION 1 YR 3 YR 5 YR 10 YR INCEPTION<br />
CLASS A 10.62 — — — 7.49 5.91 — — — 4.59<br />
CLASS C 10.26 — — — 7.19 9.26 — — — 7.19<br />
ADVISOR 10.91 — — — 7.80 10.91 — — — 7.80<br />
Advisor Class shares are only offered to certain eligible investors as stated in the prospectus.<br />
CLASS A CLASS C ADVISOR<br />
$15.9 $3.7 $1.8<br />
2.95% 3.30% 2.65%<br />
1.08% 1.43% 0.78%<br />
$10.21 $10.22 $10.22<br />
$10.66 $10.22 $10.22<br />
— — —<br />
— — —<br />
CLASS A CLASS C ADVISOR<br />
6.43% 6.31% 6.97%<br />
$0.0446 $0.0408 $0.0463<br />
0.0438 0.0399 0.0456<br />
0.0459 0.0420 0.0476<br />
0.0010 0.0010 0.0010<br />
— — —<br />
DEALER USE ONLY/NOT FOR DISTRIBUTION TO THE PUBLIC Go to franklintempleton.com or call (800) 223-2141 <strong>Dealer</strong> <strong>Facts</strong> <strong>Guide</strong> 83<br />
OPEN-END FUNDS VALUE BLEND GROWTH SECTOR GLOBAL INTERNATIONAL HYBRID ASSET ALLOCATION FIXED INCOME TAX-FREE INCOME
OPEN-END FUNDS<br />
VALUE<br />
BLEND<br />
GROWTH<br />
SECTOR<br />
GLOBAL<br />
INTERNATIONAL<br />
HYBRID<br />
ASSET ALLOCATION<br />
FIXED INCOME<br />
TAX-FREE INCOME<br />
<strong>Franklin</strong> Money Fund<br />
INVESTMENT CATEGORY<br />
Fixed Income<br />
PRIMARY INVESTMENT 37<br />
High-quality, short-term money<br />
market securities including<br />
U.S. government securities<br />
repurchase agreements.<br />
FUND REFERENCE<br />
Fund No. 111<br />
CUSIP 354 014 102<br />
Symbol FMFXX<br />
Inception 1 5/1/76<br />
ANNUAL PROSPECTUS UPDATE AVAILABLE:<br />
November 1<br />
PORTFOLIO MANAGER PROFILE 84<br />
Shawn Lyons, CFA<br />
Joined <strong>Franklin</strong> <strong>Templeton</strong> in 1996<br />
Managed Fund since 1997<br />
See page 128 for more commission<br />
information and page 125 for footnotes.<br />
PERFORMANCE INFORMATION<br />
CUMULATIVE TOTAL RETURN 5, 13 6, 13<br />
AVERAGE ANNUAL TOTAL RETURN<br />
FUND FACTS<br />
Net Assets (millions)<br />
Expense Ratio 2<br />
Net Asset Value 26<br />
YIELD INFORMATION 50<br />
7-Day Yield<br />
7-Day Effective Yield<br />
$2,554.3<br />
PORTFOLIO HOLDINGS29 6/30<br />
Total Number of Positions<br />
154<br />
Average Weighted Maturity<br />
CREDIT QUALITY<br />
AAA: 62.49%<br />
TOP 5 HOLDINGS<br />
AA: 28.76% A: 8.75%<br />
U.S. Treasury Bill 11.66%<br />
Agency Repo - Bank of America 10.81<br />
Agency Repo - HSBC 9.22<br />
Agency Repo - Barclays 6.84<br />
Total Fina Elf Capital 4.08<br />
84 <strong>Dealer</strong> <strong>Facts</strong> <strong>Guide</strong> Go to franklintempleton.com or call (800) 223-2141 DEALER USE ONLY/NOT FOR DISTRIBUTION TO THE PUBLIC<br />
0.60%<br />
$1.00<br />
0.00%<br />
0.00<br />
6/30/09<br />
YTD 1 YR 3 YR 5 YR 10 YR INCEPTION 1 YR 3 YR 5 YR 10 YR INCEPTION<br />
0.03 0.74 9.40 15.13 32.56 557.99 0.74 3.04 2.86 2.86 5.84<br />
ASSET ALLOCATION 29, 60 6/30<br />
Repurchase Agreements 32%<br />
Commercial Paper 27%<br />
Certificates of Deposit 24%<br />
U.S. Agency 17%<br />
49 days
<strong>Franklin</strong> Double Tax-Free Income Fund 61 6/30/09<br />
NATIONAL FUND<br />
INFORMATION 8<br />
STAR RATING – CLASS A<br />
INVESTMENT CATEGORY<br />
Tax-Free Income19 PRIMARY INVESTMENT37 Municipal bonds issued by U.S.<br />
territories, including Puerto Rico.<br />
FUND REFERENCE<br />
CLASS A CLASS C<br />
Fund No. 123 223<br />
CUSIP 354 723 603 354 723 611<br />
Symbol FPRTX FPRIX<br />
Inception 1 4/3/85 5/1/95<br />
ADVISOR 89<br />
Fund No. 085<br />
CUSIP 354 724 106<br />
Symbol —<br />
Inception 1 4/3/85<br />
ANNUAL PROSPECTUS UPDATE AVAILABLE:<br />
July 1<br />
PORTFOLIO MANAGER/FUND TENURE 84<br />
Carrie Higgins, 1992<br />
Joined <strong>Franklin</strong> <strong>Templeton</strong> in 1990<br />
Stella Wong, 1986<br />
Joined <strong>Franklin</strong> <strong>Templeton</strong> in 1986<br />
FUND FACTS<br />
Net Assets (millions)<br />
Expense Ratio 2<br />
Net Asset Value<br />
Public Offering Price<br />
FUND DISTRIBUTIONS<br />
Dividend Frequency<br />
Monthly on or near the 20 th .<br />
Distribution Rate15 Taxable Equivalent<br />
Distribution Rate16 4, 30, 45<br />
Dividend History<br />
6/09<br />
5/09<br />
4/09<br />
Capital Gains 4, 30 (last 12 mos)<br />
Short-Term<br />
Long-Term<br />
CLASS A CLASS C<br />
$452.9 $73.9<br />
0.68% 1.23%<br />
$10.74 $10.78<br />
$11.22 $10.78<br />
CLASS A CLASS C<br />
4.51% 4.16%<br />
6.94 6.40<br />
$0.0422 $0.0374<br />
0.0422 0.0377<br />
0.0422 0.0377<br />
See page 128 for more commission information and<br />
page 125 for footnotes.<br />
— —<br />
— —<br />
<strong>Franklin</strong> Federal Tax-Free Income Fund<br />
NATIONAL FUND<br />
OVERALL MORNINGSTAR RATING TM<br />
CLASS A 8<br />
★★★★<br />
INVESTMENT CATEGORY<br />
Tax-Free Income 86<br />
PRIMARY INVESTMENT 37<br />
Investment grade municipal<br />
securities from across the nation.<br />
FUND REFERENCE<br />
CLASS A CLASS C<br />
Fund No. 116 216<br />
CUSIP 353 519 101 353 519 200<br />
Symbol FKTIX FRFTX<br />
Inception1 10/7/83 5/1/95<br />
ADVISOR 89<br />
Fund No. 620<br />
CUSIP 353 519 408<br />
Symbol FAFTX<br />
Inception 1 10/7/83<br />
ANNUAL PROSPECTUS UPDATE AVAILABLE:<br />
September 1<br />
PORTFOLIO MANAGER/FUND TENURE 84<br />
Carrie Higgins, 2004<br />
Joined <strong>Franklin</strong> <strong>Templeton</strong> in 1990<br />
Francisco Rivera, 1996<br />
Joined <strong>Franklin</strong> <strong>Templeton</strong> in 1994<br />
Sheila Amoroso, 1987<br />
Joined <strong>Franklin</strong> <strong>Templeton</strong> in 1986<br />
PERFORMANCE INFORMATION<br />
AVERAGE ANNUAL TOTAL RETURN – AVERAGE ANNUAL TOTAL RETURN–<br />
WITHOUT SALES CHARGES5 6, 10<br />
WITH SALES CHARGES<br />
1 YR 3 YR 5 YR 10 YR INCEPTION 1 YR 3 YR 5 YR 10 YR INCEPTION<br />
CLASS A -1.72 1.55 2.97 3.93 6.08 -5.91 0.08 2.08 3.48 5.89<br />
CLASS C -2.25 0.99 2.42 3.37 4.11 -3.19 0.99 2.42 3.37 4.11<br />
PORTFOLIO HOLDINGS29 5/31<br />
Total Number of Positions<br />
Average Weighted Maturity<br />
Average Duration49 103<br />
18.6 years<br />
9.27 years<br />
AMT Exposure<br />
5.88%<br />
Average Credit Quality<br />
A<br />
29, 40<br />
CREDIT QUALITY<br />
AAA: 34.61% AA: 15.41% A: 9.22%<br />
BBB: 39.37 BB: 0.37 Not rated: 1.02<br />
CLASS A (NAV)<br />
$20<br />
10<br />
0<br />
4/85 6/09<br />
MAXIMUM SALES CHARGE & COMMISSION<br />
CLASS A CLASS C73 ADVISOR89 Sales Charge<br />
4.25% 0.00% 0.00%<br />
<strong>Dealer</strong> Concession 4.00 1.00 0.00<br />
12b-1 Fee to <strong>Dealer</strong> 0.10 0.65 0.00<br />
FUND FACTS<br />
CLASS A CLASS C ADVISOR<br />
Net Assets (millions)<br />
Expense Ratio 2<br />
PORTFOLIO HOLDINGS<br />
Net Asset Value<br />
Public Offering Price<br />
29 5/31<br />
Total Number of Positions<br />
Average Weighted Maturity<br />
Average Duration49 PERFORMANCE INFORMATION<br />
AVERAGE ANNUAL TOTAL RETURN – AVERAGE ANNUAL TOTAL RETURN–<br />
WITHOUT SALES CHARGES<br />
1.25 2.76 3.72 4.35 7.00 -3.07 1.28 2.82 3.90 6.82<br />
0.60 2.17 3.12 3.77 4.40 -0.36 2.17 3.12 3.77 4.40<br />
1.33 2.86 3.81 4.43 7.03 1.33 2.86 3.81 4.43 7.03<br />
954<br />
$7,798.6 $873.2 $524.7<br />
18.2 years<br />
0.60% 1.16% 0.51%<br />
7.57 years<br />
$11.26 $11.25 $11.27 AMT Exposure<br />
3.49%<br />
$11.76 $11.25 $11.27 Average Credit Quality<br />
AA<br />
5 6, 10<br />
WITH SALES CHARGES<br />
1 YR 3 YR 5 YR 10 YR INCEPTION 1 YR 3 YR 5 YR 10 YR INCEPTION<br />
CLASS A<br />
CLASS C<br />
ADVISOR43 Advisor Class shares are only offered to certain eligible investors as stated in the prospectus.<br />
FUND DISTRIBUTIONS<br />
Dividend Frequency<br />
Monthly on or near the 3rd business day.<br />
CLASS A CLASS C ADVISOR<br />
Distribution Rate15 Taxable Equivalent<br />
Distribution Rate16 4, 30, 45<br />
Dividend History<br />
6/09<br />
5/09<br />
4/09<br />
Capital Gains 4, 30 4.54% 4.20% 4.83%<br />
6.98 6.46 7.43<br />
$0.0445 $0.0394 $0.0454<br />
0.0450 0.0403 0.0458<br />
(last 12 mos)<br />
0.0450 0.0403 0.0458<br />
Short-Term<br />
— — —<br />
Long-Term<br />
— — —<br />
See page 128 for more commission information and<br />
page 125 for footnotes.<br />
6/30/09<br />
29, 40<br />
CREDIT QUALITY<br />
AAA: 37.47% AA: 30.79% A: 18.41%<br />
BBB: 11.69 BB: 0.70 B: 0.26<br />
Not rated: 0.68<br />
CLASS A (NAV)<br />
$20<br />
10<br />
0<br />
10/83 6/09<br />
MAXIMUM SALES CHARGE & COMMISSION<br />
CLASS A CLASS C73 ADVISOR89 Sales Charge<br />
4.25% 0.00% 0.00%<br />
<strong>Dealer</strong> Concession 4.00 1.00 0.00<br />
12b-1 Fee to <strong>Dealer</strong> 0.10 0.65 0.00<br />
DEALER USE ONLY/NOT FOR DISTRIBUTION TO THE PUBLIC Go to franklintempleton.com or call (800) 223-2141 <strong>Dealer</strong> <strong>Facts</strong> <strong>Guide</strong> 85<br />
OPEN-END FUNDS VALUE BLEND GROWTH SECTOR GLOBAL INTERNATIONAL HYBRID ASSET ALLOCATION FIXED INCOME TAX-FREE INCOME
OPEN-END FUNDS<br />
VALUE<br />
BLEND<br />
GROWTH<br />
SECTOR<br />
GLOBAL<br />
INTERNATIONAL<br />
HYBRID<br />
ASSET ALLOCATION<br />
FIXED INCOME<br />
TAX-FREE INCOME<br />
<strong>Franklin</strong> High Yield Tax-Free Income Fund<br />
NATIONAL FUND<br />
OVERALL MORNINGSTAR RATING TM<br />
CLASS A 8<br />
★★★★<br />
INVESTMENT CATEGORY<br />
Tax-Free Income86 PRIMARY INVESTMENT37 High yielding, lower-rated municipal<br />
securities from across the nation.<br />
FUND REFERENCE<br />
CLASS A CLASS C<br />
Fund No. 130 230<br />
CUSIP 354 723 702 354 723 595<br />
Symbol FRHIX FHYIX<br />
Inception1 3/18/86 5/1/95<br />
ADVISOR 89<br />
Fund No. 640<br />
CUSIP 354 723 272<br />
Symbol FHYVX<br />
Inception 1 3/18/86<br />
ANNUAL PROSPECTUS UPDATE AVAILABLE:<br />
July 1<br />
PORTFOLIO MANAGER/FUND TENURE 84<br />
John Wiley, 1991<br />
Joined <strong>Franklin</strong> <strong>Templeton</strong> in 1989<br />
John Hopp, 1993<br />
Joined <strong>Franklin</strong> <strong>Templeton</strong> in 1991<br />
Francisco Rivera, 2004<br />
Joined <strong>Franklin</strong> <strong>Templeton</strong> in 1994<br />
INFORMATION 8<br />
STAR RATING – CLASS A<br />
INVESTMENT CATEGORY<br />
Tax-Free Income 86<br />
PRIMARY INVESTMENT 37<br />
Insured municipal securities from<br />
across the nation.<br />
FUND REFERENCE<br />
CLASS A CLASS C<br />
Fund No. 121 221<br />
CUSIP 354 723 108 354 723 652<br />
Symbol FTFIX FRITX<br />
Inception1 4/3/85 5/1/95<br />
ADVISOR 89<br />
Fund No. 631<br />
CUSIP 354 723 264<br />
Symbol —<br />
Inception 1 4/3/85<br />
ANNUAL PROSPECTUS UPDATE AVAILABLE:<br />
July 1<br />
PORTFOLIO MANAGER/FUND TENURE 84<br />
John Pomeroy, 1989<br />
Joined <strong>Franklin</strong> <strong>Templeton</strong> in 1986<br />
Jim Conn, CFA, 1999<br />
Joined <strong>Franklin</strong> <strong>Templeton</strong> in 1996<br />
FUND DISTRIBUTIONS<br />
Dividend Frequency<br />
Monthly on or near the 20th .<br />
CLASS A CLASS C ADVISOR<br />
Distribution Rate15 Taxable Equivalent<br />
Distribution Rate16 4, 30, 45<br />
Dividend History<br />
6/09<br />
5/09<br />
4/09<br />
Capital Gains 4,30 5.87% 5.53% 6.21%<br />
9.03 8.51 9.55<br />
$0.0468 $0.0427 $0.0475<br />
0.0468 0.0429 0.0474<br />
(last 12 mos)<br />
0.0468 0.0429 0.0474<br />
Short-Term<br />
— — —<br />
Long-Term<br />
— — —<br />
See page 128 for more commission information and<br />
page 125 for footnotes.<br />
<strong>Franklin</strong> Insured Tax-Free Income Fund<br />
NATIONAL FUND<br />
6/30/09<br />
FUND FACTS<br />
CLASS A CLASS C ADVISOR<br />
Net Assets (millions)<br />
Expense Ratio2 PORTFOLIO HOLDINGS<br />
$4,681.0 $762.9 $305.5<br />
0.63% 1.18% 0.53%<br />
Net Asset Value<br />
$9.15 $9.27 $9.18<br />
Public Offering Price $9.56 $9.27 $9.18<br />
29 5/31<br />
Total Number of Positions<br />
Average Weighted Maturity<br />
Average Duration49 PERFORMANCE INFORMATION<br />
AVERAGE ANNUAL TOTAL RETURN – AVERAGE ANNUAL TOTAL RETURN–<br />
WITHOUT SALES CHARGES<br />
710<br />
18.7 years<br />
8.44 years<br />
AMT Exposure<br />
16.59%<br />
Average Credit Quality<br />
BBB<br />
5 6, 10<br />
WITH SALES CHARGES<br />
1 YR 3 YR 5 YR 10 YR INCEPTION 1 YR 3 YR 5 YR 10 YR INCEPTION<br />
CLASS A<br />
CLASS C<br />
ADVISOR43 -3.53 0.13 2.74 3.57 6.15 -7.65 -1.30 1.85 3.12 5.95<br />
-4.02 -0.39 2.18 3.02 4.10 -4.93 -0.39 2.18 3.02 4.10<br />
-3.33 0.32 2.82 3.61 6.17 -3.33 0.32 2.82 3.61 6.17<br />
Advisor Class shares are only offered to certain eligible investors as stated in the prospectus.<br />
29, 40<br />
CREDIT QUALITY<br />
AAA: 17.59% AA: 11.74% A: 16.35%<br />
BBB: 24.80 BB: 9.08 B: 6.09<br />
CCC: 1.41 Not rated: 12.94<br />
CLASS A (NAV)<br />
$20<br />
10<br />
0<br />
3/86 6/09<br />
MAXIMUM SALES CHARGE & COMMISSION<br />
CLASS A CLASS C73 ADVISOR89 Sales Charge<br />
4.25% 0.00% 0.00%<br />
<strong>Dealer</strong> Concession 4.00 1.00 0.00<br />
12b-1 Fee to <strong>Dealer</strong> 0.10 0.65 0.00<br />
6/30/09<br />
FUND FACTS<br />
CLASS A CLASS C ADVISOR<br />
Net Assets (millions)<br />
Expense Ratio2 PORTFOLIO HOLDINGS<br />
$1,911.4 $229.3 $3.7<br />
0.63% 1.18% 0.53%<br />
Net Asset Value<br />
$11.41 $11.53 $11.40<br />
Public Offering Price $11.92 $11.53 $11.40<br />
29 5/31<br />
Total Number of Positions<br />
Average Weighted Maturity<br />
Average Duration49 PERFORMANCE INFORMATION<br />
AVERAGE ANNUAL TOTAL RETURN – AVERAGE ANNUAL TOTAL RETURN–<br />
WITHOUT SALES CHARGES<br />
1.10 2.59 3.38 4.35 6.48 -3.16 1.11 2.49 3.89 6.29<br />
0.54 2.04 2.83 3.78 4.27 -0.42 2.04 2.83 3.78 4.27<br />
1.12 2.60 3.38 4.35 6.48 1.12 2.60 3.38 4.35 6.48<br />
387<br />
20.1 years<br />
8.32 years<br />
AMT Exposure<br />
2.14%<br />
Average Credit Quality<br />
AA<br />
5 6, 10<br />
WITH SALES CHARGES<br />
1 YR 3 YR 5 YR 10 YR INCEPTION 1 YR 3 YR 5 YR 10 YR INCEPTION<br />
CLASS A<br />
CLASS C<br />
ADVISOR43 Advisor Class shares are only offered to certain eligible investors as stated in the prospectus.<br />
FUND DISTRIBUTIONS<br />
Dividend Frequency<br />
Monthly on or near the 20th .<br />
CLASS A CLASS C ADVISOR<br />
Distribution Rate15 Taxable Equivalent<br />
Distribution Rate16 4, 30, 45<br />
Dividend History<br />
6/09<br />
5/09<br />
4/09<br />
Capital Gains 4,30 4.43% 4.04% 4.73%<br />
6.82 6.22 7.28<br />
$0.0440 $0.0388 $0.0449<br />
0.0440 0.0389 0.0449<br />
(last 12 mos)<br />
0.0440 0.0389 0.0449<br />
Short-Term<br />
— — —<br />
Long-Term<br />
— — —<br />
See page 128 for more commission information and<br />
page 125 for footnotes.<br />
29, 40<br />
CREDIT QUALITY<br />
AAA: 41.64% AA: 36.41% A: 15.20%<br />
BBB: 4.03 Not rated: 2.72<br />
CLASS A (NAV)<br />
$20<br />
10<br />
0<br />
4/85 6/09<br />
MAXIMUM SALES CHARGE & COMMISSION<br />
CLASS A CLASS C73 ADVISOR89 Sales Charge<br />
4.25% 0.00% 0.00%<br />
<strong>Dealer</strong> Concession 4.00 1.00 0.00<br />
12b-1 Fee to <strong>Dealer</strong> 0.10 0.65 0.00<br />
86 <strong>Dealer</strong> <strong>Facts</strong> <strong>Guide</strong> Go to franklintempleton.com or call (800) 223-2141 DEALER USE ONLY/NOT FOR DISTRIBUTION TO THE PUBLIC
<strong>Franklin</strong> California Intermediate-Term Tax-Free Income Fund 6/30/09<br />
INTERMEDIATE-/LIMITED-TERM FUND<br />
INVESTMENT CATEGORY<br />
Tax-Free Income 19<br />
PRIMARY INVESTMENT 37<br />
Investment grade California<br />
municipal securities with an<br />
average maturity of 3 to 10 years.<br />
FUND REFERENCE<br />
CLASS A CLASS C<br />
Fund No. 152 252<br />
CUSIP 352 519 300 352 519 607<br />
Symbol FKCIX FCCIX<br />
Inception1 9/21/92 7/1/03<br />
ADVISOR 89<br />
Fund No. 653<br />
CUSIP 352 519 888<br />
Symbol —<br />
Inception 1 9/21/92<br />
ANNUAL PROSPECTUS UPDATE AVAILABLE:<br />
October 31<br />
PORTFOLIO MANAGER/FUND TENURE 84<br />
Christopher Sperry, CFA, 2000<br />
Joined <strong>Franklin</strong> <strong>Templeton</strong> in 1996<br />
John Wiley, 1992<br />
Joined <strong>Franklin</strong> <strong>Templeton</strong> in 1989<br />
INVESTMENT CATEGORY<br />
Tax-Free Income 86<br />
PRIMARY INVESTMENT 37<br />
Investment grade municipal<br />
securities with an average<br />
maturity of 3 to 10 years.<br />
FUND REFERENCE<br />
CLASS A CLASS C<br />
Fund No. 174 274<br />
CUSIP 354 723 710 354 723 298<br />
Symbol FKITX FCITX<br />
Inception1 9/21/92 7/1/03<br />
ADVISOR 89<br />
Fund No. 672<br />
CUSIP 354 723 215<br />
Symbol —<br />
Inception 1 9/21/92<br />
ANNUAL PROSPECTUS UPDATE AVAILABLE:<br />
July 1<br />
PORTFOLIO MANAGER/FUND TENURE 84<br />
John Pomeroy, 1992<br />
Joined <strong>Franklin</strong> <strong>Templeton</strong> in 1986<br />
Jim Conn, CFA, 1999<br />
Joined <strong>Franklin</strong> <strong>Templeton</strong> in 1996<br />
FUND FACTS<br />
CLASS A CLASS C ADVISOR<br />
Net Assets (millions)<br />
Expense Ratio2 PORTFOLIO HOLDINGS<br />
$517.3 $58.9 $0.2<br />
0.66% 1.21% 0.56%<br />
Net Asset Value<br />
$10.87 $10.89 $10.87<br />
Public Offering Price $11.12 $10.89 $10.87<br />
29 5/31<br />
Total Number of Positions<br />
Average Weighted Maturity<br />
Average Duration49 PERFORMANCE INFORMATION<br />
AVERAGE ANNUAL TOTAL RETURN – AVERAGE ANNUAL TOTAL RETURN–<br />
WITHOUT SALES CHARGES<br />
227<br />
9.2 years<br />
5.89 years<br />
AMT Exposure<br />
2.06%<br />
Average Credit Quality<br />
A<br />
5, 13 6, 13<br />
WITH SALES CHARGES<br />
1 YR 3 YR 5 YR 10 YR INCEPTION 1 YR 3 YR 5 YR 10 YR INCEPTION<br />
CLASS A<br />
CLASS C<br />
ADVISOR43 0.51 2.63 2.97 3.97 4.92 -1.76 1.86 2.50 3.73 4.78<br />
-0.05 2.07 2.42 — 2.03 -1.01 2.07 2.42 — 2.03<br />
0.57 2.65 2.98 3.97 4.93 0.57 2.65 2.98 3.97 4.93<br />
Advisor Class shares are only offered to certain eligible investors as stated in the prospectus.<br />
FUND DISTRIBUTIONS<br />
Dividend Frequency<br />
Monthly on or near the 20th .<br />
CLASS A CLASS C ADVISOR<br />
Distribution Rate15 Taxable Equivalent<br />
Distribution Rate16 4, 30, 45<br />
Dividend History<br />
6/09<br />
5/09<br />
4/09<br />
Capital Gains 4,30 4.07% 3.59% 4.26%<br />
6.90 6.09 7.23<br />
$0.0377 $0.0326 $0.0386<br />
0.0377 0.0327 0.0386<br />
(last 12mos)<br />
0.0377 0.0327 0.0386<br />
Short-Term<br />
— — —<br />
Long-Term<br />
— — —<br />
See page 128 for more commission information and<br />
page 125 for footnotes.<br />
29, 40<br />
CREDIT QUALITY<br />
AAA: 15.96% AA: 37.41% A: 29.85%<br />
BBB: 8.67 BB: 0.48 Not rated: 7.63<br />
CLASS A (NAV)<br />
$20<br />
10<br />
0<br />
9/92 6/09<br />
MAXIMUM SALES CHARGE & COMMISSION<br />
CLASS A CLASS C73 ADVISOR89 Sales Charge<br />
2.25% 0.00% 0.00%<br />
<strong>Dealer</strong> Concession 2.00 1.00 0.00<br />
12b-1 Fee to <strong>Dealer</strong> 0.10 0.65 0.00<br />
<strong>Franklin</strong> Federal Intermediate-Term Tax-Free Income Fund 6/30/09<br />
INTERMEDIATE-/LIMITED-TERM FUND<br />
FUND FACTS<br />
CLASS A CLASS C ADVISOR<br />
Net Assets (millions)<br />
Expense Ratio2 PORTFOLIO HOLDINGS<br />
Net Asset Value<br />
Public Offering Price<br />
29 5/31<br />
Total Number of Positions<br />
Average Weighted Maturity<br />
Average Duration49 PERFORMANCE INFORMATION<br />
AVERAGE ANNUAL TOTAL RETURN – AVERAGE ANNUAL TOTAL RETURN–<br />
WITHOUT SALES CHARGES<br />
269<br />
$1,029.7 $132.3 $13.1<br />
9.5 years<br />
0.68% 1.23% 0.58%<br />
5.92 years<br />
$11.01 $11.04 $11.03 AMT Exposure<br />
1.32%<br />
$11.26 $11.04 $11.03 Average Credit Quality<br />
AA<br />
5, 13 6, 13<br />
WITH SALES CHARGES<br />
1 YR 3 YR 5 YR 10 YR INCEPTION 1 YR 3 YR 5 YR 10 YR INCEPTION<br />
CLASS A<br />
CLASS C<br />
ADVISOR43 2.04 3.37 3.35 4.14 5.03 -0.27 2.58 2.88 3.91 4.89<br />
1.56 2.83 2.81 — 2.26 0.58 2.83 2.81 — 2.26<br />
2.28 3.45 3.40 4.16 5.05 2.28 3.45 3.40 4.16 5.05<br />
Advisor Class shares are only offered to certain eligible investors as stated in the prospectus.<br />
FUND DISTRIBUTIONS<br />
Dividend Frequency<br />
Monthly on or near the 20th .<br />
CLASS A CLASS C ADVISOR<br />
Distribution Rate15 Taxable Equivalent<br />
Distribution Rate16 4, 30, 45<br />
Dividend History<br />
6/09<br />
5/09<br />
4/09<br />
Capital Gains 4,30 3.92% 3.43% 4.10%<br />
6.03 5.28 6.31<br />
$0.0368 $0.0316 $0.0377<br />
0.0368 0.0317 0.0377<br />
(last 12mos)<br />
0.0368 0.0317 0.0377<br />
Short-Term<br />
— — —<br />
Long-Term<br />
— — —<br />
See page 128 for more commission information and<br />
page 125 for footnotes.<br />
29, 40<br />
CREDIT QUALITY<br />
AAA: 31.34% AA: 35.95% A: 24.41%<br />
BBB: 6.96 BB: 0.56 B: 0.07<br />
Not rated: 0.71<br />
CLASS A (NAV)<br />
$20<br />
10<br />
0<br />
9/92 6/09<br />
MAXIMUM SALES CHARGE & COMMISSION<br />
CLASS A CLASS C73 ADVISOR89 Sales Charge<br />
2.25% 0.00% 0.00%<br />
<strong>Dealer</strong> Concession 2.00 1.00 0.00<br />
12b-1 Fee to <strong>Dealer</strong> 0.10 0.65 0.00<br />
DEALER USE ONLY/NOT FOR DISTRIBUTION TO THE PUBLIC Go to franklintempleton.com or call (800) 223-2141 <strong>Dealer</strong> <strong>Facts</strong> <strong>Guide</strong> 87<br />
OPEN-END FUNDS VALUE BLEND GROWTH SECTOR GLOBAL INTERNATIONAL HYBRID ASSET ALLOCATION FIXED INCOME TAX-FREE INCOME
OPEN-END FUNDS<br />
VALUE<br />
BLEND<br />
GROWTH<br />
SECTOR<br />
GLOBAL<br />
INTERNATIONAL<br />
HYBRID<br />
ASSET ALLOCATION<br />
FIXED INCOME<br />
TAX-FREE INCOME<br />
<strong>Franklin</strong> Federal Limited-Term Tax-Free Income Fund<br />
FUND REFERENCE<br />
CLASS A<br />
Fund No. 154<br />
CUSIP 354 723 280<br />
Symbol FFTFX<br />
Inception1 9/2/03<br />
ANNUAL PROSPECTUS UPDATE AVAILABLE:<br />
July 1<br />
PORTFOLIO MANAGER/FUND TENURE 84<br />
Jim Conn, CFA, 2003<br />
Joined <strong>Franklin</strong> <strong>Templeton</strong> in 1996<br />
John Pomeroy, 2003<br />
Joined <strong>Franklin</strong> <strong>Templeton</strong> in 1986<br />
INVESTMENT CATEGORY<br />
Tax-Free Income19 PRIMARY INVESTMENT37 Investment grade New York<br />
municipal securities with an average<br />
maturity of 3 to 10 years.<br />
FUND REFERENCE<br />
CLASS A CLASS C<br />
Fund No. 153 253<br />
CUSIP 354 128 308 354 128 506<br />
Symbol FKNIX FKNCX<br />
Inception 1 9/21/92 7/1/03<br />
ADVISOR 89<br />
Fund No. 673<br />
CUSIP 354 128 704<br />
Symbol —<br />
Inception 1 9/21/92<br />
ANNUAL PROSPECTUS UPDATE AVAILABLE:<br />
February 1<br />
PORTFOLIO MANAGER/FUND TENURE 84<br />
Jim Conn, CFA, 1999<br />
Joined <strong>Franklin</strong> <strong>Templeton</strong> in 1996<br />
John Pomeroy, 1992<br />
Joined <strong>Franklin</strong> <strong>Templeton</strong> in 1986<br />
FUND DISTRIBUTIONS<br />
Dividend Frequency<br />
Monthly on or near the 19 th .<br />
9, 15<br />
Distribution Rate<br />
Taxable Equivalent<br />
9, 16<br />
Distribution Rate<br />
30, 45<br />
Dividend History<br />
6/09<br />
5/09<br />
4/09<br />
Capital Gains 30 (last 12 mos)<br />
Short-Term<br />
Long-Term<br />
See page 128 for more commission information and<br />
page 125 for footnotes.<br />
CLASS A<br />
2.61%<br />
4.02<br />
$0.0225<br />
0.0225<br />
0.0190<br />
—<br />
—<br />
6/30/09<br />
INVESTMENT CATEGORY<br />
Tax-Free Income86 PRIMARY INVESTMENT37 INTERMEDIATE-/LIMITED-TERM FUND<br />
FUND FACTS<br />
PORTFOLIO HOLDINGS<br />
CLASS A<br />
Investment grade municipal securities.<br />
The fund maintains a dollarweighted<br />
average portfolio maturity<br />
of five years or less.<br />
Net Assets (millions)<br />
2, 9<br />
Expense Ratio<br />
without waiver<br />
with waiver<br />
Net Asset Value<br />
Public Offering Price<br />
29 5/31<br />
Total Number of Positions<br />
Average Weighted Maturity<br />
Average Duration49 PERFORMANCE INFORMATION<br />
AVERAGE ANNUAL TOTAL RETURN – AVERAGE ANNUAL TOTAL RETURN–<br />
WITHOUT SALES CHARGES<br />
168<br />
AMT Exposure<br />
Average Credit Quality<br />
3.3 years<br />
2.89 years<br />
0.00%<br />
AA<br />
5, 9 6, 9, 51<br />
WITH SALES CHARGES<br />
1 YR 3 YR 5 YR 10 YR INCEPTION 1 YR 3 YR 5 YR 10 YR INCEPTION<br />
CLASS A 4.11 3.93 2.98 — 2.62 1.77 3.14 2.51 — 2.22<br />
$220.7<br />
1.03%<br />
0.53%<br />
$10.13<br />
$10.36<br />
29, 40<br />
CREDIT QUALITY<br />
AAA: 35.12% AA: 34.90% A: 22.16%<br />
BBB: 3.65 Not rated: 4.17<br />
MAXIMUM SALES CHARGE & COMMISSION<br />
CLASS A51 Sales Charge<br />
2.25%<br />
<strong>Dealer</strong> Concession<br />
2.00<br />
12b-1 Fee to <strong>Dealer</strong><br />
0.15<br />
<strong>Franklin</strong> New York Intermediate-Term Tax-Free Income Fund 6/30/09<br />
INTERMEDIATE-/LIMITED-TERM FUND<br />
FUND FACTS<br />
CLASS A CLASS C ADVISOR<br />
Net Assets (millions)<br />
Expense Ratio 2<br />
PORTFOLIO HOLDINGS<br />
$357.0 $40.8 $1.6<br />
0.73% 1.28% 0.63%<br />
Net Asset Value<br />
$10.65 $10.67 $10.66<br />
Public Offering Price $10.90 $10.67 $10.66<br />
29 5/31<br />
Total Number of Positions<br />
Average Weighted Maturity<br />
Average Duration49 AMT Exposure24 PERFORMANCE INFORMATION<br />
AVERAGE ANNUAL TOTAL RETURN – AVERAGE ANNUAL TOTAL RETURN–<br />
WITHOUT SALES CHARGES<br />
137<br />
8.8 years<br />
5.03 years<br />
0.00%<br />
Average Credit Quality<br />
AA<br />
5, 13 6, 13<br />
WITH SALES CHARGES<br />
1 YR 3 YR 5 YR 10 YR INCEPTION 1 YR 3 YR 5 YR 10 YR INCEPTION<br />
CLASS A<br />
CLASS C<br />
ADVISOR43 3.37 3.55 3.24 4.33 4.90 1.01 2.76 2.77 4.09 4.76<br />
2.89 2.98 2.67 — 2.12 1.89 2.98 2.67 — 2.12<br />
3.52 3.60 3.27 4.34 4.91 3.52 3.60 3.27 4.34 4.91<br />
Advisor Class shares are only offered to certain eligible investors as stated in the prospectus.<br />
FUND DISTRIBUTIONS<br />
Dividend Frequency<br />
Monthly on or near the 20th .<br />
CLASS A CLASS C ADVISOR<br />
Distribution Rate15 Taxable Equivalent<br />
Distribution Rate16 4, 30, 45<br />
Dividend History<br />
6/09<br />
5/09<br />
4/09<br />
Capital Gains 4,30 3.49% 3.00% 3.66%<br />
6.00 5.16 6.29<br />
$0.0317 $0.0267 $0.0325<br />
0.0317 0.0267 0.0325<br />
(last 12mos)<br />
0.0317 0.0267 0.0325<br />
Short-Term<br />
— — —<br />
Long-Term<br />
— — —<br />
See page 128 for more commission information and<br />
page 125 for footnotes.<br />
29, 40<br />
CREDIT QUALITY<br />
AAA: 34.95% AA: 46.74% A: 12.63%<br />
BBB: 5.21 Not rated: 0.47<br />
CLASS A (NAV)<br />
$20<br />
10<br />
0<br />
9/92 6/09<br />
MAXIMUM SALES CHARGE & COMMISSION<br />
CLASS A CLASS C73 ADVISOR89 Sales Charge<br />
2.25% 0.00% 0.00%<br />
<strong>Dealer</strong> Concession 2.00 1.00 0.00<br />
12b-1 Fee to <strong>Dealer</strong> 0.10 0.65 0.00<br />
88 <strong>Dealer</strong> <strong>Facts</strong> <strong>Guide</strong> Go to franklintempleton.com or call (800) 223-2141 DEALER USE ONLY/NOT FOR DISTRIBUTION TO THE PUBLIC
<strong>Franklin</strong> Alabama Tax-Free Income Fund<br />
STATE FUND<br />
INVESTMENT CATEGORY<br />
Tax-Free Income 19<br />
PRIMARY INVESTMENT 37<br />
Investment grade Alabama<br />
municipal securities.<br />
FUND REFERENCE<br />
Fund No.<br />
CLASS A<br />
164<br />
CLASS C<br />
264<br />
CUSIP 354 723 884 354 723 454<br />
Symbol FRALX FALEX<br />
Inception1 9/1/87 5/1/95<br />
ANNUAL PROSPECTUS UPDATE AVAILABLE:<br />
July 1<br />
PORTFOLIO MANAGER/FUND TENURE 84<br />
John Pomeroy, 1989<br />
Joined <strong>Franklin</strong> <strong>Templeton</strong> in 1986<br />
Jim Conn, CFA, 1999<br />
Joined <strong>Franklin</strong> <strong>Templeton</strong> in 1996<br />
<strong>Franklin</strong> Arizona Tax-Free Income Fund<br />
STATE FUND<br />
INVESTMENT CATEGORY<br />
Tax-Free Income 19<br />
PRIMARY INVESTMENT 37<br />
Investment grade Arizona<br />
municipal securities.<br />
FUND REFERENCE<br />
CLASS A CLASS C<br />
Fund No. 126 226<br />
CUSIP 354 723 876 354 723 462<br />
Symbol FTAZX FAZIX<br />
Inception1 9/1/87 5/1/95<br />
ADVISOR 89<br />
Fund No. 656<br />
CUSIP 354 723 256<br />
Symbol —<br />
Inception 1 9/1/87<br />
ANNUAL PROSPECTUS UPDATE AVAILABLE:<br />
July 1<br />
PORTFOLIO MANAGER/FUND TENURE 84<br />
Carrie Higgins, 1992<br />
Joined <strong>Franklin</strong> <strong>Templeton</strong> in 1990<br />
Francisco Rivera, 1996<br />
Joined <strong>Franklin</strong> <strong>Templeton</strong> in 1994<br />
FUND FACTS<br />
Net Assets (millions)<br />
Expense Ratio2 Net Asset Value<br />
Public Offering Price<br />
FUND DISTRIBUTIONS<br />
Dividend Frequency<br />
Monthly on or near the 20 th .<br />
Distribution Rate15 Taxable Equivalent<br />
Distribution Rate16 4, 30, 45<br />
Dividend History<br />
6/09<br />
5/09<br />
4/09<br />
Capital Gains 4, 30 (last 12 mos)<br />
Short-Term<br />
Long-Term<br />
See page 128 for more commission information and<br />
page 125 for footnotes.<br />
CLASS A CLASS C<br />
$229.1 $43.7<br />
0.71% 1.26%<br />
$10.74 $10.84<br />
$11.22 $10.84<br />
CLASS A CLASS C<br />
4.28% 3.89%<br />
6.93 6.30<br />
$0.0400 $0.0351<br />
0.0400 0.0352<br />
0.0400 0.0352<br />
— —<br />
— —<br />
FUND DISTRIBUTIONS<br />
Dividend Frequency<br />
Monthly on or near the 20th .<br />
CLASS A CLASS C ADVISOR<br />
Distribution Rate15 Taxable Equivalent<br />
Distribution Rate16 4, 30, 45<br />
Dividend History<br />
6/09<br />
5/09<br />
4/09<br />
Capital Gains 4,30 4.50% 4.08% 4.78%<br />
7.25 6.58 7.70<br />
$0.0406 $0.0357 $0.0414<br />
0.0406 0.0360 0.0414<br />
(last 12 mos)<br />
0.0406 0.0360 0.0414<br />
Short-Term<br />
— — —<br />
Long-Term<br />
— — —<br />
6/30/09<br />
PERFORMANCE INFORMATION<br />
AVERAGE ANNUAL TOTAL RETURN – AVERAGE ANNUAL TOTAL RETURN–<br />
WITHOUT SALES CHARGES5 6, 10<br />
WITH SALES CHARGES<br />
1 YR 3 YR 5 YR 10 YR INCEPTION 1 YR 3 YR 5 YR 10 YR INCEPTION<br />
CLASS A 1.05 2.70 3.31 4.16 5.89 -3.22 1.23 2.42 3.71 5.68<br />
CLASS C 0.49 2.15 2.75 3.59 4.14 -0.48 2.15 2.75 3.59 4.14<br />
PORTFOLIO HOLDINGS29 5/31<br />
Total Number of Positions<br />
Average Weighted Maturity<br />
Average Duration49 85<br />
18.2 years<br />
7.59 years<br />
AMT Exposure<br />
2.00%<br />
Average Credit Quality<br />
AA<br />
29, 40<br />
CREDIT QUALITY<br />
AAA: 43.37% AA: 20.21% A: 23.43%<br />
BBB: 5.85 BB: 1.36 Not rated: 5.78<br />
CLASS A (NAV)<br />
$20<br />
10<br />
0<br />
9/87 6/09<br />
MAXIMUM SALES CHARGE & COMMISSION<br />
CLASS A CLASS C73 Sales Charge<br />
4.25% 0.00%<br />
<strong>Dealer</strong> Concession<br />
4.00 1.00<br />
12b-1 Fee to <strong>Dealer</strong><br />
0.10 0.65<br />
6/30/09<br />
FUND FACTS<br />
CLASS A CLASS C ADVISOR<br />
Net Assets (millions)<br />
Expense Ratio2 PORTFOLIO HOLDINGS<br />
$948.8 $88.6 $0.3<br />
0.62% 1.17% 0.52%<br />
Net Asset Value<br />
$10.37 $10.49 $10.39<br />
Public Offering Price $10.83 $10.49 $10.39<br />
29 5/31<br />
Total Number of Positions<br />
Average Weighted Maturity<br />
Average Duration49 PERFORMANCE INFORMATION<br />
AVERAGE ANNUAL TOTAL RETURN – AVERAGE ANNUAL TOTAL RETURN–<br />
WITHOUT SALES CHARGES<br />
2.43 2.97 3.82 4.23 5.89 -1.92 1.49 2.91 3.78 5.67<br />
1.93 2.43 3.25 3.67 4.21 0.96 2.43 3.25 3.67 4.21<br />
2.72 3.07 3.88 4.26 5.90 2.72 3.07 3.88 4.26 5.90<br />
159<br />
18.4 years<br />
8.52 years<br />
AMT Exposure<br />
3.92%<br />
Average Credit Quality<br />
AA<br />
5 6, 10<br />
WITH SALES CHARGES<br />
1 YR 3 YR 5 YR 10 YR INCEPTION 1 YR 3 YR 5 YR 10 YR INCEPTION<br />
CLASS A<br />
CLASS C<br />
ADVISOR43 Advisor Class shares are only offered to certain eligible investors as stated in the prospectus.<br />
29, 40<br />
CREDIT QUALITY<br />
AAA: 30.62% AA: 38.17% A: 19.29%<br />
BBB: 11.25 Not rated: 0.67<br />
CLASS A (NAV)<br />
$20<br />
10<br />
0<br />
9/87 6/09<br />
MAXIMUM SALES CHARGE & COMMISSION<br />
CLASS A CLASS C<br />
See page 128 for more commission information and<br />
page 125 for footnotes.<br />
73 ADVISOR89 Sales Charge<br />
4.25% 0.00% 0.00%<br />
<strong>Dealer</strong> Concession 4.00 1.00 0.00<br />
12b-1 Fee to <strong>Dealer</strong> 0.10 0.65 0.00<br />
DEALER USE ONLY/NOT FOR DISTRIBUTION TO THE PUBLIC Go to franklintempleton.com or call (800) 223-2141 <strong>Dealer</strong> <strong>Facts</strong> <strong>Guide</strong> 89<br />
OPEN-END FUNDS VALUE BLEND GROWTH SECTOR GLOBAL INTERNATIONAL HYBRID ASSET ALLOCATION FIXED INCOME TAX-FREE INCOME
OPEN-END FUNDS<br />
VALUE<br />
BLEND<br />
GROWTH<br />
SECTOR<br />
GLOBAL<br />
INTERNATIONAL<br />
HYBRID<br />
ASSET ALLOCATION<br />
FIXED INCOME<br />
TAX-FREE INCOME<br />
<strong>Franklin</strong> California High Yield Municipal Fund<br />
OVERALL MORNINGSTAR RATINGTM CLASS A8 STATE FUND<br />
INVESTMENT CATEGORY<br />
Tax-Free Income19 PRIMARY INVESTMENT37 High yielding, California lowerrated<br />
or non-rated municipal<br />
securities.<br />
FUND REFERENCE<br />
CLASS A CLASS C<br />
Fund No. 175 275<br />
CUSIP 354 025 306 354 025 603<br />
Symbol FCAMX FCAHX<br />
Inception 1 5/3/93 5/1/96<br />
ADVISOR 89<br />
Fund No. 675<br />
CUSIP 354 025 801<br />
Symbol FVCAX<br />
Inception 1 5/3/93<br />
ANNUAL PROSPECTUS UPDATE AVAILABLE:<br />
October 1<br />
PORTFOLIO MANAGER/FUND TENURE 84<br />
John Wiley, 1993<br />
Joined <strong>Franklin</strong> <strong>Templeton</strong> in 1989<br />
Christopher Sperry, CFA, 2004<br />
Joined <strong>Franklin</strong> <strong>Templeton</strong> in 1996<br />
INVESTMENT CATEGORY<br />
Tax-Free Income 19<br />
PRIMARY INVESTMENT 37<br />
Insured California municipal<br />
securities.<br />
FUND REFERENCE<br />
CLASS A CLASS C<br />
Fund No. 124 224<br />
CUSIP 352 519 102 352 519 409<br />
Symbol FRCIX FRCAX<br />
Inception1 9/3/85 5/1/95<br />
ADVISOR 89<br />
Fund No. 654<br />
CUSIP 352 519 805<br />
Symbol —<br />
Inception 1 9/3/85<br />
ANNUAL PROSPECTUS UPDATE AVAILABLE:<br />
October 31<br />
PORTFOLIO MANAGER/FUND TENURE 84<br />
Christopher Sperry, CFA, 2000<br />
Joined <strong>Franklin</strong> <strong>Templeton</strong> in 1996<br />
John Wiley, 1991<br />
Joined <strong>Franklin</strong> <strong>Templeton</strong> in 1989<br />
FUND DISTRIBUTIONS<br />
Dividend Frequency<br />
Monthly on or near the 20th .<br />
CLASS A CLASS C ADVISOR<br />
Distribution Rate15 Taxable Equivalent<br />
Distribution Rate16 4, 30, 45<br />
Dividend History<br />
6/09<br />
5/09<br />
4/09<br />
Capital Gains 4,30 5.91% 5.64% 6.25%<br />
10.02 9.57 10.60<br />
$0.0427 $0.0392 $0.0433<br />
0.0425 0.0392 0.0431<br />
(last 12mos)<br />
0.0425 0.0392 0.0431<br />
Short-Term<br />
— — —<br />
Long-Term<br />
— — —<br />
See page 128 for more commission information and<br />
page 125 for footnotes.<br />
6/30/09<br />
FUND FACTS<br />
CLASS A CLASS C ADVISOR<br />
Net Assets (millions)<br />
Expense Ratio2 PORTFOLIO HOLDINGS<br />
$918.8 $209.6 $66.7<br />
0.62% 1.17% 0.52%<br />
Net Asset Value<br />
$8.30 $8.34 $8.31<br />
Public Offering Price $8.67 $8.34 $8.31<br />
29 5/31<br />
Total Number of Positions<br />
Average Weighted Maturity<br />
Average Duration49 PERFORMANCE INFORMATION<br />
AVERAGE ANNUAL TOTAL RETURN – AVERAGE ANNUAL TOTAL RETURN–<br />
WITHOUT SALES CHARGES<br />
-7.31 -1.89 1.49 3.16 4.53 -11.23 -3.28 0.62 2.72 4.25<br />
-7.87 -2.45 0.94 2.60 3.73 -8.75 -2.45 0.94 2.60 3.73<br />
-7.21 -1.77 1.57 3.20 4.56 -7.21 -1.77 1.57 3.20 4.56<br />
413<br />
22.1 years<br />
11.03 years<br />
AMT Exposure<br />
2.13%<br />
Average Credit Quality<br />
BBB<br />
5, 13 6, 12, 13<br />
WITH SALES CHARGES<br />
1 YR 3 YR 5 YR 10 YR INCEPTION 1 YR 3 YR 5 YR 10 YR INCEPTION<br />
CLASS A<br />
CLASS C<br />
ADVISOR43 Advisor Class shares are only offered to certain eligible investors as stated in the prospectus.<br />
29, 40<br />
CREDIT QUALITY<br />
AAA: 12.86% AA: 8.59% A: 17.53%<br />
BBB: 16.34 BB: 4.45 B: 0.86<br />
Not rated: 39.37<br />
CLASS A (NAV)<br />
$20<br />
10<br />
0<br />
5/93 6/09<br />
MAXIMUM SALES CHARGE & COMMISSION<br />
CLASS A CLASS C73 ADVISOR89 Sales Charge<br />
4.25% 0.00% 0.00%<br />
<strong>Dealer</strong> Concession 4.00 1.00 0.00<br />
12b-1 Fee to <strong>Dealer</strong> 0.10 0.65 0.00<br />
<strong>Franklin</strong> California Insured Tax-Free Income Fund<br />
STATE FUND<br />
6/30/09<br />
FUND FACTS<br />
CLASS A CLASS C ADVISOR<br />
Net Assets (millions)<br />
Expense Ratio2 PORTFOLIO HOLDINGS<br />
$1,781.3 $185.7 $2.1<br />
0.61% 1.16% 0.51%<br />
Net Asset Value<br />
$11.45 $11.57 $11.45<br />
Public Offering Price $11.96 $11.57 $11.45<br />
29 5/31<br />
Total Number of Positions<br />
Average Weighted Maturity<br />
Average Duration49 AMT Exposure24 PERFORMANCE INFORMATION<br />
AVERAGE ANNUAL TOTAL RETURN – AVERAGE ANNUAL TOTAL RETURN–<br />
WITHOUT SALES CHARGES<br />
362<br />
17.3 years<br />
8.26 years<br />
2.05%<br />
Average Credit Quality<br />
AA<br />
5, 13 6, 13<br />
WITH SALES CHARGES<br />
1 YR 3 YR 5 YR 10 YR INCEPTION 1 YR 3 YR 5 YR 10 YR INCEPTION<br />
CLASS A<br />
CLASS C<br />
ADVISOR43 -1.54 1.71 3.11 4.10 6.22 -5.72 0.25 2.22 3.65 6.03<br />
-2.15 1.13 2.55 3.53 4.20 -3.08 1.13 2.55 3.53 4.20<br />
-1.48 1.73 3.12 4.11 6.22 -1.48 1.73 3.12 4.11 6.22<br />
Advisor Class shares are only offered to certain eligible investors as stated in the prospectus.<br />
FUND DISTRIBUTIONS<br />
Dividend Frequency<br />
Monthly on or near the 20th .<br />
CLASS A CLASS C ADVISOR<br />
Distribution Rate15 Taxable Equivalent<br />
Distribution Rate16 4, 30, 45<br />
Dividend History<br />
6/09<br />
5/09<br />
4/09<br />
Capital Gains 4,30 4.62% 4.21% 4.92%<br />
7.84 7.14 8.35<br />
$0.0460 $0.0406 $0.0469<br />
0.0455 0.0403 0.0464<br />
(last 12mos)<br />
0.0455 0.0403 0.0464<br />
Short-Term<br />
— — —<br />
Long-Term<br />
— — —<br />
See page 128 for more commission information and<br />
page 125 for footnotes.<br />
29, 40<br />
CREDIT QUALITY<br />
AAA: 49.63% AA: 30.10% A: 19.10%<br />
BBB: 0.67 Not rated: 0.50<br />
CLASS A (NAV)<br />
$20<br />
10<br />
0<br />
9/85 6/09<br />
MAXIMUM SALES CHARGE & COMMISSION<br />
CLASS A CLASS C73 ADVISOR89 Sales Charge<br />
4.25% 0.00% 0.00%<br />
<strong>Dealer</strong> Concession 4.00 1.00 0.00<br />
12b-1 Fee to <strong>Dealer</strong> 0.10 0.65 0.00<br />
90 <strong>Dealer</strong> <strong>Facts</strong> <strong>Guide</strong> Go to franklintempleton.com or call (800) 223-2141 DEALER USE ONLY/NOT FOR DISTRIBUTION TO THE PUBLIC
<strong>Franklin</strong> California Tax-Free Income Fund<br />
STATE FUND<br />
OVERALL MORNINGSTAR RATING TM<br />
CLASS A 8<br />
★★★★<br />
INVESTMENT CATEGORY<br />
Tax-Free Income19 PRIMARY INVESTMENT37 Investment grade California<br />
municipal securities since<br />
April 1981.<br />
FUND REFERENCE<br />
CLASS A CLASS C<br />
Fund No. 112 212<br />
CUSIP 352 518 104 352 518 203<br />
Symbol FKTFX FRCTX<br />
Inception1 2/1/77 5/1/95<br />
ADVISOR 89<br />
Fund No. 614<br />
CUSIP 352 518 401<br />
Symbol FCAVX<br />
Inception 1 2/1/77<br />
ANNUAL PROSPECTUS UPDATE AVAILABLE:<br />
August 1<br />
PORTFOLIO MANAGER/FUND TENURE 84<br />
Christopher Sperry, CFA, 2000<br />
Joined <strong>Franklin</strong> <strong>Templeton</strong> in 1996<br />
John Wiley, 1991<br />
Joined <strong>Franklin</strong> <strong>Templeton</strong> in 1989<br />
<strong>Franklin</strong> Colorado Tax-Free Income Fund<br />
STATE FUND<br />
INVESTMENT CATEGORY<br />
Tax-Free Income 19<br />
PRIMARY INVESTMENT 37<br />
Investment grade Colorado<br />
municipal securities.<br />
FUND REFERENCE<br />
CLASS A CLASS C<br />
Fund No. 127 227<br />
CUSIP 354 723 868 354 723 439<br />
Symbol FRCOX FCOIX<br />
Inception 1 9/1/87 5/1/95<br />
ADVISOR 89<br />
Fund No. 086<br />
CUSIP 354 724 205<br />
Symbol —<br />
Inception 1 9/1/87<br />
ANNUAL PROSPECTUS UPDATE AVAILABLE:<br />
July 1<br />
PORTFOLIO MANAGER/FUND TENURE 84<br />
Carrie Higgins, 1992<br />
Joined <strong>Franklin</strong> <strong>Templeton</strong> in 1990<br />
Stella Wong, 1987<br />
Joined <strong>Franklin</strong> <strong>Templeton</strong> in 1986<br />
FUND FACTS<br />
Net Assets (millions)<br />
Expense Ratio2 Net Asset Value<br />
Public Offering Price<br />
FUND DISTRIBUTIONS<br />
Dividend Frequency<br />
Monthly on or near the 20 th .<br />
Distribution Rate15 Taxable Equivalent<br />
Distribution Rate16 4, 30, 45<br />
Dividend History<br />
6/09<br />
5/09<br />
4/09<br />
Capital Gains 4, 30 (last 12 mos)<br />
Short-Term<br />
Long-Term<br />
CLASS A CLASS C<br />
$505.6 $83.1<br />
0.66% 1.21%<br />
$11.12 $11.22<br />
$11.61 $11.22<br />
CLASS A CLASS C<br />
4.47% 4.06%<br />
7.21 6.55<br />
$0.0432 $0.0380<br />
0.0432 0.0384<br />
0.0432 0.0384<br />
— —<br />
— —<br />
6/30/09<br />
FUND FACTS<br />
CLASS A CLASS C ADVISOR<br />
Net Assets (millions)<br />
Expense Ratio2 PORTFOLIO HOLDINGS<br />
$11,948.0 $888.7 $249.1<br />
0.57% 1.13% 0.48%<br />
Net Asset Value<br />
$6.56 $6.55 $6.55<br />
Public Offering Price $6.85 $6.55 $6.55<br />
29 5/31<br />
Total Number of Positions<br />
Average Weighted Maturity<br />
Average Duration49 PERFORMANCE INFORMATION<br />
AVERAGE ANNUAL TOTAL RETURN – AVERAGE ANNUAL TOTAL RETURN–<br />
WITHOUT SALES CHARGES<br />
-1.46 1.56 3.34 4.14 5.57 -5.64 0.11 2.46 3.69 5.43<br />
-2.02 1.00 2.77 3.57 4.24 -2.95 1.00 2.77 3.57 4.24<br />
-1.38 1.65 3.44 4.20 5.59 -1.38 1.65 3.44 4.20 5.59<br />
860<br />
18.8 years<br />
9.08 years<br />
AMT Exposure<br />
1.81%<br />
Average Credit Quality<br />
AA<br />
5 6, 10<br />
WITH SALES CHARGES<br />
1 YR 3 YR 5 YR 10 YR INCEPTION 1 YR 3 YR 5 YR 10 YR INCEPTION<br />
CLASS A<br />
CLASS C<br />
ADVISOR43 Advisor Class shares are only offered to certain eligible investors as stated in the prospectus.<br />
FUND DISTRIBUTIONS<br />
Dividend Frequency<br />
Monthly on or near the 3rd business day.<br />
CLASS A CLASS C ADVISOR<br />
Distribution Rate15 Taxable Equivalent<br />
Distribution Rate16 4, 30, 45<br />
Dividend History<br />
6/09<br />
5/09<br />
4/09<br />
Capital Gains 4,30 4.91% 4.56% 5.20%<br />
8.33 7.73 8.82<br />
$0.0280 $0.0249 $0.0284<br />
0.0280 0.0252 0.0285<br />
(last 12mos)<br />
0.0280 0.0252 0.0285<br />
Short-Term<br />
— — —<br />
Long-Term<br />
— — —<br />
See page 128 for more commission information and<br />
page 125 for footnotes.<br />
See page 128 for more commission information and<br />
page 125 for footnotes.<br />
29, 40<br />
CREDIT QUALITY<br />
AAA: 36.04% AA: 24.07% A: 20.19%<br />
BBB: 12.90 BB: 5.43 Not rated: 1.37<br />
CLASS A (NAV)<br />
$20<br />
10<br />
0<br />
4/81 6/09<br />
MAXIMUM SALES CHARGE & COMMISSION<br />
CLASS A CLASS C73 ADVISOR89 Sales Charge<br />
4.25% 0.00% 0.00%<br />
<strong>Dealer</strong> Concession 4.00 1.00 0.00<br />
12b-1 Fee to <strong>Dealer</strong> 0.10 0.65 0.00<br />
6/30/09<br />
PERFORMANCE INFORMATION<br />
AVERAGE ANNUAL TOTAL RETURN – AVERAGE ANNUAL TOTAL RETURN–<br />
WITHOUT SALES CHARGES5 6, 10<br />
WITH SALES CHARGES<br />
1 YR 3 YR 5 YR 10 YR INCEPTION 1 YR 3 YR 5 YR 10 YR INCEPTION<br />
CLASS A 1.47 2.56 3.57 4.30 6.07 -2.84 1.10 2.67 3.85 5.86<br />
CLASS C 1.00 2.01 3.01 3.74 4.37 0.03 2.01 3.01 3.74 4.37<br />
PORTFOLIO HOLDINGS29 5/31<br />
Total Number of Positions<br />
Average Weighted Maturity<br />
Average Duration49 128<br />
19.8 years<br />
8.41 years<br />
AMT Exposure<br />
2.13%<br />
Average Credit Quality<br />
AA<br />
29, 40<br />
CREDIT QUALITY<br />
AAA: 31.44% AA: 40.73% A: 16.55%<br />
BBB: 10.51 Not rated: 0.77<br />
CLASS A (NAV)<br />
$20<br />
10<br />
0<br />
9/87 6/09<br />
MAXIMUM SALES CHARGE & COMMISSION<br />
CLASS A CLASS C73 ADVISOR89 Sales Charge<br />
4.25% 0.00% 0.00%<br />
<strong>Dealer</strong> Concession 4.00 1.00 0.00<br />
12b-1 Fee to <strong>Dealer</strong> 0.10 0.65 0.00<br />
DEALER USE ONLY/NOT FOR DISTRIBUTION TO THE PUBLIC Go to franklintempleton.com or call (800) 223-2141 <strong>Dealer</strong> <strong>Facts</strong> <strong>Guide</strong> 91<br />
OPEN-END FUNDS VALUE BLEND GROWTH SECTOR GLOBAL INTERNATIONAL HYBRID ASSET ALLOCATION FIXED INCOME TAX-FREE INCOME
OPEN-END FUNDS<br />
VALUE<br />
BLEND<br />
GROWTH<br />
SECTOR<br />
GLOBAL<br />
INTERNATIONAL<br />
HYBRID<br />
ASSET ALLOCATION<br />
FIXED INCOME<br />
TAX-FREE INCOME<br />
<strong>Franklin</strong> Connecticut Tax-Free Income Fund<br />
STATE FUND<br />
INFORMATION 8<br />
STAR RATING – CLASS A<br />
INVESTMENT CATEGORY<br />
Tax-Free Income 19<br />
PRIMARY INVESTMENT 37<br />
Investment grade Connecticut<br />
municipal securities.<br />
FUND REFERENCE<br />
CLASS A CLASS C<br />
Fund No. 166 266<br />
CUSIP 354 723 744 354 723 579<br />
Symbol FXCTX FCTIX<br />
Inception1 10/3/88 5/1/95<br />
ADVISOR 89<br />
Fund No. 069<br />
CUSIP 354 724 304<br />
Symbol —<br />
Inception 1 10/3/88<br />
ANNUAL PROSPECTUS UPDATE AVAILABLE:<br />
July 1<br />
PORTFOLIO MANAGER/FUND TENURE 84<br />
Stella Wong, 1988<br />
Joined <strong>Franklin</strong> <strong>Templeton</strong> in 1986<br />
Carrie Higgins, 2004<br />
Joined <strong>Franklin</strong> <strong>Templeton</strong> in 1990<br />
STATE FUND<br />
INVESTMENT CATEGORY<br />
Tax-Free Income19 PRIMARY INVESTMENT37 Investment grade Florida<br />
municipal securities.<br />
FUND REFERENCE<br />
CLASS A CLASS C<br />
Fund No. 165 265<br />
CUSIP 354 723 850 354 723 470<br />
Symbol FRFLX FRFIX<br />
Inception1 9/1/87 5/1/95<br />
ANNUAL PROSPECTUS UPDATE AVAILABLE:<br />
July 1<br />
PORTFOLIO MANAGER/FUND TENURE 84<br />
Stella Wong, 1987<br />
Joined <strong>Franklin</strong> <strong>Templeton</strong> in 1986<br />
Carrie Higgins, 2004<br />
Joined <strong>Franklin</strong> <strong>Templeton</strong> in 1990<br />
PERFORMANCE INFORMATION<br />
AVERAGE ANNUAL TOTAL RETURN – AVERAGE ANNUAL TOTAL RETURN–<br />
WITHOUT SALES CHARGES5 6, 10<br />
WITH SALES CHARGES<br />
CLASS A<br />
CLASS C<br />
FUND FACTS<br />
Net Assets (millions)<br />
Expense Ratio2 Net Asset Value<br />
Public Offering Price<br />
FUND DISTRIBUTIONS<br />
Dividend Frequency<br />
Monthly on or near the 20 th .<br />
Distribution Rate15 Taxable Equivalent<br />
Distribution Rate16 4, 30, 45<br />
Dividend History<br />
6/09<br />
5/09<br />
4/09<br />
Capital Gains 4, 30 (last 12 mos)<br />
Short-Term<br />
Long-Term<br />
See page 128 for more commission information and<br />
page 125 for footnotes.<br />
FUND FACTS<br />
Net Assets (millions)<br />
Expense Ratio 2<br />
Net Asset Value<br />
Public Offering Price<br />
FUND DISTRIBUTIONS<br />
Dividend Frequency<br />
Monthly on or near the 20 th .<br />
Distribution Rate15 Taxable Equivalent<br />
Distribution Rate16 4, 30, 45<br />
Dividend History<br />
6/09<br />
5/09<br />
4/09<br />
Capital Gains 4, 30 (last 12 mos)<br />
Short-Term<br />
Long-Term<br />
See page 128 for more commission information and<br />
page 125 for footnotes.<br />
CLASS A CLASS C<br />
$354.8 $77.5<br />
0.68% 1.23%<br />
$10.39 $10.45<br />
$10.85 $10.45<br />
CLASS A CLASS C<br />
4.18% 3.79%<br />
6.77 6.14<br />
$0.0378 $0.0330<br />
0.0375 0.0329<br />
0.0375 0.0329<br />
— —<br />
— —<br />
<strong>Franklin</strong> Florida Tax-Free Income Fund<br />
CLASS A CLASS C<br />
$1,141.6 $110.3<br />
0.62% 1.17%<br />
$11.05 $11.21<br />
$11.54 $11.21<br />
CLASS A CLASS C<br />
4.54% 4.14%<br />
6.98 6.37<br />
$0.0437 $0.0387<br />
0.0437 0.0387<br />
0.0437 0.0387<br />
— —<br />
— —<br />
6/30/09<br />
1 YR 3 YR 5 YR 10 YR INCEPTION 1 YR 3 YR 5 YR 10 YR INCEPTION<br />
1.38 2.75 3.79 4.21 5.50 -2.96 1.29 2.90 3.76 5.29<br />
0.82 2.18 3.22 3.65 4.23 -0.15 2.18 3.22 3.65 4.23<br />
PORTFOLIO HOLDINGS29 5/31<br />
Total Number of Positions<br />
Average Weighted Maturity<br />
Average Duration49 130<br />
18.4 years<br />
7.76 years<br />
AMT Exposure<br />
3.29%<br />
Average Credit Quality<br />
A<br />
29, 40<br />
CREDIT QUALITY<br />
AAA: 37.05% AA: 24.18% A: 21.64%<br />
BBB: 15.98 BB: 0.92 Not rated: 0.23<br />
CLASS A (NAV)<br />
$20<br />
10<br />
0<br />
10/88 6/09<br />
MAXIMUM SALES CHARGE & COMMISSION<br />
CLASS A CLASS C73 ADVISOR89 Sales Charge<br />
4.25% 0.00% 0.00%<br />
<strong>Dealer</strong> Concession 4.00 1.00 0.00<br />
12b-1 Fee to <strong>Dealer</strong> 0.10 0.65 0.00<br />
PERFORMANCE INFORMATION<br />
AVERAGE ANNUAL TOTAL RETURN – AVERAGE ANNUAL TOTAL RETURN–<br />
WITHOUT SALES CHARGES5 6, 10<br />
WITH SALES CHARGES<br />
1 YR 3 YR 5 YR 10 YR INCEPTION 1 YR 3 YR 5 YR 10 YR INCEPTION<br />
CLASS A 1.42 2.84 3.70 4.51 6.23 -2.91 1.36 2.80 4.06 6.02<br />
CLASS C 0.85 2.30 3.14 3.94 4.47 -0.12 2.30 3.14 3.94 4.47<br />
PORTFOLIO HOLDINGS29 5/31<br />
Total Number of Positions<br />
Average Weighted Maturity<br />
Average Duration49 225<br />
16.2 years<br />
7.70 years<br />
AMT Exposure<br />
7.45%<br />
Average Credit Quality<br />
AA<br />
29, 40<br />
CREDIT QUALITY<br />
AAA: 41.71% AA: 29.56% A: 17.22%<br />
BBB: 8.94 Not rated: 2.57<br />
CLASS A (NAV)<br />
$20<br />
10<br />
6/30/09<br />
0<br />
9/87 6/09<br />
MAXIMUM SALES CHARGE & COMMISSION<br />
CLASS A CLASS C73 Sales Charge<br />
4.25% 0.00%<br />
<strong>Dealer</strong> Concession<br />
4.00 1.00<br />
12b-1 Fee to <strong>Dealer</strong><br />
0.10 0.65<br />
92 <strong>Dealer</strong> <strong>Facts</strong> <strong>Guide</strong> Go to franklintempleton.com or call (800) 223-2141 DEALER USE ONLY/NOT FOR DISTRIBUTION TO THE PUBLIC
<strong>Franklin</strong> Georgia Tax-Free Income Fund<br />
STATE FUND<br />
OVERALL MORNINGSTAR RATING TM<br />
CLASS A 8<br />
★★★★<br />
INVESTMENT CATEGORY<br />
Tax-Free Income 19<br />
PRIMARY INVESTMENT 37<br />
Investment grade Georgia<br />
municipal securities.<br />
FUND REFERENCE<br />
Fund No.<br />
CLASS A<br />
128<br />
CLASS C<br />
228<br />
CUSIP 354 723 843 354 723 488<br />
Symbol FTGAX FGAIX<br />
Inception1 9/1/87 5/1/95<br />
ANNUAL PROSPECTUS UPDATE AVAILABLE:<br />
July 1<br />
PORTFOLIO MANAGER/FUND TENURE 84<br />
Francisco Rivera, 1996<br />
Joined <strong>Franklin</strong> <strong>Templeton</strong> in 1994<br />
John Pomeroy, 1989<br />
Joined <strong>Franklin</strong> <strong>Templeton</strong> in 1986<br />
INVESTMENT CATEGORY<br />
Tax-Free Income 19<br />
PRIMARY INVESTMENT 37<br />
Investment grade Kentucky<br />
municipal securities.<br />
FUND REFERENCE<br />
CLASS A<br />
Fund No. 172<br />
CUSIP 354 723 728<br />
Symbol FRKYX<br />
Inception 1 10/12/91<br />
ANNUAL PROSPECTUS UPDATE AVAILABLE:<br />
July 1<br />
PORTFOLIO MANAGER/FUND TENURE 84<br />
Francisco Rivera, 1996<br />
Joined <strong>Franklin</strong> <strong>Templeton</strong> in 1994<br />
Carrie Higgins, 1992<br />
Joined <strong>Franklin</strong> <strong>Templeton</strong> in 1990<br />
FUND FACTS<br />
Net Assets (millions)<br />
Expense Ratio2 Net Asset Value<br />
Public Offering Price<br />
FUND DISTRIBUTIONS<br />
Dividend Frequency<br />
Monthly on or near the 20 th .<br />
Distribution Rate15 Taxable Equivalent<br />
Distribution Rate16 4, 30, 45<br />
Dividend History<br />
6/09<br />
5/09<br />
4/09<br />
Capital Gains 4, 30 (last 12 mos)<br />
Short-Term<br />
Long-Term<br />
See page 128 for more commission information and<br />
page 125 for footnotes.<br />
CLASS A CLASS C<br />
$331.7 $78.6<br />
0.69% 1.24%<br />
$11.44 $11.56<br />
$11.95 $11.56<br />
CLASS A CLASS C<br />
4.17% 3.77%<br />
6.82 6.17<br />
$0.0415 $0.0363<br />
0.0420 0.0369<br />
0.0420 0.0369<br />
— —<br />
— —<br />
<strong>Franklin</strong> Kentucky Tax-Free Income Fund<br />
STATE FUND<br />
PERFORMANCE INFORMATION<br />
AVERAGE ANNUAL TOTAL RETURN – AVERAGE ANNUAL TOTAL RETURN–<br />
WITHOUT SALES CHARGES5 6, 10<br />
WITH SALES CHARGES<br />
CLASS A<br />
CLASS C<br />
FUND FACTS<br />
Net Assets (millions)<br />
Expense Ratio2 Net Asset Value<br />
Public Offering Price<br />
FUND DISTRIBUTIONS<br />
Dividend Frequency<br />
Monthly on or near the 20 th .<br />
Distribution Rate15 Taxable Equivalent<br />
Distribution Rate16 4, 30, 45<br />
Dividend History<br />
6/09<br />
5/09<br />
4/09<br />
Capital Gains 4, 30 (last 12 mos)<br />
Short-Term<br />
Long-Term<br />
See page 128 for more commission information and<br />
page 125 for footnotes.<br />
CLASS A<br />
$169.6<br />
0.76%<br />
$10.71<br />
$11.19<br />
CLASS A<br />
4.24%<br />
6.94<br />
$0.0395<br />
0.0395<br />
0.0395<br />
—<br />
—<br />
6/30/09<br />
1 YR 3 YR 5 YR 10 YR INCEPTION 1 YR 3 YR 5 YR 10 YR INCEPTION<br />
1.83 3.07 3.76 4.40 6.03 -2.49 1.58 2.87 3.95 5.82<br />
1.25 2.53 3.21 3.83 4.29 0.28 2.53 3.21 3.83 4.29<br />
PORTFOLIO HOLDINGS29 5/31<br />
Total Number of Positions<br />
Average Weighted Maturity<br />
Average Duration49 119<br />
18.2 years<br />
7.34 years<br />
AMT Exposure<br />
1.63%<br />
Average Credit Quality<br />
AA<br />
29, 40<br />
CREDIT QUALITY<br />
AAA: 44.36% AA: 28.05% A: 21.58%<br />
BBB: 3.88 BB: 0.88 Not rated: 1.25<br />
CLASS A (NAV)<br />
$20<br />
10<br />
0<br />
9/87 6/09<br />
MAXIMUM SALES CHARGE & COMMISSION<br />
CLASS A CLASS C73 Sales Charge<br />
4.25% 0.00%<br />
<strong>Dealer</strong> Concession<br />
4.00 1.00<br />
12b-1 Fee to <strong>Dealer</strong><br />
0.10 0.65<br />
6/30/09<br />
PERFORMANCE INFORMATION<br />
AVERAGE ANNUAL TOTAL RETURN – AVERAGE ANNUAL TOTAL RETURN–<br />
WITHOUT SALES CHARGES5, 13 6, 10, 13<br />
WITH SALES CHARGES<br />
1 YR 3 YR 5 YR 10 YR INCEPTION 1 YR 3 YR 5 YR 10 YR INCEPTION<br />
CLASS A 2.22 2.84 3.66 4.26 5.45 -2.16 1.35 2.76 3.82 5.19<br />
PORTFOLIO HOLDINGS29 5/31<br />
Total Number of Positions<br />
Average Weighted Maturity<br />
Average Duration49 84<br />
18.1 years<br />
6.96 years<br />
AMT Exposure<br />
6.44%<br />
Average Credit Quality<br />
AA<br />
29, 40<br />
CREDIT QUALITY<br />
AAA: 24.91% AA: 46.66% A: 14.62%<br />
BBB: 11.54 BB: 0.88 Not rated: 1.39<br />
CLASS A (NAV)<br />
$20<br />
10<br />
0<br />
10/91 6/09<br />
MAXIMUM SALES CHARGE & COMMISSION<br />
CLASS A<br />
Sales Charge<br />
4.25%<br />
<strong>Dealer</strong> Concession<br />
4.00<br />
12b-1 Fee to <strong>Dealer</strong><br />
0.10<br />
DEALER USE ONLY/NOT FOR DISTRIBUTION TO THE PUBLIC Go to franklintempleton.com or call (800) 223-2141 <strong>Dealer</strong> <strong>Facts</strong> <strong>Guide</strong> 93<br />
OPEN-END FUNDS VALUE BLEND GROWTH SECTOR GLOBAL INTERNATIONAL HYBRID ASSET ALLOCATION FIXED INCOME TAX-FREE INCOME
OPEN-END FUNDS<br />
VALUE<br />
BLEND<br />
GROWTH<br />
SECTOR<br />
GLOBAL<br />
INTERNATIONAL<br />
HYBRID<br />
ASSET ALLOCATION<br />
FIXED INCOME<br />
TAX-FREE INCOME<br />
<strong>Franklin</strong> Louisiana Tax-Free Income Fund<br />
STATE FUND<br />
OVERALL MORNINGSTAR RATING TM<br />
CLASS A 8<br />
★★★★<br />
INVESTMENT CATEGORY<br />
Tax-Free Income 19<br />
PRIMARY INVESTMENT 37<br />
Investment grade Louisiana<br />
municipal securities.<br />
FUND REFERENCE<br />
CLASS A CLASS C<br />
Fund No. 168 268<br />
CUSIP 354 723 827 354 723 512<br />
Symbol FKLAX FLAIX<br />
Inception 1 9/1/87 5/1/95<br />
ANNUAL PROSPECTUS UPDATE AVAILABLE:<br />
July 1<br />
PORTFOLIO MANAGER/FUND TENURE 84<br />
Francisco Rivera, 1996<br />
Joined <strong>Franklin</strong> <strong>Templeton</strong> in 1994<br />
John Wiley, 1991<br />
Joined <strong>Franklin</strong> <strong>Templeton</strong> in 1989<br />
FUND FACTS<br />
Net Assets (millions)<br />
Expense Ratio2 Net Asset Value<br />
Public Offering Price<br />
FUND DISTRIBUTIONS<br />
Dividend Frequency<br />
Monthly on or near the 20 th .<br />
Distribution Rate15 Taxable Equivalent<br />
Distribution Rate16 4, 30, 45<br />
Dividend History<br />
6/09<br />
5/09<br />
4/09<br />
Capital Gains 4, 30 (last 12 mos)<br />
Short-Term<br />
Long-Term<br />
See page 128 for more commission information and<br />
page 125 for footnotes.<br />
CLASS A CLASS C<br />
$283.2 $49.0<br />
0.71% 1.26%<br />
$10.73 $10.85<br />
$11.21 $10.85<br />
CLASS A CLASS C<br />
4.27% 3.86%<br />
6.99 6.32<br />
$0.0399 $0.0349<br />
0.0399 0.0355<br />
0.0399 0.0355<br />
— —<br />
— —<br />
6/30/09<br />
PORTFOLIO HOLDINGS29 5/31<br />
Total Number of Positions<br />
Average Weighted Maturity<br />
Average Duration49 107<br />
18.5 years<br />
8.08 years<br />
AMT Exposure<br />
3.93%<br />
Average Credit Quality<br />
AA<br />
29, 40<br />
CREDIT QUALITY<br />
AAA: 29.30% AA: 19.37% A: 35.28%<br />
BBB: 12.56 BB: 0.86 Not rated: 2.63<br />
CLASS A (NAV)<br />
$20<br />
10<br />
0<br />
9/87 6/09<br />
MAXIMUM SALES CHARGE & COMMISSION<br />
CLASS A CLASS C73 Sales Charge<br />
4.25% 0.00%<br />
<strong>Dealer</strong> Concession<br />
4.00 1.00<br />
12b-1 Fee to <strong>Dealer</strong><br />
0.10 0.65<br />
<strong>Franklin</strong> Maryland Tax-Free Income Fund 44 6/30/09<br />
STATE FUND<br />
INFORMATION 8<br />
STAR RATING – CLASS A<br />
★★★★<br />
INVESTMENT CATEGORY<br />
Tax-Free Income 19<br />
PRIMARY INVESTMENT 37<br />
Investment grade Maryland<br />
municipal securities.<br />
FUND REFERENCE<br />
CLASS A CLASS C<br />
Fund No. 169 269<br />
CUSIP 354 723 736 354 723 421<br />
Symbol FMDTX FMDIX<br />
Inception 1 10/3/88 5/1/95<br />
ADVISOR 89<br />
Fund No. 669<br />
CUSIP 354 723 140<br />
Symbol —<br />
Inception 1 10/3/88<br />
ANNUAL PROSPECTUS UPDATE AVAILABLE:<br />
July 1<br />
PORTFOLIO MANAGER/FUND TENURE 84<br />
John Pomeroy, 1989<br />
Joined <strong>Franklin</strong> <strong>Templeton</strong> in 1986<br />
Jim Conn, CFA, 1999<br />
Joined <strong>Franklin</strong> <strong>Templeton</strong> in 1996<br />
PERFORMANCE INFORMATION<br />
AVERAGE ANNUAL TOTAL RETURN – AVERAGE ANNUAL TOTAL RETURN–<br />
WITHOUT SALES CHARGES5 6, 10<br />
WITH SALES CHARGES<br />
1 YR 3 YR 5 YR 10 YR INCEPTION 1 YR 3 YR 5 YR 10 YR INCEPTION<br />
CLASS A 1.09 2.48 3.22 4.27 5.96 -3.18 1.02 2.34 3.81 5.74<br />
CLASS C 0.54 1.93 2.65 3.70 4.30 -0.43 1.93 2.65 3.70 4.30<br />
PERFORMANCE INFORMATION<br />
AVERAGE ANNUAL TOTAL RETURN – AVERAGE ANNUAL TOTAL RETURN–<br />
WITHOUT SALES CHARGES5 6, 10<br />
WITH SALES CHARGES<br />
CLASS A<br />
CLASS C<br />
FUND FACTS<br />
Net Assets (millions)<br />
Expense Ratio 2<br />
Net Asset Value<br />
Public Offering Price<br />
FUND DISTRIBUTIONS<br />
Dividend Frequency<br />
Monthly on or near the 20 th .<br />
Distribution Rate15 Taxable Equivalent<br />
Distribution Rate16 4, 30, 45<br />
Dividend History<br />
6/09<br />
5/09<br />
4/09<br />
Capital Gains 4, 30 (last 12 mos)<br />
Short-Term<br />
Long-Term<br />
1 YR 3 YR 5 YR 10 YR INCEPTION 1 YR 3 YR 5 YR 10 YR INCEPTION<br />
0.50 1.92 2.98 4.11 5.67 -3.73 0.46 2.09 3.66 5.45<br />
-0.05 1.37 2.42 3.55 4.25 -1.01 1.37 2.42 3.55 4.25<br />
See page 128 for more commission information and<br />
page 125 for footnotes.<br />
CLASS A CLASS C<br />
$454.5 $112.9<br />
0.67% 1.22%<br />
$10.69 $10.84<br />
$11.16 $10.84<br />
CLASS A CLASS C<br />
4.43% 4.02%<br />
7.53 6.83<br />
$0.0412 $0.0363<br />
0.0412 0.0366<br />
0.0412 0.0366<br />
— —<br />
— —<br />
PORTFOLIO HOLDINGS29 5/31<br />
Total Number of Positions<br />
Average Weighted Maturity<br />
Average Duration49 111<br />
19.6 years<br />
7.38 years<br />
AMT Exposure<br />
1.32%<br />
Average Credit Quality<br />
A<br />
29, 40<br />
CREDIT QUALITY<br />
AAA: 37.80% AA: 23.06% A: 15.91%<br />
BBB: 21.47 Not rated: 1.76<br />
CLASS A (NAV)<br />
$20<br />
10<br />
0<br />
10/88 6/09<br />
MAXIMUM SALES CHARGE & COMMISSION<br />
CLASS A CLASS C73 ADVISOR89 Sales Charge<br />
4.25% 0.00% 0.00%<br />
<strong>Dealer</strong> Concession 4.00 1.00 0.00<br />
12b-1 Fee to <strong>Dealer</strong> 0.10 0.65 0.00<br />
94 <strong>Dealer</strong> <strong>Facts</strong> <strong>Guide</strong> Go to franklintempleton.com or call (800) 223-2141 DEALER USE ONLY/NOT FOR DISTRIBUTION TO THE PUBLIC
<strong>Franklin</strong> Massachusetts Tax-Free Income Fund 91 6/30/09<br />
STATE FUND<br />
INVESTMENT CATEGORY<br />
Tax-Free Income19 PRIMARY INVESTMENT37 Insured Massachusetts municipal<br />
securities.<br />
The following changes became effective<br />
February 15, 2009: Elimination of the nonfundamental<br />
policy requiring the fund to<br />
invest at least 80% of net assets in insured<br />
municipal securities; the removal of the word<br />
“Insured” from the fund name; and the fund will<br />
only buy municipal securities rated in the top<br />
four ratings by U.S. nationally recognized rating<br />
services (or comparable unrated securities).<br />
However, to the extent insured Massachusetts<br />
municipal securities are available, the fund may<br />
continue to buy insured municipal securities.<br />
FUND REFERENCE<br />
CLASS A CLASS C<br />
Fund No. 118 218<br />
CUSIP 354 723 207 354 723 678<br />
Symbol FMISX FMAIX<br />
Inception1 4/3/85 5/1/95<br />
ADVISOR 89<br />
Fund No. 018<br />
CUSIP 354 723 199<br />
Symbol —<br />
Inception 1 4/3/85<br />
PORTFOLIO MANAGER/FUND TENURE 84<br />
Jim Conn, CFA, 1999<br />
Joined <strong>Franklin</strong> <strong>Templeton</strong> in 1996<br />
John Pomeroy, 1989<br />
Joined <strong>Franklin</strong> <strong>Templeton</strong> in 1986<br />
Francisco Rivera, 1996<br />
Joined <strong>Franklin</strong> <strong>Templeton</strong> in 1994<br />
STATE FUND<br />
OVERALL MORNINGSTAR RATING TM<br />
CLASS A 8<br />
★★★★<br />
INVESTMENT CATEGORY<br />
Tax-Free Income19 PRIMARY INVESTMENT37 Insured Michigan municipal securities.<br />
The following changes became effective<br />
February 17, 2009: Elimination of the nonfundamental<br />
policy requiring the fund to<br />
invest at least 80% of net assets in insured<br />
municipal securities; the removal of the word<br />
“Insured” from the fund name; and the fund will<br />
only buy municipal securities rated in the top<br />
four ratings by U.S. nationally recognized rating<br />
services (or comparable unrated securities).<br />
However, to the extent insured Michigan<br />
municipal securities are available, the fund may<br />
continue to buy insured municipal securities.<br />
FUND REFERENCE<br />
CLASS A CLASS C<br />
Fund No. 119 219<br />
CUSIP 354 723 306 354 723 645<br />
Symbol FTTMX FRMTX<br />
Inception1 4/3/85 5/1/95<br />
ADVISOR 89<br />
Fund No. 657<br />
CUSIP 354 723 249<br />
Symbol —<br />
Inception 1 4/3/85<br />
ANNUAL<br />
PROSPECTUS<br />
UPDATE<br />
AVAILABLE:<br />
July 1<br />
PORTFOLIO MANAGER/FUND TENURE 84<br />
John Pomeroy, 1989<br />
Joined <strong>Franklin</strong> <strong>Templeton</strong> in 1986<br />
Jim Conn, CFA, 1999<br />
Joined <strong>Franklin</strong> <strong>Templeton</strong> in 1996<br />
FUND FACTS<br />
Net Assets (millions)<br />
Expense Ratio2 Net Asset Value<br />
Public Offering Price<br />
FUND DISTRIBUTIONS<br />
Dividend Frequency<br />
Monthly on or near the 20 th .<br />
Distribution Rate15 Taxable Equivalent<br />
Distribution Rate16 4, 30, 45<br />
Dividend History<br />
6/09<br />
5/09<br />
4/09<br />
Capital Gains 4, 30 (last 12 mos)<br />
Short-Term<br />
Long-Term<br />
See page 128 for more commission information and<br />
page 125 for footnotes.<br />
CLASS A CLASS C<br />
$452.7 $70.8<br />
0.66% 1.21%<br />
$11.08 $11.18<br />
$11.57 $11.18<br />
CLASS A CLASS C<br />
4.21% 3.80%<br />
6.84 6.17<br />
$0.0406 $0.0354<br />
0.0406 0.0356<br />
0.0406 0.0356<br />
— —<br />
— —<br />
PORTFOLIO HOLDINGS29 5/31<br />
Total Number of Positions<br />
Average Weighted Maturity<br />
Average Duration49 110<br />
17.9 years<br />
7.78 years<br />
AMT Exposure<br />
2.47%<br />
Average Credit Quality<br />
AA<br />
29, 40<br />
CREDIT QUALITY<br />
AAA: 48.52% AA: 34.88% A: 10.95%<br />
BBB: 4.14 Not rated: 1.51<br />
CLASS A (NAV)<br />
$20<br />
10<br />
0<br />
4/85 6/09<br />
MAXIMUM SALES CHARGE & COMMISSION<br />
CLASS A CLASS C73 ADVISOR89 Sales Charge<br />
4.25% 0.00% 0.00%<br />
<strong>Dealer</strong> Concession 4.00 1.00 0.00<br />
12b-1 Fee to <strong>Dealer</strong> 0.10 0.65 0.00<br />
<strong>Franklin</strong> Michigan Tax-Free Income Fund 91 6/30/09<br />
ANNUAL<br />
PROSPECTUS<br />
UPDATE<br />
AVAILABLE:<br />
July 1<br />
PERFORMANCE INFORMATION<br />
AVERAGE ANNUAL TOTAL RETURN – AVERAGE ANNUAL TOTAL RETURN–<br />
WITHOUT SALES CHARGES5 6, 10<br />
WITH SALES CHARGES<br />
1 YR 3 YR 5 YR 10 YR INCEPTION 1 YR 3 YR 5 YR 10 YR INCEPTION<br />
CLASS A 0.80 2.53 3.36 4.35 6.10 -3.48 1.05 2.46 3.90 5.91<br />
CLASS C 0.34 1.97 2.80 3.78 4.26 -0.63 1.97 2.80 3.78 4.26<br />
FUND FACTS<br />
CLASS A CLASS C ADVISOR43 Net Assets (millions)<br />
Expense Ratio2 PORTFOLIO HOLDINGS<br />
$1,314.8 $180.6 $0.7<br />
0.63% 1.18% 0.53%<br />
Net Asset Value<br />
$11.61 $11.74 $11.63<br />
Public Offering Price $12.13 $11.74 $11.63<br />
29 5/31<br />
Total Number of Positions<br />
Average Weighted Maturity<br />
Average Duration49 PERFORMANCE INFORMATION<br />
AVERAGE ANNUAL TOTAL RETURN – AVERAGE ANNUAL TOTAL RETURN–<br />
WITHOUT SALES CHARGES<br />
220<br />
15.8 years<br />
6.48 years<br />
AMT Exposure<br />
1.64%<br />
Average Credit Quality<br />
AA<br />
5, 13 6, 10, 13<br />
WITH SALES CHARGES<br />
1 YR 3 YR 5 YR 10 YR INCEPTION 1 YR 3 YR 5 YR 10 YR INCEPTION<br />
CLASS A<br />
CLASS C<br />
ADVISOR43 1.84 3.31 3.77 4.54 6.40 -2.50 1.84 2.88 4.08 6.21<br />
1.35 2.74 3.20 3.97 4.48 0.37 2.74 3.20 3.97 4.48<br />
2.11 3.40 3.82 4.57 6.41 2.11 3.40 3.82 4.57 6.41<br />
Advisor Class shares are only offered to certain eligible investors as stated in the prospectus.<br />
FUND DISTRIBUTIONS<br />
Dividend Frequency<br />
Monthly on or near the 20th .<br />
CLASS A CLASS C ADVISOR<br />
Distribution Rate15 Taxable Equivalent<br />
Distribution Rate16 4, 30, 45<br />
Dividend History<br />
6/09<br />
5/09<br />
4/09<br />
Capital Gains 4,30 4.28% 3.87% 4.57%<br />
6.88 6.22 7.35<br />
$0.0433 $0.0379 $0.0443<br />
0.0426 0.0374 0.0435<br />
(last 12 mos)<br />
0.0426 0.0374 0.0435<br />
Short-Term<br />
— — —<br />
Long-Term<br />
— — —<br />
See page 128 for more commission information and<br />
page 125 for footnotes.<br />
29, 40<br />
CREDIT QUALITY<br />
AAA: 63.36% AA: 25.30% A: 10.17%<br />
BBB: 1.17<br />
CLASS A (NAV)<br />
$20<br />
10<br />
0<br />
4/85 6/09<br />
MAXIMUM SALES CHARGE & COMMISSION<br />
CLASS A CLASS C73 ADVISOR89 Sales Charge<br />
4.25% 0.00% 0.00%<br />
<strong>Dealer</strong> Concession 4.00 1.00 0.00<br />
12b-1 Fee to <strong>Dealer</strong> 0.10 0.65 0.00<br />
DEALER USE ONLY/NOT FOR DISTRIBUTION TO THE PUBLIC Go to franklintempleton.com or call (800) 223-2141 <strong>Dealer</strong> <strong>Facts</strong> <strong>Guide</strong> 95<br />
OPEN-END FUNDS VALUE BLEND GROWTH SECTOR GLOBAL INTERNATIONAL HYBRID ASSET ALLOCATION FIXED INCOME TAX-FREE INCOME
OPEN-END FUNDS<br />
VALUE<br />
BLEND<br />
GROWTH<br />
SECTOR<br />
GLOBAL<br />
INTERNATIONAL<br />
HYBRID<br />
ASSET ALLOCATION<br />
FIXED INCOME<br />
TAX-FREE INCOME<br />
<strong>Franklin</strong> Minnesota Tax-Free Income Fund 91 6/30/09<br />
STATE FUND<br />
OVERALL MORNINGSTAR RATING TM<br />
CLASS A 8<br />
★★★★<br />
INVESTMENT CATEGORY<br />
Tax-Free Income19 PRIMARY INVESTMENT37 Insured Minnesota municipal securities.<br />
The following changes became effective<br />
February 17, 2009: Elimination of the nonfundamental<br />
policy requiring the fund to<br />
invest at least 80% of net assets in insured<br />
municipal securities; the removal of the word<br />
“Insured” from the fund name; and the fund will<br />
only buy municipal securities rated in the top<br />
four ratings by U.S. nationally recognized rating<br />
services (or comparable unrated securities).<br />
However, to the extent insured Minnesota<br />
municipal securities are available, the fund may<br />
continue to buy insured municipal securities.<br />
FUND REFERENCE<br />
CLASS A CLASS C<br />
Fund No. 120 220<br />
CUSIP 354 723 405 354 723 637<br />
Symbol FMINX FMNIX<br />
Inception1 4/3/85 5/1/95<br />
ADVISOR 89<br />
Fund No. 668<br />
CUSIP 354 723 181<br />
Symbol —<br />
Inception 1 4/3/85<br />
ANNUAL<br />
PROSPECTUS<br />
UPDATE<br />
AVAILABLE:<br />
July 1<br />
PORTFOLIO MANAGER/FUND TENURE 84<br />
Jim Conn, CFA, 1999<br />
Joined <strong>Franklin</strong> <strong>Templeton</strong> in 1996<br />
John Pomeroy, 1989<br />
Joined <strong>Franklin</strong> <strong>Templeton</strong> in 1986<br />
PERFORMANCE INFORMATION<br />
AVERAGE ANNUAL TOTAL RETURN – AVERAGE ANNUAL TOTAL RETURN–<br />
WITHOUT SALES CHARGES5 6, 10<br />
WITH SALES CHARGES<br />
1 YR 3 YR 5 YR 10 YR INCEPTION 1 YR 3 YR 5 YR 10 YR INCEPTION<br />
CLASS A 5.25 4.32 4.26 4.68 6.39 0.81 2.81 3.36 4.23 6.20<br />
CLASS C 4.72 3.78 3.71 4.12 4.37 3.72 3.78 3.71 4.12 4.37<br />
FUND FACTS<br />
Net Assets (millions)<br />
Expense Ratio2 Net Asset Value<br />
Public Offering Price<br />
FUND DISTRIBUTIONS<br />
Dividend Frequency<br />
Monthly on or near the 20 th .<br />
Distribution Rate15 Taxable Equivalent<br />
Distribution Rate16 4, 30, 45<br />
Dividend History<br />
6/09<br />
5/09<br />
4/09<br />
Capital Gains 4, 30 (last 12 mos)<br />
Short-Term<br />
Long-Term<br />
See page 128 for more commission information and<br />
page 125 for footnotes.<br />
CLASS A CLASS C<br />
$690.9 $118.4<br />
0.66% 1.21%<br />
$11.90 $12.00<br />
$12.43 $12.00<br />
CLASS A CLASS C<br />
3.83% 3.41%<br />
6.39 5.69<br />
$0.0397 $0.0341<br />
0.0408 0.0353<br />
0.0408 0.0353<br />
— —<br />
— —<br />
<strong>Franklin</strong> Missouri Tax-Free Income Fund<br />
PORTFOLIO HOLDINGS29 5/31<br />
Total Number of Positions<br />
Average Weighted Maturity<br />
Average Duration49 182<br />
15.9 years<br />
5.31 years<br />
AMT Exposure<br />
1.48%<br />
Average Credit Quality<br />
AA<br />
29, 40<br />
CREDIT QUALITY<br />
AAA: 51.30% AA: 30.73% A: 9.42%<br />
BBB: 0.41 Not rated: 8.14<br />
CLASS A (NAV)<br />
$20<br />
10<br />
0<br />
4/85 6/09<br />
MAXIMUM SALES CHARGE & COMMISSION<br />
CLASS A CLASS C73 ADVISOR89 Sales Charge<br />
4.25% 0.00% 0.00%<br />
<strong>Dealer</strong> Concession 4.00 1.00 0.00<br />
12b-1 Fee to <strong>Dealer</strong> 0.10 0.65 0.00<br />
6/30/09<br />
OVERALL MORNINGSTAR RATING<br />
163<br />
18.8 years<br />
6.77 years<br />
3.02%<br />
AA<br />
TM<br />
CLASS A8 ★★★★<br />
INVESTMENT CATEGORY<br />
Tax-Free Income19 PRIMARY INVESTMENT37 Investment grade Missouri<br />
municipal securities.<br />
FUND REFERENCE<br />
CLASS A<br />
Fund No. 160<br />
CLASS C<br />
260<br />
CUSIP<br />
Symbol<br />
Inception<br />
354 723 819<br />
FRMOX<br />
354 723 520<br />
FMOIX<br />
1 9/1/87<br />
ADVISOR<br />
5/1/95<br />
89<br />
Fund No. 679<br />
CUSIP 354 723 165<br />
Symbol —<br />
Inception1 9/1/87<br />
ANNUAL PROSPECTUS UPDATE AVAILABLE:<br />
July 1<br />
PORTFOLIO MANAGER/FUND TENURE84 STATE FUND<br />
FUND FACTS<br />
CLASS A CLASS C<br />
Net Assets (millions)<br />
Expense Ratio<br />
Carrie Higgins, 1992<br />
Joined <strong>Franklin</strong> <strong>Templeton</strong> in 1990<br />
Stella Wong, 1987<br />
Joined <strong>Franklin</strong> <strong>Templeton</strong> in 1986<br />
2<br />
Net Asset Value<br />
Public Offering Price<br />
FUND DISTRIBUTIONS<br />
Dividend Frequency<br />
Monthly on or near the 20th .<br />
CLASS A CLASS C<br />
Distribution Rate15 Taxable Equivalent<br />
Distribution Rate16 4, 30, 45<br />
Dividend History<br />
6/09<br />
5/09<br />
4/09<br />
Capital Gains 4, 30 PORTFOLIO HOLDINGS<br />
$746.9 $95.2<br />
0.65%<br />
$11.48<br />
$11.99<br />
1.20%<br />
$11.56<br />
$11.56<br />
4.26% 3.88%<br />
6.97 6.35<br />
$0.0426<br />
0.0431<br />
0.0431<br />
0.0374<br />
0.0379<br />
0.0379<br />
(last 12 mos)<br />
Short-Term<br />
—<br />
Long-Term<br />
—<br />
See page 128 for more commission information and<br />
page 125 for footnotes.<br />
—<br />
—<br />
29 5/31<br />
Total Number of Positions<br />
Average Weighted Maturity<br />
Average Duration49 AMT Exposure<br />
Average Credit Quality<br />
29, 40<br />
CREDIT QUALITY<br />
CLASS A (NAV)<br />
MAXIMUM SALES CHARGE & COMMISSION<br />
CLASS A CLASS C73 ADVISOR89 PERFORMANCE INFORMATION<br />
AVERAGE ANNUAL TOTAL RETURN –<br />
WITHOUT SALES CHARGES<br />
AVERAGE ANNUAL TOTAL RETURN–<br />
AAA: 40.00% AA:<br />
BBB: 7.91 BB:<br />
CC: 0.33 Not rated:<br />
31.80%<br />
0.49<br />
4.61<br />
A:<br />
B:<br />
14.43%<br />
0.43<br />
$20<br />
10<br />
0<br />
9/87 6/09<br />
Sales Charge<br />
4.25% 0.00% 0.00%<br />
<strong>Dealer</strong> Concession 4.00 1.00 0.00<br />
12b-1 Fee to <strong>Dealer</strong> 0.10 0.65 0.00<br />
5 1 YR 3 YR 5 YR<br />
CLASS A 1.75 2.87 3.72<br />
10 YR<br />
4.46<br />
INCEPTION<br />
6.12<br />
6, 10<br />
WITH SALES CHARGES<br />
1 YR 3 YR 5 YR 10 YR<br />
-2.54 1.40 2.82 4.01<br />
INCEPTION<br />
5.91<br />
CLASS C 1.18 2.32 3.14 3.90 4.47 0.21 2.32 3.14 3.90 4.47<br />
96 <strong>Dealer</strong> <strong>Facts</strong> <strong>Guide</strong> Go to franklintempleton.com or call (800) 223-2141 DEALER USE ONLY/NOT FOR DISTRIBUTION TO THE PUBLIC
<strong>Franklin</strong> New Jersey Tax-Free Income Fund<br />
STATE FUND<br />
OVERALL MORNINGSTAR RATING TM<br />
CLASS A 8<br />
★★★★<br />
INVESTMENT CATEGORY<br />
Tax-Free Income 19<br />
PRIMARY INVESTMENT 37<br />
Investment grade New Jersey<br />
municipal securities.<br />
FUND REFERENCE<br />
Fund No.<br />
CLASS A<br />
171<br />
CLASS C<br />
271<br />
CUSIP 354 723 751 354 723 561<br />
Symbol FRNJX FNIIX<br />
Inception1 5/12/88 5/1/95<br />
ADVISOR 89<br />
Fund No. 676<br />
CUSIP 354 723 231<br />
Symbol —<br />
Inception 1 5/12/88<br />
ANNUAL PROSPECTUS UPDATE AVAILABLE:<br />
July 1<br />
PORTFOLIO MANAGER/FUND TENURE 84<br />
Stella Wong, 1988<br />
Joined <strong>Franklin</strong> <strong>Templeton</strong> in 1986<br />
Carrie Higgins, 1992<br />
Joined <strong>Franklin</strong> <strong>Templeton</strong> in 1990<br />
INVESTMENT CATEGORY<br />
Tax-Free Income19 PRIMARY INVESTMENT37 Insured New York municipal<br />
securities.<br />
FUND REFERENCE<br />
CLASS A CLASS C<br />
Fund No. 181 281<br />
CUSIP 354 128 209 354 128 407<br />
Symbol FRNYX FNYKX<br />
Inception 1 5/1/91 5/1/95<br />
ANNUAL PROSPECTUS UPDATE AVAILABLE:<br />
February 1<br />
PORTFOLIO MANAGER/FUND TENURE 84<br />
Jim Conn, CFA, 1999<br />
Joined <strong>Franklin</strong> <strong>Templeton</strong> in 1996<br />
John Pomeroy, 1991<br />
Joined <strong>Franklin</strong> <strong>Templeton</strong> in 1986<br />
See page 128 for more commission information and<br />
page 125 for footnotes.<br />
<strong>Franklin</strong> New York Insured Tax-Free Income Fund<br />
STATE FUND<br />
FUND FACTS<br />
Net Assets (millions)<br />
Expense Ratio2 Net Asset Value<br />
Public Offering Price<br />
FUND DISTRIBUTIONS<br />
Dividend Frequency<br />
Monthly on or near the 20 th .<br />
Distribution Rate15 Taxable Equivalent<br />
Distribution Rate16 4, 30, 45<br />
Dividend History<br />
6/09<br />
5/09<br />
4/09<br />
Capital Gains 4, 30 (last 12 mos)<br />
Short-Term<br />
Long-Term<br />
See page 128 for more commission information and<br />
page 125 for footnotes.<br />
CLASS A CLASS C<br />
$440.0 $61.0<br />
0.66% 1.21%<br />
$10.59 $10.78<br />
$11.06 $10.78<br />
CLASS A CLASS C<br />
4.18% 3.76%<br />
7.19 6.46<br />
$0.0385 $0.0338<br />
0.0385 0.0338<br />
0.0385 0.0338<br />
— —<br />
— —<br />
6/30/09<br />
PORTFOLIO HOLDINGS29 5/31<br />
Total Number of Positions<br />
Average Weighted Maturity<br />
Average Duration49 FUND FACTS<br />
CLASS A CLASS C ADVISOR<br />
219<br />
Net Assets (millions)<br />
17.9 years<br />
Expense Ratio 8.05 years<br />
AMT Exposure<br />
3.17%<br />
Average Credit Quality<br />
AA<br />
2<br />
PERFORMANCE INFORMATION<br />
AVERAGE ANNUAL TOTAL RETURN – AVERAGE ANNUAL TOTAL RETURN–<br />
WITHOUT SALES CHARGES<br />
$1,111.8 $223.7 $0.8<br />
0.63% 1.18% 0.53%<br />
Net Asset Value<br />
$11.47 $11.57 $11.47<br />
Public Offering Price $11.98 $11.57 $11.47<br />
5 6, 10<br />
WITH SALES CHARGES<br />
1 YR 3 YR 5 YR 10 YR INCEPTION 1 YR 3 YR 5 YR 10 YR INCEPTION<br />
CLASS A<br />
CLASS C<br />
ADVISOR43 2.00 3.11 3.90 4.55 6.10 -2.33 1.62 3.00 4.09 5.89<br />
1.42 2.52 3.31 3.98 4.50 0.44 2.52 3.31 3.98 4.50<br />
2.09 3.15 3.92 4.56 6.11 2.09 3.15 3.92 4.56 6.11<br />
Advisor Class shares are only offered to certain eligible investors as stated in the prospectus.<br />
FUND DISTRIBUTIONS<br />
Dividend Frequency<br />
Monthly on or near the 20th .<br />
CLASS A CLASS C ADVISOR<br />
Distribution Rate15 Taxable Equivalent<br />
Distribution Rate16 4, 30, 45<br />
Dividend History<br />
6/09<br />
5/09<br />
4/09<br />
Capital Gains 4,30 4.21% 3.79% 4.50%<br />
7.12 6.41 7.61<br />
$0.0420 $0.0365 $0.0430<br />
0.0415 0.0364 0.0424<br />
(last 12mos)<br />
0.0415 0.0364 0.0424<br />
Short-Term<br />
— — —<br />
Long-Term<br />
— — —<br />
29, 40<br />
CREDIT QUALITY<br />
AAA: 43.85% AA: 25.85% A: 21.72%<br />
BBB: 7.28 BB: 0.51 B: 0.38<br />
Not rated: 0.41<br />
CLASS A (NAV)<br />
$20<br />
10<br />
0<br />
5/88 6/09<br />
MAXIMUM SALES CHARGE & COMMISSION<br />
CLASS A CLASS C73 ADVISOR89 Sales Charge<br />
4.25% 0.00% 0.00%<br />
<strong>Dealer</strong> Concession 4.00 1.00 0.00<br />
12b-1 Fee to <strong>Dealer</strong> 0.10 0.65 0.00<br />
6/30/09<br />
PERFORMANCE INFORMATION<br />
AVERAGE ANNUAL TOTAL RETURN – AVERAGE ANNUAL TOTAL RETURN–<br />
WITHOUT SALES CHARGES5, 13 6, 10, 13<br />
WITH SALES CHARGES<br />
1 YR 3 YR 5 YR 10 YR INCEPTION 1 YR 3 YR 5 YR 10 YR INCEPTION<br />
CLASS A 0.28 1.94 2.89 3.91 5.27 -3.98 0.49 2.01 3.46 5.02<br />
CLASS C -0.17 1.42 2.36 3.36 4.14 -1.13 1.42 2.36 3.36 4.14<br />
PORTFOLIO HOLDINGS29 5/31<br />
Total Number of Positions<br />
Average Weighted Maturity<br />
Average Duration49 AMT Exposure24 115<br />
21.3 years<br />
8.33 years<br />
0.00%<br />
Average Credit Quality<br />
AA<br />
29, 40<br />
CREDIT QUALITY<br />
AAA: 41.31% AA: 33.84% A: 19.50%<br />
BBB: 1.14 Not rated: 4.21<br />
CLASS A (NAV)<br />
$20<br />
10<br />
0<br />
5/91 6/09<br />
MAXIMUM SALES CHARGE & COMMISSION<br />
CLASS A CLASS C73 Sales Charge<br />
4.25% 0.00%<br />
<strong>Dealer</strong> Concession<br />
4.00 1.00<br />
12b-1 Fee to <strong>Dealer</strong><br />
0.10 0.65<br />
DEALER USE ONLY/NOT FOR DISTRIBUTION TO THE PUBLIC Go to franklintempleton.com or call (800) 223-2141 <strong>Dealer</strong> <strong>Facts</strong> <strong>Guide</strong> 97<br />
OPEN-END FUNDS VALUE BLEND GROWTH SECTOR GLOBAL INTERNATIONAL HYBRID ASSET ALLOCATION FIXED INCOME TAX-FREE INCOME
OPEN-END FUNDS<br />
VALUE<br />
BLEND<br />
GROWTH<br />
SECTOR<br />
GLOBAL<br />
INTERNATIONAL<br />
HYBRID<br />
ASSET ALLOCATION<br />
FIXED INCOME<br />
TAX-FREE INCOME<br />
<strong>Franklin</strong> New York Tax-Free Income Fund<br />
STATE FUND<br />
OVERALL MORNINGSTAR RATING TM<br />
CLASS A 8<br />
★★★★<br />
INVESTMENT CATEGORY<br />
Tax-Free Income 19<br />
PRIMARY INVESTMENT 37<br />
Investment grade New York<br />
municipal securities.<br />
FUND REFERENCE<br />
CLASS A CLASS C<br />
Fund No. 115 215<br />
CUSIP 354 130 106 354 130 205<br />
Symbol FNYTX FNYIX<br />
Inception 1 9/13/82 5/1/95<br />
ADVISOR 89<br />
Fund No. 615<br />
CUSIP 354 130 403<br />
Symbol FNYAX<br />
Inception 1 9/13/82<br />
ANNUAL PROSPECTUS UPDATE AVAILABLE:<br />
October 1<br />
PORTFOLIO MANAGER/FUND TENURE 84<br />
John Pomeroy, 1989<br />
Joined <strong>Franklin</strong> <strong>Templeton</strong> in 1986<br />
Jim Conn, CFA, 1999<br />
Joined <strong>Franklin</strong> <strong>Templeton</strong> in 1996<br />
OVERALL MORNINGSTAR RATING TM<br />
CLASS A 8<br />
★★★★<br />
INVESTMENT CATEGORY<br />
Tax-Free Income 19<br />
PRIMARY INVESTMENT 37<br />
Investment grade North Carolina<br />
municipal securities.<br />
FUND REFERENCE<br />
CLASS A CLASS C<br />
Fund No. 170 270<br />
CUSIP 354 723 793 354 723 538<br />
Symbol FXNCX FNCIX<br />
Inception1 9/1/87 5/1/95<br />
ADVISOR 89<br />
Fund No. 071<br />
CUSIP 354 723 173<br />
Symbol —<br />
Inception 1 9/1/87<br />
ANNUAL PROSPECTUS UPDATE AVAILABLE:<br />
July 1<br />
PORTFOLIO MANAGER/FUND TENURE 84<br />
Stella Wong, 1987<br />
Joined <strong>Franklin</strong> <strong>Templeton</strong> in 1986<br />
Carrie Higgins, 1992<br />
Joined <strong>Franklin</strong> <strong>Templeton</strong> in 1990<br />
6/30/09<br />
FUND FACTS<br />
CLASS A CLASS C ADVISOR<br />
Net Assets (millions)<br />
Expense Ratio2 PORTFOLIO HOLDINGS<br />
$4,843.8 $557.8 $104.4<br />
0.60% 1.16% 0.51%<br />
Net Asset Value<br />
$11.26 $11.25 $11.27<br />
Public Offering Price $11.76 $11.25 $11.27<br />
29 5/31<br />
Total Number of Positions<br />
Average Weighted Maturity<br />
Average Duration49 AMT Exposure24 PERFORMANCE INFORMATION<br />
AVERAGE ANNUAL TOTAL RETURN – AVERAGE ANNUAL TOTAL RETURN–<br />
WITHOUT SALES CHARGES<br />
Average Credit Quality<br />
5 6, 10<br />
WITH SALES CHARGES<br />
1 YR 3 YR 5 YR 10 YR INCEPTION 1 YR 3 YR 5 YR 10 YR INCEPTION<br />
CLASS A<br />
CLASS C<br />
ADVISOR43 3.07 3.62 4.02 4.61 7.18 -1.31 2.12 3.12 4.15 7.01<br />
2.50 3.05 3.45 4.02 4.61 1.52 3.05 3.45 4.02 4.61<br />
3.25 3.74 4.11 4.69 7.21 3.25 3.74 4.11 4.69 7.21<br />
Advisor Class shares are only offered to certain eligible investors as stated in the prospectus.<br />
462<br />
18.2 years<br />
6.56 years<br />
0.00%<br />
AA<br />
FUND DISTRIBUTIONS<br />
Dividend Frequency<br />
Monthly on or near the 3rd business day.<br />
CLASS A CLASS C ADVISOR<br />
Distribution Rate15 Taxable Equivalent<br />
Distribution Rate16 4, 30, 45<br />
Dividend History<br />
6/09<br />
5/09<br />
4/09<br />
Capital Gains 4,30 4.31% 3.96% 4.58%<br />
7.41 6.81 7.87<br />
$0.0422 $0.0371 $0.0430<br />
0.0422 0.0371 0.0430<br />
(last 12 mos)<br />
0.0422 0.0371 0.0430<br />
Short-Term<br />
— — —<br />
Long-Term<br />
0.0506 0.0506 0.0506<br />
See page 128 for more commission information and<br />
page 125 for footnotes.<br />
CREDIT QUALITY 40<br />
AAA: 47.16% AA: 38.86% A: 11.74%<br />
BBB: 1.65 BB: 0.06 Not rated: 0.53<br />
CLASS A (NAV)<br />
$20<br />
<strong>Franklin</strong> North Carolina Tax-Free Income Fund<br />
STATE FUND<br />
FUND FACTS<br />
Net Assets (millions)<br />
Expense Ratio2 Net Asset Value<br />
Public Offering Price<br />
FUND DISTRIBUTIONS<br />
Dividend Frequency<br />
Monthly on or near the 20 th .<br />
Distribution Rate15 Taxable Equivalent<br />
Distribution Rate16 4, 30, 45<br />
Dividend History<br />
6/09<br />
5/09<br />
4/09<br />
Capital Gains 4, 30 (last 12 mos)<br />
Short-Term<br />
Long-Term<br />
See page 128 for more commission information and<br />
page 125 for footnotes.<br />
CLASS A CLASS C<br />
$798.5 $169.5<br />
0.64% 1.19%<br />
$11.64 $11.78<br />
$12.16 $11.78<br />
CLASS A CLASS C<br />
4.16% 3.74%<br />
6.94 6.24<br />
$0.0422 $0.0367<br />
0.0419 0.0368<br />
0.0419 0.0368<br />
— —<br />
— —<br />
10<br />
0<br />
9/82 6/09<br />
MAXIMUM SALES CHARGE & COMMISSION<br />
CLASS A CLASS C73 ADVISOR89 Sales Charge<br />
4.25% 0.00% 0.00%<br />
<strong>Dealer</strong> Concession 4.00 1.00 0.00<br />
12b-1 Fee to <strong>Dealer</strong> 0.10 0.65 0.00<br />
6/30/09<br />
PERFORMANCE INFORMATION<br />
AVERAGE ANNUAL TOTAL RETURN – AVERAGE ANNUAL TOTAL RETURN–<br />
WITHOUT SALES CHARGES5 6, 10<br />
WITH SALES CHARGES<br />
1 YR 3 YR 5 YR 10 YR INCEPTION 1 YR 3 YR 5 YR 10 YR INCEPTION<br />
CLASS A 2.84 3.12 3.79 4.57 6.13 -1.57 1.65 2.89 4.12 5.92<br />
CLASS C 2.33 2.57 3.23 4.02 4.50 1.35 2.57 3.23 4.02 4.50<br />
PORTFOLIO HOLDINGS29 5/31<br />
Total Number of Positions<br />
Average Weighted Maturity<br />
Average Duration49 213<br />
19.9 years<br />
7.63 years<br />
AMT Exposure<br />
2.78%<br />
Average Credit Quality<br />
AA<br />
CREDIT QUALITY 40<br />
AAA: 36.48% AA: 39.38% A: 13.17%<br />
BBB: 9.71 BB: 0.15 Not rated: 1.11<br />
CLASS A (NAV)<br />
$20<br />
10<br />
0<br />
9/87 6/09<br />
MAXIMUM SALES CHARGE & COMMISSION<br />
CLASS A CLASS C73 ADVISOR89 Sales Charge<br />
4.25% 0.00% 0.00%<br />
<strong>Dealer</strong> Concession 4.00 1.00 0.00<br />
12b-1 Fee to <strong>Dealer</strong> 0.10 0.65 0.00<br />
98 <strong>Dealer</strong> <strong>Facts</strong> <strong>Guide</strong> Go to franklintempleton.com or call (800) 223-2141 DEALER USE ONLY/NOT FOR DISTRIBUTION TO THE PUBLIC
<strong>Franklin</strong> Ohio Tax-Free Income Fund 91 6/30/09<br />
STATE FUND<br />
OVERALL MORNINGSTAR RATING TM<br />
CLASS A 8<br />
★★★★<br />
INVESTMENT CATEGORY<br />
Tax-Free Income19 PRIMARY INVESTMENT37 Insured Ohio municipal securities.<br />
The following changes became effective<br />
February 17, 2009: Elimination of the nonfundamental<br />
policy requiring the fund to<br />
invest at least 80% of net assets in insured<br />
municipal securities; the removal of the word<br />
“Insured” from the fund name; and the fund will<br />
only buy municipal securities rated in the top<br />
four ratings by U.S. nationally recognized rating<br />
services (or comparable unrated securities).<br />
However, to the extent insured Ohio municipal<br />
securities are available, the fund may<br />
continue to buy insured municipal securities.<br />
FUND REFERENCE<br />
CLASS A CLASS C<br />
Fund No. 122 222<br />
CUSIP 354 723 504 354 723 629<br />
Symbol FTOIX FOITX<br />
Inception1 4/3/85 5/1/95<br />
ADVISOR 89<br />
Fund No. 633<br />
CUSIP 354 723 223<br />
Symbol —<br />
Inception 1 4/3/85<br />
PORTFOLIO MANAGER/FUND TENURE 84<br />
Jim Conn, CFA, 1999<br />
Joined <strong>Franklin</strong> <strong>Templeton</strong> in 1996<br />
John Pomeroy, 1989<br />
Joined <strong>Franklin</strong> <strong>Templeton</strong> in 1986<br />
<strong>Franklin</strong> Oregon Tax-Free Income Fund<br />
STATE FUND<br />
OVERALL MORNINGSTAR RATING TM<br />
CLASS A 8<br />
★★★★<br />
INVESTMENT CATEGORY<br />
Tax-Free Income 19<br />
PRIMARY INVESTMENT 37<br />
Investment grade Oregon<br />
municipal securities.<br />
FUND REFERENCE<br />
CLASS A CLASS C<br />
Fund No. 161 261<br />
CUSIP 354 723 785 354 723 660<br />
Symbol FRORX FORIX<br />
Inception1 9/1/87 5/1/95<br />
ADVISOR 89<br />
Fund No. 051<br />
CUSIP 354 724 502<br />
Symbol —<br />
Inception 1 9/1/87<br />
ANNUAL<br />
PROSPECTUS<br />
UPDATE<br />
AVAILABLE:<br />
July 1<br />
ANNUAL PROSPECTUS UPDATE AVAILABLE:<br />
July 1<br />
PORTFOLIO MANAGER/FUND TENURE 84<br />
Christopher Sperry, CFA, 2000<br />
Joined <strong>Franklin</strong> <strong>Templeton</strong> in 1996<br />
John Wiley, 1991<br />
Joined <strong>Franklin</strong> <strong>Templeton</strong> in 1989<br />
FUND FACTS<br />
CLASS A CLASS C ADVISOR<br />
Net Assets (millions)<br />
Expense Ratio2 PORTFOLIO HOLDINGS<br />
$1,197.9 $222.1 $0.4<br />
0.64% 1.19% 0.54%<br />
Net Asset Value<br />
$12.21 $12.32 $12.20<br />
Public Offering Price $12.75 $12.32 $12.20<br />
29 5/31<br />
Total Number of Positions<br />
Average Weighted Maturity<br />
Average Duration49 PERFORMANCE INFORMATION<br />
AVERAGE ANNUAL TOTAL RETURN – AVERAGE ANNUAL TOTAL RETURN–<br />
WITHOUT SALES CHARGES<br />
4.23 4.01 4.30 4.69 6.46 -0.18 2.51 3.40 4.24 6.27<br />
3.54 3.44 3.72 4.12 4.56 2.54 3.44 3.72 4.12 4.56<br />
4.25 4.02 4.30 4.70 6.46 4.25 4.02 4.30 4.70 6.46<br />
363<br />
15.7 years<br />
6.71 years<br />
AMT Exposure<br />
2.26%<br />
Average Credit Quality<br />
AA<br />
5 6, 10<br />
WITH SALES CHARGES<br />
1 YR 3 YR 5 YR 10 YR INCEPTION 1 YR 3 YR 5 YR 10 YR INCEPTION<br />
CLASS A<br />
CLASS C<br />
ADVISOR43 Advisor Class shares are only offered to certain eligible investors as stated in the prospectus.<br />
FUND DISTRIBUTIONS<br />
Dividend Frequency<br />
Monthly on or near the 20th .<br />
CLASS A CLASS C ADVISOR<br />
Distribution Rate15 Taxable Equivalent<br />
Distribution Rate16 4, 30, 45<br />
Dividend History<br />
6/09<br />
5/09<br />
4/09<br />
Capital Gains 4,30 4.05% 3.63% 4.33%<br />
6.62 5.94 7.10<br />
$0.0430 $0.0373 $0.0440<br />
0.0430 0.0375 0.0440<br />
(last 12 mos)<br />
0.0430 0.0375 0.0440<br />
Short-Term<br />
— — —<br />
Long-Term<br />
— — —<br />
See page 128 for more commission information and<br />
page 125 for footnotes.<br />
FUND DISTRIBUTIONS<br />
Dividend Frequency<br />
Monthly on or near the 20 th .<br />
Distribution Rate15 Taxable Equivalent<br />
Distribution Rate16 4, 30, 45<br />
Dividend History<br />
6/09<br />
5/09<br />
4/09<br />
Capital Gains 4, 30 (last 12 mos)<br />
Short-Term<br />
Long-Term<br />
CLASS A CLASS C<br />
4.23% 3.82%<br />
7.15 6.46<br />
$0.0418 $0.0366<br />
0.0418 0.0367<br />
0.0418 0.0367<br />
— —<br />
— —<br />
29, 40<br />
CREDIT QUALITY<br />
AAA: 62.21% AA: 24.84% A: 9.08%<br />
BBB: 1.97 Not rated: 1.90<br />
CLASS A (NAV)<br />
$20<br />
10<br />
0<br />
4/85 6/09<br />
MAXIMUM SALES CHARGE & COMMISSION<br />
CLASS A CLASS C73 ADVISOR89 Sales Charge<br />
4.25% 0.00% 0.00%<br />
<strong>Dealer</strong> Concession 4.00 1.00 0.00<br />
12b-1 Fee to <strong>Dealer</strong> 0.10 0.65 0.00<br />
6/30/09<br />
FUND FACTS<br />
CLASS A CLASS C<br />
Net Assets (millions)<br />
Expense Ratio2 PERFORMANCE INFORMATION<br />
AVERAGE ANNUAL TOTAL RETURN – AVERAGE ANNUAL TOTAL RETURN–<br />
WITHOUT SALES CHARGES<br />
$834.8 $142.8<br />
0.64% 1.19%<br />
Net Asset Value<br />
$11.37 $11.49<br />
Public Offering Price<br />
$11.87 $11.49<br />
5 6, 10<br />
WITH SALES CHARGES<br />
1 YR 3 YR 5 YR 10 YR INCEPTION 1 YR 3 YR 5 YR 10 YR INCEPTION<br />
CLASS A 2.89 3.57 4.10 4.58 5.87 -1.46 2.07 3.20 4.13 5.66<br />
CLASS C 2.30 2.99 3.51 4.01 4.43 1.31 2.99 3.51 4.01 4.43<br />
Advisor Class shares are only offered to certain eligible investors as stated in the prospectus.<br />
PORTFOLIO HOLDINGS29 5/31<br />
Total Number of Positions<br />
Average Weighted Maturity<br />
Average Duration49 207<br />
16.5 years<br />
6.54 years<br />
AMT Exposure<br />
4.74%<br />
Average Credit Quality<br />
AA<br />
See page 128 for more commission information and<br />
page 125 for footnotes.<br />
29, 40<br />
CREDIT QUALITY<br />
AAA: 38.24% AA: 34.00% A: 16.93%<br />
BBB: 8.71 BB: 0.18 B: 0.73<br />
Not rated: 1.21<br />
CLASS A (NAV)<br />
$20<br />
10<br />
0<br />
9/87 6/09<br />
MAXIMUM SALES CHARGE & COMMISSION<br />
CLASS A CLASS C73 ADVISOR89 Sales Charge<br />
4.25% 0.00% 0.00%<br />
<strong>Dealer</strong> Concession 4.00 1.00 0.00<br />
12b-1 Fee to <strong>Dealer</strong> 0.10 0.65 0.00<br />
DEALER USE ONLY/NOT FOR DISTRIBUTION TO THE PUBLIC Go to franklintempleton.com or call (800) 223-2141 <strong>Dealer</strong> <strong>Facts</strong> <strong>Guide</strong> 99<br />
OPEN-END FUNDS VALUE BLEND GROWTH SECTOR GLOBAL INTERNATIONAL HYBRID ASSET ALLOCATION FIXED INCOME TAX-FREE INCOME
OPEN-END FUNDS<br />
VALUE<br />
BLEND<br />
GROWTH<br />
SECTOR<br />
GLOBAL<br />
INTERNATIONAL<br />
HYBRID<br />
ASSET ALLOCATION<br />
FIXED INCOME<br />
TAX-FREE INCOME<br />
<strong>Franklin</strong> Pennsylvania Tax-Free Income Fund 44 6/30/09<br />
STATE FUND<br />
OVERALL MORNINGSTAR RATING TM<br />
CLASS A 8<br />
★★★★<br />
INVESTMENT CATEGORY<br />
Tax-Free Income 19<br />
PRIMARY INVESTMENT 37<br />
Investment grade Pennsylvania<br />
municipal securities.<br />
FUND REFERENCE<br />
Fund No.<br />
CLASS A<br />
129<br />
CLASS C<br />
229<br />
CUSIP 354 723 801 354 723 447<br />
Symbol FRPAX FRPTX<br />
Inception1 12/1/86 5/1/95<br />
ADVISOR 89<br />
Fund No. 677<br />
CUSIP 354 724 403<br />
Symbol —<br />
Inception 1 12/1/86<br />
ANNUAL PROSPECTUS UPDATE AVAILABLE:<br />
July 1<br />
PORTFOLIO MANAGER/FUND TENURE 84<br />
Stella Wong, 1986<br />
Joined <strong>Franklin</strong> <strong>Templeton</strong> in 1986<br />
Carrie Higgins, 2004<br />
Joined <strong>Franklin</strong> <strong>Templeton</strong> in 1990<br />
<strong>Franklin</strong> Tennessee Municipal Bond Fund<br />
STATE FUND<br />
OVERALL MORNINGSTAR RATING TM<br />
CLASS A 8<br />
★★★★<br />
INVESTMENT CATEGORY<br />
Tax-Free Income 19<br />
PRIMARY INVESTMENT 37<br />
Investment grade Tennessee<br />
municipal securities.<br />
FUND REFERENCE<br />
CLASS A<br />
Fund No. 420<br />
CUSIP 354 025 405<br />
Symbol FRTIX<br />
Inception 1 5/10/94<br />
ANNUAL PROSPECTUS UPDATE AVAILABLE:<br />
October 1<br />
PORTFOLIO MANAGER/FUND TENURE 84<br />
Francisco Rivera, 1996<br />
Joined <strong>Franklin</strong> <strong>Templeton</strong> in 1994<br />
John Wiley, 1994<br />
Joined <strong>Franklin</strong> <strong>Templeton</strong> in 1989<br />
PERFORMANCE INFORMATION<br />
AVERAGE ANNUAL TOTAL RETURN – AVERAGE ANNUAL TOTAL RETURN–<br />
WITHOUT SALES CHARGES5 6, 10<br />
WITH SALES CHARGES<br />
1 YR 3 YR 5 YR 10 YR INCEPTION 1 YR 3 YR 5 YR 10 YR INCEPTION<br />
CLASS A 2.36 3.15 3.78 4.40 5.75 -2.03 1.68 2.88 3.95 5.55<br />
CLASS C 1.88 2.59 3.22 3.84 4.39 0.90 2.59 3.22 3.84 4.39<br />
Advisor Class shares are only offered to certain eligible investors as stated in the prospectus.<br />
FUND FACTS<br />
Net Assets (millions)<br />
Expense Ratio2 Net Asset Value<br />
Public Offering Price<br />
FUND DISTRIBUTIONS<br />
Dividend Frequency<br />
Monthly on or near the 20 th .<br />
Distribution Rate15 Taxable Equivalent<br />
Distribution Rate16 4, 30, 45<br />
Dividend History<br />
6/09<br />
5/09<br />
4/09<br />
Capital Gains 4,30 (last 12 mos)<br />
Short-Term<br />
Long-Term<br />
See page 128 for more commission information and<br />
page 125 for footnotes.<br />
FUND FACTS<br />
Net Assets (millions)<br />
2, 9<br />
Expense Ratio<br />
without waiver<br />
with waiver<br />
Net Asset Value<br />
Public Offering Price<br />
FUND DISTRIBUTIONS<br />
Dividend Frequency<br />
Monthly on or near the 20 th .<br />
9, 15<br />
Distribution Rate<br />
Taxable Equivalent<br />
9, 16<br />
Distribution Rate<br />
4, 30, 45<br />
Dividend History<br />
6/09<br />
5/09<br />
4/09<br />
Capital Gains 4, 30 (last 12 mos)<br />
Short-Term<br />
Long-Term<br />
See page 128 for more commission information and<br />
page 125 for footnotes.<br />
CLASS A CLASS C<br />
$862.8 $155.5<br />
0.65% 1.20%<br />
$9.84 $9.93<br />
$10.28 $9.93<br />
CLASS A CLASS C<br />
4.34% 3.93%<br />
6.89 6.24<br />
$0.0372 $0.0325<br />
0.0368 0.0325<br />
0.0368 0.0325<br />
— —<br />
— —<br />
CLASS A<br />
$227.5<br />
0.75%<br />
0.70%<br />
$10.89<br />
$11.37<br />
CLASS A<br />
4.01%<br />
6.56<br />
$0.0380<br />
0.0380<br />
0.0380<br />
—<br />
—<br />
PORTFOLIO HOLDINGS29 5/31<br />
Total Number of Positions<br />
Average Weighted Maturity<br />
Average Duration49 218<br />
19.3 years<br />
8.02 years<br />
AMT Exposure<br />
2.98%<br />
Average Credit Quality<br />
AA<br />
29, 40<br />
CREDIT QUALITY<br />
AAA: 39.94% AA: 35.69% A: 10.36%<br />
BBB: 13.04 Not rated: 0.97<br />
CLASS A (NAV)<br />
$20<br />
10<br />
0<br />
12/86 6/09<br />
MAXIMUM SALES CHARGE & COMMISSION<br />
CLASS A CLASS C73 ADVISOR89 Sales Charge<br />
4.25% 0.00% 0.00%<br />
<strong>Dealer</strong> Concession 4.00 1.00 0.00<br />
12b-1 Fee to <strong>Dealer</strong> 0.10 0.65 0.00<br />
6/30/09<br />
PERFORMANCE INFORMATION<br />
AVERAGE ANNUAL TOTAL RETURN – AVERAGE ANNUAL TOTAL RETURN–<br />
WITHOUT SALES CHARGES5, 9 6, 9<br />
WITH SALES CHARGES<br />
1 YR 3 YR 5 YR 10 YR INCEPTION 1 YR 3 YR 5 YR 10 YR INCEPTION<br />
CLASS A 4.49 3.56 3.96 4.60 5.42 0.08 2.08 3.06 4.15 5.12<br />
PORTFOLIO HOLDINGS29 5/31<br />
Total Number of Positions<br />
Average Weighted Maturity<br />
Average Duration49 97<br />
17.3 years<br />
6.04 years<br />
AMT Exposure<br />
7.83%<br />
Average Credit Quality<br />
AA<br />
29, 40<br />
CREDIT QUALITY<br />
AAA: 33.21% AA: 46.24% A: 15.25%<br />
BBB: 4.13 Not rated: 1.17<br />
CLASS A (NAV)<br />
$20<br />
10<br />
0<br />
5/94 6/09<br />
MAXIMUM SALES CHARGE & COMMISSION<br />
CLASS A<br />
Sales Charge<br />
4.25%<br />
<strong>Dealer</strong> Concession<br />
4.00<br />
12b-1 Fee to <strong>Dealer</strong><br />
0.10<br />
100 <strong>Dealer</strong> <strong>Facts</strong> <strong>Guide</strong> Go to franklintempleton.com or call (800) 223-2141 DEALER USE ONLY/NOT FOR DISTRIBUTION TO THE PUBLIC
<strong>Franklin</strong> Virginia Tax-Free Income Fund<br />
STATE FUND<br />
OVERALL MORNINGSTAR RATING TM<br />
CLASS A 8<br />
★★★★<br />
INVESTMENT CATEGORY<br />
Tax-Free Income 19<br />
PRIMARY INVESTMENT 37<br />
Investment grade Virginia<br />
municipal securities.<br />
FUND REFERENCE<br />
Fund No.<br />
CLASS A<br />
163<br />
CLASS C<br />
263<br />
CUSIP 354 723 769 354 723 553<br />
Symbol FRVAX FVAIX<br />
Inception1 9/1/87 5/1/95<br />
ADVISOR 89<br />
Fund No. 084<br />
CUSIP 354 723 157<br />
Symbol —<br />
Inception 1 9/1/87<br />
ANNUAL PROSPECTUS UPDATE AVAILABLE:<br />
July 1<br />
PORTFOLIO MANAGER/FUND TENURE 84<br />
Stella Wong, 1987<br />
Joined <strong>Franklin</strong> <strong>Templeton</strong> in 1986<br />
Carrie Higgins, 1992<br />
Joined <strong>Franklin</strong> <strong>Templeton</strong> in 1990<br />
FUND FACTS<br />
Net Assets (millions)<br />
Expense Ratio2 Net Asset Value<br />
Public Offering Price<br />
FUND DISTRIBUTIONS<br />
Dividend Frequency<br />
Monthly on or near the 20 th .<br />
Distribution Rate15 Taxable Equivalent<br />
Distribution Rate16 4, 30, 45<br />
Dividend History<br />
6/09<br />
5/09<br />
4/09<br />
Capital Gains 4, 30 (last 12 mos)<br />
Short-Term<br />
Long-Term<br />
See page 128 for more commission information and<br />
page 125 for footnotes.<br />
CLASS A CLASS C<br />
$582.4 $84.4<br />
0.66% 1.21%<br />
$11.16 $11.29<br />
$11.66 $11.29<br />
CLASS A CLASS C<br />
4.17% 3.76%<br />
6.81 6.14<br />
$0.0405 $0.0354<br />
0.0405 0.0355<br />
0.0405 0.0355<br />
— —<br />
— —<br />
This section intentionally left blank.<br />
6/30/09<br />
PERFORMANCE INFORMATION<br />
AVERAGE ANNUAL TOTAL RETURN – AVERAGE ANNUAL TOTAL RETURN–<br />
WITHOUT SALES CHARGES5 6, 10<br />
WITH SALES CHARGES<br />
1 YR 3 YR 5 YR 10 YR INCEPTION 1 YR 3 YR 5 YR 10 YR INCEPTION<br />
CLASS A 2.13 2.99 3.77 4.37 6.06 -2.24 1.50 2.88 3.92 5.85<br />
CLASS C 1.64 2.43 3.22 3.81 4.34 0.66 2.43 3.22 3.81 4.34<br />
PORTFOLIO HOLDINGS29 5/31<br />
Total Number of Positions<br />
Average Weighted Maturity<br />
Average Duration49 138<br />
18.8 years<br />
6.85 years<br />
AMT Exposure<br />
5.41%<br />
Average Credit Quality<br />
AA<br />
29, 40<br />
CREDIT QUALITY<br />
AAA: 39.57% AA: 37.59% A: 14.65%<br />
BBB: 7.21 B: 0.83 Not rated: 0.15<br />
CLASS A (NAV)<br />
$20<br />
10<br />
0<br />
9/87 6/09<br />
MAXIMUM SALES CHARGE & COMMISSION<br />
CLASS A CLASS C73 ADVISOR89 Sales Charge<br />
4.25% 0.00% 0.00%<br />
<strong>Dealer</strong> Concession 4.00 1.00 0.00<br />
12b-1 Fee to <strong>Dealer</strong> 0.10 0.65 0.00<br />
DEALER USE ONLY/NOT FOR DISTRIBUTION TO THE PUBLIC Go to franklintempleton.com or call (800) 223-2141 <strong>Dealer</strong> <strong>Facts</strong> <strong>Guide</strong> 101<br />
OPEN-END FUNDS VALUE BLEND GROWTH SECTOR GLOBAL INTERNATIONAL HYBRID ASSET ALLOCATION FIXED INCOME TAX-FREE INCOME
OPEN-END FUNDS<br />
VALUE<br />
BLEND<br />
GROWTH<br />
SECTOR<br />
GLOBAL<br />
INTERNATIONAL<br />
HYBRID<br />
ASSET ALLOCATION<br />
FIXED INCOME<br />
TAX-FREE INCOME<br />
<strong>Franklin</strong> California Tax-Exempt Money Fund<br />
INVESTMENT CATEGORY<br />
Tax-Free Income 19<br />
PRIMARY INVESTMENT 37<br />
Tax-Free municipal securities,<br />
including bonds, notes and<br />
commercial paper.<br />
FUND REFERENCE<br />
Fund No. 125<br />
CUSIP 352 519 201<br />
Symbol FCLXX<br />
Inception 1 9/3/85<br />
ANNUAL PROSPECTUS UPDATE AVAILABLE:<br />
October 31<br />
PORTFOLIO MANAGER/<br />
COMPANY TENURE/ FUND TENURE 84<br />
Carrie Higgins, 1990, 1992<br />
Jim Conn, CFA, 1999, 1999<br />
<strong>Franklin</strong> New York Tax-Exempt Money Fund<br />
INVESTMENT CATEGORY<br />
Tax-Free Income19 PRIMARY INVESTMENT37 Tax-Free municipal securities,<br />
including bonds, notes and<br />
commercial paper.<br />
CLOSED. <strong>Franklin</strong> New York Tax- Exempt<br />
Money Fund closed to new investors on<br />
4/30/09. Pending shareholder approval, it<br />
is anticipated that the fund will merge into<br />
<strong>Franklin</strong> Tax- Exempt Money Fund during the<br />
third quarter of 2009.<br />
FUND REFERENCE<br />
Fund No. 131<br />
CUSIP 354 128 100<br />
Symbol FRNXX<br />
Inception 1 10/10/86<br />
PORTFOLIO MANAGER/<br />
COMPANY TENURE/ FUND TENURE 84<br />
Carrie Higgins, 1990, 1992<br />
Jim Conn, CFA, 1999, 1999<br />
INVESTMENT CATEGORY<br />
Tax-Free Income86 PRIMARY INVESTMENT37 High-quality, short-term municipal<br />
securities. May invest up to 20%<br />
of its assets in securities that pay<br />
taxable income.<br />
FUND REFERENCE<br />
Fund No. 114<br />
CUSIP 354 719 106<br />
Symbol FTMXX<br />
Inception 1 2/18/82<br />
ANNUAL<br />
PROSPECTUS<br />
UPDATE<br />
AVAILABLE:<br />
February 1<br />
ANNUAL PROSPECTUS UPDATE AVAILABLE:<br />
December 1<br />
PORTFOLIO MANAGER/<br />
COMPANY TENURE/ FUND TENURE 84<br />
Carrie Higgins, 1990, 1992<br />
Jim Conn, CFA, 1999, 1999<br />
PERFORMANCE INFORMATION<br />
CUMULATIVE TOTAL RETURN 5 AVERAGE ANNUAL TOTAL RETURN 6<br />
FUND FACTS<br />
Net Assets (millions)<br />
Expense Ratio 2<br />
Net Asset Value 26<br />
YIELD INFORMATION 50<br />
7-Day Yield<br />
7-Day Effective Yield<br />
Taxable Equivalent Yield16 See page 128 for more commission information and<br />
page 125 for footnotes.<br />
FUND FACTS<br />
Net Assets (millions)<br />
2, 9<br />
Expense Ratio<br />
without waiver<br />
with waiver<br />
Net Asset Value 26<br />
YIELD INFORMATION 50<br />
7-Day Yield9 7-Day Effective Yield9 9, 16<br />
Taxable Equivalent Yield<br />
See page 128 for more commission information and<br />
page 125 for footnotes.<br />
<strong>Franklin</strong> Tax-Exempt Money Fund<br />
FUND FACTS<br />
Net Assets (millions)<br />
Expense Ratio 2<br />
Net Asset Value 26<br />
YIELD INFORMATION 50<br />
7-Day Yield<br />
7-Day Effective Yield<br />
Taxable Equivalent Yield 16<br />
See page 128 for more commission information and<br />
page 125 for footnotes.<br />
$572.2<br />
0.54%<br />
$1.00<br />
0.00%<br />
0.00<br />
0.00<br />
$65.4<br />
0.81%<br />
0.66%<br />
$1.00<br />
0.00%<br />
0.00<br />
0.00<br />
$159.9<br />
0.79%<br />
$1.00<br />
0.00%<br />
0.00<br />
0.00<br />
PORTFOLIO HOLDINGS 29 5/31<br />
Total Number of Positions<br />
Average Weighted Maturity<br />
Average Credit Quality<br />
6/30/09<br />
YTD 1 YR 3 YR 5 YR 10 YR INCEPTION 1 YR 3 YR 5 YR 10 YR INCEPTION<br />
0.01 0.57 6.08 9.86 18.56 92.67 0.57 1.99 1.90 1.72 2.79<br />
CREDIT QUALITY 40<br />
AAA: 100.00%<br />
TOP 5 HOLDINGS<br />
Bay Area Toll Authority CA Toll Bridge Revenue 7.16%<br />
Los Angeles CA Department of Water &<br />
Power Revenue 4.77<br />
California State Economic Recovery 4.74<br />
Metropolitan Water District Southern CA<br />
Waterworks Revenue 4.00<br />
Southern CA Public Power Authority Power<br />
Project Revenue 3.99<br />
PERFORMANCE INFORMATION<br />
CUMULATIVE TOTAL RETURN 5, 9 6, 9<br />
AVERAGE ANNUAL TOTAL RETURN<br />
6/30/09<br />
YTD 1 YR 3 YR 5 YR 10 YR INCEPTION 1 YR 3 YR 5 YR 10 YR INCEPTION<br />
0.01 0.58 6.03 9.68 19.00 81.71 0.58 1.97 1.87 1.75 2.66<br />
PORTFOLIO HOLDINGS29 5/31<br />
Total Number of Positions<br />
28<br />
Average Weighted Maturity<br />
9 days<br />
Average Credit Quality<br />
AAA<br />
CREDIT QUALITY 40<br />
AAA: 100.00%<br />
TOP 5 HOLDINGS<br />
Columbia University 3.67%<br />
Ithaca City New York 2.06<br />
New York NY City Transitional Financial<br />
Authority Revenue 1.58<br />
New York City Municipal Water Finance Authority 1.47<br />
PERFORMANCE INFORMATION<br />
CUMULATIVE TOTAL RETURN 5 6, 13<br />
AVERAGE ANNUAL TOTAL RETURN<br />
88<br />
5 days<br />
AAA<br />
6/30/09<br />
YTD 1 YR 3 YR 5 YR 10 YR INCEPTION 1 YR 3 YR 5 YR 10 YR INCEPTION<br />
0.01 0.51 5.75 9.22 18.19 135.43 0.51 1.88 1.78 1.69 3.18<br />
PORTFOLIO HOLDINGS29 5/31<br />
Total Number of Positions<br />
64<br />
Average Weighted Maturity<br />
9 days<br />
Average Credit Quality<br />
AAA<br />
CREDIT QUALITY 40<br />
AAA: 100.00%<br />
TOP 5 HOLDINGS<br />
Connecticut State Health & Educational Facilities<br />
Authority Revenue-Yale University 4.14%<br />
Oregon State Government Obligation 3.88<br />
North Carolina State 3.02<br />
Texas State Tax & Revenue Anticipation Notes 3.02<br />
Sisters Mercy Health 3.00<br />
102 <strong>Dealer</strong> <strong>Facts</strong> <strong>Guide</strong> Go to franklintempleton.com or call (800) 223-2141 DEALER USE ONLY/NOT FOR DISTRIBUTION TO THE PUBLIC
<strong>Franklin</strong> <strong>Templeton</strong> Variable Insurance Funds<br />
<strong>Franklin</strong> <strong>Templeton</strong> Investments currently offers 22 separate funds to insurance companies as investment choices in their variable annuity<br />
or variable life insurance contracts. The funds, which offer a wide variety of investment styles, may be available in multiple share classes:<br />
Class 1, Class 2, Class 3 and Class 4. Please see the contract prospectus for the most current information on which funds and classes<br />
are available in that variable product.<br />
FUND INFORMATION<br />
Please refer to the fund profile pages for summary information on each fund in the <strong>Franklin</strong> <strong>Templeton</strong> Variable Insurance Funds.<br />
VALUE<br />
<strong>Franklin</strong> Large Cap Value Securities Fund . . . . . . . . . . 103<br />
<strong>Franklin</strong> Small Cap Value Securities Fund . . . . . . . . . . 104<br />
Mutual Shares Securities Fund . . . . . . . . . . . . . . . . . . 104<br />
BLEND<br />
<strong>Franklin</strong> Rising Dividends Securities Fund . . . . . . . . . . 105<br />
GROWTH<br />
<strong>Franklin</strong> Flex Cap Growth Securities Fund . . . . . . . . . . 105<br />
<strong>Franklin</strong> Large Cap Growth Securities Fund . . . . . . . . . 106<br />
<strong>Franklin</strong> Small-Mid Cap Growth Securities Fund . . . . . 106<br />
SECTOR<br />
<strong>Franklin</strong> Global Real Estate Securities Fund . . . . . . . . . 107<br />
GLOBAL<br />
Mutual Global Discovery Securities Fund . . . . . . . . . . . 107<br />
<strong>Templeton</strong> Global Asset Allocation Fund . . . . . . . . . . . . 108<br />
<strong>Templeton</strong> Growth Securities Fund . . . . . . . . . . . . . . . 108<br />
<strong>Franklin</strong> Large Cap Value Securities Fund<br />
INVESTMENT CATEGORY<br />
Value<br />
MAIN INVESTMENTS37 Seeks long- term capital appreciation.<br />
The fund normally invests at least<br />
80% of its net assets in investments<br />
of large capitalization companies and<br />
normally invests predominantly in<br />
equity securities, focusing on those the<br />
manager believes to be undervalued.<br />
FUND REFERENCE<br />
CLASS 2 CLASS 4<br />
Fund No. 728 710<br />
CUSIP 355 150 251 355 150 186<br />
Inception1 3/1/05 2/28/08<br />
ANNUAL PROSPECTUS UPDATE AVAILABLE:<br />
May 1<br />
PORTFOLIO MANAGER/FUND TENURE 84<br />
William J. Lippman, 2005<br />
Joined <strong>Franklin</strong> <strong>Templeton</strong> in 1988<br />
Bruce C. Baughman, CPA, 2005<br />
Joined <strong>Franklin</strong> <strong>Templeton</strong> in 1988<br />
Margaret McGee, 2005<br />
Joined <strong>Franklin</strong> <strong>Templeton</strong> in 1988<br />
Donald G. Taylor, CPA, 2005<br />
Joined <strong>Franklin</strong> <strong>Templeton</strong> in 1996<br />
Please see page 103 for general information<br />
and page 125 for important footnotes.<br />
NEW<br />
CLASS 2 CLASS 4<br />
$10,000 Hypothetical<br />
Investment from Inception 53<br />
FUND FACTS<br />
CLASS 2 CLASS 4<br />
Net Assets (millions)<br />
Expense Ratio54,56 without waiver<br />
with waiver<br />
*Less than $100,000<br />
PORTFOLIO HOLDINGS29 $8,013 $8,006<br />
$33.2 $0.0*<br />
1.40% 1.50%<br />
0.93% 1.03%<br />
6/30<br />
Total Number of Positions 56<br />
PORTFOLIO BREAKDOWN<br />
Capital Goods 13.46%<br />
Materials 11.11<br />
Energy 10.69<br />
Insurance<br />
Pharmaceuticals, Biotechnology &<br />
8.39<br />
Life Sciences 7.43<br />
Consumer Durables & Apparel 6.82<br />
Technology Hardware & Equipment 6.64<br />
Retailing 6.16<br />
Diversified Financials 5.59<br />
Household & Personal Products 4.91<br />
INTERNATIONAL<br />
Mutual International Securities Fund . . . . . . . . . . . . . . 109<br />
<strong>Templeton</strong> Developing Markets Securities Fund . . . . . . 109<br />
<strong>Templeton</strong> Foreign Securities Fund . . . . . . . . . . . . . . . 110<br />
HYBRID<br />
<strong>Franklin</strong> Growth and Income Securities Fund . . . . . . . . 110<br />
<strong>Franklin</strong> Income Securities Fund . . . . . . . . . . . . . . . . . 111<br />
ASSET ALLOCATION<br />
<strong>Franklin</strong> <strong>Templeton</strong> VIP Founding Funds<br />
Allocation Fund . . . . . . . . . . . . . . . . . . . . . . . . . . . . 111<br />
FIXED INCOME<br />
<strong>Franklin</strong> High Income Securities Fund . . . . . . . . . . . . . 112<br />
<strong>Franklin</strong> Strategic Income Securities Fund . . . . . . . . . . 112<br />
<strong>Franklin</strong> U.S. Government Fund . . . . . . . . . . . . . . . . . 113<br />
<strong>Franklin</strong> Zero Coupon Fund–2010 . . . . . . . . . . . . . . . . 113<br />
<strong>Templeton</strong> Global Bond Securities Fund . . . . . . . . . . . . 114<br />
6/30/09<br />
ASSET ALLOCATION 29, 60 6/30<br />
Stocks 95%<br />
Cash 5%<br />
6/30/09<br />
FUND-ONLY PERFORMANCE INFORMATION<br />
CUMULATIVE TOTAL RETURN– AVERAGE ANNUAL TOTAL RETURN–<br />
NO CONTRACT EXPENSES OR CHARGES53, 56, 66 53, 56, 66<br />
NO CONTRACT EXPENSES OR CHARGES<br />
YTD14 1 YR 3 YR 5 YR 10 YR INCEPTION 1 YR 3 YR 5 YR 10 YR INCEPTION<br />
CLASS 2 2.25 -26.85 -25.11 — — -19.87 -26.85 -9.19 — — -4.98<br />
CLASS 4 2.29 -26.92 -25.18 — — -19.94 -26.92 -9.22 — — -5.00<br />
TOP 10 HOLDINGS7 Nucor Corp. 4.34%<br />
IBM Corp. 4.08<br />
Microsoft Corp. 3.22<br />
D.R. Horton Inc. 3.10<br />
Praxair Inc. 2.99<br />
State Street Corp. 2.98<br />
Exxon Mobil Corp. 2.84<br />
Merck & Company Inc. 2.69<br />
Aflac Inc. 2.67<br />
Kimberly-Clark Corp. 2.60<br />
DEALER USE ONLY/NOT FOR DISTRIBUTION TO THE PUBLIC Go to franklintempleton.com or call (800) 223-2141 <strong>Dealer</strong> <strong>Facts</strong> <strong>Guide</strong> 103<br />
VARIABLE INSURANCE FUNDS
VARIABLE INSURANCE FUNDS<br />
<strong>Franklin</strong> Small Cap Value Securities Fund 83 6/30/09<br />
INVESTMENT CATEGORY<br />
Value<br />
MAIN INVESTMENTS 37<br />
Seeks long-term total return. The fund<br />
normally invests at least 80% of its net<br />
assets in investments of small capitalization<br />
companies and normally invests<br />
predominantly in equity securities.<br />
FUND REFERENCE<br />
CLASS 1 CLASS 2<br />
Fund No. 775 776<br />
CUSIP 355 150 673 355 150 590<br />
Inception 1 5/1/98 1/6/99<br />
CLASS 4<br />
Fund No. 732<br />
CUSIP 355 150 210<br />
Inception 1 2/28/08<br />
ANNUAL PROSPECTUS UPDATE AVAILABLE:<br />
May 1<br />
PORTFOLIO MANAGER/FUND TENURE<br />
Please see page 103 for general information<br />
and page 125 for important footnotes.<br />
84<br />
William J. Lippman, 1998<br />
Joined <strong>Franklin</strong> <strong>Templeton</strong> in 1988<br />
Y. Dogan Sahin, CFA, 2007<br />
Joined <strong>Franklin</strong> <strong>Templeton</strong> in 2001<br />
Bruce C. Baughman, CPA, 1998<br />
Joined <strong>Franklin</strong> <strong>Templeton</strong> in 1988<br />
Margaret McGee, 1998<br />
Joined <strong>Franklin</strong> <strong>Templeton</strong> in 1988<br />
Donald G. Taylor, CPA, 1998<br />
Joined <strong>Franklin</strong> <strong>Templeton</strong> in 1996<br />
INVESTMENT CATEGORY<br />
Value<br />
MAIN INVESTMENTS37 Seeks capital appreciation, with<br />
income as a secondary goal. The<br />
fund normally invests primarily in<br />
U.S. and foreign equity securities that<br />
the manager believes are undervalued.<br />
The fund also invests, to a lesser<br />
extent, in risk arbitrage securities<br />
and distressed companies.<br />
FUND REFERENCE<br />
CLASS 1 CLASS 2<br />
Fund No. 743 744<br />
CUSIP 355 150 715 355 150 558<br />
Inception1 11/8/96 1/6/99<br />
CLASS 4<br />
Fund No. 737<br />
CUSIP 355 151 606<br />
Inception 1 2/28/08<br />
ANNUAL PROSPECTUS UPDATE AVAILABLE:<br />
May 1<br />
PORTFOLIO MANAGER/FUND TENURE 84<br />
Peter Langerman, 2005<br />
Tenure at Mutual Series:<br />
1986-2002, 2005<br />
F. David Segal, CFA, 2005<br />
Joined Mutual Series in 2002<br />
Deborah A. Turner, CFA, 2001<br />
Joined Mutual Series in 1996<br />
Please see page 103 for general information<br />
and page 125 for important footnotes.<br />
FUND-ONLY PERFORMANCE INFORMATION<br />
CUMULATIVE TOTAL RETURN– AVERAGE ANNUAL TOTAL RETURN–<br />
NO CONTRACT EXPENSES OR CHARGES 53, 66 53, 66<br />
NO CONTRACT EXPENSES OR CHARGES<br />
YTD14 1 YR 3 YR 5 YR 10 YR INCEPTION 1 YR 3 YR 5 YR 10 YR INCEPTION<br />
CLASS 1 4.33 -27.82 -27.54 -0.43 71.73 48.37 -27.82 -10.18 -0.09 5.56 3.60<br />
CLASS 2 4.18 -27.98 -28.09 -1.71 67.42 44.48 -27.98 -10.41 -0.34 5.29 3.35<br />
CLASS 4 4.17 -28.04 -27.85 -0.86 70.99 47.74 -28.04 -10.31 -0.17 5.51 3.56<br />
CLASS 1 CLASS 2 CLASS 4<br />
$10,000 Hypothetical<br />
Investment from Inception 53<br />
FUND FACTS<br />
CLASS 1 CLASS 2 CLASS 4<br />
Net Assets (millions)<br />
Expense Ratio54 $14,837 $14,448 $14,774<br />
$33.5 $800.0 $20.5<br />
0.69% 0.94% 1.04%<br />
PORTFOLIO HOLDINGS 29 6/30<br />
Total Number of Positions 114<br />
Mutual Shares Securities Fund<br />
PORTFOLIO BREAKDOWN<br />
Capital Goods 22.18%<br />
Materials 12.29<br />
Insurance 11.25<br />
Energy 9.83<br />
Retailing 8.98<br />
Consumer Durables & Apparel 6.64<br />
Automobiles & Components 4.19<br />
Utilities<br />
Pharmaceuticals, Biotechnology &<br />
3.44<br />
Life Sciences 2.77<br />
Health Care Equipment & Services 2.68<br />
$10,000 Hypothetical<br />
Investment from Inception 53<br />
FUND FACTS<br />
Net Assets (millions)<br />
Expense Ratio54 CLASS 1 CLASS 2 CLASS 4<br />
$19,056 $18,625 $18,967<br />
CLASS 1 CLASS 2 CLASS 4<br />
$441.6 $3,372.9 $94.8<br />
0.73% 0.98% 1.08%<br />
PORTFOLIO HOLDINGS 29 6/30<br />
Total Number of Positions 236<br />
PORTFOLIO BREAKDOWN<br />
Food, Beverage & Tobacco 19.66%<br />
Capital Goods 6.48<br />
Energy 6.28<br />
Insurance 5.76<br />
Materials 5.50<br />
Food & Staples Retailing 5.41<br />
Media<br />
Pharmaceuticals, Biotechnology &<br />
5.09<br />
Life Sciences 4.79<br />
Utilities 4.26<br />
Technology Hardware & Equipment 3.38<br />
ASSET ALLOCATION 29, 60 6/30<br />
Stocks 97%<br />
Cash 3%<br />
TOP 10 HOLDINGS 7<br />
Universal Forest Products Inc. 2.05%<br />
Reliance Steel & Aluminum Co. 2.02<br />
Westlake Chemical Corp. 1.99<br />
Steel Dynamics Inc. 1.85<br />
Old Republic International Corp. 1.80<br />
Benchmark Electronics Inc. 1.80<br />
NV Energy Inc. 1.74<br />
Rowan Companies Inc. 1.61<br />
IPC Holdings Ltd. 1.61<br />
Thor Industries Inc. 1.54<br />
6/30/09<br />
FUND-ONLY PERFORMANCE INFORMATION<br />
CUMULATIVE TOTAL RETURN– AVERAGE ANNUAL TOTAL RETURN–<br />
NO CONTRACT EXPENSES OR CHARGES 13, 53 13, 53<br />
NO CONTRACT EXPENSES OR CHARGES<br />
YTD14 1 YR 3 YR 5 YR 10 YR INCEPTION 1 YR 3 YR 5 YR 10 YR INCEPTION<br />
CLASS 1 4.87 -23.05 -23.07 -1.32 36.40 90.56 -23.05 -8.37 -0.27 3.15 5.23<br />
CLASS 2 4.75 -23.25 -23.66 -2.52 33.51 86.25 -23.25 -8.61 -0.51 2.93 5.04<br />
CLASS 4 4.71 -23.32 -23.43 -1.78 35.76 89.67 -23.32 -8.51 -0.36 3.10 5.19<br />
ASSET ALLOCATION 29, 60 6/30<br />
Stocks 83%<br />
Bonds 5%<br />
Cash 12%<br />
TOP 10 HOLDINGS 7<br />
Wyeth 3.20%<br />
British American Tobacco PLC 3.05<br />
Microsoft Corp. 2.32<br />
Berkshire Hathaway Inc. 2.25<br />
CVS Caremark Corp. 2.22<br />
Schering-Plough Corp. 2.18<br />
Comcast Corp. 2.16<br />
Imperial Tobacco Group PLC 2.09<br />
Nestle SA 1.80<br />
Mattel Inc. 1.50<br />
104 <strong>Dealer</strong> <strong>Facts</strong> <strong>Guide</strong> Go to franklintempleton.com or call (800) 223-2141 DEALER USE ONLY/NOT FOR DISTRIBUTION TO THE PUBLIC
<strong>Franklin</strong> Rising Dividends Securities Fund<br />
INVESTMENT CATEGORY<br />
Blend<br />
MAIN INVESTMENTS37 Seeks long- term capital appreciation,<br />
with preservation of capital as an<br />
important consideration. The fund<br />
normally invests at least 80% of its<br />
net assets in investments of companies<br />
that have paid rising dividends, and<br />
normally invests predominantly in<br />
equity securities.<br />
FUND REFERENCE<br />
CLASS 1 CLASS 2<br />
Fund No. 773 774<br />
CUSIP 355 150 814 355 150 467<br />
Inception 1 1/27/92 1/6/99<br />
CLASS 4<br />
Fund No. 731<br />
CUSIP 355 150 194<br />
Inception 1 2/28/08<br />
ANNUAL PROSPECTUS UPDATE AVAILABLE:<br />
May 1<br />
PORTFOLIO MANAGER/FUND TENURE 84<br />
Donald G. Taylor, CPA, 1996<br />
Joined <strong>Franklin</strong> <strong>Templeton</strong> in 1996<br />
Bruce C. Baughman, CPA, 1992<br />
Joined <strong>Franklin</strong> <strong>Templeton</strong> in 1988<br />
William J. Lippman, 1992<br />
Joined <strong>Franklin</strong> <strong>Templeton</strong> in 1988<br />
Margaret McGee, 1992<br />
Joined <strong>Franklin</strong> <strong>Templeton</strong> in 1988<br />
Please see page 103 for general information<br />
and page 125 for important footnotes.<br />
INVESTMENT CATEGORY<br />
Growth<br />
MAIN INVESTMENTS37 Seeks capital appreciation. The<br />
fund normally invests predominantly<br />
in equity securities of companies<br />
across the entire market<br />
capitalization spec trum that the<br />
manager believes have the potential<br />
for capital appreciation.<br />
FUND REFERENCE<br />
CLASS 2 CLASS 4<br />
Fund No. 729 702<br />
CUSIP 355 150 269 355 150 111<br />
Inception 1 3/1/05 2/28/08<br />
ANNUAL PROSPECTUS UPDATE AVAILABLE:<br />
May 1<br />
PORTFOLIO MANAGER/FUND TENURE 84<br />
Conrad B. Herrmann, CFA, 2005<br />
Joined <strong>Franklin</strong> <strong>Templeton</strong> in 1989<br />
Matthew Moberg, CPA, 2005<br />
Joined <strong>Franklin</strong> <strong>Templeton</strong> in 1998<br />
Raymond Chan, CFA, 2005<br />
Joined <strong>Franklin</strong> <strong>Templeton</strong> in 1996<br />
Please see page 103 for general information<br />
and page 125 for important footnotes.<br />
$10,000 Hypothetical<br />
Investment from Inception 53<br />
FUND FACTS<br />
Net Assets (millions)<br />
Expense Ratio54 *Less than $100,000<br />
CLASS 1 CLASS 2 CLASS 4<br />
$34,320 $33,377 $34,147<br />
CLASS 1 CLASS 2 CLASS 4<br />
$127.8 $1,214.3 $0.0*<br />
0.63% 0.88% 0.98%<br />
PORTFOLIO HOLDINGS 29 6/30<br />
Total Number of Positions 44<br />
PORTFOLIO BREAKDOWN<br />
Capital Goods 23.20%<br />
Insurance 12.58<br />
Health Care Equipment & Services 12.03<br />
Materials 12.00<br />
Household & Personal Products 6.80<br />
Pharmaceuticals, Biotechnology & Life Sciences 5.42<br />
Food & Staples Retailing 5.00<br />
Retailing 4.58<br />
Food, Beverage & Tobacco 3.99<br />
Commercial & Professional Services 2.66<br />
6/30/09<br />
FUND-ONLY PERFORMANCE INFORMATION<br />
CUMULATIVE TOTAL RETURN– AVERAGE ANNUAL TOTAL RETURN–<br />
NO CONTRACT EXPENSES OR CHARGES53, 66 53, 66<br />
NO CONTRACT EXPENSES OR CHARGES<br />
YTD14 1 YR 3 YR 5 YR 10 YR INCEPTION 1 YR 3 YR 5 YR 10 YR INCEPTION<br />
CLASS 1 -0.56 -19.99 -20.89 -8.26 43.28 243.20 -19.99 -7.51 -1.71 3.66 7.33<br />
CLASS 2 -0.71 -20.19 -21.46 -9.45 39.57 233.77 -20.19 -7.74 -1.97 3.39 7.16<br />
CLASS 4 -0.78 -20.31 -21.28 -8.72 42.56 241.47 -20.31 -7.67 -1.81 3.61 7.30<br />
<strong>Franklin</strong> Flex Cap Growth Securities Fund<br />
$10,000 Hypothetical<br />
Investment from Inception 53<br />
FUND FACTS<br />
Net Assets (millions)<br />
54, 56<br />
Expense Ratio<br />
without waiver<br />
with waiver<br />
CLASS 2 CLASS 4<br />
$8,908 $8,899<br />
CLASS 2 CLASS 4<br />
$211.2 $131.9<br />
PORTFOLIO HOLDINGS 29 6/30<br />
Total Number of Positions 80<br />
PORTFOLIO BREAKDOWN<br />
Information Technology 34.49%<br />
Health Care 17.89<br />
Industrials 10.35<br />
Energy 8.68<br />
Consumer Staples 6.69<br />
Financials 4.76<br />
Consumer Discretionary 4.62<br />
Materials 4.09<br />
Telecommunication Services 2.68<br />
ASSET ALLOCATION 29, 60 6/30<br />
Stocks 94%<br />
Cash 6%<br />
TOP 10 HOLDINGS7 Becton Dickinson & Co. 5.54%<br />
United Technologies Corp. 5.38<br />
Roper Industries Inc. 5.33<br />
Praxair Inc. 5.32<br />
Procter & Gamble Co. 5.01<br />
Wal-Mart Stores Inc. 5.00<br />
Family Dollar Stores Inc. 4.42<br />
McCormick & Company Inc. 3.99<br />
Dover Corp. 3.96<br />
Erie Indemnity Co. 3.88<br />
FUND-ONLY PERFORMANCE INFORMATION<br />
CUMULATIVE TOTAL RETURN– AVERAGE ANNUAL TOTAL RETURN–<br />
NO CONTRACT EXPENSES OR CHARGES53, 56, 66 53, 56, 66<br />
NO CONTRACT EXPENSES OR CHARGES<br />
YTD14 1 YR 3 YR 5 YR 10 YR INCEPTION 1 YR 3 YR 5 YR 10 YR INCEPTION<br />
CLASS 2 8.03 -23.84 -16.04 — — -10.92 -23.84 -5.66 — — -2.63<br />
CLASS 4 7.93 -23.94 -16.13 — — -11.01 -23.94 -5.69 — — -2.66<br />
1.28% 1.38%<br />
0.97% 1.07%<br />
ASSET ALLOCATION 29, 60 6/30<br />
Stocks 94%<br />
Cash 6%<br />
6/30/09<br />
TOP 10 HOLDINGS7 Qualcomm Inc. 3.29%<br />
Apple Inc. 3.11<br />
Cisco Systems Inc. 2.72<br />
Google Inc. 2.46<br />
Praxair Inc. 2.38<br />
Oracle Corp. 2.31<br />
American Tower Corp. 2.11<br />
CVS Caremark Corp. 2.09<br />
Danaher Corp. 2.03<br />
Gilead Sciences Inc. 1.98<br />
DEALER USE ONLY/NOT FOR DISTRIBUTION TO THE PUBLIC Go to franklintempleton.com or call (800) 223-2141 <strong>Dealer</strong> <strong>Facts</strong> <strong>Guide</strong> 105<br />
VARIABLE INSURANCE FUNDS
VARIABLE INSURANCE FUNDS<br />
<strong>Franklin</strong> Large Cap Growth Securities Fund 81 6/30/09<br />
INVESTMENT CATEGORY<br />
Growth<br />
MAIN INVESTMENTS37 Seeks capital appreciation. The fund<br />
normally invests at least 80% of its<br />
net assets in investments of large<br />
capitalization companies, and normally<br />
invests predominantly in<br />
equity securities.<br />
FUND REFERENCE<br />
CLASS 1 CLASS 2<br />
Fund No. 721 722<br />
CUSIP 355 150 731 355 150 533<br />
Inception 1 5/1/96 1/6/99<br />
CLASS 4<br />
Fund No. 709<br />
CUSIP 355 150 178<br />
Inception 1 2/28/08<br />
ANNUAL PROSPECTUS UPDATE AVAILABLE:<br />
May 1<br />
PORTFOLIO MANAGER/FUND TENURE 84<br />
Kent Shepherd, CFA, 1999<br />
Joined <strong>Franklin</strong> <strong>Templeton</strong> in 1991<br />
Alex W. Peters, CFA, 2005<br />
Joined <strong>Franklin</strong> <strong>Templeton</strong> in 1992<br />
Please see page 103 for general information<br />
and page 125 for important footnotes.<br />
INVESTMENT CATEGORY<br />
Growth<br />
MAIN INVESTMENTS37 Seeks long-term capital growth. The<br />
fund normally invests at least 80% of<br />
its net assets in investments of small<br />
capitalization and mid capitalization<br />
companies and normally invests<br />
predominantly in equity securities.<br />
FUND REFERENCE<br />
CLASS 1 CLASS 2<br />
Fund No. 723 724<br />
CUSIP 355 150 749 355 150 525<br />
Inception1 11/1/95 1/6/99<br />
CLASS 4<br />
Fund No. 733<br />
CUSIP 355 151 101<br />
Inception 1 2/28/08<br />
ANNUAL PROSPECTUS UPDATE AVAILABLE:<br />
May 1<br />
PORTFOLIO MANAGER/FUND TENURE 84<br />
Edward B. Jamieson, 2005<br />
Joined <strong>Franklin</strong> <strong>Templeton</strong> in 1987<br />
James Cross, CFA, 2006<br />
Joined <strong>Franklin</strong> <strong>Templeton</strong> in 1998<br />
Michael McCarthy, CFA, 1995<br />
Joined <strong>Franklin</strong> <strong>Templeton</strong> in 1992<br />
FUND-ONLY PERFORMANCE INFORMATION<br />
CUMULATIVE TOTAL RETURN– AVERAGE ANNUAL TOTAL RETURN–<br />
NO CONTRACT EXPENSES OR CHARGES53 NO CONTRACT EXPENSES OR CHARGES 56<br />
YTD14 1 YR 3 YR 5 YR 10 YR INCEPTION 1 YR 3 YR 5 YR 10 YR INCEPTION<br />
CLASS 1 8.66 -20.45 -15.11 -10.68 -0.24 81.15 -20.45 -5.31 -2.23 -0.02 4.62<br />
CLASS 2 8.48 -20.62 -15.75 -11.77 -2.72 76.34 -20.62 -5.55 -2.47 -0.28 4.40<br />
CLASS 4 8.48 -20.77 -15.56 -11.15 -0.76 80.19 -20.77 -5.48 -2.34 -0.08 4.57<br />
$10,000 Hypothetical<br />
Investment from Inception 53<br />
FUND FACTS<br />
Net Assets (millions)<br />
Expense Ratio54 *Less than $100,000<br />
CLASS 1 CLASS 2 CLASS 4<br />
$18,115 $17,634 $18,019<br />
CLASS 1 CLASS 2 CLASS 4<br />
$51.5 $336.1 $0.0*<br />
0.77% 1.02% 1.12%<br />
PORTFOLIO HOLDINGS 29 6/30<br />
Total Number of Positions 76<br />
PORTFOLIO BREAKDOWN<br />
Health Care 24.55%<br />
Information Technology 20.60<br />
Consumer Staples 13.54<br />
Financials 10.47<br />
Energy 9.72<br />
Utilities 6.09<br />
Industrials 5.02<br />
Telecommunication Services 2.49<br />
Consumer Discretionary 1.42<br />
Materials 1.42<br />
ASSET ALLOCATION 29, 60 6/30<br />
Stocks 95%<br />
Cash 5%<br />
TOP 10 HOLDINGS7 Schering-Plough Corp. 4.29%<br />
Exxon Mobil Corp. 3.60<br />
IBM Corp. 3.33<br />
Microsoft Corp. 2.87<br />
Wal-Mart Stores Inc. 2.83<br />
Teva Pharmaceutical Industries Ltd. 2.40<br />
Exelon Corp. 2.21<br />
Abbott Laboratories 2.14<br />
J.P. Morgan Chase & Co. 1.97<br />
CVS Caremark Corp. 1.91<br />
<strong>Franklin</strong> Small-Mid Cap Growth Securities Fund 82 6/30/09<br />
Please see page 103 for general information<br />
and page 125 for important footnotes.<br />
FUND-ONLY PERFORMANCE INFORMATION<br />
CUMULATIVE TOTAL RETURN– AVERAGE ANNUAL TOTAL RETURN–<br />
NO CONTRACT EXPENSES OR CHARGES53, 66 53, 66<br />
NO CONTRACT EXPENSES OR CHARGES<br />
YTD14 1 YR 3 YR 5 YR 10 YR INCEPTION 1 YR 3 YR 5 YR 10 YR INCEPTION<br />
CLASS 1 14.59 -27.53 -21.77 -11.60 13.75 103.40 -27.53 -7.86 -2.44 1.30 5.33<br />
CLASS 2 14.47 -27.73 -22.32 -12.69 11.03 98.17 -27.73 -8.07 -2.68 1.05 5.13<br />
CLASS 4 14.39 -27.78 -22.16 -12.03 13.19 102.40 -27.78 -8.01 -2.53 1.25 5.29<br />
$10,000 Hypothetical<br />
Investment from Inception 53<br />
FUND FACTS<br />
Net Assets (millions)<br />
Expense Ratio54 CLASS 1 CLASS 2 CLASS 4<br />
$20,340 $19,817 $20,240<br />
CLASS 1 CLASS 2 CLASS 4<br />
$67.7 $677.7 $7.5<br />
0.80% 1.05% 1.15%<br />
PORTFOLIO HOLDINGS 29 6/30<br />
Total Number of Positions 96<br />
PORTFOLIO BREAKDOWN<br />
Information Technology 25.36%<br />
Health Care 23.35<br />
Consumer Discretionary 14.35<br />
Industrials 13.33<br />
Energy 6.23<br />
Financials 5.41<br />
Consumer Staples 2.98<br />
Telecommunication Services 2.18<br />
Utilities 1.06<br />
Materials 0.97<br />
ASSET ALLOCATION 29, 60 6/30<br />
Stocks 95%<br />
Cash 5%<br />
TOP 10 HOLDINGS7 Silicon Laboratories Inc. 2.78%<br />
Flowserve Corp. 2.45<br />
MasterCard Inc. 2.32<br />
Express Scripts Inc. 2.17<br />
Nuance Communications Inc. 1.82<br />
Affiliated Managers Group Inc. 1.80<br />
FLIR Systems Inc. 1.77<br />
AMETEK Inc. 1.72<br />
Guess? Inc. 1.71<br />
Waters Corp. 1.65<br />
106 <strong>Dealer</strong> <strong>Facts</strong> <strong>Guide</strong> Go to franklintempleton.com or call (800) 223-2141 DEALER USE ONLY/NOT FOR DISTRIBUTION TO THE PUBLIC
<strong>Franklin</strong> Global Real Estate Securities Fund 88 6/30/09<br />
(<strong>Franklin</strong> Real Estate Fund before May 1, 2007)<br />
INVESTMENT CATEGORY<br />
Sector<br />
MAIN INVESTMENTS37 Seeks high total return. The fund<br />
normally invests at least 80% of its<br />
net assets in investments of companies<br />
located anywhere in the world that<br />
operate in the real estate sector and<br />
normally invests predominantly in<br />
equity securities.<br />
FUND REFERENCE<br />
CLASS 1 CLASS 2<br />
Fund No. 771 772<br />
CUSIP 355 150 301 355 150 640<br />
Inception1 1/24/89 1/6/99<br />
CLASS 4<br />
Fund No. 790<br />
CUSIP 355 150 137<br />
Inception 1 2/28/08<br />
ANNUAL PROSPECTUS UPDATE AVAILABLE:<br />
May 1<br />
PORTFOLIO MANAGER/FUND TENURE84 Jack Foster, 2007<br />
Joined <strong>Franklin</strong> <strong>Templeton</strong> in 1987<br />
David Levy, 2007<br />
Joined <strong>Franklin</strong> <strong>Templeton</strong> in 2007<br />
Please see page 103 for general information<br />
and page 125 for important footnotes.<br />
INVESTMENT CATEGORY<br />
Global<br />
MAIN INVESTMENTS37 Seeks capital appreciation. The fund<br />
normally invests primarily in U.S.<br />
and foreign equity securities that the<br />
manager believes are undervalued.<br />
The fund also invests, to a lesser<br />
extent, in risk arbitrage securities<br />
and distressed companies.<br />
Formerly Mutual Discovery Securities Fund.<br />
Effective 5/1/09, the fund’s name changed.<br />
The investment goal and strategy remained<br />
the same.<br />
FUND REFERENCE<br />
CLASS 1 CLASS 2<br />
Fund No. 753 754<br />
CUSIP 355 150 699 355 150 574<br />
Inception 1 11/8/96 1/6/99<br />
CLASS 4<br />
Fund No. 736<br />
CUSIP 355 151 507<br />
Inception1 2/28/08<br />
ANNUAL PROSPECTUS UPDATE AVAILABLE:<br />
May 1<br />
PORTFOLIO MANAGER/FUND TENURE84 Anne E. Gudefin, CFA, 2005<br />
Joined Mutual Series in 2000<br />
Charles M. Lahr, CFA, 2007<br />
Joined Mutual Series in 2003<br />
Please see page 103 for general information<br />
and page 125 for important footnotes.<br />
FUND-ONLY PERFORMANCE INFORMATION<br />
CUMULATIVE TOTAL RETURN– AVERAGE ANNUAL TOTAL RETURN–<br />
NO CONTRACT EXPENSES OR CHARGES53, 56 53, 56<br />
NO CONTRACT EXPENSES OR CHARGES<br />
YTD14 1 YR 3 YR 5 YR 10 YR INCEPTION 1 YR 3 YR 5 YR 10 YR INCEPTION<br />
CLASS 1 -10.23 -39.37 -51.33 -29.15 32.14 269.36 -39.37 -21.34 -6.66 2.83 6.60<br />
CLASS 2 -10.36 -39.54 -51.73 -30.07 28.84 259.64 -39.54 -21.56 -6.90 2.57 6.47<br />
CLASS 4 -10.37 -39.57 -51.57 -29.49 31.50 267.59 -39.57 -21.47 -6.75 2.78 6.58<br />
$10,000 Hypothetical<br />
Investment from Inception 53<br />
FUND FACTS<br />
Net Assets (millions)<br />
Expense Ratio54,56 without waiver<br />
with waiver<br />
*Less than $100,000<br />
CLASS 1 CLASS 2 CLASS 4<br />
$36,936 $35,964 $36,759<br />
CLASS 1 CLASS 2 CLASS 4<br />
$30.9 $286.3 $0.0*<br />
1.10% 1.35% 1.45%<br />
0.78% 1.03% 1.13%<br />
PORTFOLIO HOLDINGS 29 6/30<br />
Total Number of Positions 91<br />
PROPERTY BREAKDOWN<br />
Retail REITs 40.07%<br />
Office REITs 17.94<br />
Diversified REITs 16.21<br />
Specialized REITs 13.13<br />
Residential REITs 7.41<br />
Industrial REITs 4.68<br />
ASSET ALLOCATION 29, 60 6/30<br />
Stocks 99%<br />
Cash 1%<br />
TOP 10 HOLDINGS7 Westfield Group 8.87%<br />
Unibail-Rodamco SE 4.45<br />
Simon Property Group Inc. 4.36<br />
Boston Properties Inc. 3.22<br />
Ventas Inc. 2.77<br />
British Land Company PLC 2.76<br />
Vornado Realty Trust 2.30<br />
Public Storage 2.13<br />
Host Hotels & Resorts Inc. 2.06<br />
HCP Inc. 2.05<br />
Mutual Global Discovery Securities Fund 93 6/30/09<br />
FUND-ONLY PERFORMANCE INFORMATION<br />
CUMULATIVE TOTAL RETURN– AVERAGE ANNUAL TOTAL RETURN–<br />
NO CONTRACT EXPENSES OR CHARGES13, 53 13, 53<br />
NO CONTRACT EXPENSES OR CHARGES<br />
YTD14 1 YR 3 YR 5 YR 10 YR INCEPTION 1 YR 3 YR 5 YR 10 YR INCEPTION<br />
CLASS 1 8.62 -12.96 -0.38 41.85 113.72 177.00 -12.96 -0.13 7.24 7.89 8.39<br />
CLASS 2 8.45 -13.21 -1.16 40.05 108.45 169.95 -13.21 -0.39 6.97 7.62 8.17<br />
CLASS 4 8.46 -13.27 -0.83 41.22 112.77 175.76 -13.27 -0.28 7.15 7.84 8.36<br />
$10,000 Hypothetical<br />
Investment from Inception 53<br />
FUND FACTS<br />
Net Assets (millions)<br />
Expense Ratio54 CLASS 1 CLASS 2 CLASS 4<br />
$27,700 $26,995 $27,576<br />
CLASS 1 CLASS 2 CLASS 4<br />
$80.5 $1,181.1 $43.7<br />
0.98% 1.23% 1.33%<br />
PORTFOLIO HOLDINGS 29 6/30<br />
Total Number of Positions 219<br />
PORTFOLIO BREAKDOWN<br />
Food, Beverage & Tobacco 30.11%<br />
Capital Goods 6.19<br />
Energy<br />
Pharmaceuticals, Biotechnology &<br />
5.54<br />
Life Sciences 3.72<br />
Banks 3.69<br />
Insurance 3.54<br />
Real Estate 3.50<br />
Utilities 3.47<br />
Media 2.61<br />
Diversified Financials 2.42<br />
ASSET ALLOCATION 29, 60 6/30<br />
Stocks 74%<br />
Cash 22%<br />
Bonds 4%<br />
TOP 10 HOLDINGS7 British American Tobacco PLC 4.48%<br />
Schering-Plough Corp. 3.47<br />
Wyeth 3.33<br />
Imperial Tobacco Group PLC 3.19<br />
Danone 2.68<br />
Berkshire Hathaway Inc. 2.42<br />
Nestle SA 2.35<br />
Carlsberg AS 2.21<br />
Pernod Ricard SA 2.15<br />
Lorillard Inc. 2.14<br />
DEALER USE ONLY/NOT FOR DISTRIBUTION TO THE PUBLIC Go to franklintempleton.com or call (800) 223-2141 <strong>Dealer</strong> <strong>Facts</strong> <strong>Guide</strong> 107<br />
VARIABLE INSURANCE FUNDS
VARIABLE INSURANCE FUNDS<br />
<strong>Templeton</strong> Global Asset Allocation Fund<br />
INVESTMENT CATEGORY<br />
Global<br />
MAIN INVESTMENTS37 Seeks high total return. The fund<br />
normally invests in equity securities<br />
of companies of any country,<br />
debt securities of companies and<br />
governments of any country, and<br />
in money market securities. The<br />
fund normally invests substantially<br />
to primarily in equity securities.<br />
FUND REFERENCE<br />
CLASS 1 CLASS 2<br />
Fund No. 715 716<br />
CUSIP 355 150 756 355 150 517<br />
Inception 1 8/24/88 5/1/97<br />
CLASS 4<br />
Fund No. 786<br />
CUSIP 355 151 861<br />
Inception 1 2/28/08<br />
ANNUAL PROSPECTUS UPDATE AVAILABLE:<br />
May 1<br />
PORTFOLIO MANAGER/FUND TENURE 84<br />
Equity portion:<br />
Peter A. Nori, CFA, 1996<br />
Joined <strong>Franklin</strong> <strong>Templeton</strong> in 1987<br />
Tina Sadler, CFA, 2004<br />
Joined <strong>Franklin</strong> <strong>Templeton</strong> in 1997<br />
Bond portion:<br />
Michael Hasenstab, Ph.D., 2002<br />
Joined <strong>Franklin</strong> <strong>Templeton</strong> in 1995<br />
Please see page 103 for general information<br />
and page 125 for important footnotes.<br />
INVESTMENT CATEGORY<br />
Global<br />
MAIN INVESTMENTS37 Seeks long- term capital growth.<br />
The fund normally invests primarily<br />
in equity securities of companies<br />
located anywhere in the world,<br />
including those in the U.S. and in<br />
emerging markets.<br />
FUND REFERENCE<br />
CLASS 1 CLASS 2<br />
Fund No. 739 740<br />
CUSIP 355 150 764 355 150 491<br />
Inception 1 3/15/94 1/6/99<br />
CLASS 4<br />
Fund No. 788<br />
CUSIP 355 151 879<br />
Inception 1 2/28/08<br />
ANNUAL PROSPECTUS UPDATE AVAILABLE:<br />
May 1<br />
PORTFOLIO MANAGER/FUND TENURE 84<br />
Alan Chua, CFA, 2003<br />
Joined <strong>Franklin</strong> <strong>Templeton</strong> in 2000<br />
Cindy L. Sweeting, CFA, 2007<br />
Joined <strong>Franklin</strong> <strong>Templeton</strong> in 1997<br />
CLASS 1 CLASS 2 CLASS 4<br />
$10,000 Hypothetical<br />
Investment from Inception53 FUND FACTS<br />
CLASS 1 CLASS 2 CLASS 4<br />
Net Assets (millions)<br />
Expense Ratio54,56 without waiver<br />
with waiver<br />
*Less than $100,000<br />
PORTFOLIO HOLDINGS29 $57,307 $55,595 $57,096<br />
$35.9 $46.7 $0.0*<br />
0.94% 1.19% 1.29%<br />
0.83% 1.08% 1.18%<br />
6/30<br />
Total Number of Positions 125<br />
PORTFOLIO BREAKDOWN<br />
Pharmaceuticals, Biotechnology & Life Sciences 9.04%<br />
Telecommunication Services 6.85<br />
Software & Services 5.52<br />
Media 5.27<br />
Energy 4.69<br />
Capital Goods 4.13<br />
Insurance 3.35<br />
Technology Hardware & Equipment 2.65<br />
Health Care Equipment & Services 2.48<br />
Banks 2.47<br />
<strong>Templeton</strong> Growth Securities Fund<br />
Please see page 103 for general information<br />
and page 125 for important footnotes.<br />
6/30/09<br />
FUND-ONLY PERFORMANCE INFORMATION<br />
CUMULATIVE TOTAL RETURN– AVERAGE ANNUAL TOTAL RETURN–<br />
NO CONTRACT EXPENSES OR CHARGES53, 55, 56 53, 55, 56<br />
NO CONTRACT EXPENSES OR CHARGES<br />
YTD14 1 YR 3 YR 5 YR 10 YR INCEPTION 1 YR 3 YR 5 YR 10 YR INCEPTION<br />
CLASS 1 3.65 -16.95 -2.83 22.63 59.38 473.07 -16.95 -0.95 4.16 4.77 8.73<br />
CLASS 2 3.46 -17.18 -3.58 21.14 55.46 455.95 -17.18 -1.21 3.91 4.51 8.58<br />
CLASS 4 3.49 -17.19 -3.19 22.18 58.79 470.96 -17.19 -1.07 4.09 4.73 8.71<br />
$10,000 Hypothetical<br />
Investment from Inception 53<br />
FUND FACTS<br />
Net Assets (millions)<br />
Expense Ratio54 CLASS 1 CLASS 2 CLASS 4<br />
$22,364 $21,785 $22,247<br />
CLASS 1 CLASS 2 CLASS 4<br />
$489.2 $1,485.0 $38.7<br />
0.78% 1.03% 1.13%<br />
PORTFOLIO HOLDINGS 29 6/30<br />
Total Number of Positions 114<br />
PORTFOLIO BREAKDOWN<br />
Pharmaceuticals, Biotechnology &<br />
Life Sciences 14.09%<br />
Software & Services 10.19<br />
Telecommunication Services 9.91<br />
Media 9.88<br />
Energy 9.71<br />
Technology Hardware & Equipment 5.20<br />
Capital Goods 4.43<br />
Banks 3.96<br />
Automobiles & Components 3.78<br />
Transportation 3.40<br />
ASSET ALLOCATION 29, 60 6/30<br />
Stocks 58%<br />
Bonds 38%<br />
Cash 4%<br />
GEOGRAPHIC BREAKDOWN<br />
Europe 25.38%<br />
North America 22.66<br />
Asia 8.75<br />
Latin America/Caribbean 0.87<br />
Mid-East/Africa 0.78<br />
FUND-ONLY PERFORMANCE INFORMATION<br />
CUMULATIVE TOTAL RETURN– AVERAGE ANNUAL TOTAL RETURN–<br />
NO CONTRACT EXPENSES OR CHARGES53 NO CONTRACT EXPENSES OR CHARGES 53<br />
YTD14 1 YR 3 YR 5 YR 10 YR INCEPTION 1 YR 3 YR 5 YR 10 YR INCEPTION<br />
CLASS 1 5.59 -28.46 -28.24 -7.28 14.50 123.64 -28.46 -10.47 -1.50 1.36 5.40<br />
CLASS 2 5.51 -28.67 -28.77 -8.41 11.67 117.85 -28.67 -10.69 -1.74 1.11 5.22<br />
CLASS 4 5.41 -28.79 -28.61 -7.76 13.90 122.47 -28.79 -10.63 -1.60 1.31 5.37<br />
ASSET ALLOCATION 29, 60 6/30<br />
Stocks 96%<br />
Cash 4%<br />
6/30/09<br />
GEOGRAPHIC BREAKDOWN<br />
Europe 44.38%<br />
North America 38.92<br />
Asia 11.20<br />
Latin America/Caribbean 0.56<br />
Australia/New Zealand 0.49<br />
108 <strong>Dealer</strong> <strong>Facts</strong> <strong>Guide</strong> Go to franklintempleton.com or call (800) 223-2141 DEALER USE ONLY/NOT FOR DISTRIBUTION TO THE PUBLIC
Mutual International Securities Fund<br />
INVESTMENT CATEGORY<br />
International<br />
MAIN INVESTMENTS 37<br />
Seeks capital appreciation, which<br />
occasionally may be short term,<br />
with income as a secondary goal.<br />
The fund normally invests at least<br />
80% of its net assets in securities of<br />
non-US issuers and invests primarily<br />
in equity securities that the manager<br />
believes are undervalued. The fund<br />
also invests to a lesser extent, distressed<br />
securities and merger arbitrage.<br />
FUND REFERENCE<br />
CLASS 2 CLASS 4<br />
Fund No. 760 761<br />
CUSIP 355 151 853 355 151 846<br />
Inception 1 6/15/09 6/15/09<br />
ANNUAL PROSPECTUS UPDATE AVAILABLE:<br />
June 15<br />
PORTFOLIO MANAGER/FUND TENURE 84<br />
Phillip Brugere-Trelat, 2009<br />
Tenure at Mutual Series<br />
1984-1994, 2004-Present<br />
Andrew Sleeman, CFA, 2009<br />
Joined Mutual Series in 2007<br />
Please see page 103 for general information<br />
and page 125 for important footnotes.<br />
<strong>Templeton</strong> Developing Markets Securities Fund<br />
INVESTMENT CATEGORY<br />
International<br />
MAIN INVESTMENTS 37<br />
Seeks long-term capital appreciation.<br />
The fund normally invests at least<br />
80% of its net assets in emerging<br />
market investments and normally<br />
invests predominantly in equity<br />
securities.<br />
FUND REFERENCE<br />
CLASS 1 CLASS 2<br />
Fund No. 717 718<br />
CUSIP 355 150 772 355 150 483<br />
Inception 1 3/4/96 5/1/97<br />
CLASS 4<br />
Fund No. 738<br />
CUSIP 355 151 705<br />
Inception 1 2/28/08<br />
ANNUAL PROSPECTUS UPDATE AVAILABLE:<br />
May 1<br />
PORTFOLIO MANAGER/FUND TENURE 84<br />
Mark Mobius, Ph.D., 1996<br />
Joined <strong>Franklin</strong> <strong>Templeton</strong> in 1987<br />
Tom Wu, 1996<br />
Joined <strong>Franklin</strong> <strong>Templeton</strong> in 1987<br />
Dennis Lim, 1996<br />
Joined <strong>Franklin</strong> <strong>Templeton</strong> in 1990<br />
Please see page 103 for general information<br />
and page 125 for important footnotes.<br />
FUND FACTS<br />
Net Assets (millions)<br />
54, 56<br />
Expense Ratio<br />
without waiver<br />
with waiver<br />
$10,000 Hypothetical<br />
Investment from Inception 53<br />
FUND FACTS<br />
Net Assets (millions)<br />
Expense Ratio54 CLASS 2 CLASS 4<br />
$1.0 $1.0<br />
CLASS 1 CLASS 2 CLASS 4<br />
$12,630 $12,261 $12,567<br />
CLASS 1 CLASS 2 CLASS 4<br />
$222.5 $325.8 $14.5<br />
1.54% 1.79% 1.89%<br />
PORTFOLIO HOLDINGS 29 6/30<br />
Total Number of Positions 119<br />
PORTFOLIO BREAKDOWN<br />
Energy 24.48%<br />
Materials 15.26<br />
Banks 13.40<br />
Telecommunication Services 10.60<br />
Food, Beverage & Tobacco 5.30<br />
Household & Personal Products 3.84<br />
Food & Staples Retailing 3.62<br />
Media 2.80<br />
Capital Goods 2.54<br />
Software & Services 2.48<br />
6/30/09<br />
FUND-ONLY PERFORMANCE INFORMATION<br />
CUMULATIVE TOTAL RETURN– AVERAGE ANNUAL TOTAL RETURN–<br />
NO CONTRACT EXPENSES OR CHARGES 53, 55, 66 53, 55, 66<br />
NO CONTRACT EXPENSES OR CHARGES<br />
YTD14 1 YR 3 YR 5 YR 10 YR INCEPTION 1 YR 3 YR 5 YR 10 YR INCEPTION<br />
CLASS 1 28.72 -26.70 -4.54 59.96 67.18 26.30 -26.70 -1.54 9.85 5.27 1.77<br />
CLASS 2 28.47 -26.93 -5.26 57.97 63.17 22.61 -26.93 -1.79 9.58 5.02 1.54<br />
CLASS 4 28.46 -26.96 -5.01 59.17 66.36 25.67 -26.96 -1.70 9.74 5.22 1.73<br />
ASSET ALLOCATION 29, 60 6/30<br />
Stocks 96%<br />
Cash 4%<br />
6/30/09<br />
FUND-ONLY PERFORMANCE INFORMATION<br />
CUMULATIVE TOTAL RETURN– AVERAGE ANNUAL TOTAL RETURN–<br />
NO CONTRACT EXPENSES OR CHARGES 53, 56 53, 56<br />
NO CONTRACT EXPENSES OR CHARGES<br />
YTD14 1 YR 3 YR 5 YR 10 YR INCEPTION 1 YR 3 YR 5 YR 10 YR INCEPTION<br />
CLASS 2 — — — — — — — — — — —<br />
CLASS 4 — — — — — — — — — — —<br />
1.57% 1.67%<br />
1.20% 1.30%<br />
GEOGRAPHIC BREAKDOWN<br />
Asia 39.25%<br />
Latin America/Caribbean 24.77<br />
Europe 23.76<br />
Mid-East/Africa 7.86<br />
DEALER USE ONLY/NOT FOR DISTRIBUTION TO THE PUBLIC Go to franklintempleton.com or call (800) 223-2141 <strong>Dealer</strong> <strong>Facts</strong> <strong>Guide</strong> 109<br />
VARIABLE INSURANCE FUNDS
VARIABLE INSURANCE FUNDS<br />
<strong>Templeton</strong> Foreign Securities Fund<br />
INVESTMENT CATEGORY<br />
International<br />
MAIN INVESTMENTS 37<br />
Seeks long- term capital growth.<br />
The fund normally invests at least<br />
80% of its net assets in investments<br />
of issuers located outside the U.S.,<br />
including those in emerging markets<br />
and normally invests predominantly<br />
in equity securities.<br />
FUND REFERENCE<br />
CLASS 1 CLASS 2<br />
Fund No. 719 720<br />
CUSIP 355 150 798 355 150 392<br />
Inception 1 5/1/92 5/1/97<br />
CLASS 4<br />
Fund No. 785<br />
CUSIP 355 151 804<br />
Inception 1 2/28/08<br />
ANNUAL PROSPECTUS UPDATE AVAILABLE:<br />
May 1<br />
PORTFOLIO MANAGER/FUND TENURE 84<br />
Peter A. Nori, CFA, 1999<br />
Joined <strong>Franklin</strong> <strong>Templeton</strong> in 1987<br />
Tina Sadler, CFA, 2004<br />
Joined <strong>Franklin</strong> <strong>Templeton</strong> in 1997<br />
Gary Motyl, CFA, 2007<br />
Joined <strong>Franklin</strong> <strong>Templeton</strong> in 1981<br />
Please see page 103 for general information<br />
and page 125 for important footnotes.<br />
<strong>Franklin</strong> Growth and Income Securities Fund<br />
INVESTMENT CATEGORY<br />
Hybrid<br />
MAIN INVESTMENTS37 Seeks capital appreciation with<br />
current income as a secondary<br />
goal. The fund normally invests<br />
predominantly in equity securities,<br />
including securities convertible into<br />
common stock.<br />
FUND REFERENCE<br />
CLASS 1 CLASS 2<br />
Fund No. 767 768<br />
CUSIP 355 150 103 355 150 665<br />
Inception 1 1/24/89 1/6/99<br />
CLASS 4<br />
Fund No. 706<br />
CUSIP 355 150 145<br />
Inception 1 2/28/08<br />
ANNUAL PROSPECTUS UPDATE AVAILABLE:<br />
May 1<br />
PORTFOLIO MANAGER/FUND TENURE 84<br />
Alan E. Muschott, CFA, 2005<br />
Joined <strong>Franklin</strong> <strong>Templeton</strong> in 1998<br />
Edward D. Perks, CFA, 2005<br />
Joined <strong>Franklin</strong> <strong>Templeton</strong> in 1992<br />
Frank Felicelli, CFA, 1995<br />
Joined <strong>Franklin</strong> <strong>Templeton</strong> in 1986<br />
Please see page 103 for general information<br />
and page 125 for important footnotes.<br />
$10,000 Hypothetical<br />
Investment from Inception 53<br />
FUND FACTS<br />
Net Assets (millions)<br />
Expense Ratio54 $10,000 Hypothetical<br />
Investment from Inception 53<br />
FUND FACTS<br />
Net Assets (millions)<br />
Expense Ratio54 *Less than $100,000<br />
CLASS 1 CLASS 2 CLASS 4<br />
$32,233 $31,258 $32,067<br />
CLASS 1 CLASS 2 CLASS 4<br />
$265.2 $1,730.3 $29.7<br />
0.81% 1.06% 1.16%<br />
PORTFOLIO HOLDINGS 29 6/30<br />
Total Number of Positions 82<br />
PORTFOLIO BREAKDOWN<br />
Telecommunication Services 14.15%<br />
Energy<br />
Pharmaceuticals, Biotechnology &<br />
11.94<br />
Life Sciences 8.76<br />
Insurance 7.76<br />
Semiconductors & Semiconductor Equipment 5.01<br />
Capital Goods 4.92<br />
Software & Services 4.51<br />
Media 4.24<br />
Banks 4.07<br />
Technology Hardware & Equipment 3.95<br />
CLASS 1 CLASS 2 CLASS 4<br />
$32,596 $31,787 $32,438<br />
CLASS 1 CLASS 2 CLASS 4<br />
$151.9 $132.2 $0.0*<br />
0.55% 0.90% 0.90%<br />
PORTFOLIO HOLDINGS 29 6/30<br />
Total Number of Positions 52<br />
PORTFOLIO BREAKDOWN<br />
Health Care 15.73%<br />
Information Technology 14.20<br />
Industrials 13.02<br />
Energy 11.01<br />
Financials 10.64<br />
Utilities 7.92<br />
Consumer Staples 7.23<br />
Consumer Discretionary 5.53<br />
Materials 3.27<br />
Telecommunication Services 1.62<br />
6/30/09<br />
FUND-ONLY PERFORMANCE INFORMATION<br />
CUMULATIVE TOTAL RETURN– AVERAGE ANNUAL TOTAL RETURN–<br />
NO CONTRACT EXPENSES OR CHARGES13, 53 13, 53<br />
NO CONTRACT EXPENSES OR CHARGES<br />
YTD14 1 YR 3 YR 5 YR 10 YR INCEPTION 1 YR 3 YR 5 YR 10 YR INCEPTION<br />
CLASS 1 2.96 -24.30 -27.46 -15.85 0.45 225.96 -24.30 -10.15 -3.39 0.05 5.95<br />
CLASS 2 2.91 -24.44 -27.97 -16.89 -1.90 217.87 -24.44 -10.36 -3.63 -0.19 5.82<br />
CLASS 4 2.80 -24.61 -27.81 -16.26 -0.03 224.38 -24.61 -10.29 -3.49 0.00 5.93<br />
ASSET ALLOCATION 29, 60 6/30<br />
Stocks 90%<br />
Bonds 6%<br />
Cash 4%<br />
6/30/09<br />
FUND-ONLY PERFORMANCE INFORMATION<br />
CUMULATIVE TOTAL RETURN– AVERAGE ANNUAL TOTAL RETURN–<br />
NO CONTRACT EXPENSES OR CHARGES13, 53, 55, 66 13, 53, 55, 66<br />
NO CONTRACT EXPENSES OR CHARGES<br />
YTD14 1 YR 3 YR 5 YR 10 YR INCEPTION 1 YR 3 YR 5 YR 10 YR INCEPTION<br />
CLASS 1 9.33 -25.78 -14.12 15.92 20.80 222.33 -25.78 -4.95 3.00 1.91 7.06<br />
CLASS 2 9.23 -25.99 -14.75 14.48 17.86 212.58 -25.99 -5.18 2.74 1.66 6.87<br />
CLASS 4 9.15 -26.08 -14.56 15.32 20.18 220.67 -26.08 -5.11 2.89 1.86 7.02<br />
ASSET ALLOCATION 29, 60 6/30<br />
Stocks 92%<br />
Cash 8%<br />
GEOGRAPHIC BREAKDOWN<br />
Europe 59.10%<br />
Asia 23.14<br />
North America 4.44<br />
Mid-East/Africa 3.45<br />
Latin America/Caribbean 1.52<br />
Australia/New Zealand 0.49<br />
TOP 10 HOLDINGS7 Wells Fargo & Co. 3.43%<br />
Schering-Plough Corp. 3.18<br />
Microsoft Corp. 3.13<br />
Johnson & Johnson 3.09<br />
Roche Holding AG 3.04<br />
Mylan Inc. 2.97<br />
Bank of America Corp. 2.80<br />
Coca-Cola Co. 2.79<br />
Microchip Technology Inc. 2.67<br />
IBM Corp. 2.57<br />
110 <strong>Dealer</strong> <strong>Facts</strong> <strong>Guide</strong> Go to franklintempleton.com or call (800) 223-2141 DEALER USE ONLY/NOT FOR DISTRIBUTION TO THE PUBLIC
<strong>Franklin</strong> Income Securities Fund<br />
INVESTMENT CATEGORY<br />
Hybrid<br />
MAIN INVESTMENTS37 Seeks to maximize income while<br />
maintaining prospects for capital<br />
appreciation. The fund may invest<br />
in equity and debt securities and<br />
may invest all of its assets in below<br />
investment grade debt securities.<br />
FUND REFERENCE<br />
CLASS 1 CLASS 2<br />
Fund No. 769 770<br />
CUSIP 355 150 889 355 150 418<br />
Inception 1 1/24/89 1/6/99<br />
CLASS 4<br />
Fund No. 708<br />
CUSIP 355 150 160<br />
Inception 1 2/28/08<br />
ANNUAL PROSPECTUS UPDATE AVAILABLE:<br />
May 1<br />
PORTFOLIO MANAGER/FUND TENURE 84<br />
Edward D. Perks, CFA, 2002<br />
Joined <strong>Franklin</strong> <strong>Templeton</strong> in 1992<br />
Charles B. Johnson, 1989<br />
Joined <strong>Franklin</strong> <strong>Templeton</strong> in 1957<br />
Please see page 103 for general information<br />
and page 125 for important footnotes.<br />
<strong>Franklin</strong> <strong>Templeton</strong> VIP Founding Funds Allocation Fund<br />
INVESTMENT CATEGORY<br />
Asset Allocation<br />
MAIN INVESTMENTS 37<br />
Seeks capital appreciation, with<br />
income as a secondary goal. The<br />
fund normally invests equal portions<br />
in Class 1 shares of <strong>Franklin</strong> Income<br />
Securities Fund; Mutual Shares<br />
Securities Fund; and <strong>Templeton</strong><br />
Growth Securities Fund.<br />
FUND REFERENCE<br />
CLASS 1 CLASS 2<br />
Fund No. 783 784<br />
CUSIP 355 150 236 355 150 228<br />
Inception 1 7/2/07 7/2/07<br />
CLASS 4<br />
Fund No. 701<br />
CUSIP 355 151 309<br />
Inception 1 2/28/08<br />
ANNUAL PROSPECTUS UPDATE AVAILABLE:<br />
May 1<br />
FUND ADMINISTRATOR 84<br />
T. Anthony Coffey, CFA, 2007<br />
Joined <strong>Franklin</strong> <strong>Templeton</strong> in 1989<br />
Oversees rebalancing of the fund<br />
on behalf of the administrator.<br />
Please see page 103 for general information<br />
and page 125 for important footnotes.<br />
$10,000 Hypothetical<br />
Investment from Inception 53<br />
FUND FACTS<br />
Net Assets (millions)<br />
Expense Ratio54 $10,000 Hypothetical<br />
Investment from Inception 53<br />
FUND FACTS<br />
Net Assets (millions)<br />
Expense Ratio54,56 without waiver<br />
with waiver<br />
CLASS 1 CLASS 2 CLASS 4<br />
$51,373 $50,049 $51,148<br />
CLASS 1 CLASS 2 CLASS 4<br />
$567.9 $5,320.3 $236.4<br />
0.47% 0.72% 0.82%<br />
PORTFOLIO HOLDINGS 29 6/30<br />
Total Number of Positions 287<br />
PORTFOLIO BREAKDOWN<br />
Corporate Bonds 58.52%<br />
Utilities 13.00<br />
Financials 8.22<br />
Corporate Loans 5.83<br />
Energy 3.29<br />
Health Care 2.29<br />
Information Technology 2.07<br />
Materials 1.50<br />
Telecommunication Services 0.97<br />
CLASS 1 CLASS 2 CLASS 4<br />
$6,444 $6,409 $6,424<br />
CLASS 1 CLASS 2 CLASS 4<br />
$0.4 $399.1 $579.4<br />
PORTFOLIO HOLDINGS29 TOP 10 HOLDINGS<br />
6/30<br />
7<br />
Microsoft Corp. 1.90%<br />
Comcast Corp. 1.21<br />
Oracle Corp. 1.11<br />
Wyeth 1.07<br />
News Corp Inc. 1.04<br />
British American Tobacco PLC 1.02<br />
Siemens AG 1.01<br />
Nestle SA 0.94<br />
Amgen Inc. 0.91<br />
Royal Dutch Shell 0.90<br />
6/30/09<br />
FUND-ONLY PERFORMANCE INFORMATION<br />
CUMULATIVE TOTAL RETURN– AVERAGE ANNUAL TOTAL RETURN–<br />
NO CONTRACT EXPENSES OR CHARGES53, 56 53, 56<br />
NO CONTRACT EXPENSES OR CHARGES<br />
YTD14 1 YR 3 YR 5 YR 10 YR INCEPTION 1 YR 3 YR 5 YR 10 YR INCEPTION<br />
CLASS 1 7.51 -22.26 — — — -35.56 -22.26 — — — -19.75<br />
CLASS 2 7.34 -22.50 — — — -35.91 -22.50 — — — -19.97<br />
CLASS 4 7.33 -22.51 — — — -35.76 -22.51 — — — -19.87<br />
0.78% 1.03% 1.13%<br />
0.75% 1.00% 1.10%<br />
ASSET ALLOCATION 29, 60 6/30<br />
FTVIP Income<br />
Securities Fund 33 1 ⁄3%<br />
FTVIP <strong>Templeton</strong> Growth<br />
Securities Fund 33 1 ⁄3%<br />
FTVIP Mutual Shares<br />
Securities Fund 33 1 ⁄3%<br />
6/30/09<br />
FUND-ONLY PERFORMANCE INFORMATION<br />
CUMULATIVE TOTAL RETURN– AVERAGE ANNUAL TOTAL RETURN–<br />
NO CONTRACT EXPENSES OR CHARGES13, 53 13, 53<br />
NO CONTRACT EXPENSES OR CHARGES<br />
YTD14 1 YR 3 YR 5 YR 10 YR INCEPTION 1 YR 3 YR 5 YR 10 YR INCEPTION<br />
CLASS 1 12.91 -16.46 -7.51 12.00 75.28 413.73 -16.46 -2.57 2.29 5.77 8.34<br />
CLASS 2 12.84 -16.64 -8.18 10.58 70.96 400.49 -16.64 -2.80 2.03 5.51 8.20<br />
CLASS 4 12.79 -16.67 -7.91 11.51 74.52 411.48 -16.67 -2.71 2.20 5.73 8.32<br />
ASSET ALLOCATION 29, 60 6/30<br />
Bonds 64%<br />
Stocks 32%<br />
Cash 4%<br />
TOP 5 STOCK HOLDINGS<br />
Bank of America Corp. 1.53%<br />
Merck & Company Inc. 1.37<br />
Public Service Enterprise Group Inc. 1.33<br />
PG&E Corp. 1.25<br />
Duke Energy Corp. 1.19<br />
TOP 5 BOND HOLDINGS<br />
Tenet Healthcare Corp. 3.47%<br />
Energy Future Holdings Corp. 3.27<br />
Ford Motor Credit Co. 3.02<br />
Dynegy Holdings Inc. 2.66<br />
General Motors Acceptance Corp. 1.89<br />
DEALER USE ONLY/NOT FOR DISTRIBUTION TO THE PUBLIC Go to franklintempleton.com or call (800) 223-2141 <strong>Dealer</strong> <strong>Facts</strong> <strong>Guide</strong> 111<br />
VARIABLE INSURANCE FUNDS
VARIABLE INSURANCE FUNDS<br />
<strong>Franklin</strong> High Income Securities Fund<br />
INVESTMENT CATEGORY<br />
Fixed Income<br />
MAIN INVESTMENTS 37<br />
Seeks a high level of current<br />
income with capital appreciation<br />
as a secondary goal. The fund<br />
normally invests primarily to<br />
predominantly in debt securities<br />
offering high yield and expected<br />
total return.<br />
FUND REFERENCE<br />
CLASS 1 CLASS 2<br />
Fund No. 777 778<br />
CUSIP 355 150 509 355 150 624<br />
Inception 1 1/24/89 1/6/99<br />
CLASS 4<br />
Fund No. 707<br />
CUSIP 355 150 152<br />
Inception 1 2/28/08<br />
ANNUAL PROSPECTUS UPDATE AVAILABLE:<br />
May 1<br />
PORTFOLIO MANAGER/FUND TENURE 84<br />
Patricia O’Connor, CFA, CPA, 2002<br />
Joined <strong>Franklin</strong> <strong>Templeton</strong> in 1997<br />
Eric G. Takaha, CFA, 2005<br />
Joined <strong>Franklin</strong> <strong>Templeton</strong> in 1989<br />
Please see page 103 for general information<br />
and page 125 for important footnotes.<br />
<strong>Franklin</strong> Strategic Income Securities Fund<br />
INVESTMENT CATEGORY<br />
Fixed Income<br />
MAIN INVESTMENTS37 Seeks a high level of current income,<br />
with capital appreciation over the<br />
long term as a secondary goal. The<br />
fund normally invests primarily to<br />
predominantly in U.S. and foreign<br />
debt securities, including those in<br />
emerging markets.<br />
FUND REFERENCE<br />
CLASS 1 CLASS 2<br />
Fund No. 779 780<br />
CUSIP 355 150 335 355 150 327<br />
Inception 1 7/1/99 5/15/01<br />
CLASS 4<br />
Fund No. 734<br />
CUSIP 355 151 200<br />
Inception 1 2/28/08<br />
ANNUAL PROSPECTUS UPDATE AVAILABLE:<br />
May 1<br />
PORTFOLIO MANAGER/FUND TENURE 84<br />
Eric G. Takaha, CFA, 1999<br />
Joined <strong>Franklin</strong> <strong>Templeton</strong> in 1989<br />
Christopher J. Molumphy, CFA, 1999<br />
Joined <strong>Franklin</strong> <strong>Templeton</strong> in 1988<br />
Please see page 103 for general information<br />
and page 125 for important footnotes.<br />
$10,000 Hypothetical<br />
Investment from Inception 53<br />
FUND FACTS<br />
Net Assets (millions)<br />
Expense Ratio54 CLASS 1 CLASS 2 CLASS 4<br />
$31,552 $30,726 $31,429<br />
CLASS 1 CLASS 2 CLASS 4<br />
$43.8 $155.5 $7.5<br />
0.66% 0.91% 1.01%<br />
PORTFOLIO HOLDINGS 29 5/31<br />
Total Number of Positions 140<br />
PORTFOLIO BREAKDOWN<br />
Utilities 11.69%<br />
Energy 9.87<br />
Health Care Services 8.22<br />
Cable Television 6.23<br />
Food & Beverage 6.07<br />
Financial Services 5.66<br />
Telecommunications 5.17<br />
Industrials 5.01<br />
Wireless Communications 4.76<br />
Media 4.16<br />
CLASS 1 CLASS 2 CLASS 4<br />
$10,000 Hypothetical<br />
Investment from Inception53 FUND FACTS<br />
CLASS 1 CLASS 2 CLASS 4<br />
Net Assets (millions)<br />
Expense Ratio54 $18,438 $17,983 $18,336<br />
$1,049.6 $47.9 $108.5<br />
0.63% 0.88% 0.98%<br />
PORTFOLIO HOLDINGS 29 5/31<br />
Total Number of Positions 599<br />
PORTFOLIO BREAKDOWN<br />
High-Yield Corporate Bonds & Preferred 23.07%<br />
Investment Grade Corporate Bonds 18.45<br />
Mortgages/Other Asset-Backed Bonds 17.07<br />
Floating Rate Bank Loans 9.93<br />
U.S. Government Bonds 8.89<br />
Other International Bonds (Non-U.S. Dollar) 8.51<br />
Emerging Market Bonds 6.39<br />
Municipal Bonds<br />
International Developed Market Bonds<br />
2.74<br />
(Non-U.S. Dollar) 2.23<br />
Convertible Securities 0.31<br />
6/30/09<br />
FUND-ONLY PERFORMANCE INFORMATION<br />
CUMULATIVE TOTAL RETURN– AVERAGE ANNUAL TOTAL RETURN–<br />
NO CONTRACT EXPENSES OR CHARGES53, 66 53, 66<br />
NO CONTRACT EXPENSES OR CHARGES<br />
YTD14 1 YR 3 YR 5 YR 10 YR INCEPTION 1 YR 3 YR 5 YR 10 YR INCEPTION<br />
CLASS 1 12.86 0.09 13.41 29.33 — 84.38 0.09 4.29 5.28 — 6.31<br />
CLASS 2 12.60 -0.24 12.48 27.64 — 79.83 -0.24 4.00 5.00 — 6.04<br />
CLASS 4 12.55 -0.30 12.79 28.61 — 83.36 -0.30 4.09 5.16 — 6.25<br />
ASSET ALLOCATION 29, 60 5/31<br />
Bonds 98%<br />
Cash 2%<br />
6/30/09<br />
FUND-ONLY PERFORMANCE INFORMATION<br />
CUMULATIVE TOTAL RETURN– AVERAGE ANNUAL TOTAL RETURN–<br />
NO CONTRACT EXPENSES OR CHARGES13, 53 13, 53<br />
NO CONTRACT EXPENSES OR CHARGES<br />
YTD14 1 YR 3 YR 5 YR 10 YR INCEPTION 1 YR 3 YR 5 YR 10 YR INCEPTION<br />
CLASS 1 21.75 -5.46 3.51 19.52 28.18 215.52 -5.46 1.16 3.63 2.51 5.79<br />
CLASS 2 21.51 -5.74 2.68 17.79 25.01 207.26 -5.74 0.89 3.33 2.26 5.65<br />
CLASS 4 21.53 -5.68 3.10 19.05 27.68 214.29 -5.68 1.02 3.55 2.47 5.77<br />
ASSET ALLOCATION 29, 60 5/31<br />
Bonds 94%<br />
Cash 6%<br />
TOP 10 HOLDINGS7 Ford Motor Credit Company LLC 2.18%<br />
HCA Inc. 2.04<br />
GMAC LLC 1.81<br />
Charter Communications Holdings 1.80<br />
Intelsat Bermuda 1.53<br />
Chesapeake Energy Corp. 1.48<br />
Qwest Communications International 1.46<br />
NRG Energy Inc. 1.42<br />
Williams Companies Inc. 1.30<br />
Tenet Healthcare Corp. 1.25<br />
TOP 10 HOLDINGS7 Russian Federation 1.73%<br />
Republic of Argentina 1.03<br />
Mexican Fixed Rate Bonds 0.97<br />
FNMA, 5.50% 0.97<br />
Nota do Tesouro Nacional 0.93<br />
California State Obligation 0.92<br />
MBNA Master Credit Card Trust 0.84<br />
FHLG 0.80<br />
Swedish Government 0.76<br />
FNMA, 4.50% 0.71<br />
112 <strong>Dealer</strong> <strong>Facts</strong> <strong>Guide</strong> Go to franklintempleton.com or call (800) 223-2141 DEALER USE ONLY/NOT FOR DISTRIBUTION TO THE PUBLIC
<strong>Franklin</strong> U.S. Government Fund<br />
INVESTMENT CATEGORY<br />
Fixed Income<br />
MAIN INVESTMENTS37 Seeks income. The fund normally<br />
invests at least 80% of its net assets<br />
in U.S. government securities and<br />
normally invests primarily in fixed<br />
and variable rate mortgage-backed<br />
securities.<br />
FUND REFERENCE<br />
CLASS 1 CLASS 2<br />
Fund No. 781 782<br />
CUSIP 355 150 871 355 150 426<br />
Inception 1 3/14/89 1/6/99<br />
CLASS 4<br />
Fund No. 735<br />
CUSIP 355 151 408<br />
Inception 1 2/28/08<br />
ANNUAL PROSPECTUS UPDATE AVAILABLE:<br />
May 1<br />
PORTFOLIO MANAGER/FUND TENURE 84<br />
Paul Varunok, 2004<br />
Joined <strong>Franklin</strong> <strong>Templeton</strong> in 2001<br />
Please see page 103 for general information<br />
and page 125 for important footnotes.<br />
<strong>Franklin</strong> Zero Coupon Fund – 2010<br />
INVESTMENT CATEGORY<br />
Fixed Income<br />
MAIN INVESTMENTS37 Seeks as high an investment<br />
return as is consistent with capital<br />
preservation. The fund normally<br />
invests at least 80% of its net assets<br />
in zero coupon debt securities.<br />
FUND REFERENCE<br />
CLASS 1 CLASS 2<br />
Fund No. 714 725<br />
CUSIP 355 150 830 355 150 459<br />
Inception 1 3/14/89 5/12/03<br />
ANNUAL PROSPECTUS UPDATE AVAILABLE:<br />
May 1<br />
PORTFOLIO MANAGER/FUND TENURE 84<br />
Kent C. Burns, CFA, 2002<br />
Joined <strong>Franklin</strong> <strong>Templeton</strong> in 1994<br />
Paul Varunok, 2006<br />
Joined <strong>Franklin</strong> <strong>Templeton</strong> in 2001<br />
Please see page 103 for general information<br />
and page 125 for important footnotes.<br />
CLASS 1 CLASS 2 CLASS 4<br />
$10,000 Hypothetical<br />
Investment from Inception53 FUND FACTS<br />
CLASS 1 CLASS 2 CLASS 4<br />
Net Assets (millions)<br />
Expense Ratio54 *Less than $100,000<br />
PORTFOLIO HOLDINGS29 $37,974 $36,976 $37,813<br />
$168.1 $500.8 $0.0*<br />
0.53% 0.78% 0.88%<br />
6/30<br />
Total Number of Positions 948<br />
TOP 10 HOLDINGS7 GNMA 44.81%<br />
FNMA 17.51<br />
Freddie Mac 9.77<br />
Federal Home Loan Bank 6.91<br />
U.S. Treasury Note/Bond 6.77<br />
Tennessee Valley Authority 2.43<br />
FICO 2.38<br />
Federal Farm Credit Bank 2.34<br />
Housing & Urban Development Co.<br />
Small Business Administration Participation<br />
0.66<br />
Certificates 0.65<br />
$10,000 Hypothetical<br />
Investment from Inception 53<br />
FUND FACTS<br />
Net Assets (millions)<br />
Expense Ratio54 CLASS 1 CLASS 2<br />
$55,784 $54,951<br />
CLASS 1 CLASS 2<br />
$117.7 $15.2<br />
0.68% 0.93%<br />
PORTFOLIO HOLDINGS 29 6/30<br />
Total Number of Positions 20<br />
TOP HOLDINGS7 Tennessee Valley Authority 23.35%<br />
U.S. Treasury Strip 19.28<br />
Freddie Mac 16.06<br />
FICO 12.48<br />
FNMA<br />
International Bank Reconstruction &<br />
8.49<br />
Development 8.39<br />
Resolution Funding 7.42<br />
6/30/09<br />
FUND-ONLY PERFORMANCE INFORMATION<br />
CUMULATIVE TOTAL RETURN– AVERAGE ANNUAL TOTAL RETURN–<br />
NO CONTRACT EXPENSES OR CHARGES13, 53 13, 53<br />
NO CONTRACT EXPENSES OR CHARGES<br />
YTD14 1 YR 3 YR 5 YR 10 YR INCEPTION 1 YR 3 YR 5 YR 10 YR INCEPTION<br />
CLASS 1 -0.25 4.71 21.08 27.34 91.02 457.84 4.71 6.58 4.95 6.69 8.84<br />
CLASS 2 -0.35 4.49 20.20 25.85 88.17 449.51 4.49 6.32 4.71 6.53 8.76<br />
ASSET ALLOCATION 29, 60 6/30<br />
Bonds 95%<br />
Cash 5%<br />
6/30/09<br />
FUND-ONLY PERFORMANCE INFORMATION<br />
CUMULATIVE TOTAL RETURN– AVERAGE ANNUAL TOTAL RETURN–<br />
NO CONTRACT EXPENSES OR CHARGES13, 53 13, 53<br />
NO CONTRACT EXPENSES OR CHARGES<br />
YTD14 1 YR 3 YR 5 YR 10 YR INCEPTION 1 YR 3 YR 5 YR 10 YR INCEPTION<br />
CLASS 1 1.13 7.31 22.19 28.82 76.33 279.74 7.31 6.91 5.19 5.84 6.80<br />
CLASS 2 1.01 7.11 21.28 27.27 71.95 269.76 7.11 6.64 4.94 5.57 6.66<br />
CLASS 4 1.00 7.02 21.67 28.27 75.59 278.13 7.02 6.76 5.11 5.79 6.77<br />
ASSET ALLOCATION 29, 60 6/30<br />
Bonds 95%<br />
Cash 5%<br />
DEALER USE ONLY/NOT FOR DISTRIBUTION TO THE PUBLIC Go to franklintempleton.com or call (800) 223-2141 <strong>Dealer</strong> <strong>Facts</strong> <strong>Guide</strong> 113<br />
VARIABLE INSURANCE FUNDS
VARIABLE INSURANCE FUNDS<br />
<strong>Templeton</strong> Global Bond Securities Fund 94 6/30/09<br />
INVESTMENT CATEGORY<br />
Fixed Income<br />
MAIN INVESTMENTS37 Seeks high current income, consistent<br />
with preservation of capital, with<br />
capital appreciation as a secondary<br />
consideration. The fund normally<br />
invests at least 80% of its net assets in<br />
bonds, which include debt securities<br />
of any maturity. The fund normally<br />
invests at least 40% of its net assets in<br />
foreign securities, may invest a portion<br />
of its total assets in bonds rated below<br />
investment grade and a significant portion<br />
of its assets in emerging markets.<br />
Formerly <strong>Templeton</strong> Global Income Securities<br />
Fund. Effective 5/1/09, the fund’s name and<br />
investment strategy changed. The investment<br />
goal remained the same.<br />
FUND REFERENCE<br />
CLASS 1 CLASS 2<br />
Fund No. 741 742<br />
CUSIP 355 150 707 355 150 566<br />
Inception1 1/24/89 1/6/99<br />
CLASS 4<br />
Fund No. 787<br />
CUSIP 355 151 887<br />
Inception 1 2/28/08<br />
ANNUAL PROSPECTUS UPDATE AVAILABLE:<br />
May 1<br />
PORTFOLIO MANAGER/FUND TENURE<br />
Please see page 103 for general information<br />
and page 125 for important footnotes.<br />
84<br />
Michael Hasenstab, Ph.D., 2002<br />
Joined <strong>Franklin</strong> <strong>Templeton</strong> in 1995<br />
Please see page 103 for general information<br />
and page 125 for important footnotes.<br />
FUND-ONLY PERFORMANCE INFORMATION<br />
CUMULATIVE TOTAL RETURN– AVERAGE ANNUAL TOTAL RETURN–<br />
NO CONTRACT EXPENSES OR CHARGES13, 53 13, 53<br />
NO CONTRACT EXPENSES OR CHARGES<br />
YTD14 1 YR 3 YR 5 YR 10 YR INCEPTION 1 YR 3 YR 5 YR 10 YR INCEPTION<br />
CLASS 1 7.57 13.08 36.45 63.34 155.25 397.11 13.08 10.92 10.31 9.82 8.17<br />
CLASS 2 7.45 12.79 35.41 61.24 148.96 384.06 12.79 10.63 10.03 9.55 8.02<br />
CLASS 4 7.41 12.66 35.86 62.63 154.14 394.96 12.66 10.76 10.22 9.78 8.14<br />
$10,000 Hypothetical<br />
Investment from Inception 53<br />
FUND FACTS<br />
Net Assets (millions)<br />
Expense Ratio54 CLASS 1 CLASS 2 CLASS 4<br />
$49,711 $48,406 $49,496<br />
CLASS 1 CLASS 2 CLASS 4<br />
$168.2 $977.7 $72.6<br />
0.58% 0.83% 0.93%<br />
PORTFOLIO HOLDINGS 29 6/30<br />
Total Number of Positions 149<br />
TOP 10 HOLDINGS7 Government of Mexico, 10.00% 5.48%<br />
Korea Treasury Bond, 0475-1112 4.56<br />
Government of France 3.03<br />
Government of Russia, 144A 2.90<br />
Government of Mexico, M 10 2.47<br />
Korea Treasury Bond, 0550-1709 2.43<br />
Government of Malaysia 2.31<br />
Government of Sweden 2.27<br />
Government of Poland 2.16<br />
Government of Russia, senior bond 2.11<br />
GEOGRAPHIC BREAKDOWN<br />
Asia 32.78%<br />
Europe/Africa/Middle East 30.82<br />
Americas 26.33<br />
Supranational 2.70<br />
114 <strong>Dealer</strong> <strong>Facts</strong> <strong>Guide</strong> Go to franklintempleton.com or call (800) 223-2141 DEALER USE ONLY/NOT FOR DISTRIBUTION TO THE PUBLIC
Separate Accounts<br />
<strong>Franklin</strong> <strong>Templeton</strong> Portfolio Advisors, Inc. (FTPA) offers private asset manage ment to individuals and institutional clients through financial<br />
advisors associated with wirehouse firms, regional broker/dealers, independent broker/dealers and banks (“Sponsors”). FTPA consists of<br />
two distinct firms: <strong>Franklin</strong> Portfolio Advisors (FPA, focused on U.S. equities and fixed income portfolios) and <strong>Templeton</strong> Portfolio Advisors<br />
(TPA, focused on international and global portfolios).<br />
Sponsor Availability †<br />
All Cap Growth<br />
FRANKLIN<br />
PORTFOLIO ADVISORS<br />
Multi Strategy Municipal<br />
Fixed Income<br />
Intermediate Fixed Income<br />
Intermediate Municipal<br />
Fixed Income<br />
INVESTMENT MINIMUM: ■ $40,000 ■ $45,000 ▲ $50,000 ▲ $75,000 ● $100,000 ● $150,000 ◆ $250,000 ◆ $1 Million/$5 Million 1<br />
†For more information on other portfolios, including FT Global Government Fixed Income; TPA<br />
Developed Markets ex-U.S. Equity; FT U.S. Core Fixed Income; FT U.S. Opportunistic Core Plus<br />
Fixed Income and FTCI U.S. Opportunistic Municipal Fixed Income, please contact your<br />
Consulting Services team at (800) 822-8464.<br />
Large Cap Value Balanced<br />
Large Cap Value<br />
Balanced–Municipal<br />
Large Cap Value–<br />
Yield Focus<br />
Mid Cap Growth<br />
Small Cap Growth<br />
Global Balanced<br />
Ameriprise<br />
Premier Portfolio Services ● 3 ◆ ●<br />
Global Equity<br />
Charles Schwab<br />
Access Program<br />
Edward Jones<br />
● ◆ ● ● ●<br />
Managed Account Program<br />
Fidelity<br />
◆ ● ●<br />
Network Program ● ●3 Goldman Sachs<br />
◆ ● ◆ ● ● ● ●<br />
Private Money Manager Program<br />
Linsco Private Ledger<br />
◆<br />
Select Program Recommended<br />
Lockwood<br />
◆ ●<br />
Command Program<br />
Merrill Lynch<br />
● ● ◆ ● ● ●<br />
Consults ◆ ◆ ●<br />
Strategic Portfolio Advisor ◆ ◆ ◆<br />
UMA<br />
Morgan Stanley Smith Barney<br />
◆<br />
Access ● ●3◆● ◆ ● ● ● ●<br />
Vision ◆ ◆ ◆ ◆ ◆ ◆ ◆ ◆<br />
Personal Portfolio ■ ▲2 ▲ ● ■<br />
Fiduciary Services ● ● ◆ ● ◆ ● ● ● ●<br />
Consulting and Evaluation Services ◆ ◆<br />
Select UMA<br />
Prudential<br />
▲ ● ▲<br />
Managed Asset Program<br />
UBS<br />
● ◆ ● ●<br />
Access<br />
Wells Fargo Advisors<br />
◆<br />
Wells Select ●3 ◆ ● ◆ ● ●<br />
Overland Select ●3 ◆ ● ◆ ● ●<br />
Strategic Portfolio ◆3 ●<br />
Masters ● ◆ ● ●<br />
Private Advisor Network ◆ ◆ ◆ ◆ ◆ ◆ ◆ ◆ ◆ ◆ ◆<br />
TEMPLETON<br />
PORTFOLIO ADVISORS<br />
International Equity<br />
6/30/09<br />
1. $1 Million for Standard Advisory Accounts; $5 Million for DVP/Best Execution Accounts.<br />
2. The FPA U.S. Government Bond Fixed Income portfolio is available as a sleeve in Morgan<br />
Stanley’s PPA program<br />
3. The FPA Investment Grade Credit portfolio is also available .<br />
DEALER USE ONLY/NOT FOR DISTRIBUTION TO THE PUBLIC Go to franklintempleton.com or call (800) 223-2141 <strong>Dealer</strong> <strong>Facts</strong> <strong>Guide</strong> 115<br />
SEPARATE ACCOUNTS
SEPARATE ACCOUNTS<br />
FRANKLIN PORTFOLIO ADVISORS Data as of 3/31/09<br />
All Cap Growth<br />
BENCHMARK<br />
Russell 3000 ® Growth Index<br />
INVESTMENT PHILOSOPHY<br />
FPA utilizes <strong>Franklin</strong>’s bottom-up,<br />
fundamental approach to selecting<br />
securities, whose market valuation<br />
FPA believes does not properly reflect<br />
future growth prospects, may yield<br />
above-average, risk adjusted rates<br />
of return over the long term.<br />
INVESTMENT PROCESS<br />
FPA’s portfolio managers and<br />
analysts apply a disciplined,<br />
bottom-up approach to selecting<br />
stocks at all capitalization levels<br />
and examine the entire structure<br />
of a company and follow it through<br />
its growth cycle.<br />
INVESTMENT MINIMUM<br />
$100,000<br />
INCEPTION<br />
March 31, 2006<br />
LEAD PORTFOLIO MANAGER 84<br />
Frank Felicelli, CFA<br />
Years with Firm: 23<br />
Years Industry Experience: 29<br />
For disclosure and footnotes, please see<br />
page 120.<br />
PERFORMANCE SUMMARY 1<br />
TOTAL RETURNS (%) 2<br />
“PURE” GROSS<br />
NET<br />
BENCHMARK<br />
1-QTR 1-YR 3-YR INCEPTION<br />
-4.9 -30.6 -11.1 -10.5<br />
-5.3 -31.7 -12.7 -12.0<br />
-4.5 -34.4 -11.7 -10.9<br />
HISTORICAL PERFORMANCE (USD %)<br />
YTD<br />
2000 2001 2002 2003 2004 2005 2006 2007 2008 2009<br />
“PURE” GROSS<br />
— — — — — — 3.8 15.2 -36.3 -4.9<br />
NET<br />
BENCHMARK<br />
— — — — — — 3.4 13.3 -37.4 -5.3<br />
-22.4 -19.6 -28.0 31.0 6.9 5.2 9.5 11.4 -38.4 -4.5<br />
MODEL PORTFOLIO CHARACTERISTICS<br />
Number of Stock Holdings 78<br />
Weighted Average Market Cap (US$m) 3 30,308<br />
Weighted Average Forward Price to Earnings 3 15.6x<br />
Weighted Average Price to Book 3 2.7x<br />
Weighted Average Price to Sales 3 3.3x<br />
Weighted Average Long Term Debt to Capital 23.3%<br />
Weighted Average Price to Cash Flow 3 9.2x<br />
Weighted Average Historical 3-Year Sales Growth 23.0%<br />
Weighted Average Historical 3-Year Earnings<br />
Per Share Growth 24.2%<br />
Trailing 12-Month Portfolio Turnover 37.6%<br />
Expected Annual Turnover Range 35%–65%<br />
For more performance information, please contact your Consulting Services team at 1-800/822-8464.<br />
PERFORMANCE SUMMARY 1<br />
TOTAL RETURNS (%) 2<br />
“PURE” GROSS<br />
NET<br />
BENCHMARK<br />
SECTOR BREAKDOWN 4<br />
Software and Services 5 19.7%<br />
Technology Hardware 5 14.2<br />
Semiconductors 5 2.6<br />
Health Care 18.2<br />
Industrials 10.5<br />
Energy 10.0<br />
Consumer Staples 8.7<br />
Materials 4.7<br />
Consumer Discretionary 4.0<br />
Financials 3.7<br />
Telecommunication Services 3.2<br />
Utilities 0.5<br />
FRANKLIN PORTFOLIO ADVISORS Data as of 3/31/09<br />
Intermediate Fixed Income<br />
BENCHMARK<br />
Barclays Capital U.S. Intermediate<br />
Government/Credit Bond Index<br />
INVESTMENT PHILOSOPHY<br />
<strong>Franklin</strong> Portfolio Advisors invests<br />
in high quality bonds, taking advantage<br />
of relative valuation differences<br />
between asset classes, sectors,<br />
issuers and individual bond issues,<br />
with the objective of producing a<br />
high level current income and generating<br />
total return opportunities.<br />
INVESTMENT PROCESS<br />
Our intermediate fixed income<br />
team follows a disciplined, client<br />
specific process that includes using<br />
proprietary, relative analysis to<br />
make top-down allocation decisions<br />
among U.S. government bonds,<br />
U.S. agency securities and corporate<br />
bonds.<br />
INVESTMENT MINIMUM<br />
$100,000<br />
INCEPTION<br />
March 31, 1994<br />
LEAD PORTFOLIO MANAGER 84<br />
Frank Felicelli, CFA<br />
Years with Firm: 23<br />
Years Industry Experience: 29<br />
For disclosure and footnotes, please see<br />
page 120.<br />
1-QTR 1-YR 3-YR 5-YR 10-YR<br />
-0.4 2.8 6.0 3.8 5.3<br />
-0.6 1.7 4.9 2.7 4.3<br />
-0.1 2.0 5.6 3.7 5.4<br />
HISTORICAL PERFORMANCE (%)<br />
YTD<br />
2000 2001 2002 2003 2004 2005 2006 2007 2008 2009<br />
“PURE” GROSS<br />
10.2 7.5 10.3 3.6 3.1 0.6 4.2 7.8 6.1 -0.4<br />
NET<br />
9.2 6.5 9.2 2.5 2.0 -0.5 3.1 6.6 5.0 -0.6<br />
BENCHMARK<br />
10.1 9.0 9.8 4.3 3.0 1.6 4.1 7.4 5.1 -0.1<br />
MODEL PORTFOLIO CHARACTERISTICS<br />
Weighted Average Coupon 5.5%<br />
Weighted Average Current Yield 5.3%<br />
Weighted Average Yield to Worst 3.7%<br />
Weighted Average Yield to Maturity 3.7%<br />
Weighted Average Price $103.98<br />
Weighted Average External Bond Rating AA2/AA3<br />
Weighted Average Maturity 4.5 Years<br />
Weighted Average Modified Adjusted Duration 3.6 Years<br />
Expected Annual Turnover Range 15%–30%<br />
Number of Bond Holdings Range 10–25<br />
For more performance information, please contact your Consulting Services team at 1-800/822-8464.<br />
SECTOR BREAKDOWN 4<br />
Investment Grade Credit 47.4%<br />
U.S. Treasury 26.6<br />
U.S. Government Agency 26.0<br />
116 <strong>Dealer</strong> <strong>Facts</strong> <strong>Guide</strong> Go to franklintempleton.com or call (800) 223-2141 DEALER USE ONLY/NOT FOR DISTRIBUTION TO THE PUBLIC
FRANKLIN PORTFOLIO ADVISORS Data as of 3/31/09<br />
Intermediate Municipal Fixed Income<br />
BENCHMARK<br />
Barclays Capital Bond Index<br />
INVESTMENT PHILOSOPHY<br />
Investing in current coupon bonds<br />
may provide a steady stream of<br />
income and is intended to give our<br />
clients the highest possible tax-free<br />
income coupled with preservation<br />
of capital.<br />
INVESTMENT PROCESS<br />
<strong>Franklin</strong> Portfolio Advisors’ munic ipal<br />
bond team evaluates the structure<br />
and liquidity of municipal<br />
bonds and conducts a stringent<br />
credit analysis to identify securities<br />
selling at prices they consider<br />
attractive.<br />
INVESTMENT MINIMUM<br />
$250,000<br />
INCEPTION<br />
March 31, 1995<br />
LEAD PORTFOLIO MANAGER 84<br />
Frank Felicelli, CFA<br />
Years with Firm: 23<br />
Years Industry Experience: 29<br />
For disclosure and footnotes, please see<br />
page 120.<br />
PERFORMANCE SUMMARY 1<br />
TOTAL RETURNS (%) 2<br />
“PURE” GROSS<br />
NET<br />
INDEX<br />
1-QTR 1-YR 3-YR 5-YR 10-YR<br />
2.8 4.3 4.5 3.6 4.7<br />
2.6 3.5 3.7 2.7 3.8<br />
4.2 2.3 3.2 3.2 4.6<br />
HISTORICAL PERFORMANCE (%)<br />
YTD<br />
2000 2001 2002 2003 2004 2005 2006 2007 2008 2009<br />
“PURE” GROSS<br />
10.7 5.0 9.5 5.3 3.5 2.4 4.3 4.6 1.7 2.8<br />
NET<br />
INDEX<br />
9.7 4.1 8.5 4.4 2.7 1.5 3.5 3.7 0.9 2.6<br />
11.7 5.1 9.6 5.3 4.5 3.5 4.9 3.4 -2.5 4.2<br />
MODEL PORTFOLIO CHARACTERISTICS<br />
Weighted Average Coupon 4.6%<br />
Weighted Average Current Yield 4.4%<br />
Weighted Average Yield to Worst 3.7%<br />
Weighted Average Yield to Maturity 3.9%<br />
Weighted Average Price $103.14<br />
Weighted Average External Bond Rating AA2<br />
Weighted Average Maturity 9.6 Years<br />
Weighted Average Modified Adjusted Duration 7.4 Years<br />
Expected Annual Turnover Range 10%–20%<br />
Number of Bond Holdings Range 5–15<br />
For more information, please contact your Consulting Services team at 1-800/822-8464.<br />
SECTOR BREAKDOWN 4<br />
Education 37.5%<br />
Capital Improvements 34.9<br />
Utilities 15.9<br />
Transportation 5.4<br />
Public Power 3.4<br />
Other 3.0<br />
FRANKLIN PORTFOLIO ADVISORS Data as of 3/31/09<br />
Mid Cap Growth<br />
BENCHMARK<br />
Russell Midcap Growth Index<br />
INVESTMENT PHILOSOPHY<br />
Employing a disciplined, long-term,<br />
bottom-up approach to mid-cap<br />
growth equity investing, backed by<br />
extensive fundamental analysis, may<br />
produce favorable results over time.<br />
INVESTMENT PROCESS<br />
<strong>Franklin</strong> Portfolio Advisors’ port folio<br />
managers and analysts apply a<br />
disciplined, bottom-up approach to<br />
selecting stocks, within the market<br />
cap range of the Russell Midcap<br />
Growth Index.<br />
INVESTMENT MINIMUM<br />
$100,000<br />
INCEPTION<br />
May 31, 2005<br />
LEAD PORTFOLIO MANAGER 84<br />
Frank Felicelli, CFA<br />
Years with Firm: 23<br />
Years Industry Experience: 29<br />
For disclosure and footnotes, please see<br />
page 120.<br />
PERFORMANCE SUMMARY1 TOTAL RETURNS (%) 2<br />
1-QTR 1-YR 3-YR INCEPTION<br />
“PURE” GROSS<br />
-1.6 -31.3 -11.2 -4.2<br />
NET<br />
-2.1 -32.7 -13.0 -5.9<br />
INDEX<br />
-3.4 -39.6 -14.9 -7.4<br />
HISTORICAL PERFORMANCE (%)<br />
YTD<br />
2000 2001 2002 2003 2004 2005 2006 2007 2008 2009<br />
“PURE” GROSS<br />
— — — — — — 9.9 14.0 -39.6 -1.6<br />
NET<br />
— — — — — — 8.1 11.8 -40.8 -2.1<br />
INDEX<br />
-11.8 -20.2 -27.4 42.7 15.5 12.1 10.7 11.4 -44.3 -3.4<br />
MODEL PORTFOLIO CHARACTERISTICS<br />
Number of Stock Holdings 77<br />
Weighted Average Dividend Yield (gross) 6 0.6%<br />
Weighted Average Market Cap (US$m) 6 4,795<br />
Weighted Average Current Price to Earnings 6 14.8x<br />
Weighted Average Forward Estimated Price to Earnings 6 14.8x<br />
Weighted Average Price to Book 6 2.2x<br />
Weighted Average Price to Sales 2.7x<br />
Weighted Average Long-Term Debt to Capital 26.7%<br />
Weighted Average Estimated 3–5 Year EPS Growth 16.9%<br />
Trailing 12-Month Portfolio Turnover 73.6%<br />
Annual Turnover Range 50%–100%<br />
For more performance information, please contact your Consulting Services team at 1-800/822-8464.<br />
SECTOR BREAKDOWN 4<br />
Software and Services 5 14.6%<br />
Technology Hardware 5 6.0<br />
Semiconductors 5 5.1<br />
Health Care 25.7<br />
Industrials 14.1<br />
Consumer Discretionary 10.0<br />
Energy 10.0<br />
Telecommunication Services 3.8<br />
Consumer Staples 4.3<br />
Financials 4.1<br />
Materials 1.1<br />
Utilities 1.4<br />
DEALER USE ONLY/NOT FOR DISTRIBUTION TO THE PUBLIC Go to franklintempleton.com or call (800) 223-2141 <strong>Dealer</strong> <strong>Facts</strong> <strong>Guide</strong> 117<br />
SEPARATE ACCOUNTS
SEPARATE ACCOUNTS<br />
FRANKLIN PORTFOLIO ADVISORS Data as of 3/31/09<br />
Multi Strategy Municipal Fixed Income<br />
BENCHMARK<br />
Barclays Capital<br />
Municipal Bond Index<br />
INVESTMENT PHILOSOPHY<br />
We believe a portfolio composed of<br />
individual current coupon bonds<br />
and a pooled investment vehicle<br />
that invests in high-yield, tax free<br />
municipal securities will provide a<br />
steady stream of income and is<br />
intended to give the highest possible<br />
tax-free income coupled with<br />
preservation of capital.<br />
INVESTMENT PROCESS<br />
Approximately 60% of the port folio<br />
invests in individual municipal bonds<br />
managed by <strong>Franklin</strong> Portfolio<br />
Advisors and 40% of the portfolio<br />
invests in a high yield, tax-free<br />
pooled investment vehicle that<br />
invests in high-yield, tax-free<br />
munic ipal securities managed by<br />
FPA’s affiliate, <strong>Franklin</strong> Advisers, Inc.<br />
INVESTMENT MINIMUM<br />
$250,000<br />
INCEPTION<br />
September 30, 2006<br />
LEAD PORTFOLIO MANAGER84 Frank Felicelli, CFA<br />
Years with Firm: 23<br />
Years Industry Experience: 29<br />
For disclosure and footnotes, please see<br />
page 120.<br />
PERFORMANCE SUMMARY 1<br />
TOTAL RETURNS (%) 2<br />
“PURE” GROSS<br />
NET<br />
BENCHMARK<br />
1-QTR 1-YR INCEPTION<br />
4.6 -1.0 0.9<br />
4.4 -1.8 0.1<br />
4.2 2.3 2.5<br />
HISTORICAL PERFORMANCE (USD %)<br />
YTD<br />
2000 2001 2002 2003 2004 2005 2006 2007 2008 2009<br />
“PURE” GROSS<br />
— — — — — — — 2.6 -5.9 4.6<br />
NET<br />
— — — — — — — 1.8 -6.7 4.4<br />
BENCHMARK<br />
11.7 5.1 9.6 5.3 4.5 3.5 4.9 3.4 -2.5 4.2<br />
MODEL PORTFOLIO CHARACTERISTICS<br />
Weighted Average External Bond Rating A1/A2<br />
Weighted Average Maturity 12.6 Years<br />
Weighted Average Yield to Maturity 5.1%<br />
Weighted Average Modified Adjusted Duration 8.0 Years<br />
Weighted Average Coupon 7 5.1%<br />
Weighted Average Current Yield 5.4%<br />
Weighted Average Yield to Worst 4.7%<br />
Weighted Average Price 8 $96.42<br />
Weighted Average Gross Yield 9 5.4%<br />
Expected Annual Turnover Range 10%–20%<br />
Number of Bond Holdings Range 2–10<br />
For more information, please contact your Consulting Services team at 1-800/822-8464.<br />
PERFORMANCE SUMMARY 1<br />
TOTAL RETURNS (%) 2<br />
“PURE” GROSS<br />
NET<br />
INDEX<br />
FINANCING 4<br />
Revenue Bonds 65.2%<br />
General Obligations 30.9<br />
Certificates of Participation 4.0<br />
FRANKLIN PORTFOLIO ADVISORS Data as of 3/31/09<br />
Small Cap Growth<br />
BENCHMARK<br />
Russell 2000 ® Growth Index<br />
INVESTMENT PHILOSOPHY<br />
Investing early in companies that<br />
are sector leaders in their emerging<br />
growth phase with sustainable,<br />
competitive advantages can achieve<br />
superior, long-term results.<br />
INVESTMENT PROCESS<br />
<strong>Franklin</strong> Portfolio Advisors’ port folio<br />
managers and analysts apply<br />
a disciplined, bottom-up approach<br />
to selecting small-cap stocks. They<br />
look for companies demonstrating<br />
distinct competitive advantages and<br />
the potential for sustainable growth<br />
that may not be reflected in current<br />
valuations.<br />
INVESTMENT MINIMUM<br />
$100,000<br />
INCEPTION<br />
December 31, 1997<br />
LEAD PORTFOLIO MANAGER 84<br />
Frank Felicelli, CFA<br />
Years with Firm: 23<br />
Years Industry Experience: 29<br />
1-QTR 1-YR 3-YR 5-YR 10-YR<br />
-13.0 -34.1 -15.2 -4.6 4.4<br />
-13.4 -35.1 -16.4 -5.9 2.7<br />
-9.7 -36.4 -16.2 -5.4 -1.6<br />
HISTORICAL PERFORMANCE (%)<br />
YTD<br />
2000 2001 2002 2003 2004 2005 2006 2007 2008 2009<br />
“PURE” GROSS<br />
9.3 -8.5 -25.8 42.3 19.8 4.7 11.0 3.5 -33.3 -13.0<br />
NET<br />
6.8 -10.0 -27.0 40.0 18.0 3.3 9.3 2.1 -34.3 -13.4<br />
INDEX<br />
-22.4 -9.2 -30.3 48.5 14.3 4.2 13.4 7.1 -38.5 -9.7<br />
MODEL PORTFOLIO CHARACTERISTICS<br />
Number of Stock Holdings 62<br />
Weighted Average Dividend Yield 10 1.1%<br />
Weighted Average Market Cap (US$m) 10 609<br />
Weighted Average Current Price to Earnings 10 13.3x<br />
Weighted Average Forward Price to Earnings 10 14.1x<br />
Weighted Average Price to Book 10 1.0x<br />
Weighted Average Price to Sales 10 1.2x<br />
Weighted Average Debt to Capital 20.7%<br />
Weighted Average Estimated Long-Term Earnings Growth 15.7%<br />
Trailing 12-Month Portfolio Turnover 30.0%<br />
Expected Annual Turnover Range 30%–90%<br />
For disclosure and footnotes, please see<br />
page 120. For more performance information, please contact your Consulting Services team at 1-800/822-8464.<br />
SECTOR BREAKDOWN 4<br />
Technology Hardware 5 19.4%<br />
Software and Services 5 11.0<br />
Semiconductors 5 7.6<br />
Heath Care 17.3<br />
Consumer Discretionary 12.6<br />
Industrials 12.3<br />
Financials 5.8<br />
Consumer Staples 5.0<br />
Energy 3.7<br />
Telecommunication Services 3.1<br />
Materials 2.4<br />
118 <strong>Dealer</strong> <strong>Facts</strong> <strong>Guide</strong> Go to franklintempleton.com or call (800) 223-2141 DEALER USE ONLY/NOT FOR DISTRIBUTION TO THE PUBLIC
TEMPLETON PORTFOLIO ADVISORS Data as of 3/31/09<br />
Global Equity<br />
BENCHMARK<br />
MSCI AC World Index<br />
INVESTMENT PHILOSOPHY<br />
Employing a value-oriented,<br />
bottom-up, patient approach to<br />
investing, <strong>Templeton</strong> Portfolio<br />
Advisors believes that undervalued<br />
securities may be recognized by<br />
the market over time.<br />
INVESTMENT PROCESS<br />
<strong>Templeton</strong> Portfolio Advisors’<br />
approach begins with over 10,000<br />
companies. Analysts perform indepth<br />
analysis on stocks, which<br />
are further scrutinized by research<br />
teams. Approved stocks are added<br />
to the Bargain List and considered<br />
for portfolio investment.<br />
INVESTMENT MINIMUM<br />
$100,000<br />
INCEPTION<br />
February 29, 1992<br />
LEAD PORTFOLIO MANAGER84 Patrick J. McCall, CFA<br />
Years with Firm: 13<br />
Years Industry Experience: 26<br />
For disclosure and footnotes, please see<br />
page 120.<br />
PERFORMANCE SUMMARY 1<br />
TOTAL RETURNS (%) 2<br />
“PURE” GROSS<br />
NET<br />
INDEX<br />
1-QTR 1-YR 3-YR 5-YR 10-YR<br />
-12.4 -38.5 -11.1 -1.6 0.8<br />
-12.8 -39.7 -12.8 -3.4 -1.2<br />
-10.6 -42.7 -12.8 -2.4 -1.3<br />
HISTORICAL PERFORMANCE (%)<br />
YTD<br />
2000 2001 2002 2003 2004 2005 2006 2007 2008 2009<br />
“PURE” GROSS -3.9 -9.7 -21.3 39.1 15.4 9.1 24.4 9.7 -37.3 -12.4<br />
NET<br />
-5.9 -11.5 -23.0 36.4 13.4 7.1 22.1 7.7 -38.5 -12.8<br />
INDEX<br />
-13.9 -15.9 -19.0 34.6 15.8 11.4 21.5 12.2 -41.9 -10.6<br />
MODEL PORTFOLIO CHARACTERISTICS<br />
Number of Stock Holdings11 70–100<br />
Median Market Cap (US$m) 13,797<br />
Weighted Average Dividend Yield 3.9%<br />
Weighted Average Price to Earnings 10.1x<br />
Weighted Average Price to Book 1.4x<br />
Weighted Average Price to Cash Flow 4.8x<br />
Weighted Average Market Cap (US$m) 44,631<br />
Expected Annual Turnover Range 20%–25%<br />
PERFORMANCE SUMMARY 1<br />
TOTAL RETURNS (%) 2<br />
“PURE” GROSS<br />
NET<br />
INDEX<br />
GEOGRAPHIC BREAKDOWN 13<br />
Europe 48.6%<br />
North America 34.7<br />
Asia ex-Japan 7.3<br />
Japan 5.7<br />
Mid East/Africa 1.9<br />
Australia/New Zealand 0.4<br />
Latin America/Caribbean 1.4<br />
Total Emerging Markets 8.5<br />
TEMPLETON PORTFOLIO ADVISORS Data as of 3/31/09<br />
International Equity<br />
BENCHMARK<br />
MSCI AC World ex-U.S. Index<br />
INVESTMENT PHILOSOPHY<br />
Employing a value-oriented,<br />
bottom-up, patient approach to<br />
investing, <strong>Templeton</strong> Portfolio<br />
Advisors believes that undervalued<br />
securities may be recognized by the<br />
market over time.<br />
INVESTMENT PROCESS<br />
<strong>Templeton</strong> Portfolio Advisors’<br />
approach begins with over 10,000<br />
companies. Analysts perform indepth<br />
analysis on stocks, which are<br />
further scrutinized by research<br />
teams. Approved stocks are added<br />
to the Bargain List and considered<br />
for portfolio investment.<br />
INVESTMENT MINIMUM<br />
$100,000<br />
INCEPTION<br />
February 29, 1992<br />
LEAD PORTFOLIO MANAGER84 Patrick J. McCall, CFA<br />
Years with Firm: 13<br />
Years Industry Experience: 26<br />
For disclosure and footnotes, please see<br />
page 120.<br />
For more information, please contact your Consulting Services team at 1-800/822-8464.<br />
1-QTR 1-YR 3-YR 5-YR 10-YR<br />
-14.2 -41.0 -11.0 -0.1 1.3<br />
-14.5 -41.9 -12.2 -1.4 0.0<br />
-10.6 -46.2 -12.8 -0.2 0.9<br />
HISTORICAL PERFORMANCE (%)<br />
YTD<br />
2000 2001 2002 2003 2004 2005 2006 2007 2008 2009<br />
“PURE” GROSS -6.2 -12.7 -22.6 41.6 20.3 13.0 25.7 15.0 -39.1 -14.2<br />
NET<br />
-7.3 -13.7 -23.5 39.8 18.8 11.7 24.2 13.5 -40.0 -14.5<br />
INDEX<br />
-15.1 -19.5 -14.7 41.4 21.4 17.1 27.2 17.1 -45.2 -10.6<br />
MODEL PORTFOLIO CHARACTERISTICS<br />
Number of Stock Holdings12 60–100<br />
Median Market Cap (US$m) 12,682<br />
Weighted Average Dividend Yield 4.8%<br />
Weighted Average Price to Earnings 9.8x<br />
Weighted Average Price to Book 1.3x<br />
Weighted Average Price to Cash Flow 4.4x<br />
Weighted Average Market Cap (US$m) 42,074<br />
Expected Annual Turnover Range 20%–25%<br />
For more performance information, please contact your Consulting Services team at 1-800/822-8464.<br />
GEOGRAPHIC BREAKDOWN 13<br />
Europe 72.7%<br />
Asia ex-Japan 13.0<br />
Japan 8.8<br />
Mid East/Africa 2.5<br />
Latin America/Caribbean 1.6<br />
Australia/New Zealand 1.3<br />
North America ex-U.S. 0.3<br />
Total Emerging Markets 12.2<br />
DEALER USE ONLY/NOT FOR DISTRIBUTION TO THE PUBLIC Go to franklintempleton.com or call (800) 223-2141 <strong>Dealer</strong> <strong>Facts</strong> <strong>Guide</strong> 119<br />
SEPARATE ACCOUNTS
SEPARATE ACCOUNTS<br />
DISCLOSURES<br />
FRANKLIN PORTFOLIO ADVISORS<br />
<strong>Franklin</strong> Portfolio Advisors claims compliance with the Global Investment Performance<br />
Standards (GIPS ® ).<br />
<strong>Franklin</strong> Portfolio Advisors (“FPA” or the “firm”) manages domestic equity and fixed income<br />
portfolios for high-net-worth individuals and institutional clients, applying a bottom-up,<br />
research-oriented process that utilizes proprietary screening models and top-down risk controls<br />
in managing its portfolios. FPA is a division of <strong>Franklin</strong> <strong>Templeton</strong> Portfolio Advisors, Inc.<br />
(“FTPA”), a subsidiary of <strong>Franklin</strong> Resources, Inc. (“FRI”). In addition to relying on its own<br />
portfolio managers and analysts, FPA utilizes the experience, resources, and extensive research<br />
capabilities of affiliated <strong>Franklin</strong> entities (together, the firm “<strong>Franklin</strong>”), to conduct rigorous<br />
fundamental and quantitative analysis for equity, fixed income (taxable and tax-free) and other<br />
related strategies. At FPA, brokerage, administrative, custodial and investment management<br />
fees are charged together as a percentage of the portfolios’ assets (comprehensive fee or “wrap<br />
fee”) or may in some instances be charged separately (unbundled fee).<br />
The FPA All Cap Growth composite consists of all fully discretionary accounts managed by FPA<br />
with an all-cap growth investment objective and for which the brokerage, custodial, and<br />
investment management fees are charged together as a percentage of the portfolios’ assets<br />
(“wrap fee”). The primary benchmark for this composite is the Russell 3000 ® Growth Index.<br />
The FPA Intermediate Fixed Income composite consists of all fully discretionary portfolios<br />
managed by FPA with an intermediate fixed income investment objective and for which the<br />
brokerage, custodial, and investment management fees are charged together as a percentage<br />
of the portfolios’ assets (“wrap fee”). The primary benchmark for this composite is the Barclays<br />
Capital U.S. Intermediate Government/Credit Bond Index.<br />
The FPA Intermediate Municipal Fixed Income composite consists of all fully discretionary<br />
portfolios managed by FPA with an intermediate municipal fixed income investment objective<br />
and for which the brokerage, custodial, and investment management fees are charged together<br />
as a percentage of the portfolios’ assets (“wrap fee”). The primary benchmark for this<br />
composite is the Barclays Capital Municipal Bond Index.<br />
The FPA Large Cap Value Balanced composite consists of all fully discretionary accounts<br />
managed by FPA with a large-cap value balanced investment objective and for which the<br />
brokerage (including trading expenses), administrative, custodial, and investment<br />
management fees are charged separately (“wrap fee”).<br />
The FPA Large Cap Value Balanced-Municipal composite consists of all fully discretionary<br />
accounts managed by FPA with a large-cap value balanced-municipal investment objective<br />
and for which the brokerage (including trading expenses), administrative, custodial, and<br />
investment management fees are charged separately (“wrap fee”).<br />
The FPA Large Cap Value Yield-Focus composite consists of all fully discretionary accounts<br />
managed by FPA with a large-cap value-yield focus investment objective and for which the<br />
brokerage (including trading expenses), administrative, custodial, and investment<br />
management fees are charged separately (“wrap fee”).<br />
The FPA Mid Cap Growth composite consists of all fully discretionary accounts managed by<br />
FPA with a mid-cap growth investment objective and for which the brokerage, custodial, and<br />
investment management fees are charged together as a percentage of the portfolios’ assets<br />
(“wrap fee”). The primary benchmark for this composite is the Russell Midcap TM Growth Index.<br />
The FPA Multi Strategy Municipal Fixed Income composite consists of all fully discretionary<br />
portfolios managed by FPA with a high yield fixed income investment objective and for which<br />
the brokerage, custodial, and investment management fees are charged together as a<br />
percentage of the portfolios’ assets (“wrap fee”). The strategy is a blend of an existing FPA<br />
strategy, represented by the FPA Intermediate Municipal Fixed Income composite described<br />
below, and the <strong>Franklin</strong> High Yield Tax-Free composite, which consists of a single pooled<br />
investment vehicle managed by <strong>Franklin</strong> (another firm within the <strong>Franklin</strong> <strong>Templeton</strong> complex),<br />
which invests in high yield tax-free municipal securities. The strategy consists of a 60%<br />
allocation to municipal fixed income and a 40% allocation to high yield municipal fixed income.<br />
Brokerage, custodial, and investment management fees will be charged together as a<br />
percentage of the portfolios’ assets (“wrap fee”) for this strategy. The primary benchmark for<br />
this composite is the Barclays Capital Municipal Bond Index.<br />
The FPA Small Cap Growth composite consists of all fully discretionary accounts managed by<br />
FPA with a small-cap growth investment objective and for which the brokerage, custodial, and<br />
investment management fees are charged together as a percentage of the portfolios’ assets<br />
(“wrap fee”). The primary benchmark for this composite is the Russell 2000 ® Growth Index.<br />
All returns are presented in U.S. dollars and have been calculated using time-weighted total rates<br />
of return. Net-of-fees returns have been reduced by the total “wrap fee” which includes brokerage<br />
fees (including trading expenses), administrative, custodial, and investment management fees.<br />
Gross performance presented is “pure” gross-of-fees returns, which are before wrap fees,<br />
including brokerage fees related to trading expenses. “Pure” gross-of-fees returns are presented<br />
as supplemental information only. Both net- and “pure” gross-of-fees returns assume the<br />
reinvestment of dividends, interest, and realized and unrealized capital gains and losses. Past<br />
performance does not guarantee future results and results may differ over future time periods.<br />
The performance presented for <strong>Franklin</strong> Portfolio Advisors is in compliance with GIPS ® from<br />
January 1, 2002. FPA is not claiming compliance for the performance prior to that date on the<br />
basis that FPA cannot rely fully on the accuracy of the omnibus account information supplied<br />
by the broker/sponsors for those earlier years.<br />
To receive a complete list and description of FPA’s composites and/or a presentation that<br />
adheres to the GIPS ® standards contact your <strong>Franklin</strong> <strong>Templeton</strong> Portfolio Advisors<br />
representative at (800) 822-8464 or visit www.franklintempleton.com/separateaccounts.<br />
6/30/09<br />
TEMPLETON PORTFOLIO ADVISORS<br />
<strong>Templeton</strong> Portfolio Advisors claims compliance with the Global Investment<br />
Performance Standards (GIPS ® ).<br />
<strong>Templeton</strong> Portfolio Advisors (“TPA”) manages portfolios for high-net-worth individuals and<br />
institutional clients, applying a bottom-up, value-oriented, long-term investment style, focusing on<br />
global and non-U.S. markets. In addition to relying on its own portfolio managers and analysts,<br />
TPA utilizes the experience, resources, and extensive research capabilities of affiliated <strong>Templeton</strong><br />
entities (together, the firm “<strong>Templeton</strong>”) that apply the same bottom-up, value-oriented global<br />
investment style. At TPA, brokerage, administrative, custodial and investment management fees<br />
may be charged together as a percentage of the portfolios’ assets (comprehensive fee or “wrap<br />
fee”) or may in some instances be charged separately (unbundled fee).<br />
The TPA International Equity composite composite consists of all of the fully discretionary wrapfee<br />
portfolios which have a non-U.S. equity investment objective and for which the brokerage<br />
(including trading expenses), administrative, custodial, and investment management fees are<br />
charged together as a percentage of the portfolio’s assets (known as a “wrap fee” or bundled<br />
fee). The primary benchmark for this composite is the MSCI All Country World ex-U.S. Index.<br />
The TPA Global Equity composite composite consists of all of the fully discretionary wrap-fee<br />
portfolios which have a global (U.S. and non-U.S.) equity investment objective and for which<br />
the brokerage (including trading expenses), administrative, custodial, and investment<br />
management fees are charged together as a percentage of the portfolio’s assets (known as a “wrap<br />
fee” or bundled fee). The primary benchmark for this composite is the MSCI All Country World Index.<br />
All returns are presented in U.S. dollars and have been calculated using time-weighted total<br />
rates of return. Net-of-fees returns have been reduced by the total “wrap fee” which includes<br />
brokerage fees (including trading expenses), administrative, custodial, and investment<br />
management fees. Gross performance returns presented are “pure” gross-of-fees returns,<br />
which are before wrap fees, including brokerage fees related to trading expenses. “Pure” grossof-fees<br />
returns are presented as supplemental information only. Both net- and “pure” gross-offees<br />
returns assume the reinvestment of dividends, interest, and realized and unrealized<br />
capital gains and losses. Past performance does not guarantee future results and results<br />
may differ over future time periods.<br />
All MSCI data is provided “as is.” The composite described herein is not sponsored or endorsed<br />
by MSCI. In no event shall MSCI, its affiliates or any MSCI data provider have any liability of any<br />
kind in connection with the MSCI data or the composite described herein. Copying or<br />
redistributing MSCI data is strictly prohibited.<br />
To receive a complete list and description of TPA’s composites and/or a presentation that<br />
adheres to the GIPS ® standards contact your <strong>Franklin</strong> <strong>Templeton</strong> Portfolio Advisors<br />
representative at (800) 822-8464 or visit www.franklintempleton.com/separateaccounts.<br />
FOOTNOTES<br />
1. The information and opinions stated are based on the composite unless otherwise indicated.<br />
2. Returns over one year are annualized.<br />
3. For the portfolio, P/B and P/CF calculations for the weighted average use harmonic means.<br />
Values less than 0.01 (i.e., negative values) are excluded and values in excess of 200 are<br />
capped at 200. P/E calculations for the weighted average use harmonic means. P/S<br />
calculations for the weighted average cap values in excess of 200 at 200. For the<br />
benchmark, no limits are applied to these ratios. Market capitalization statistics are<br />
indicated in the base currency for the strategy presented.<br />
4. Figures may not total 100% due to rounding. Portfolio characteristics and sector<br />
breakdown are based on an FPA model portfolio unless otherwise indicated.<br />
5. A GICS industry group under the GICS Information Technology Sector.<br />
6. For the portfolio, P/B calculations for the weighted average use harmonic means. Values<br />
less than 0.01 (i.e., negative values) are excluded and values in excess of 200 are capped<br />
at 200. P/E calculations for the weighted average use harmonic means. Yields above<br />
100% are also excluded. For the benchmark, no limits are applied to these ratios. Market<br />
capitalization statistics are indicated in the base currency for the strategy presented.<br />
7. The calculation for the weighted average coupon includes the imputed coupon rate of zero<br />
coupon bonds. If the imputed coupons were not included, the coupon rate would be 4.9%.<br />
8. The calculation for the weighted average price is based on market value weights. If the<br />
prices were weighted by par, the weighted average price would be $91.51.<br />
9. Weighted average gross yield is calculated by adding 60% of the current yield of <strong>Franklin</strong><br />
Portfolio Advisors’ Intermediate Municipal Fixed Income accounts that opened 60 days prior to<br />
March 31, 2009 and 40% of the gross distribution rate of the <strong>Franklin</strong> pooled investment<br />
vehicle as of March 31, 2009, which is calculated by taking the net distribution rate of the<br />
<strong>Franklin</strong> pooled investment vehicle and adding back the annual expense ratio. The client’s<br />
return will be reduced by investment management fees and other expenses.<br />
10. For the portfolio, P/B calculations for the weighted average use harmonic means. Values<br />
less than 0.01 (i.e., negative values) are excluded and values in excess of 200 are capped<br />
at 200. P/E calculations for the weighted average use harmonic means. P/S calculations<br />
for the weighted average cap values in excess of 200 at 200. Yields above 100% are also<br />
excluded. For the benchmark, no limits are applied to these ratios. Market capitalization<br />
statistics are indicated in the base currency for the strategy presented.<br />
11. ADR portfolios hold 70-90 stocks; ORD portfolios hold approximately 100 stocks.<br />
12. ADR portfolios hold 60-80 stocks; ORD portfolios hold approximately 100 stocks.<br />
13. Figures may not total 100% due to rounding. Portfolio Characteristics and geographic<br />
weightings are based on a TPA composite.<br />
120 <strong>Dealer</strong> <strong>Facts</strong> <strong>Guide</strong> Go to franklintempleton.com or call (800) 223-2141 DEALER USE ONLY/NOT FOR DISTRIBUTION TO THE PUBLIC
529 COLLEGE SAVINGS PLAN<br />
<strong>Franklin</strong> <strong>Templeton</strong> 529 College Savings Plan, Offered Nationwide<br />
by the New Jersey Higher Education Student Assistance Authority 1<br />
<strong>Franklin</strong> <strong>Templeton</strong> 529 College Savings Plan offers several different portfolios to help tailor a diversified college<br />
investing strategy to fit the risk/reward profile of almost any investor.<br />
INVESTMENT OPTIONS<br />
OPTION 1 | Age-Based Asset Allocation 2<br />
As a child grows, the Age-<br />
Based Asset Allocation will<br />
automatically reallocate a<br />
percentage of assets out of<br />
equity-based funds into more<br />
conservative, income-seeking<br />
funds (such as bond and<br />
money market funds). By<br />
the time college is around<br />
the corner, a greater portion<br />
of assets will be in the more<br />
conservative, lower-risk<br />
investments.<br />
OPTION 2 | Objective-Based Asset Allocations 2<br />
Invest your clients’ assets<br />
accord ing to the amount<br />
of investment risk they’re<br />
comfortable taking and the<br />
return potential they prefer.<br />
You may choose among five<br />
port folios, with objectives<br />
ranging from aggressive<br />
to conservative.<br />
Growth 529 Portfolio<br />
Domestic Equity 70%<br />
International Equity 30%<br />
Newborn–8 Years<br />
Domestic Equity 70%<br />
International Equity 30%<br />
Age 13–16 Years<br />
Income 40%<br />
Domestic Equity 35%<br />
International Equity 15%<br />
Cash 10%<br />
Founding Funds 529 Portfolio<br />
<strong>Franklin</strong><br />
Income Fund 33 1 ⁄3%<br />
<strong>Templeton</strong><br />
Growth Fund 33 1 ⁄3%<br />
Mutual<br />
Shares Fund 33 1 ⁄3%<br />
Growth & Income 529 Portfolio<br />
Income 40%<br />
Domestic Equity 35%<br />
International Equity 15%<br />
Cash 10%<br />
Age 9–12 Years<br />
Income 20.0%<br />
Domestic Equity 52.5%<br />
International Equity 22.5%<br />
Cash 5.0%<br />
Age 17+ Years<br />
Income 60.0%<br />
Domestic Equity 17.5%<br />
International Equity 7.5%<br />
Cash 15.0%<br />
Corefolio ® 529 Portfolio<br />
<strong>Franklin</strong><br />
Growth Fund 50%<br />
<strong>Templeton</strong><br />
Growth Fund 25%<br />
Mutual<br />
Shares Fund 25%<br />
Income 529 Portfolio<br />
Income 80%<br />
Cash 20%<br />
6/30/09<br />
DEALER USE ONLY/NOT FOR DISTRIBUTION TO THE PUBLIC Go to franklintempleton.com or call (800) 223-2141 <strong>Dealer</strong> <strong>Facts</strong> <strong>Guide</strong> 121<br />
529 COLLEGE SAVINGS PLAN
529 COLLEGE SAVINGS PLAN<br />
<strong>Franklin</strong> <strong>Templeton</strong> 529 College Savings Plan, cont’d.<br />
INVESTMENT OPTIONS, cont’d.<br />
OPTION 3 | Individual Portfolios 2<br />
This option allows you to work<br />
with your clients to assemble an<br />
individual portfolio and create<br />
an asset allocation mix to suit<br />
their college investing needs.<br />
Your clients may choose to invest<br />
among as many port folios<br />
as desired.<br />
PRODUCT INFORMATION<br />
Global<br />
<strong>Templeton</strong> Growth 529 Portfolio<br />
Growth<br />
<strong>Franklin</strong> Growth 529 Portfolio<br />
<strong>Franklin</strong> Small-Mid Cap Growth 529 Portfolio<br />
Value<br />
Mutual Shares 529 Portfolio<br />
Features<br />
Available Share Classes A, B or C<br />
Minimum Initial Investment $250<br />
Subsequent Minimum Investment $50<br />
Minimum Initial Investment with Automatic Investment Plan $50<br />
Maximum Contribution Limit $305,000<br />
Hybrid<br />
<strong>Franklin</strong> Income 529 Portfolio<br />
Principal Preservation<br />
Stable Value 529 Portfolio3 Index Style<br />
S&P 500 Index 529 Portfolio<br />
Investment Options 5 Objective-Based Asset Allocations, 4 Age-Based Asset Allocations,<br />
7 Individual Portfolios<br />
6/30/09<br />
Annual Account Fee $25 annual fee. Waived for account balances greater than $25,000,<br />
Automatic Investment Plans, or if contributor or beneficiary is a NJ resident.<br />
Program Management Fee 40 basis points (0.40%)<br />
State Residency Requirement None<br />
1. Offered and administered by the New Jersey Higher Education Student Assistance Authority (HESAA); managed and distributed by <strong>Franklin</strong> <strong>Templeton</strong> Distributors, Inc., an affiliate of <strong>Franklin</strong><br />
Resources, Inc., which operates as <strong>Franklin</strong> <strong>Templeton</strong> Investments. No federal or state guarantee. Principal value may be lost, and investing in the plan does not guarantee admission to college<br />
or sufficient funds for college. Please refer to the Investor Handbook for more complete information.<br />
2. The plan is managed by <strong>Franklin</strong> Advisers, Inc., an affiliate of <strong>Franklin</strong> <strong>Templeton</strong> Distributors, Inc. Plan portfolios generally invest in mutual funds managed by affiliates of <strong>Franklin</strong> Advisers,<br />
Inc. An investment in <strong>Franklin</strong> <strong>Templeton</strong> 529 College Savings Plan is an investment in a municipal security that may invest in one or more underlying mutual funds. It is not an investment in<br />
shares of the underlying mutual fund(s).<br />
3. Although the Stable Value 529 Portfolio seeks to preserve the value of investments, it is possible to lose money by investing in the portfolio.<br />
122 <strong>Dealer</strong> <strong>Facts</strong> <strong>Guide</strong> Go to franklintempleton.com or call (800) 223-2141 DEALER USE ONLY/NOT FOR DISTRIBUTION TO THE PUBLIC
<strong>Franklin</strong> <strong>Templeton</strong> 529 College Savings Plan, cont’d.<br />
PORTFOLIO PERFORMANCE<br />
The table below shows total returns for Class A, B and C shares of plan portfolios. Performance shown<br />
includes periods with unusually favorable conditions in some markets. No assurance can be given that such<br />
performance or market conditions will be repeated in the future. Ongoing market volatility can dramatically<br />
impact short-term returns. Current performance may differ from figures shown.<br />
6/30/09<br />
ALL SALES CHARGES NO SALES CHARGES<br />
AVERAGE ANNUAL TOTAL RETURN4, 6 5, 6<br />
AVERAGE ANNUAL TOTAL RETURN<br />
AS OF JUNE 30, 2009 AS OF JUNE 30, 2009<br />
529 PORTFOLIO<br />
Since Since Inception Total Annual<br />
2 1-Year 3-Year 5-Year Inception7 1-Year 3-Year 5-Year Inception7 Date7 AGE-BASED ASSET ALLOCATION<br />
Newborn–8 Years<br />
Operating Expenses<br />
11<br />
Class A<br />
Class B8 Class C<br />
Age 9–12 Years11 Class A<br />
Class B8 Class C<br />
Age 13–16 Years11 Class A<br />
Class B8 Class C<br />
Age 17+ Years11 Class A<br />
Class B8 Class C<br />
OBJECTIVE-BASED ASSET ALLOCATIONS<br />
Founding Funds 529 Portfolio<br />
Class A<br />
Class B8 Class C<br />
Corefolio ® 529 Portfolio9 Class A<br />
Class B8 Class C<br />
Growth 529 Portfolio11 Class A<br />
Class B8 Class C<br />
Growth & Income 529 Portfolio11 Class A<br />
Class B8 Class C<br />
Income 529 Portfolio<br />
Class A<br />
Class B8 -28.61% -8.61% -1.29% 4.17% -24.27% -6.79% -0.12% 5.15% 3/26/03 1.48%<br />
-27.88% -8.44% -1.28% 4.35% -24.87% -7.50% -0.88% 4.35% 3/28/03 2.23%<br />
-25.54% -7.45% -0.84% 4.58% -24.79% -7.45% -0.84% 4.58% 3/31/03 2.23%<br />
-22.01% -5.47% 0.03% 4.23% -17.27% -3.58% 1.22% 5.22% 3/26/03 1.38%<br />
-21.24% -5.32% 0.04% 4.32% -17.96% -4.35% 0.44% 4.32% 4/2/03 2.13%<br />
-18.77% -4.34% 0.43% 4.56% -17.95% -4.34% 0.43% 4.56% 3/31/03 2.13%<br />
-14.37% -2.19% 1.36% 4.32% -9.14% -0.24% 2.56% 5.31% 3/31/03 1.30%<br />
-13.46% -2.01% 1.39% 4.29% -9.85% -1.01% 1.77% 4.29% 4/8/03 2.05%<br />
-10.68% -0.98% 1.77% 4.32% -9.78% -0.98% 1.77% 4.32% 4/9/03 2.05%<br />
-9.19% 0.00% 1.93% 3.03% -3.63% 1.98% 3.15% 4.03% 5/5/03 1.27%<br />
-8.20% 0.24% 2.00% 3.33% -4.38% 1.23% 2.36% 3.33% 5/1/03 2.02%<br />
-5.33% 1.21% 2.36% 3.60% -4.37% 1.21% 2.36% 3.60% 4/9/03 2.02%<br />
-28.28% -9.83% — -5.19% -23.89% -8.04% — -3.78% 6/27/05 1.32%<br />
-27.50% -9.63% — -4.94% -24.48% -8.71% — -4.46% 6/27/05 2.07%<br />
-25.26% -8.72% — -4.48% -24.50% -8.72% — -4.48% 6/27/05 2.07%<br />
-29.29% -10.28% -3.08% 2.69% -24.97% -8.49% -1.93% 3.67% 3/25/03 1.35%<br />
-28.47% -10.07% -3.06% 2.62% -25.49% -9.15% -2.67% 2.62% 4/8/03 2.10%<br />
-26.21% -9.14% -2.65% 2.92% -25.47% -9.14% -2.65% 2.92% 3/31/03 2.10%<br />
-28.49% -8.51% -1.23% 4.20% -24.14% -6.69% -0.06% 5.19% 3/25/03 1.48%<br />
-27.71% -8.32% -1.20% 4.42% -24.70% -7.38% -0.80% 4.42% 3/25/03 2.23%<br />
-25.48% -7.40% -0.83% 4.47% -24.73% -7.40% -0.83% 4.47% 3/28/03 2.23%<br />
-14.93% -2.46% 1.21% 3.99% -9.72% -0.51% 2.41% 4.98% 3/25/03 1.34%<br />
-14.01% -2.21% 1.29% 4.15% -10.42% -1.21% 1.66% 4.15% 4/3/03 2.09%<br />
-11.33% -1.23% 1.65% 3.96% -10.43% -1.23% 1.65% 3.96% 4/25/03 2.09%<br />
-1.18% 2.98% 2.66% 2.77% 3.20% 4.48% 3.88% 3.75% 4/8/03 1.21%<br />
-1.52% 2.76% 2.77% 2.99% 2.48% 3.70% 3.12% 2.99% 4/22/03 1.96%<br />
Class C<br />
1.47% 3.69% 3.09% 3.02% 2.47% 3.69% 3.09% 3.02% 3/31/03 1.96%<br />
DEALER USE ONLY/NOT FOR DISTRIBUTION TO THE PUBLIC Go to franklintempleton.com or call (800) 223-2141 <strong>Dealer</strong> <strong>Facts</strong> <strong>Guide</strong> 123<br />
529 COLLEGE SAVINGS PLAN
529 COLLEGE SAVINGS PLAN<br />
<strong>Franklin</strong> <strong>Templeton</strong> 529 College Savings Plan, cont’d.<br />
4. Total returns do not reflect the current $25 annual account fee, but are net of applicable fees,<br />
expenses and sales charges of the Plan, including: (1) current program management fee of 40<br />
basis points; (2) current ongoing sales fees of 25 basis points for Class A and 100 basis points<br />
for Classes B and C; (3) sales loads—5.75% or 4.25% Class A front-end sales load or 1-4%<br />
Class B or C contingent deferred sales charges, as applicable; and (4) expenses of the share<br />
classes of the underlying mutual funds in which Plan portfolios invest. Plan fees, expenses and<br />
sales charges are subject to change. Underlying fund expenses will vary and in some cases<br />
have been reduced by fee and expense waivers or reimbursements, which may be ended at any<br />
time reducing future performance.<br />
5. Total returns do not reflect the current $25 annual account fee or sales charges, but are net<br />
of applicable fees and expenses of the Plan, including: (1) current program management fee of<br />
40 basis points; and (2) current ongoing sales fees of 25 basis points for Class A and 100 basis<br />
points for Classes B and C; and (3) expenses of the share classes of the underlying mutual<br />
funds in which Plan portfolios invest. Plan fees and expenses are subject to change. Underlying<br />
fund expenses will vary and in some cases have been reduced by fee and expense waivers or<br />
reimbursements, which may be ended at any time reducing future performance.<br />
6. Nonqualified withdrawals from the plan are subject to a 10% federal tax penalty and ordinary<br />
federal income taxes on earnings, as well as possible state taxes. The performance data<br />
shown represents past performance and is not an indication of future results. Investment<br />
return and principal value of the portfolios will fluctuate so that portfolio shares, when<br />
redeemed, may be worth more or less than their original cost. Please carefully consider a<br />
portfolio’s investment goals, risks, charges and expenses before investing. See the Investor<br />
6/30/09<br />
ALL SALES CHARGES NO SALES CHARGES<br />
AVERAGE ANNUAL TOTAL RETURN<br />
Investors should read the Investor Handbook carefully before investing, and consider whether their or their beneficiary’s<br />
home state offers any state tax or other benefits that are only available for investments in its qualified tuition program.<br />
4, 6 5, 6<br />
AVERAGE ANNUAL TOTAL RETURN<br />
AS OF JUNE 30, 2009 AS OF JUNE 30, 2009<br />
529 PORTFOLIO<br />
Inception Total Annual<br />
2 1-Year 3-Year 5-Year Inception7 1-Year 3-Year 5-Year Inception7 Date7 INDIVIDUAL PORTFOLIOS<br />
INDIVIDUAL<br />
Global<br />
PORTFOLIOS0<br />
<strong>Templeton</strong> Growth 529 Portfolio<br />
Operating Expenses<br />
Class A<br />
Class B8 Class C<br />
Growth<br />
<strong>Franklin</strong> Growth 529 Portfolio10 Class A<br />
Class B8 Class C<br />
<strong>Franklin</strong> Small-Mid Cap Growth<br />
Class A<br />
Class B8 Class C<br />
Value<br />
Mutual Shares 529 Portfolio<br />
Class A<br />
Class B8 Class C<br />
Hybrid<br />
<strong>Franklin</strong> Income 529 Portfolio<br />
Class A<br />
Class B8 Class C<br />
Principal Preservation<br />
Stable Value 529 Portfolio<br />
Class A<br />
Class B8 Class C<br />
Index Style<br />
S&P 500 Index 529 Portfolio<br />
Class A<br />
Class B8 -34.36% -13.59% -3.79% 3.05% -30.36% -11.87% -2.65% 4.03% 3/31/03 1.43%<br />
-33.64% -13.42% -3.77% 3.11% -30.88% -12.54% -3.38% 3.11% 4/1/03 2.18%<br />
-31.56% -12.53% -3.41% 2.93% -30.87% -12.53% -3.41% 2.93% 3/28/03 2.18%<br />
-29.07% -8.73% -4.69% -0.21% -24.73% -6.91% -3.54% 0.74% 4/22/03 1.29%<br />
-28.26% -8.52% -4.64% -0.45% -25.27% -7.59% -4.25% -0.45% 5/12/03 2.04%<br />
-25.91% -7.56% -4.21% 0.65% -25.16% -7.56% -4.21% 0.65% 4/1/03 2.04%<br />
-30.65% -9.96% -2.61% 3.74% -26.41% -8.17% -1.45% 4.73% 3/28/03 1.49%<br />
-29.92% -9.79% -2.58% 3.99% -27.00% -8.87% -2.18% 3.99% 4/8/03 2.24%<br />
-27.73% -8.88% -2.21% 3.91% -27.00% -8.88% -2.21% 3.91% 3/28/03 2.24%<br />
-28.48% -11.18% -2.36% 2.57% -24.11% -9.41% -1.19% 3.54% 3/31/03 1.41%<br />
-27.66% -10.98% -2.33% 2.52% -24.65% -10.07% -1.94% 2.52% 4/2/03 2.16%<br />
-25.37% -10.05% -1.96% 2.58% -24.61% -10.05% -1.96% 2.58% 3/28/03 2.16%<br />
-21.15% -4.37% 0.75% 4.48% -17.65% -2.97% 1.62% 5.21% 4/7/03 1.12%<br />
-21.60% -4.67% 0.47% 4.53% -18.33% -3.70% 0.86% 4.53% 4/1/03 1.87%<br />
-19.08% -3.68% 0.86% 4.42% -18.27% -3.68% 0.86% 4.42% 3/28/03 1.87%<br />
-3.83% 0.18% 0.42% 0.64% 0.45% 1.65% 1.62% 1.61% 4/13/03 1.24%<br />
-4.27% -0.09% 0.47% 0.82% -0.28% 0.90% 0.86% 0.82% 4/8/03 1.99%<br />
-1.28% 0.90% 0.86% 0.83% -0.28% 0.90% 0.86% 0.83% 4/7/03 1.99%<br />
-30.94% -10.83% -4.32% 0.79% -26.71% -9.06% -3.17% 1.75% 4/8/03 1.10%<br />
-30.17% -10.67% -4.28% 0.10% -27.26% -9.76% -3.89% 0.10% 5/7/03 1.85%<br />
Class C<br />
-27.87% -9.71% -3.87% 1.39% -27.14% -9.71% -3.87% 1.39% 4/1/03 1.85%<br />
Handbook for more information on <strong>Franklin</strong> <strong>Templeton</strong> 529 College Savings Plan, including<br />
sales charges, expenses, general risks of the Plan, general investment risks and specific risks<br />
of investing in Plan portfolios, which can include risks of convertible securities; country, sector,<br />
region or industry focus; credit; derivative securities; foreign securities, including currency<br />
exchange rates, political and economic developments, trading practices, availability of<br />
information, limited markets and heightened risk in emerging markets; growth or value style<br />
investing; income; interest rate; lower-rated and unrated securities; mortgage securities and<br />
asset-backed securities; restructuring and distressed companies; securities lending; smaller<br />
and midsize companies; and stocks. To obtain an Investor Handbook, which contains this and<br />
other information, call us at (800) 223-2141, or go to franklintempleton.com.<br />
Please read the Investor Handbook carefully before investing. All information is as of the date shown.<br />
7. The inception date of each class of shares of each portfolio is the date on which the class of<br />
shares was first funded.<br />
8. After approximately 8 years these Trust shares convert to Class A Trust shares.<br />
9. Performance prior to May 6, 2009, reflects investment in <strong>Franklin</strong> Capital Growth Fund rather<br />
than <strong>Franklin</strong> Growth Fund.<br />
10. Prior to May 6, 2009, the Trust Portfolio: (i) was named <strong>Franklin</strong> Capital Growth 529 Portfolio;<br />
(ii) invested in the <strong>Franklin</strong> Capital Growth Fund instead of the <strong>Franklin</strong> Growth Fund; and<br />
(iii) had a different investment strategy. Performance prior to May 6, 2009, reflects investment<br />
in <strong>Franklin</strong> Capital Growth Fund.<br />
11. Performance prior to May 6, 2009, reflects investment in <strong>Franklin</strong> Capital Growth Fund<br />
rather than <strong>Franklin</strong> Flex Cap Growth Fund.<br />
124 <strong>Dealer</strong> <strong>Facts</strong> <strong>Guide</strong> Go to franklintempleton.com or call (800) 223-2141 DEALER USE ONLY/NOT FOR DISTRIBUTION TO THE PUBLIC
Footnotes<br />
1. The date of effectiveness of the fund’s registration statement or the first day the fund<br />
commenced operations. For Class C shares, the first day the fund commenced offering such<br />
shares. The Mutual Series Funds, except Mutual Financial Services Fund, Mutual Recovery<br />
Fund and Mutual International Fund, began offering Class A and Class C shares on 11/1/96.<br />
Mutual Financial Services Fund and Mutual International Fund have offered Class A and<br />
Class C shares since their respective inceptions on 8/19/97 and 5/1/09. Mutual Recovery<br />
Fund has offered Class A and Class C Shares since 11/3/03. Certain <strong>Franklin</strong> <strong>Templeton</strong><br />
Funds offer Advisor Class shares to qualified investors. They are offered without sales charges<br />
or Rule 12b-1 fees. For performance reporting purposes, inception date for Advisor Class<br />
shares is the date of effectiveness of the fund’s registration statement or the first day the<br />
fund commenced operations. For Class 1 shares of the <strong>Franklin</strong> <strong>Templeton</strong> Insurance Funds,<br />
the inception date refers to the date of effectiveness of the funds’ registration statements. For<br />
more information on when Class 2, Class 3 and Class 4 shares become effective or in some<br />
cases, commenced sales, please refer to footnote 53.<br />
2. Figures are as stated in the fund’s prospectus current as of the date of this report. Expenses<br />
differ as a result of the different class pricing structures. Please refer to page 128 of this<br />
guide and the fund’s prospectus for more information regarding Class A, Class C and Class R<br />
share pricing.<br />
3. A measure of a fund’s volatility relative to an appropriate index based on its investment goal.<br />
A beta greater than 1.00 indicates volatility greater than the market’s. Based on monthly<br />
returns over the last three years. Source: © 2009 Thomson Reuters.<br />
4. Effective January 1995, these funds began reinvesting dividends and capital gains on the<br />
ex-dividend date.<br />
5. Shows percent change in value over indicated periods. Does not include sales charges, and<br />
assumes reinvestment of dividends and capital gains at net asset value. For classes of shares<br />
existing for less than one year, aggregate total returns replace average annual total returns.<br />
6. Calculations represent the average annual change in value of an investment over the specified<br />
periods, assuming reinvestment of dividends and capital gains at net asset value. For classes<br />
of shares existing for less than one year, aggregate total returns replace average annual total<br />
returns. Class A figures include the current, maximum initial sales charge. Class C figures<br />
include the 1% contingent deferred sales charge to the extent applicable.<br />
7. The portfolio manager for the fund reserves the right to withhold release of information with<br />
respect to holdings that would otherwise be included in the top 10 holdings list.<br />
8. Morningstar proprietary ratings reflect historical risk-adjusted returns as of 6/30/09. Source:<br />
Morningstar, 6/30/09. For each fund with at least a 3-year history, Morningstar calculates a<br />
risk-adjusted return measure that accounts for variation in a fund’s monthly performance<br />
(including the effects of all sales charges), placing more emphasis on downward variations<br />
and rewarding consistent performance. The top 10% of funds in each category receive a<br />
Morningstar Rating of 5 stars, the next 22.5% receive 4 stars, the next 35% receive 3 stars,<br />
the next 22.5% receive 2 stars and the bottom 10% receive 1 star. (Each share class is<br />
counted as a fraction of one fund and rated separately.) The Overall Morningstar Rating<br />
for a fund is derived from a weighted average of the performance figures associated with its<br />
3-, 5- and 10-year (if applicable) Morningstar Rating metrics. Past performance does not<br />
guarantee future results. Morningstar Rating is for the A share class only; other classes<br />
may have different performance characteristics.<br />
Morningstar proprietary ratings reflect historical risk-adjusted returns as of 6/30/09.<br />
The following fund was rated against 90 and 58 U.S.-domiciled Bank Loan funds for the<br />
respective 3- and 5-year periods ended 6/30/09, as applicable. For the 3- and 5-year<br />
periods ended 6/30/09, the Morningstar ratings were: <strong>Franklin</strong> Floating Rate Daily Access 4; 4.<br />
The following fund was rated against 485; 315; and 134 U.S.-domiciled Conservative<br />
Allocation funds for the respective 3-, 5- and 10-year periods ended 6/30/09, as<br />
applicable. For the 3-, 5- and 10-year periods ended 6/30/09, the Morningstar ratings were:<br />
<strong>Franklin</strong> <strong>Templeton</strong> Conservative Target 3; 4; 4.<br />
The following fund was rated against 99; 93; and 55 U.S.-domiciled Europe Stock funds<br />
for the respective 3-, 5- and 10-year periods ended 6/30/09, as applicable. For the 3-, 5and<br />
10-year periods ended 6/30/09, the Morningstar ratings were: Mutual European 5; 5; 5.<br />
The following fund was rated against 112; 102; and 58 U.S.-domiciled Financial funds for<br />
the respective 3-, 5- and 10-year periods ended 6/30/09, as applicable. For the 3-, 5- and<br />
10-year periods ended 6/30/09, the Morningstar ratings were: Mutual Financial Services 3; 4; 4.<br />
The following fund was rated against 101 and 76 U.S.-domiciled Foreign Small/Mid<br />
Growth funds for the respective 3- and 5-year periods ended 6/30/09, as applicable.<br />
For the 3- and 5- year periods ended 6/30/09, the Morningstar ratings were: <strong>Franklin</strong><br />
International Small Cap Growth 5; 5.<br />
The following fund was rated against 116; 107; and 83 U.S.-domiciled High Yield<br />
Municipal funds for the respective 3-, 5- and 10-year periods ended 6/30/09, as<br />
applicable. For the 3-, 5- and 10-year periods ended 6/30/09, the Morningstar ratings were:<br />
<strong>Franklin</strong> High Yield Tax-Free Income 4; 4; 4.<br />
The following fund was rated against 1,740; 1,363; and 683 U.S.-domiciled Large Blend<br />
funds for the 3-, 5- and 10-year periods ended 6/30/09, as applicable. For the 3-, 5- and<br />
10-year ended 6/30/09, the Morningstar ratings were: <strong>Franklin</strong> Rising Dividends 3; 2; 5.<br />
The following fund was rated against 1,565; 1,294; and 663 U.S. domiciled Large Growth<br />
funds for the respective 3-, 5- and 10-year periods ended 6/30/09, as applicable. For the<br />
3-, 5- and 10-year periods ended 6/30/09, the Morningstar ratings were: <strong>Franklin</strong> DynaTech<br />
3; 3; 4.<br />
6/30/09<br />
The following funds were rated against 1,154; 951; and 452 U.S. domiciled Large Value<br />
funds for the respective 3-, 5- and 10-year periods ended 6/30/09, as applicable. For the<br />
3-, 5- and 10-year periods ended 6/30/09, the Morningstar ratings were: Mutual Beacon 3;<br />
3; 5; Mutual Shares 3; 3; 5.<br />
The following fund was rated against 960; 793; and 453 U.S.-domiciled Moderate<br />
Allocation funds for the respective 3-, 5- and 10-year periods ended 6/30/09, as<br />
applicable. For the 3-, 5- and 10-year periods ended 6/30/09, the Morningstar ratings were:<br />
<strong>Franklin</strong> <strong>Templeton</strong> Moderate Target 4; 4; 4.<br />
The following fund was rated against 152; 140; and 114 U.S.-domiciled Municipal<br />
California Long funds for the respective 3-, 5- and 10-year periods ended 6/30/09, as<br />
applicable. For the 3-, 5- and 10-year periods ended 6/30/09, the Morningstar ratings were:<br />
<strong>Franklin</strong> California Tax-Free Income 3; 4; 4.<br />
The following fund was rated against 55; 53; and 52 U.S.-domiciled Municipal Minnesota<br />
funds for the respective 3-, 5- and 10-year periods ended 6/30/09, as applicable. For the<br />
3-, 5- and 10-year periods ended 6/30/09, the Morningstar ratings were: <strong>Franklin</strong> Minnesota<br />
Tax-Free Income 3; 4; 4.<br />
The following fund was rated against 245; 227; and 199 U.S.-domiciled Municipal<br />
National Long funds for the respective 3-, 5- and 10-year periods ended 6/30/09, as<br />
applicable. For the 3-, 5- and 10-year periods ended 6/30/09, the Morningstar ratings were:<br />
<strong>Franklin</strong> Federal Tax-Free Income 3; 4; 4.<br />
The following fund was rated against 60; 59; and 51 U.S.-domiciled Municipal New<br />
Jersey funds for the respective 3-, 5- and 10-year periods ended 6/30/09, as applicable.<br />
For the 3-, 5- and 10-year periods ended 6/30/09, the Morningstar ratings were: <strong>Franklin</strong> New<br />
Jersey Tax-Free Income 3; 3; 4.<br />
The following fund was rated against 109; 109; and 93 U.S.-domiciled Municipal New<br />
York Long funds for the respective 3-, 5- and 10-year periods ended 6/30/09, as<br />
applicable. For the 3-, 5- and 10-year periods ended 6/30/09, the Morningstar ratings were:<br />
<strong>Franklin</strong> New York Tax-Free Income 4; 4; 4.<br />
The following fund was rated against 69; 63; and 56 U.S.-domiciled Municipal Ohio funds<br />
for the respective 3-, 5- and 10-year periods ended 6/30/09, as applicable. For the 3-,<br />
5- and 10-year periods ended 6/30/09, the Morningstar ratings were: <strong>Franklin</strong> Ohio Tax-Free<br />
Income 3; 4; 4.<br />
The following fund was rated against 85; 84; and 79 U.S.-domiciled Municipal<br />
Pennsylvania funds for the respective 3-, 5- and 10-year periods ended 6/30/09, as<br />
applicable. For the 3-, 5- and 10-year periods ended 6/30/09, the Morningstar ratings were:<br />
<strong>Franklin</strong> Pennsylvania Tax-Free Income 3; 4; 4.<br />
The following funds were rated against 333; 315; and 297 U.S.-domiciled Municipal<br />
Single State Long funds for the respective 3-, 5- and 10-year periods ended 6/30/09, as<br />
applicable. For the 3-, 5- and 10-year periods ended 6/30/09, the Morningstar ratings were:<br />
<strong>Franklin</strong> Georgia Tax-Free Income 3; 3; 4; <strong>Franklin</strong> Lousiana Tax-Free Income 3; 3; 4; <strong>Franklin</strong><br />
Michigan Tax-Free Income 3; 3; 4; <strong>Franklin</strong> Missouri Tax-Free Income 3; 4; 4; <strong>Franklin</strong> North<br />
Carolina Tax-Free Income 3; 4; 4; <strong>Franklin</strong> Oregon Tax-Free Income 4; 4; 5; <strong>Franklin</strong> Tennessee<br />
Municipal Bond 3; 4; 4; <strong>Franklin</strong> Virginia Tax-Free Income 3; 4; 4.<br />
The following fund was rated against 105; 79; and 65 U.S.-domiciled Pacific/Asia<br />
ex-Japan Stock funds for the respective 3-, 5- and 10-year periods ended 6/30/09, as<br />
applicable. For the 3-, 5- and 10-year periods ended 6/30/09, the Morningstar ratings were:<br />
<strong>Templeton</strong> China World 4; 3; 5.<br />
The following fund was rated against 318; 242; and 117 U.S.-domiciled Small Value<br />
funds for the respective 3-, 5- and 10-year periods ended 6/30/09, as applicable. For<br />
the 3-; 5- and 10-year periods ended 6/30/09, the Morningstar ratings were: <strong>Franklin</strong><br />
MicroCap Value 4; 4; 5.<br />
The following fund was rated against 118; 100; and 46 U.S.-domiciled Ultrashort Bond<br />
funds for the respective 3-, 5- and 10-year periods ended 6/30/09, as applicable. For the<br />
3-, 5- and 10-year periods ended 6/30/09, the Morningstar ratings were: <strong>Franklin</strong> Adjustable<br />
Government Securities 4; 4; 3.<br />
The following fund was rated against 93; 78; and 50 U.S.-domiciled Utilities funds for the<br />
respective 3-, 5- and 10-year periods ended 6/30/09, as applicable. For the 3-, 5- and<br />
10-year periods ended 6/30/09, the Morningstar ratings were: <strong>Franklin</strong> Utilities 4; 3; 5.<br />
The following fund was rated against 187; 158; and 104 U.S.-domiciled World Bond<br />
funds for the respective 3-, 5- and 10-year periods ended 6/30/09, as applicable. For the<br />
3-, 5- and 10-year periods ended 6/30/09, the Morningstar ratings were: <strong>Templeton</strong> Global<br />
Bond 5; 5; 5.<br />
The following funds were rated against 544; 446; and 253 U.S.-domiciled World Stock<br />
funds for the respective 3-, 5- and 10-year periods ended 6/30/09, as applicable. For the<br />
3-, 5- and 10-year periods ended 6/30/09, the Morningstar ratings were: Mutual Global<br />
Discovery 5; 5; 5; Mutual Quest 5; 5; 5; <strong>Templeton</strong> Global Opportunities 3; 4; 4; <strong>Templeton</strong><br />
World 3; 3; 4.<br />
9. The fund’s manager has contractually agreed to waive or limit its fees and to make certain<br />
payments to reduce expenses. Without this waiver, the fund’s total return, yield and<br />
distribution rate would be lower.<br />
10. Prior to 7/1/94, Class A shares were offered at a lower initial sales charge, thus actual total<br />
returns would differ. Class A average annual total returns have been restated to reflect the<br />
current, maximum initial sales charge. Effective 5/1/94, the fund implemented a Rule 12b-1<br />
plan, which affects subsequent performance.<br />
DEALER USE ONLY/NOT FOR DISTRIBUTION TO THE PUBLIC Go to franklintempleton.com or call (800) 223-2141 <strong>Dealer</strong> <strong>Facts</strong> <strong>Guide</strong> 125<br />
FOOTNOTES
FOOTNOTES<br />
Footnotes, cont’d.<br />
11. Formerly <strong>Franklin</strong> Global Utilities Fund. Effective 11/15/99, the name and investment strategy<br />
changed. Investment goal remained the same.<br />
12. Prior to 7/1/94, Class A shares were offered at a higher initial sales charge; thus actual total<br />
returns would differ. Class A average annual total returns have been restated to reflect the<br />
current, maximum initial sales charge. On 1/1/93, <strong>Templeton</strong> Global Bond Fund implemented<br />
a Rule 12b-1 plan, which affects subsequent performance.<br />
13. Past expense limitations increased the fund’s total return.<br />
14. Figures are aggregate total return figures, have not been annualized and represent the<br />
change in value of an investment over the period indicated.<br />
15. An annualization of the last dividend payment divided by the maximum offering price on<br />
6/30/09, unless specified otherwise. Please note that the distribution rate for semiannually<br />
paying funds is based on the 12-month distribution and maximum public offering price. Also,<br />
the distribution rate for <strong>Franklin</strong> Convertible Securities Fund is based on the sum of the<br />
respective class’s last four quarterly dividends and the maximum offering price (NAV for<br />
Class C) per share on 6/30/09.<br />
16. Based on published rates in effect on 6/29/09. Federal and state rates are stated at the<br />
highest marginal tax rate. Maryland and New York rates include local tax based on<br />
the highest local tax rate. Various cities and counties of other states may impose a local tax.<br />
The combined rate for these states will be higher. For investors subject to the alternative<br />
minimum tax, a small portion of the dividend income may be subject to such tax, depending<br />
on the fund. Distributions of capital gains and ordinary income from accrued market<br />
discount, if any, are generally taxable.<br />
17. Please note, the fund paid a supplemental income distribution in December 2007. This<br />
additional dividend was distributed by the fund to ensure that the calendar year distribution<br />
requirements for regulated investment companies were met.<br />
18. Formerly Beacon Fund. The fund changed its name, investment goal and management on 1/9/85.<br />
19. For investors subject to the alternative minimum tax, a small portion of fund dividends may<br />
be taxable. Distributions of capital gains are generally taxable.<br />
20. Prior to 1/1/01, Class A shares were offered at a lower initial sales charge (1.50%). Class A<br />
average annual total returns have been restated to reflect the current, maximum 5.75%<br />
initial sales charge; thus actual returns may differ.<br />
21. Prior to 7/1/92, Class A shares were offered at a higher initial sales charge; thus actual total<br />
returns would differ. Class A average annual total returns have been restated to reflect the<br />
current, maximum initial sales charge. On 1/1/93, the fund implemented a Rule 12b-1 plan,<br />
which affects subsequent performance.<br />
22. The investment illustration for the period ended 6/30/09 assumes reinvestment of all dividends<br />
and capital gains at net asset value. Class A figures reflect the current, maximum initial sales<br />
charge. Class C figures include the 1% contingent deferred sales charge to the extent applicable.<br />
23. Prior to 11/1/96, the fund offered only a single class of shares without a sales charge and<br />
Rule 12b-1 expenses. Average annual total returns shown are a restatement of the original<br />
class to include both the Rule 12b-1 fees and the current sales charges applicable to each<br />
share class as though in effect from the fund’s inception. Class A: Prior to 8/3/98, fund shares<br />
were offered at a lower initial sales charge.<br />
24. Distributions of capital gains are generally taxable. Although the fund has the ability to invest<br />
up to 20% of its assets in bonds with income subject to the alternative minimum tax, its<br />
current exposure to such bonds is 0%.<br />
25. Source: © 2009 Morningstar. Total returns include reinvested dividends or interest.<br />
26. An investment in the fund is not insured or guaranteed by the U.S. government or by any other<br />
entity or institution. There is no assurance that the fund’s $1.00 per share price will be<br />
maintained; it is possible to lose money.<br />
27. Returns shown are a restatement of the original class to include Rule 12b-1 fees as though<br />
in effect from the fund’s inception.<br />
28. Prior to 1/1/97, Class A shares were offered at a lower initial sales charge; thus actual returns<br />
may differ. Average annual total returns have been restated to reflect the current maximum<br />
initial sales charge.<br />
29. Portfolio holdings are subject to change.<br />
30. All fund distributions will vary, depending upon current market conditions, and past<br />
distributions are not indicative of future trends.<br />
31. Formerly <strong>Franklin</strong> International Equity Fund. Effective 10/1/96, the fund’s name and<br />
investment strategy changed; the investment goal remained the same. Prior to 1/1/97,<br />
Class A shares were offered at a lower initial sales charge; thus actual returns may differ.<br />
32. Duration shown is the option-adjusted duration. Duration is an indication of a fund’s<br />
sensitivity to changes in interest rates. The option-adjusted duration formula takes into<br />
account embedded call options and redemption features that impact a bond’s expected cash<br />
flows, and thus its interest rate sensitivity.<br />
33. Effective 5/1/94, the fund implemented a Rule 12b-1 plan which affects subsequent performance.<br />
34. The average annual total return without sales charges for Class A and Class C shares for the<br />
35-year period ended 6/30/09 were 13.89% and 12.71%, respectively. The average annual<br />
total return with sales charges for Class A and Class C for the 35-year period ended 6/30/09<br />
were 13.70% and 12.71%, respectively.<br />
35. Total return calculations assume purchases and sales based on the appropriate day’s market<br />
closing prices. All dividends and distributions are assumed to be reinvested in accordance<br />
with the fund’s dividend reinvestment plans. Closed-end fund shares are traded on a stock<br />
exchange and are not offered to the public by <strong>Franklin</strong> <strong>Templeton</strong> Distributors, Inc.<br />
36. Total returns are calculated by Wilshire Associates, Inc.<br />
6/30/09<br />
37. All of the funds are subject to certain risks. Generally, investments offering potential for higher<br />
returns are accompanied by a higher degree of risk. Stocks and other equities representing an<br />
ownership interest in a corporation have historically outperformed other asset classes over the<br />
long term, but tend to fluctuate more dramatically over the short term. Bonds and other debt<br />
obligations are affected by changes in interest rates and the creditworthiness of their issuers.<br />
High-yield, lower-rated (junk) bonds generally have greater price swings and higher default<br />
risks. Foreign investing, especially in emerging markets, has additional risks such as currency<br />
and market volatility and political and social instability. These, and other risks to which<br />
particular funds may be subject, such as specialized industry sectors or use of complex<br />
securities, are discussed in each fund’s prospectus.<br />
38. Formerly <strong>Franklin</strong> Value Fund. Effective 11/1/01, the fund’s name changed; its investment<br />
strategy was restated.<br />
39. The following currencies are considered “major currencies”: Australian dollar, British pound,<br />
Canadian dollar, Danish krone, European Union euro, Japanese yen, New Zealand dollar,<br />
Norwegian krona, Swedish krona, Swiss franc and U.S. dollar. The currencies of various<br />
countries may be added to or deleted from the list of “major currencies” when, in the opinion<br />
of the Trust’s advisors, worldwide social, economic, financial or political conditions warrant.<br />
40. The AAA% includes pre-refunded bonds that are secured by U.S. Treasury securities (AAA) but<br />
have not been re-rated.<br />
41. As determined by net currency.<br />
42. Formerly <strong>Franklin</strong> Gold Fund. Effective 4/10/00, the name and investment strategy changed<br />
to include other precious metals. The investment goal remained the same.<br />
43. Performance quotations for this class reflect the following methods of calculation: a) For<br />
periods prior to the fund’s Advisor Class inception date, a restated figure is used based on the<br />
fund’s oldest share class, Class A performance, excluding the effect of Class A’s maximum<br />
initial sales charge but reflecting the effect of the Class A Rule 12b-1 fees; and b) for periods<br />
after the fund’s Advisor Class inception date, actual Advisor Class performance is used,<br />
reflecting all charges and fees applicable to that class.<br />
44. Maryland fund’s income dividends are free from county income taxes. Depending on the location,<br />
Pennsylvania fund’s dividends are exempt from city or county local taxes. The fund’s shares are<br />
free from Pennsylvania personal property taxes and Philadelphia school taxes.<br />
45. California Tax-Free Income Fund, New York Tax-Free Income Fund and Federal Tax-Free Income<br />
Fund pay dividends on or near the 3rd business day of the month. All other municipal bond<br />
funds accrue dividends daily and pay on or about the 20th day of the month.<br />
46. Prior to 8/3/98, Class A shares were offered at a lower initial sales charge. Class A average<br />
annual total returns have been restated to reflect the current, maximum initial sales charge;<br />
thus actual returns may differ.<br />
47. Prior to 8/3/98, Class A shares were offered at a lower initial sales charge. Class A average<br />
annual total returns have been restated to reflect the current, maximum initial sales charge;<br />
thus actual returns may differ. 5/1/94, the fund implemented a Rule 12b-1 plan, which<br />
affects subsequent performance.<br />
48. Prior to 8/3/98, fund shares were offered at a higher initial sales charge. Average annual total<br />
return figures have been restated to reflect the current, maximum initial sales charge; thus<br />
actual returns may differ.<br />
49. Calculated according to the modified duration formula. Duration is an indication of a fund’s<br />
sensitivity to changes in interest rates. Please note, duration numbers will change as market<br />
conditions change; therefore duration should not solely be relied upon to indicate a municipal<br />
bond fund’s potential volatility.<br />
50. Annualized and effective yields are for the seven-day period ended 6/30/09. Yield reflects<br />
fluctuations in interest rates on portfolio investments, and fund expenses.<br />
51. Prior to 2/1/06, Class A shares were offered without a sales charge. Average annual total<br />
returns have been restated to reflect the current, maximum initial sales charge.<br />
52. Formerly <strong>Franklin</strong> Small Cap Growth Fund I. Effective 9/1/01, the name and investment<br />
strategy changed. The investment goal remained the same.<br />
53. Fund-Only Performance Information. Performance reflects the funds’ operating expenses,<br />
which differ by class, but does not include any contract fees, expenses or sales charges.<br />
If they had been included, performance would be lower. These contract charges and<br />
deductions, particularly for variable life policies, can have a significant effect on contract<br />
values and insurance benefits. Please see a contract prospectus for a complete description<br />
of these expenses, including sales charges. Ongoing market volatility can dramatically affect<br />
short-term performance; recent returns may differ.<br />
a. Average Annual Total Return. The average annual change in value, assuming reinvestment of<br />
dividends and capital gains. For periods less than one year, aggregate total returns are shown.<br />
b. Cumulative Total Return. The total change in value over the periods shown, assuming<br />
reinvestment of dividends and capital gains. The figures reflect the deduction of all<br />
fund-operating expenses.<br />
c. $10,000 Hypothetical Investment. The total change in value of a hypothetical $10,000<br />
investment from the fund’s inception.<br />
d. Class 2 Performance Information. For periods beginning on 1/6/99 (or 5/1/97 for <strong>Templeton</strong><br />
Developing Markets Securities, <strong>Templeton</strong> Foreign Securities and <strong>Templeton</strong> Global Asset<br />
Allocation funds; 5/15/01 for <strong>Franklin</strong> Strategic Income Securities Fund; and 5/12/03 for<br />
<strong>Franklin</strong> Zero Coupon Fund 2010), Class 2 performance reflects an additional 12b-1 expense<br />
of 0.25% per year, which also affects future performance. Prior to 1/6/99, 5/1/97, 5/15/01 or<br />
5/12/03, respectively, Class 2 performance reflects the historical Class 1 performance which<br />
does not include a 12b-1 fee expense.<br />
126 <strong>Dealer</strong> <strong>Facts</strong> <strong>Guide</strong> Go to franklintempleton.com or call (800) 223-2141 DEALER USE ONLY/NOT FOR DISTRIBUTION TO THE PUBLIC
Footnotes, cont’d.<br />
e. Class 3 Performance Information. Since Class 3 shares were not offered until 5/1/04 (or<br />
4/1/05 for <strong>Templeton</strong> Global Bond Securities), for periods prior to 5/1/97 (or 1/6/99 for <strong>Templeton</strong><br />
Global Bond Securities), the performance represents historical Class 1 performance which does<br />
not include a 12b-1 fee expense. For periods from 5/1/97 to 4/30/04 (or from 1/6/99 to 3/31/05<br />
for <strong>Templeton</strong> Global Bond Securities), the performance represents the historical Class 2<br />
performance. Both Class 2 and Class 3 performance reflects an additional 12b-1 expense of<br />
0.25% per year, which also affects future performance.<br />
f. Class 4 Performance Information. For periods beginning 2/29/08, Class 4 performance<br />
reflects a 12b-1 fee expense of 0.35% per year, which affects future performance. Class 4<br />
performance prior to 2/29/08 reflects historical Class 1 performance which does not include<br />
a 12b-1 fee expense, except for <strong>Franklin</strong> Flex Cap Growth Securities Fund and <strong>Franklin</strong> Large<br />
Cap Value Securities Fund, for which historical Class 2 performance is shown which includes<br />
a 12b-1 fee expense of 0.25% per year.<br />
54. Based on the most recent prospectus unless otherwise noted. Expenses differ as a result of<br />
the different class pricing structures; these may include a 12b-1 fee expense of 0.25% per<br />
year for Class 2 or Class 3 shares and 0.35% per year for Class 4 shares. Please refer to the<br />
fund’s prospectus for more information.<br />
55. Performance prior to the 5/1/00 merger reflects the historical performance of <strong>Templeton</strong> Developing<br />
Markets Trust, <strong>Templeton</strong> International Fund and <strong>Templeton</strong> Asset Allocation Fund, respectively.<br />
56. The fund’s manager and administrator have contractually agreed in advance to waive or limit<br />
their respective fees and to assume as their own expense certain expenses otherwise payable<br />
by the fund. If they had not taken this action, the fund’s total return would have been lower.<br />
Fee waivers and expense reimbursements may be discontinued at any time, upon notice to the<br />
fund’s Board, unless otherwise specified in the current prospectus.<br />
57. The total is greater than 100% due to a -25% position in cash, which is the result of a<br />
temporary imbalance between cash and the securities caused by the time needed to settle<br />
securities transactions.<br />
58. The fund is not a U.S. dollar money market fund, does not seek to maintain a stable net asset<br />
value, and should not be viewed as a substitute for a money market fund.<br />
59. The Additional Distribution was declared in excess of the Current Distribution in order to meet<br />
the year-end excise tax requirements.<br />
60. Due to rounding, the sum of portfolio holdings may not equal 100%.<br />
61. Formerly <strong>Franklin</strong> Puerto Rico Tax-Free Income Fund. Effective 12/1/01, the fund’s name<br />
changed; the investment goal and strategy remained the same.<br />
62. Formerly <strong>Franklin</strong> California Growth Fund. Effective 9/1/02, the fund’s name changed, and its<br />
investment criteria was modified.<br />
63. Prior to 9/30/08, the fund offered only a single class of shares, without a sales charge and Rule<br />
12b-1 fees, Advisor Class shares. Performance figures reflect a restatement of the Advisor Class<br />
performance to include both the Rule 12b-1 fees and sales charges applicable to each share<br />
class as though in effect from the fund’s inception. For periods after 9/30/08, actual<br />
performance is used, reflecting all charges and fees applicable to that class.<br />
64. The annualized percentage difference between a fund’s actual returns and its expected<br />
performance given its level of market risk, as measured by beta. Based on monthly returns<br />
over the last 3-year period. Source: © 2009 Thomson Reuters.<br />
65. Statistical measurement of the range of a fund’s total returns. In general, higher standard<br />
deviation means greater volatility. Based on monthly returns over the last 3-year period.<br />
Source: © 2009 Thomson Reuters.<br />
66. The fund’s manager has agreed in advance to reduce its fee from assets invested by the fund<br />
in a <strong>Franklin</strong> <strong>Templeton</strong> money fund (the Sweep Money Fund). This reduction is required by the<br />
Board of Trustees and an exemptive order of Securities and Exchange Commission; this<br />
arrangement will continue as long as the exemptive order is relied upon. If the fee reduction<br />
was not taken, the fund’s total return would have been lower.<br />
67. Source: Morningstar ® 3/31/09. The Morningstar Style Box reveals a fund’s investment<br />
strategy. For equity funds, the vertical axis shows the market capitalization of the stocks owned<br />
and the horizontal axis shows investment style (value, blend or growth). For fixed-income<br />
funds, the vertical axis shows the average credit quality of the bonds owned, and the horizontal<br />
axis shows interest rate sensitivity as measured by a bond’s duration (short, intermediate or<br />
long). All of these numbers are drawn from the fund portfolio holding figures most recently<br />
entered into Morningstar’s database and the corresponding market conditions. Historical data<br />
generally cover the past three years (or portion thereof for funds in existence less than three<br />
years) of quarterly data. Past performance does not guarantee future results. © 2009<br />
Morningstar, Inc. All rights reserved. The information contained herein: (1) is proprietary to<br />
Morningstar and/or its content providers; (2) may not be copied or distributed and (3) is not<br />
warranted to be accurate, complete or timely. Neither Morningstar nor its content providers are<br />
responsible for any damages or losses arising from any use of this information.<br />
68. Effective 1/1/02, the fund began offering Class R shares to certain eligible investors as<br />
described in the prospectus. This share class does not have sales charges.<br />
69. As of 12/31/08. Portfolio holdings are subject to change and may not represent current or<br />
future portfolio composition.<br />
70. A measure of the combined funds’ volatility relative to the S&P 500 Index. A beta less than<br />
1.00 indicates volatility less than the market’s. Based on monthly returns over the investment<br />
periods ended 6/30/09.<br />
71. CLOSED. <strong>Franklin</strong> New York Tax-Exempt Money Fund closed to new investors on 4/30/09.<br />
Pending shareholder approval, it is anticipated that the fund will merge into <strong>Franklin</strong><br />
Tax-Exempt Money Fund during the third quarter of 2009.<br />
6/30/09<br />
72. On 8/8/03, the fund converted from a closed-end fund to an open-end fund. Returns shown for<br />
periods prior to 8/8/03, are a restatement of the closed-end fund’s performance to include both<br />
the Rule 12b-1 fees and the current sales charges (unless so noted) applicable to each share<br />
class as though in effect from the fund’s inception. For periods after 8/8/03, actual<br />
performance is used, reflecting all charges and fees applicable to that class.<br />
73. Effective 1/1/04, Class C shares’ sales charge structure changed as follows: the 1% initial sales<br />
charge was eliminated and the CDSC period was reduced from 18 months to 12 months.<br />
74. Class C: Figures reflect the 1% contingent deferred sales charge to the extent applicable.<br />
75. Although U.S. government-sponsored entities may be chartered or sponsored by acts of<br />
Congress, their securities are neither insured nor guaranteed by the U.S. Treasury. Please see<br />
the fund’s prospectus for a detailed discussion regarding various levels of credit support for<br />
government agency or instrumentality securities. The fund’s yield and share price are not<br />
guaranteed and will vary with market conditions.<br />
76. Figures are as stated in the fund’s prospectus current as of the date of this report. Expenses<br />
differ as a result of the different class pricing structures. Please refer to page 128 of this<br />
guide and the fund’s prospectus for more information regarding Class A and Class C share<br />
pricing. Please note that expense ratios for this fund includes estimated indirect expenses of<br />
its underlying funds.<br />
77. Prior to 11/3/03, the fund offered only a single class of shares without a sales charge and Rule<br />
12b-1 expenses, Advisor Class shares. Performance figures reflect a restatement of the Advisor<br />
Class performance to include both the Rule 12b-1 fees and sales charges applicable to each<br />
share class as though in effect from the fund’s inception. For periods after 11/3/03, actual<br />
performance is used, reflecting all charges and fees applicable to that class.<br />
78. Formerly <strong>Franklin</strong> Short-Intermediate U.S. Government Securities Fund. Effective 9/1/04, the<br />
fund’s name changed; its investment goal and strategy remained the same.<br />
79. Source: Morningstar ® 12/31/08. The Morningstar Style Box reveals a fund’s investment<br />
strategy. For equity funds, the vertical axis shows the market capitalization of the stocks owned<br />
and the horizontal axis shows investment style (value, blend or growth). For fixed-income funds,<br />
the vertical axis shows the average credit quality of the bonds owned, and the horizontal axis<br />
shows interest rate sensitivity as measured by a bond’s duration (short, intermediate or long).<br />
All of these numbers are drawn from the fund portfolio holding figures most recently entered into<br />
Morningstar’s database and the corresponding market conditions. Historical data cover the past<br />
three years (or portion thereof for funds in existence less than three years) of quarterly data.<br />
Past performance does not guarantee future results. © 2009 Morningstar, Inc. All rights<br />
reserved. The information contained herein: (1) is proprietary to Morningstar and/or its content<br />
providers; (2) may not be copied or distributed and (3) is not warranted to be accurate, complete<br />
or timely. Neither Morningstar nor its content providers are responsible for any damages or<br />
losses arising from any use of this information.<br />
80. Effective 5/1/09, Mutual Qualified Fund changed its name to Mutual Quest Fund. The fund’s<br />
investment goal and strategy remained unchanged.<br />
81. Formerly <strong>Franklin</strong> Capital Growth Fund. Effective 12/15/99, the fund’s name and investment<br />
strategy changed. The investment goal remained the same.<br />
82. Formerly <strong>Franklin</strong> Small Cap Fund. Effective 5/1/05, the fund’s name and investment strategy<br />
changed. The investment goal remained the same.<br />
83. Formerly <strong>Franklin</strong> Value Securities Fund. Effective 5/1/02, the fund’s name and investment<br />
strategy changed. The investment goal remained the same.<br />
84. CFA ® and Chartered Financial Analyst ® are trademarks owned by CFA Institute.<br />
85. The total notional amount of these credit default swap agreements was $74,700,000 for high<br />
yield corporate bonds and $93,445,000 for investment grade corporate bonds as of 6/30/09.<br />
86. For investors subject to the alternative minimum tax, a small portion of fund dividends may<br />
be taxable. Distributions of capital gains are generally taxable. Dividends are generally<br />
subject to state and local taxes, if any.<br />
87. This fund level income was distributed to shareholders of record on 6/21/07 to ensure<br />
compliance with the regulated investment company distribution requirements and to<br />
minimize fund-level tax related expenses.<br />
88. Formerly <strong>Franklin</strong> Real Estate Fund. Effective 5/1/07, the fund’s name and its principal goal<br />
and main investments changed, as well as other characteristics of the fund.<br />
89. Advisor Class and Class Z shares are only offered to qualified investors that meet certain<br />
eligibility criteria including: purchases made through comprehensive fee or other advisory<br />
programs with a broker dealer and employer sponsored plans with at least $1 million in plan<br />
assets. Check with your broker dealer to see if Advisor Class and Class Z shares are available<br />
for sale at your firm. Please see prospectus for a complete list of eligibility criteria.<br />
90. Represents non-U.S. dollar-denominated foreign government bonds of countries that are not<br />
considered “developed” markets, but may be investment grade or non-investment grade rated.<br />
91. Because of its historical investment policy of investing net assets in insured municipal<br />
securities, the fund’s portfolio presently consists predominantly of insured municipal securities.<br />
92. Effective 5/1/09, Mutual Discovery Fund changed its name to Mutual Global Discovery Fund.<br />
The fund’s investment goal and strategy remained unchanged.<br />
93. Formerly Mutual Discovery Securities Fund. Effective 5/1/09, the fund’s name changed. The<br />
investment goal and strategy remained the same.<br />
94. Formerly <strong>Templeton</strong> Global Income Securities Fund. Effective 5/1/09, the fund’s name and<br />
investment strategy changed. The investment goal remained the same.<br />
Investment return and principal value for <strong>Franklin</strong>, <strong>Templeton</strong> and Mutual Series funds will<br />
fluctuate with market conditions, and investors may have a gain or loss when they sell their<br />
shares. Past performance does not guarantee future results.<br />
DEALER USE ONLY/NOT FOR DISTRIBUTION TO THE PUBLIC Go to franklintempleton.com or call (800) 223-2141 <strong>Dealer</strong> <strong>Facts</strong> <strong>Guide</strong> 127<br />
FOOTNOTES
FUND SALES CHARGES & COMMISSIONS<br />
Fund Sales Charges and Commissions<br />
CLASS A<br />
SALES DEALER<br />
ACCOUNT/PURCHASE SIZE CHARGE COMMISSION<br />
Equity Funds3 Less than $50,000 5.75% 5.00%<br />
$50,000 – $99,999 4.50% 3.75%<br />
$100,000 – $249,999 3.50% 2.80%<br />
$250,000 – $499,999 2.50% 2.00%<br />
$500,000 – $999,999 2.00% 1.60%<br />
$1,000,000 – $3,999,999 0.00% 6 up to 1.00% 8<br />
$4,000,000 – $50,000,000 0.00% 6 up to 0.50% 8<br />
$50,000,000 and over 0.00% 6 up to 0.25% 8<br />
Long-Term Fixed Less than $100,000 4.25% 4.00%<br />
Income Funds3 $100,000 – $249,999 3.50% 2.80%<br />
$250,000 – $499,999 2.50% 2.00%<br />
$500,000 – $999,999 2.00% 1.60%<br />
$1,000,000 – $3,999,999 0.00% 6 up to 0.75% 8<br />
$4,000,000 – $50,000,000 0.00% 6 up to 0.50% 8<br />
$50,000,000 and over 0.00% 6 up to 0.25% 8<br />
Intermediate- and Less than $100,000 2.25% 2.00%<br />
Limited-Term<br />
Fixed Income Funds $100,000 – $249,999 1.75% 1.50%<br />
$250,000 – $499,999 1.25% 1.00%<br />
$500,000 – $999,999 1.00% 0.85%<br />
$1,000,000 – $3,999,999 0.00% 6 up to 0.75% 8<br />
$4,000,000 – $50,000,000 0.00% 6 up to 0.50% 8<br />
$50,000,000 and over 0.00% 6 up to 0.25% 8<br />
Maximum 12b-1 fees paid to dealer17 All equity funds<br />
EXCEPT<br />
0.25%<br />
<strong>Franklin</strong> Income Fund 0.15%<br />
<strong>Franklin</strong> Utilities Fund 0.15%<br />
All long-term tax-free income funds 0.10%<br />
All long-term taxable fixed income funds<br />
EXCEPT<br />
0.25%<br />
<strong>Franklin</strong> High Income Fund 0.15%<br />
<strong>Franklin</strong> Strategic Mortgage Portfolio 0.00%<br />
<strong>Franklin</strong> U.S. Government Securities Fund 0.15%<br />
All intermediate-term tax-free income funds 0.10%<br />
All intermediate-term taxable income funds<br />
EXCEPT<br />
0.25%<br />
<strong>Franklin</strong> Limited Maturity U.S.Gov’t. Securities Fund 0.10%<br />
All limited-term tax-free income funds 0.15%<br />
1. An “Employer-Sponsored Retirement Plan” refers to a Qualified Retirement Plan, ERISAcovered<br />
403(b) and certain non-qualified deferred compensation arrangements that<br />
operate in a similar manner to a Qualified Retirement Plan, such as 457 plans and<br />
executive deferred compensation arrangements, but not including employer-sponsored<br />
IRAs. A “Qualified Retirement Plan” is an employer- sponsored pension or profit sharing<br />
plan that qualifies under section 401(a) of the Internal Revenue Code, including 401(k),<br />
money purchase pension, profit sharing and defined benefit plans.<br />
2. Maximum sales charges vary by fund, from 0% to 5.75%. For fixed income funds,<br />
maximum dealer commission varies by fund from 0% to 4.00%.<br />
3. <strong>Franklin</strong> Income Fund and <strong>Franklin</strong> Utilities Fund follow the long-term, fixed income funds’<br />
pricing schedule. Please see prospectus for details.<br />
6/30/09<br />
CLASS B 9<br />
EQUITY FIXED INCOME<br />
FUNDS3 FUNDS3 Front-end sales charge paid by investor 0.00% 0.00%<br />
Commission paid to dealer NA 9 NA 9<br />
CDSC 5 Year 1 4.00% 4.00%<br />
Year 2 4.00% 4.00%<br />
Year 3 3.00% 3.00%<br />
Year 4 3.00% 3.00%<br />
Year 5 2.00% 2.00%<br />
Year 6 1.00% 1.00%<br />
Year 7 0.00% 0.00%<br />
Class B converts to the same fund’s Class A after<br />
eight years of each investment.<br />
Maximum 12b-1 fees paid to dealer 0.25% 0.15%<br />
CLASS C<br />
EQUITY FIXED INCOME<br />
FUNDS3 FUNDS3 Front-end sales charge paid by investor<br />
Commission paid to dealer<br />
0.00% 0.00%<br />
<strong>Franklin</strong> <strong>Templeton</strong> Distributors, Inc., upfront payment 0.75% 0.85%<br />
Advanced 12b-1 service fee for year 1 0.25% 0.15%<br />
Total up-front commission 1.00% 8 1.00% 8<br />
CDSC (shares redeemed within 12 months of purchase) 5 Maximum 12b-1 fees paid to dealer<br />
1.00% 1.00%<br />
10<br />
Service fee 0.25% 0.15%<br />
Asset-based charge 0.75% 0.50%<br />
Total 12b-1 fees 1.00% 0.65%<br />
CLASS R 8<br />
EQUITY FIXED INCOME<br />
FUNDS3 FUNDS<br />
Front-end sales charge paid by investor 0.00% 0.00%<br />
Commission paid to dealer8 0.00% 0.00%<br />
CDSC 0.00% 0.00%<br />
Maximum 12b-1 fees paid to dealer 0.50% 0.50%<br />
4. Availability determined by recordkeeper.<br />
5. Please see each fund’s prospectus and SAI for CDSC waivers.<br />
6. For NAV purchases of $1 million or more, a CDSC may apply (1.00% for equity funds or<br />
0.75% for fixed income funds) to shares redeemed within 18 months.<br />
7. <strong>Dealer</strong> commission for equity funds includes 0.75% prepaid commission and 0.25%<br />
advance of first year’s 12b-1 service fee. <strong>Dealer</strong> commission for fixed income funds<br />
includes 0.85% prepaid commission and 0.15% advance of first year’s 12b-1 service fee.<br />
8. Effective 5/1/06, upfront commission is no longer provided on Employer Sponsored<br />
Retirement Plans. The dealer trail will begin to accrue immediately.<br />
128 <strong>Dealer</strong> <strong>Facts</strong> <strong>Guide</strong> Go to franklintempleton.com or call (800) 223-2141 DEALER USE ONLY/NOT FOR DISTRIBUTION TO THE PUBLIC
Fund Sales Charges and Commissions, cont’d.<br />
Pricing Structures<br />
FEATURES<br />
General Client Profile<br />
Sales Charges & Commissions<br />
Maximum Initial Sales Charge<br />
Back-end (Contingent deferred<br />
sales charge, CDSC) 5<br />
Maximum <strong>Dealer</strong> Commission<br />
Maximum <strong>Dealer</strong> Trail<br />
Purchases<br />
Minimum Initial Investment11 Maximum Lump Sum Investment<br />
Automatic Investment Plan<br />
Redemptions<br />
SWIP<br />
90 Day Reinstatement16 Redemption Order<br />
Exchanges<br />
Available Funds<br />
Distributions<br />
Dividends/Capital Gains (Relative)<br />
Directed to Another Fund<br />
Expenses (Relative)<br />
SEC Yield (Relative)<br />
Newspaper Listing<br />
CLASS A<br />
Investors with a long-term<br />
perspective and/or are investing<br />
larger amounts who want to avoid<br />
higher ongoing expenses and fees<br />
Investors who want to take<br />
advantage of breakpoints through<br />
large share quantity purchases<br />
2, 3<br />
5.75% for Equity Funds<br />
2, 3<br />
4.25% for Fixed Income Funds<br />
None 5,6<br />
5.00% for Equity Funds3 2, 3<br />
4.00% for Fixed Income Funds<br />
0.25% for Equity Funds<br />
0.10-0.25% for Fixed Income Funds<br />
Generally $1,000<br />
None<br />
Yes<br />
Yes<br />
Yes, at NAV<br />
FIFO 5<br />
Within class only<br />
Higher than B, C & R<br />
Within class only<br />
Generally lower than B, C & R<br />
Generally lower than B, C & R<br />
“A” follows fund names<br />
CLASS B 9<br />
No longer available<br />
None<br />
Declines to zero after six years: 5<br />
Yrs 1 & 2: 4.00%, Yrs 3 & 4: 3.00%,<br />
Yr 5: 2.00%, Yr 6: 1.00%, Yr 7:<br />
0.00%<br />
NA 9<br />
0.25% for Equity Funds<br />
0.15% for Fixed Income Funds<br />
No longer available<br />
Yes<br />
Yes, into Class A at NAV 13<br />
FIFO 5<br />
Within class only<br />
Lower than A & R, same as C<br />
Within class only<br />
Generally higher than A & R<br />
Generally higher than A & C,<br />
same as R<br />
“B” follows fund names<br />
9. New sales of Class B shares have been discontinued. Existing B shareholders may<br />
continue to reinvest dividends and exchange their shares for other B shares.<br />
10. 12b-1 service fees are paid in advance for the first year at the time of purchase. <strong>Franklin</strong><br />
<strong>Templeton</strong> Distributors, Inc. retains the asset-based charge in the first year. Qualifying<br />
dealers will earn the full 12b-1 fee (service fee and asset based charge) beginning in the<br />
13th month.<br />
11. Exceptions apply. Please see prospectus for details.<br />
12. Purchases for larger amounts will be processed automatically as Class A.<br />
13. Effective 2/1/05, proceeds from Class B redemptions reinvested within 90 days are<br />
invested in Class A at NAV. Shareholders will not receive credit for any previously paid<br />
CDSC.<br />
CLASS C<br />
Investors with a shorter investment<br />
time horizon and/or who are<br />
investing smaller amounts<br />
Investors who prefer to “pay as<br />
they go” for professional<br />
investment advice<br />
CLASS R<br />
Employer Sponsored Retirement<br />
Plans1 DEALER USE ONLY/NOT FOR DISTRIBUTION TO THE PUBLIC Go to franklintempleton.com or call (800) 223-2141 <strong>Dealer</strong> <strong>Facts</strong> <strong>Guide</strong> 129<br />
None<br />
1.00% for 12 months 5<br />
7, 8 1.00%<br />
1.00% for Equity Funds, 0.65% for<br />
Fixed Income Funds 11<br />
Generally $1,000<br />
$999,999 12<br />
Yes<br />
Yes<br />
Yes<br />
FIFO 5<br />
Within class only<br />
Lower than A & R, same as B<br />
Within class only<br />
Generally higher than A & R<br />
Generally higher than A, lower than<br />
B & R<br />
“C” follows fund names<br />
None<br />
None<br />
NA 8<br />
0.50% accrues immediately 8<br />
NA<br />
None<br />
Yes<br />
Yes<br />
Yes<br />
FIFO 5<br />
Within class only 15<br />
Lower than A, higher than B & C<br />
Within class only4 Generally higher than A, lower<br />
than B & C<br />
Generally higher than A & C,<br />
same as B<br />
“R” follows fund names<br />
6/30/09<br />
14. An “Investment Only Plan” is an Employer-Sponsored Retirement Plan, other than a<br />
<strong>Franklin</strong> <strong>Templeton</strong> 401(k) Services Plan, investing in <strong>Franklin</strong> <strong>Templeton</strong> fund shares<br />
through a non-<strong>Franklin</strong> <strong>Templeton</strong> affiliated plan trustee.<br />
15. <strong>Franklin</strong> <strong>Templeton</strong> 401(k) Services Plans may exchange or direct contri butions into A<br />
shares if a fund selection does not offer an R share.<br />
16. Effective 2/1/05, the reinstatement period became 90 days.<br />
17. Annual 12b-1 fees are paid quarterly to qualifying dealers. For A share purchases at NAV,<br />
dealer trail generally starts in the 13th month.<br />
FUND SALES CHARGES & COMMISSIONS
FUND SALES CHARGES & COMMISSIONS<br />
Fund Sales Charges and Commissions, cont’d.<br />
Retirement Products Pricing Structures<br />
Eligible for purchase. 18<br />
RETIREMENT BUSINESS CLASS A CLASS C CLASS R ADVISOR/Z CLASS<br />
Traditional IRAs, Roth IRAs,<br />
SIMPLE IRAs, SEP IRAs,<br />
Non-ERISA Covered 403(b) Plans<br />
Eligible for purchase. 18 Not available. Generally not available to<br />
individuals.<br />
Rollover IRAs5 Eligible for purchase. 18 Eligible for purchase at<br />
Not available. Generally not available to<br />
applicable sales charges.<br />
Eligible for purchase at NAV<br />
if investor rolls assets over<br />
directly from a <strong>Franklin</strong><br />
<strong>Templeton</strong> 401(k) Services Plan<br />
to a <strong>Franklin</strong> <strong>Templeton</strong> IRA.<br />
<strong>Dealer</strong> trail accrues immedi ately.<br />
No prepaid commissions apply.<br />
Subse quent purchases will<br />
follow standard A share pricing.<br />
individuals.<br />
Retirement Division<br />
Investment-Only Plans 5,14<br />
(Non FT-Affiliated Trustee)<br />
Eligible for purchase for plans<br />
with less than $1 million<br />
in assets, at applicable<br />
sales charge.<br />
Eligible for NAV purchases<br />
for plans with $1 million<br />
or more in plan assets.<br />
Generally dealer trail accrues<br />
immediately. No prepaid<br />
commissions or CDSC applies.<br />
Eligible for purchase. 18<br />
<strong>Dealer</strong> trail accrues<br />
immediately. No prepaid<br />
commissions apply. 8<br />
Eligible for purchase.<br />
<strong>Dealer</strong> trail accrues<br />
immediately. No prepaid<br />
commissions apply. 8<br />
18. Refer to Fund Sales Charges and Commissions (pages 128-129) for more information on eligible purchases under Class A, C, R and Advisor/Z share pricing.<br />
Eligible for purchase if<br />
investment minimums<br />
are met.<br />
No prepaid commissions<br />
or dealer trail apply.<br />
6/30/09<br />
130 <strong>Dealer</strong> <strong>Facts</strong> <strong>Guide</strong> Go to franklintempleton.com or call (800) 223-2141 DEALER USE ONLY/NOT FOR DISTRIBUTION TO THE PUBLIC
Separate Accounts (800) 822-8464<br />
FRANKLIN TEMPLETON PORTFOLIO<br />
ADVISORS, INC. (FTPA) offers private asset<br />
manage ment to individuals and institutional<br />
clients through financial advisors associated<br />
with wirehouse firms, regional broker/dealers,<br />
independent broker/dealers and banks.<br />
6/30/09<br />
Brad Hanson, SVP, National Director of Sales<br />
EXT.<br />
22093<br />
Jan Marshall, VP, Director of Business Relations 23656<br />
Todd Stewart, VP, Director, Internal Sales and Business Administration 24396<br />
Marc Centeno, Supervisor, Internal Sales 37879<br />
Regional Director Teams<br />
AK, AZ, CA, HI, ID, MT, NV, OR, UT, WA, WY Bob Reyen 23275<br />
Jeff Gilbert, Sr. Regional Portfolio Specialist 24297<br />
AL, CT, DC, DE, FL, GA, MA, MD, ME, MS, NC, D. Craig Maxwell 22097<br />
NH, NJ, NY, PA, RI, SC, TN, VA, VT, WV Guy DeWald, Sr. Regional Portfolio Specialist 37888<br />
AR, CO, IA, IL, IN, KS, KY, LA, MI, MN, MO, Michael A. Wasz 22096<br />
ND, NE, NM, OH, OK, SD, TX, WI Jennifer Strachan, Sr. Regional Portfolio Specialist 37190<br />
Offshore Products (800) 233-9796 or (727) 299-5042<br />
FRANKLIN TEMPLETON INVESTMENT<br />
FUNDS (FTIF) is a Luxembourg registered<br />
offshore umbrella product offering<br />
investors, who are non-U.S. citizens and<br />
non-U.S. residents, a wide choice of over<br />
60 sub-funds.<br />
Bill Pingleton, President, Managing Director<br />
Americas<br />
Michel Tulle, Senior Director<br />
Americas<br />
Shane Cunningham, National Sales Manager<br />
North America<br />
Offshore Wholesalers<br />
Beatriz Salvat Jason Shidler<br />
Elisa Granados-Anderson Johanna Falkowitz<br />
EXT.<br />
Marcus Vinicius, Director Investment Channels<br />
David Deschenes, Key Account Manager 33252<br />
Susanne Shahab, <strong>Dealer</strong> Relations Coordinator 33251<br />
Internal Wholesalers<br />
West: Jessica Conrado 33262<br />
Northeast: Jack Leung 33255<br />
Southeast: Daniele Frontela 33253<br />
Retirement Division (800) 530-2432<br />
FRANKLIN TEMPLETON RETIREMENT INVESTMENT ONLY SERVICES<br />
Specialists<br />
OPEN (West)<br />
EXT.<br />
Jim Huennekens (Central) 36501<br />
Gary Giffen (East) 38303<br />
Ben Gustafson, Internal Wholesaler 37143<br />
DEALER USE ONLY/NOT FOR DISTRIBUTION TO THE PUBLIC Go to franklintempleton.com or call (800) 223-2141 <strong>Dealer</strong> <strong>Facts</strong> <strong>Guide</strong> 131<br />
WHOLESALER LISTINGS SEPARATE ACCOUNTS • OFFSHORE PRODUCTS • RETIREMENT DIVISION INDEPENDENT & BANK DIVISION NYSE DIVISION
SEPARATE ACCOUNTS • OFFSHORE PRODUCTS • RETIREMENT DIVISION WHOLESALER LISTINGS<br />
INDEPENDENT & BANK DIVISION<br />
NYSE DIVISION<br />
Independent and Bank Division (800) 462-1264<br />
Wholesaler Teams EXT.<br />
Alabama Billy Rhodes 34048<br />
Amanda McCain, Internal<br />
Alaska Robert Gonzalez 22928<br />
Kevin Borella, Internal<br />
Arizona Patrick Vance 25822<br />
NORTH (Including Scottsdale) Kristina Currie, Internal<br />
SOUTH (Excluding Scottsdale) Steve Sullivan 23063<br />
Tim Duellman, Internal<br />
Arkansas Ken Parrish 36548<br />
Susan Nguyen, Internal<br />
California John Concepcion 28255<br />
NORTH (Sacramento Area) Shana Aleem, Internal<br />
N. BAY – SAN FRANCISCO PENINSULA Matt Cost 28450<br />
(Ukiah to Monterey) Kevin Borella, Internal<br />
EAST BAY VALLEY (Oakland, Alameda County, JB Walker 22525<br />
Contra Costa County, Lodi, Modesto,<br />
Stockton & Fresno)<br />
Sean Burke, Internal<br />
CENTRAL (Bakersfield, San Luis Obispo & Jeff Vollmer 22676<br />
Santa Barbara) OPEN, Internal<br />
SAN FERNANDO VALLEY & WEST LA Steve Sain 28230<br />
(Beverly Hills & Hollywood) Tina White, Internal<br />
CENTRAL LA (Downtown LA, San Gabriel Dori Hetrick 27603<br />
Valley & South Bay) Harley Lukenbill, Internal<br />
TAHOE Eric Momsen<br />
Ian Gookin, Internal<br />
28285<br />
DESERT CITIES (Beaumont, Sun City & Gustavo De La Roca 22038<br />
Palm Springs) Suzanne Smith, Internal<br />
SOUTHERN CALIFORNIA (Long Beach to Diane Tallarico 28226<br />
San Clemente; Barstow to Marrietta) Pamela Hung, Internal<br />
SAN DIEGO COUNTY (Greater San Diego; John Lundy 28239<br />
Oceanside to San Diego E.) Betsy Kaplan, Internal<br />
Colorado Dan Almuti<br />
Ken Aquino, Internal<br />
24822<br />
Connecticut Scott Mansfield<br />
Bob MacDonald, Internal<br />
36512<br />
Delaware Scott Rogers<br />
Alan Jardeleza, Internal<br />
36503<br />
District of Columbia Angie Bradshaw<br />
Andre Buchanan, Internal<br />
23844<br />
Florida Billy Rhodes 34048<br />
PANHANDLE (Including Tallahassee) Amanda McCain, Internal<br />
NORTH (Jacksonville, Lakeland & Orlando) Dan Bone<br />
Mike Connors, Internal<br />
36526<br />
SOUTH CENTRAL (Melbourne to Delray Beach; Sherman Goodrich 36505<br />
Ft. Myers & Pt. Charlotte) Misty Caber, Internal<br />
SOUTHEAST (Boca Raton & Miami) Andrew Bockstein<br />
Brian Sladek, Internal<br />
37166<br />
WEST CENTRAL (Springhill to Venice) Brian Brennemen<br />
Jonathan Baulsir, Internal<br />
36543<br />
Georgia Russell Magbee<br />
Jonathan Barrett, Internal<br />
37780<br />
Guam John Concepcion<br />
Shana Aleem, Internal<br />
28255<br />
Hawaii John Concepcion<br />
Shana Aleem, Internal<br />
28255<br />
6/30/09<br />
Idaho Robert Thompson<br />
EXT.<br />
28207<br />
NORTH Sean Mahoney, Internal<br />
SOUTH (Boise) Damian Eckstein<br />
Matt Pickard, Internal<br />
28451<br />
Illinois Joe Clancy 28243<br />
NORTH METRO Ed Kosarich, Internal<br />
Metro Chicago & South Metro Phil Haning<br />
Chris Colon, Internal<br />
36523<br />
SOUTH Jeff Nymark<br />
Ed Defeo, Internal<br />
33429<br />
Indiana Ben Schlueter 36551<br />
NORTH (Including Indianapolis) Nick Dawson, Internal<br />
SOUTH Kevin Russell<br />
Ray Carollo, Internal<br />
36538<br />
Iowa Jim De Kruif 37188<br />
EAST Chris Robinson, Internal<br />
WEST Sean Cullinane<br />
Teresa Auty, Internal<br />
23611<br />
Kansas Roy Tirakayos 36557<br />
Metro Kansas City Suzanne Smith, Internal<br />
Excluding Metro Kansas City Dan Cestary<br />
Peter Ordal, Internal<br />
37262<br />
Kentucky Joe Westendorf 36509<br />
Northern (Greater Cincinnati Metro Area) Brian Boulerice, Internal<br />
Excluding Greater Cincinnati Metro Area Tom Temeyer<br />
Susan Nguyen, Internal<br />
35231<br />
Louisiana Ken Parrish 36548<br />
NORTH Susan Nguyen, Internal<br />
SOUTH Allen Kuhn<br />
Mark Indgjer, Internal<br />
28124<br />
Maine Darren Doughty<br />
Jonathan Baulsir, Internal<br />
36530<br />
Maryland Scott Rogers<br />
Alan Jardeleza, Internal<br />
36503<br />
Massachusetts Adrian Jackson<br />
David Preston, Internal<br />
36508<br />
Michigan Paul Silva 37740<br />
Detroit, Ann Arbor, Flint Galey Gravenstein, Internal<br />
WEST Steve Glover<br />
Michael Cimarik, Internal<br />
36533<br />
Minnesota Jeffery Rose 28282<br />
NORTH (Minneapolis Metro Area) Brett Kautter, Internal<br />
SOUTH (St. Paul Metro Area) John Kelly<br />
Nick Biddle, Internal<br />
28231<br />
NORTHWEST David Douglas<br />
Brett Kautter, Internal<br />
38082<br />
Mississippi Chris Jenkins 36514<br />
NORTH (Greater Memphis Area) Johanna Hagel, Internal<br />
SOUTH Jonathan Thompson<br />
Vinny Minutolo, Internal<br />
37278<br />
Missouri Bob Whiting 27851<br />
EAST Andy Cunningham, Internal<br />
WEST Roy Tirakayos<br />
Suzanne Smith, Internal<br />
36557<br />
Montana Robert Gonzalez<br />
Kevin Borella, Internal<br />
22928<br />
132 <strong>Dealer</strong> <strong>Facts</strong> <strong>Guide</strong> Go to franklintempleton.com or call (800) 223-2141 DEALER USE ONLY/NOT FOR DISTRIBUTION TO THE PUBLIC
Independent and Bank Division, cont’d. (800) 462-1264<br />
Nebraska Sean Cullinane 23611<br />
Teresa Auty, Internal<br />
Nevada Eric Momsen 28285<br />
NORTH (Reno & Lake Tahoe Area) Ian Gookin, Internal<br />
SOUTH (Las Vegas) Damian Eckstein 28451<br />
Matt Pickard, Internal<br />
New Hampshire Darren Doughty 36530<br />
Jonathan Baulsir, Internal<br />
New Jersey Stephen May 36520<br />
NORTH Marek Blaskovic, Internal<br />
SOUTH Rich Wriedt 28263<br />
Joe Valencia, Internal<br />
New Mexico Gustavo De La Roca 22038<br />
Suzanne Smith, Internal<br />
New York David McLaughlin 36532<br />
Upstate Jonathan Marville, Internal<br />
5 Boroughs Phil Hemery 36522<br />
Ken Nyiri, Internal<br />
Long Island Bill Sheluck 36536<br />
Richard Uhlmann, Internal<br />
Westchester County to Albany Kevin Carevic 37181<br />
Katrina Kerber, Internal<br />
North Carolina David Gullison 35054<br />
EAST Jared Motzenbecker, Internal<br />
WEST Ken Jones 36510<br />
Andrew Aiello, Internal<br />
North Dakota David Douglas 38082<br />
Brett Kautter, Internal<br />
Ohio Gary Lydrickson 36515<br />
NORTHEAST Christian Haymond, Internal<br />
NORTHWEST (Toledo) Ben Schlueter 36551<br />
Nick Dawson, Internal<br />
SOUTH Joe Westendorf 36509<br />
Brian Boulerice, Internal<br />
Oklahoma Ryan Mason 28214<br />
Jason Hurtienne, Internal<br />
Oregon Darren Kinney 25807<br />
Kathleen Gill, Internal<br />
Pennsylvania Michael Sliney 36513<br />
Eastern Denise Daniels, Internal<br />
Western Doug LaFay 36539<br />
Rob Bryarly, Internal<br />
Puerto Rico Andrew Bockstein 37166<br />
Brian Sladek, Internal<br />
Rhode Island Adrian Jackson 36508<br />
David Preston, Internal<br />
South Carolina Jonathan Thompson 37278<br />
Vinny Minutolo, Internal<br />
South Dakota David Douglas 38082<br />
Brett Kautter, Internal<br />
Tennessee Tom Hoyt 36506<br />
EAST Mike Magnetta, Internal<br />
WEST (Greater Nashville Metro Area) Chris Jenkins 36514<br />
Johanna Hagel, Internal<br />
EXT.<br />
6/30/09<br />
Texas Allen Kuhn 28124<br />
Greater Houston Mark Indgjer, Internal<br />
NORTH CENTRAL (Corsicana, Dallas/ Bryan Sullivan 22450<br />
Fort Worth & Greenville) Frank Zasa, Internal<br />
EAST (Paris to Lufkin) Dan Cestary 37262<br />
Pete Ordal, Internal<br />
Abilene, Waco, Wichita Falls Todd Ermenio 28211<br />
Sharlene Ching, Internal<br />
Austin to San Antonio & Victoria Joseph Piccolo 27035<br />
Lori Kamuf, Internal<br />
El Paso Gustavo De La Roca 22038<br />
Suzanne Smith, Internal<br />
DEALER USE ONLY/NOT FOR DISTRIBUTION TO THE PUBLIC Go to franklintempleton.com or call (800) 223-2141 <strong>Dealer</strong> <strong>Facts</strong> <strong>Guide</strong> 133<br />
EXT.<br />
NORTHWEST/SOUTHWEST Fred Miller 37266<br />
(Amarillo, Corpus Christi, Laredo, Lubbock,<br />
Midland & San Angelo)<br />
Mark Indgjer, Internal<br />
Utah Damian Eckstein<br />
Matt Pickard, Internal<br />
28451<br />
Vermont Darren Doughty<br />
Jonathan Baulsir, Internal<br />
36530<br />
Virgin Islands Andrew Bockstein<br />
Brian Sladek, Internal<br />
37166<br />
Virginia Angie Bradshaw 23844<br />
NORTH Andre Buchanan, Internal<br />
SOUTH David Gullison<br />
Jared Motzenbecker, Internal<br />
35054<br />
Washington Darren Kinney 25807<br />
Vancouver Kathleen Gill, Internal<br />
WESTERN Peter Black<br />
Duc Nguyen, Internal<br />
28238<br />
EASTERN Robert Thompson<br />
Sean Mahoney, Internal<br />
28207<br />
West Virginia Tom Temeyer<br />
Susan Nguyen, Internal<br />
35231<br />
Wisconsin Dan Peterson<br />
Peter Ordal, Internal<br />
36534<br />
Wyoming Robert Gonzalez 22928<br />
NORTHWEST Kevin Borella, Internal<br />
SOUTHEAST Chris Burt<br />
Chris Schurawel, Internal<br />
27420<br />
National Sales Manager<br />
Bob Geppner 37335<br />
Divisional Sales Managers<br />
NORTHEAST CT, MA, ME, NH, NY, PA, RI, VT Dan Grip 36521<br />
MID-ATLANTIC DC, DE, MD, NC, NJ, PA, VA Roger Michaud 36518<br />
SOUTHEAST AL, FL, GA, LA, MS, PR, SC,<br />
TX, VI<br />
Joe Epstein 37202<br />
GREAT LAKES AL, AR, IN, KY, LA, MI, OH, TN Michael Mahoney 28266<br />
MIDWEST IA, IL, MN, MO, ND, NE, SD, WI Dan Reinhold 37727<br />
SOUTHWEST AZ, CA, CO, ID, KS, MO, NM, NV, Jim Escobedo<br />
OK, UT, WY<br />
38204<br />
PACIFIC AK, CA, HI, ID, MT, NV, OR, WA,<br />
WY, GUAM<br />
John McGee 24842<br />
WHOLESALER LISTINGS SEPARATE ACCOUNTS • OFFSHORE PRODUCTS • RETIREMENT DIVISION INDEPENDENT & BANK DIVISION NYSE DIVISION
SEPARATE ACCOUNTS • OFFSHORE PRODUCTS • RETIREMENT DIVISION WHOLESALER LISTINGS<br />
INDEPENDENT & BANK DIVISION<br />
NYSE DIVISION<br />
NYSE Division (800) 462-1216<br />
Wholesaler Teams EXT.<br />
Alabama Tom Hoyt 36506<br />
NORTH (Huntsville) Mike Magnetta, Internal<br />
SOUTH Billy Rhodes 34048<br />
Amanda McCain, Internal<br />
Alaska Robert Gonzalez 22928<br />
Kevin Borella, Internal<br />
Arizona Patrick Vance 25822<br />
NORTH (Excluding Scottsdale) Kristina Currie, Internal<br />
SOUTH (Including Scottsdale) Steve Sullivan 23063<br />
Tim Duellman, Internal<br />
Arkansas Ken Parrish 36548<br />
Susan Nguyen, Internal<br />
California Eric Momsen 28285<br />
CENTRAL VALLEY (Sacramento, Stockton, Fresno) Ian Gookin, Internal<br />
NORTH (Chico, Redding) John Concepcion<br />
Shana Aleem, Internal<br />
28255<br />
N. BAY SAN FRANCISCO PENINSULA Jack Schultz 28256<br />
(Ukiah to Monterey) Rica de Jesus, Internal<br />
CENTRAL COAST (Bakersfield, San Fernando Jeff Vollmer 22676<br />
Valley & Santa Barbara) OPEN, Internal<br />
SOUTH (Palos Verdes, Orange Co., Escondido) Adam Barnett<br />
Pritika Chand, Internal<br />
23555<br />
GREATER LOS ANGELES SOUTH (N. LA, David Lachina 26753<br />
Santa Monica, Beverly Hills, Pasadena) Andrew Prupas<br />
SOUTHERN CALIFORNIA (Greater San Diego Area) John Lundy<br />
Betsy Kaplan, Internal<br />
28239<br />
DESERT CITIES (Beaumont, Sun City & Gustavo De La Roca 22038<br />
Palm Springs) Suzanne Smith, Internal<br />
Colorado Chris Burt<br />
Chris Schurawel, Internal<br />
27420<br />
Connecticut Rob Bonner<br />
Matthew Bartlett, Internal<br />
36502<br />
Fairfield County Kevin Folks<br />
John Spiecher, Internal<br />
36528<br />
Delaware David McDonough<br />
Victor Vanzo, Internal<br />
36529<br />
District of Columbia Ian Valentine<br />
Bill Kimbrough, Internal<br />
36511<br />
Florida Billy Rhodes 34048<br />
PANHANDLE (Including Tallahassee) Amanda McCain, Internal<br />
NORTH (Jacksonville, Lakeland & Orlando) Dan Bone<br />
Mike Connors, Internal<br />
36526<br />
SOUTH CENTRAL (Melbourne to Delray Beach; Sherman Goodrich 36505<br />
Ft. Myers & Pt. Charlotte) Misty Caber, Internal<br />
SOUTHEAST (Boca Raton & Miami) Andrew Bockstein<br />
Brian Sladek, Internal<br />
37166<br />
WEST CENTRAL (Springhill to Venice) Brian Brenneman<br />
Jonathan Baulsir, Internal<br />
36543<br />
Georgia Bobby Wilmath<br />
Craig Miller, Internal<br />
36542<br />
Guam John Concepcion<br />
Shana Aleem, Internal<br />
28255<br />
Hawaii John Concepcion<br />
Shana Aleem, Internal<br />
28255<br />
Idaho Robert Thompson 28207<br />
NORTH Sean Mahoney, Internal<br />
SOUTH (Boise) Damian Eckstein<br />
Matt Pickard, Internal<br />
28451<br />
6/30/09<br />
Illinois Jim De Kruif<br />
EXT.<br />
37188<br />
Moline & Rock Island (Metro Only) Chris Robinson, Internal<br />
NORTH Chicago Metro & Rockford Tom Peterson<br />
Eric Fenger, Internal<br />
37180<br />
SOUTH Jeff Nymark<br />
Ed Defeo, Internal<br />
33429<br />
Indiana Ben Schlueter 36551<br />
NORTH Nicholas Dawson, Internal<br />
SOUTH (Including Indianapolis) Kevin Russell<br />
Ray Carollo, Internal<br />
36538<br />
Iowa Jim De Kruif 37188<br />
EAST Chris Robinson, Internal<br />
WEST Sean Cullinane<br />
Teresa Auty, Internal<br />
23611<br />
Kansas Bill Kerns 28286<br />
Greater Kansas City Metro Nick Horton, Internal<br />
Excluding Kansas City Metro Dan Cestary<br />
Peter Ordal, Internal<br />
37262<br />
Kentucky John Dean 36544<br />
Northern (Greater Cincinnati Metro Area) Heather Hester, Internal<br />
Louisville Kevin Russell<br />
Ray Carollo, Internal<br />
36538<br />
Excluding Greater Cincinnati Metro & Louisville Tom Temeyer<br />
Susan Nguyen, Internal<br />
35231<br />
Louisiana Ken Parrish 36548<br />
NORTH Susan Nguyen, Internal<br />
SOUTH Rob Richardson<br />
Leanne Luttges, Internal<br />
28213<br />
Maine Darren Doughty<br />
Jonathan Baulsir, Internal<br />
36530<br />
Maryland David McDonough<br />
Victor Vanzo, Internal<br />
36529<br />
Massachusetts Rob Bonner<br />
Matthew Bartlett, Internal<br />
36502<br />
Michigan Andrew Fischer<br />
Jason Nymark, Internal<br />
36555<br />
UPPER PENINSULA Steve Glover<br />
Michael Cimarik, Internal<br />
36533<br />
Minnesota Jeffery Rose 28282<br />
NORTH (Including Greater Minneapolis/<br />
St. Paul Metro Area)<br />
Brett Kautter, Internal<br />
SOUTH John Kelly<br />
Nick Biddle, Internal<br />
28231<br />
NORTHWEST David Douglas<br />
Brett Kautter, Internal<br />
38082<br />
Mississippi Chris Jenkins 36514<br />
NORTH (Greater Memphis Area) Johanna Hagel, Internal<br />
SOUTH Jonathan Thompson<br />
Vinny Minutolo, Internal<br />
37278<br />
Missouri Bill Kerns<br />
Nick Horton, Internal<br />
28286<br />
Montana Robert Gonzalez<br />
Kevin Borella, Internal<br />
22928<br />
Nebraska Sean Cullinane<br />
Teresa Auty, Internal<br />
23611<br />
134 <strong>Dealer</strong> <strong>Facts</strong> <strong>Guide</strong> Go to franklintempleton.com or call (800) 223-2141 DEALER USE ONLY/NOT FOR DISTRIBUTION TO THE PUBLIC
NYSE Division, cont’d. (800) 462-1216<br />
Nevada Eric Momsen 28285<br />
NORTH (Reno & Lake Tahoe Area) Ian Gookin, Internal<br />
SOUTH (Las Vegas) Adam Barnett 23555<br />
Pritika Chand, Internal<br />
New Hampshire Darren Doughty 36530<br />
Jonathan Baulsir, Internal<br />
New Jersey Kevin Golden 36546<br />
NORTH (Including Princeton & Red Bank) Derrick Yapp, Internal<br />
SOUTH (Excluding Princeton & Red Bank) John Nesnay 35035<br />
Peter Pagnott, Internal<br />
New Mexico Gustavo De La Roca 22038<br />
Suzanne Smith, Internal<br />
New York Andy Ramirez 36527<br />
Bronx, Manhattan & Staten Island Vinny Minutolo, Internal<br />
Upstate excluding Buffalo, Jamestown, Philip Loftus 22337<br />
& Williamsville Richard Charron, Internal<br />
Upstate including Buffalo, Jamestown, Judy Spanos 28205<br />
& Williamsville Randy Wakely, Internal<br />
Brooklyn, Long Island, Queens, Kevin Folks 36528<br />
& Westchester County John Speicher, Internal<br />
North Carolina Barry Dyche 36507<br />
Ryan Henningsen, Internal<br />
North Dakota David Douglas 38082<br />
Brett Kautter, Internal<br />
Ohio Christopher Downey 36558<br />
NORTH Lindsay O’Neill, Internal<br />
SOUTH John Dean 36544<br />
Heather Hester, Internal<br />
Oklahoma Ryan Mason 28214<br />
Jason Hurtienne, Internal<br />
Oregon Darren Kinney 28507<br />
S. OR (Corvallis, S. Pendleton) Kathleen Gill, Internal<br />
NORTH (Salem North) Robert Thompson 28207<br />
Sean Mahoney, Internal<br />
Pennsylvania John Nesnay 35035<br />
Greater Philadelphia Area Peter Pagnott, Internal<br />
Excluding Philadelphia Judy Spanos 28205<br />
Randy Wakely, Internal<br />
Puerto Rico Andrew Bockstein 37166<br />
Brian Sladek, Internal<br />
Rhode Island Rob Bonner 36502<br />
Matthew Bartlett, Internal<br />
South Carolina Jonathan Thompson 37278<br />
Vinny Minutolo, Internal<br />
South Dakota David Douglas 38082<br />
Brett Kautter, Internal<br />
Tennessee Tom Hoyt 36506<br />
EAST (Including Greater Nashville Metro Area) Mike Magnetta, Internal<br />
WEST Chris Jenkins 36514<br />
Johanna Hagel, Internal<br />
EXT.<br />
6/30/09<br />
DEALER USE ONLY/NOT FOR DISTRIBUTION TO THE PUBLIC Go to franklintempleton.com or call (800) 223-2141 <strong>Dealer</strong> <strong>Facts</strong> <strong>Guide</strong> 135<br />
EXT.<br />
Texas Bryan Sullivan 22450<br />
N. CEN (Corsicana, Fairfield & Amarillo) Frank Zasa, Internal<br />
E. TX (Paris to Lufkin) Dan Cestary<br />
Peter Ordal, Internal<br />
37262<br />
Abilene, Wichita Falls & Waco, Dallas, Fort Worth Todd Ermenio<br />
Sharlene Ching, Internal<br />
28211<br />
El Paso Gustavo De La Roca<br />
Suzanne Smith, Internal<br />
22038<br />
Austin to San Antonio & Victoria Joseph Piccolo<br />
Lori Kamuf, Internal<br />
27035<br />
Greater Houston Rob Richardson<br />
Leanne Luttges, Internal<br />
28213<br />
NORTHWEST/SOUTHWEST Fred Miller 37266<br />
(Amarillo, Corpus Christi, Laredo, Lubbock,<br />
Midland & San Angelo)<br />
Mark Indgjer, Internal<br />
Utah Damian Eckstein<br />
Matt Pickard, Internal<br />
28451<br />
Vermont Darren Doughty<br />
Jonathan Baulsir, Internal<br />
36530<br />
Virginia Ian Valentine<br />
Bill Kimbrough, Internal<br />
36511<br />
Virgin Islands Andrew Bockstein<br />
Brian Sladek, Internal<br />
37166<br />
Washington Pete Black 28238<br />
CENT WA (Wenatchie; Yakima; Walla Walla) Duc Nguyen, Internal<br />
(Excluding Central) Robert Thompson<br />
Sean Mahoney, Internal<br />
28207<br />
West Virginia Tom Temeyer<br />
Susan Nguyen, Internal<br />
35231<br />
Wisconsin Shane Davis<br />
Daniel Nelson, Internal<br />
36517<br />
Wyoming Robert Gonzalez 22928<br />
NORTHWEST Kevin Borella, Internal<br />
SOUTHEAST Chris Burt<br />
Chris Schurawel, Internal<br />
27420<br />
National Sales Manager<br />
Bob Geppner 37335<br />
Divisional Sales Managers<br />
NORTHEAST CT, MA, ME, NH, NY, PA, RI, VT Dan Grip 36521<br />
MID-ATLANTIC DC, DE, MD, NC, NJ, PA, VA Roger Michaud 36518<br />
SOUTHEAST AL, FL, GA, LA, MS, PR, SC,<br />
TX, VI<br />
Joe Epstein 37202<br />
GREAT LAKES AL, AR, IN, KY, LA, MI, OH, TN Michael Mahoney 28266<br />
MIDWEST IA, IL, MN, MO, ND, NE, SD, WI Dan Reinhold 37727<br />
SOUTHWEST AZ, CA, CO, ID, KS, MO, NM, NV, Jim Escobedo<br />
OK, UT, WY<br />
38204<br />
PACIFIC AK, CA, HI, ID, MT, NV, OR, WA,<br />
WY, GUAM<br />
John McGee 24842<br />
WHOLESALER LISTINGS SEPARATE ACCOUNTS • OFFSHORE PRODUCTS • RETIREMENT DIVISION INDEPENDENT & BANK DIVISION NYSE DIVISION
CONTACT US<br />
Contact Us<br />
TELEPHONE NUMBERS<br />
Sales and Marketing Services* . . . . . . . . . . . . . . . . . . . . . . (800) 223-2141<br />
Direct . . . . . . . . . . . . . . . . . . . . . . . . . . . . . . . . . . . . . . . . . . . (650) 312-3114<br />
Advisor Services . . . . . . . . . . . . . . . . . . . . . . . . . . . . . . . . . . (800) 524-4040<br />
Direct . . . . . . . . . . . . . . . . . . . . . . . . . . . . . . . . . . . . . . . . . . . (916) 463-1500<br />
Information about client accounts, trades, commissions and exchanges.<br />
<strong>Franklin</strong> <strong>Templeton</strong> Variable Insurance Funds . . . . . . . . . . (800) 530-2432<br />
Requests for fund information and sales literature.<br />
<strong>Franklin</strong> <strong>Templeton</strong> Order Room** . . . . . . . . . . . . . . . . . . . (800) 227-5041<br />
Purchases of <strong>Franklin</strong> <strong>Templeton</strong> funds.<br />
Institutional Services Group . . . . . . . . . . . . . . . . . . . . . . . . . (800) 321-8563<br />
Information on sales literature, sales ideas and support for the financial<br />
institutions community.<br />
Online Services . . . . . . . . . . . . . . . . . . . . . . . . . . . . . . . . . . . (877) 236-7932<br />
Assistance with our website, franklintempleton.com.<br />
<strong>Franklin</strong> <strong>Templeton</strong> Portfolio Advisors, Inc. . . . . . . . . . . . . (800) 822-8464<br />
Information about separately managed accounts.<br />
franklintempleton.com/separateaccounts<br />
Registered Investment Advisor Division . . . . . . . . . . . . . . . (888) 225-4250<br />
Supports fee-based registered investment advisors.<br />
Retirement Services . . . . . . . . . . . . . . . . . . . . . . . . . . . . . . . (800) 527-2020<br />
Retirement planning, IRA, SEP IRA, SIMPLE IRA, 403(b) and Profit Sharing Plans.<br />
Retirement Special Products Group . . . . . . . . . . . . . . . . . . (800) 818-4030<br />
Services outside Custodial Business Retirement accounts including 401(k) Plans,<br />
Profit Sharing and Money Purchase Plans, Defined Benefit Plans, ERISA and Non-<br />
ERISA 403(b) Plans, 457 Plans and other qualified retirement plans.<br />
TDD (Hearing Impaired) . . . . . . . . . . . . . . . . . . . . . . . . . . . . . (800) 851-0637<br />
WEBSITE<br />
franklintempleton.com<br />
Visit our Financial Advisor site for daily fund prices, monthly performance, the<br />
latest sales tools and manager commentaries, and to order literature and manage<br />
your client accounts online.<br />
* When ordering literature, please be sure to use your EXPRESS number.<br />
** When placing trades for purchases, sales and conversions, please be sure to use the<br />
fund number.<br />
ADDRESSES<br />
Customer Accounts<br />
<strong>Franklin</strong> Funds<br />
Standard<br />
P.O. Box 997152<br />
Sacramento, CA 95899-7152<br />
Overnight<br />
3344 Quality Drive<br />
Rancho Cordova, CA 95670-7313<br />
Literature Requests<br />
P.O. Box 2410<br />
Rancho Cordova, CA 95741-2410<br />
<strong>Templeton</strong> & Mutual Series Funds<br />
Standard<br />
P.O. Box 33030<br />
St. Petersburg, FL 33733-8030<br />
Overnight<br />
100 Fountain Parkway<br />
St. Petersburg, FL 33716-1205<br />
Retirement Plan Accounts<br />
<strong>Franklin</strong> Funds<br />
Standard<br />
<strong>Franklin</strong> <strong>Templeton</strong> Bank & Trust<br />
Attn: FTISI Retirement Plan Operations<br />
P.O. Box 997153<br />
Sacramento, CA 95899-9974<br />
Overnight<br />
<strong>Franklin</strong> <strong>Templeton</strong> Bank & Trust<br />
Attn: FTISI Retirement Plan Operations<br />
3344 Quality Drive<br />
Rancho Cordova, CA 95670-6608<br />
<strong>Templeton</strong> & Mutual Series Funds<br />
Standard<br />
<strong>Franklin</strong> <strong>Templeton</strong> Bank & Trust<br />
Attn: FTISI Retirement Plan Operations<br />
P.O. Box 33033<br />
St. Petersburg, FL 33733-8033<br />
Overnight<br />
<strong>Franklin</strong> <strong>Templeton</strong> Bank & Trust<br />
Attn: FTISI Retirement Plan Operations<br />
100 Fountain Parkway<br />
St. Petersburg, FL 33716-1205<br />
<strong>Franklin</strong> <strong>Templeton</strong> Portfolio Advisors, Inc.<br />
Standard/Overnight<br />
One <strong>Franklin</strong> Parkway<br />
San Mateo, CA 94403-1906<br />
6/30/09<br />
To ensure that the highest quality of service is being provided, telephone calls<br />
placed to or by representatives in <strong>Franklin</strong> <strong>Templeton</strong>’s service departments may be<br />
accessed, recorded and monitored.<br />
136 <strong>Dealer</strong> <strong>Facts</strong> <strong>Guide</strong> Go to franklintempleton.com or call (800) 223-2141 DEALER USE ONLY/NOT FOR DISTRIBUTION TO THE PUBLIC
SPECIALIZED EXPERTISE<br />
TRUE DIVERSIFICATION<br />
RELIABILITY YOU CAN TRUST<br />
<strong>Franklin</strong> <strong>Templeton</strong> Investments<br />
Gain From Our Perspective ®<br />
<strong>Franklin</strong> <strong>Templeton</strong>’s distinct multi-manager structure combines the<br />
specialized expertise of three world-class investment management groups—<br />
<strong>Franklin</strong>, <strong>Templeton</strong> and Mutual Series.<br />
Each of our portfolio management groups operates autonomously, relying<br />
on its own research and staying true to the unique investment disciplines<br />
that underlie its success.<br />
<strong>Franklin</strong>. Founded in 1947, <strong>Franklin</strong> is a recognized leader in fixed<br />
income investing and also brings expertise in growth- and value-style<br />
U.S. equity investing.<br />
<strong>Templeton</strong>. Founded in 1940, <strong>Templeton</strong> pioneered international investing<br />
and, in 1954, launched what has become the industry’s oldest global<br />
fund. Today, with offices in over 25 countries, <strong>Templeton</strong> offers investors<br />
a truly global perspective.<br />
Mutual Series. Founded in 1949, Mutual Series is dedicated to a unique<br />
style of value investing, searching aggressively for opportunity among<br />
what it believes are undervalued stocks, as well as arbitrage situations and<br />
distressed securities.<br />
Because our management groups work independently and adhere to different<br />
investment approaches, <strong>Franklin</strong>, <strong>Templeton</strong> and Mutual Series funds<br />
typically have distinct portfolios. That’s why our funds can be used to build<br />
truly diversified allocation plans covering every major asset class.<br />
At <strong>Franklin</strong> <strong>Templeton</strong> Investments, we seek to consistently provide investors<br />
with exceptional risk-adjusted returns over the long term, as well as the<br />
reliable, accurate and personal service that has helped us become one of the<br />
most trusted names in financial services.<br />
MUTUAL FUNDS | RETIREMENT PLANS | 529 COLLEGE SAVINGS PLANS | SEPARATE ACCOUNTS
<strong>Franklin</strong> <strong>Templeton</strong> Distributors, Inc.<br />
One <strong>Franklin</strong> Parkway<br />
San Mateo, CA 94403-1906<br />
< GAIN FROM OUR PERSPECTIVE ® ><br />
<strong>Franklin</strong> <strong>Templeton</strong> Investments<br />
Your Source For:<br />
Mutual Funds<br />
Retirement Plans<br />
529 College Savings Plans<br />
Separate Accounts<br />
(800) 223-2141<br />
franklintempleton.com<br />
DLR G0209 07/09<br />
<strong>Franklin</strong> <strong>Templeton</strong> Investments <strong>Dealer</strong> <strong>Facts</strong> <strong>Guide</strong> <strong>Q2</strong> 09