2009/2010 IFA Annual Report - Institute of Foresters of Australia
2009/2010 IFA Annual Report - Institute of Foresters of Australia
2009/2010 IFA Annual Report - Institute of Foresters of Australia

You also want an ePaper? Increase the reach of your titles
YUMPU automatically turns print PDFs into web optimized ePapers that Google loves.
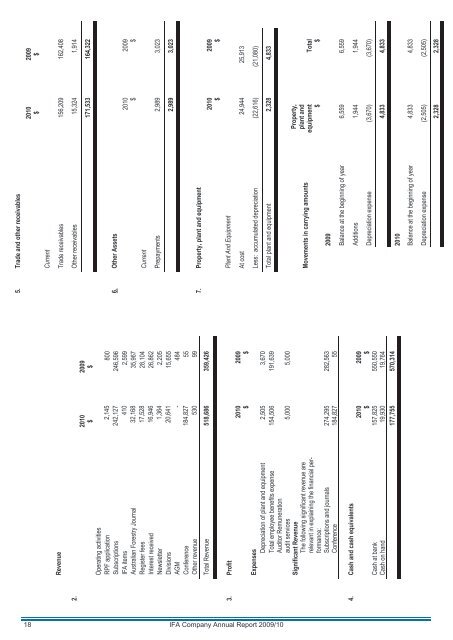
5. Trade and other receivables<br />
<strong>2009</strong><br />
$<br />
<strong>2010</strong><br />
$<br />
Current<br />
Trade receivables 156,209 162,408<br />
Revenue<br />
Other receivables 15,324 1,914<br />
2.<br />
171,533 164,322<br />
<strong>2009</strong><br />
$<br />
<strong>2010</strong><br />
$<br />
6. Other Assets<br />
<strong>2009</strong><br />
$<br />
<strong>2010</strong><br />
$<br />
Current<br />
Prepayments 2,989 3,023<br />
Operating activities<br />
RPF application 2,145 800<br />
Subscriptions 242,127 246,596<br />
<strong>IFA</strong> items 410 2,599<br />
<strong>Australia</strong>n Forestry Journal 32,168 35,967<br />
Register fees 17,528 28,104<br />
Interest received 16,946 26,862<br />
Newsletter 1,364 2,205<br />
Divisions 20,641 15,655<br />
AGM - 484<br />
Conference 184,827 55<br />
Other revenue 530 99<br />
18 <strong>IFA</strong> Company <strong>Annual</strong> <strong>Report</strong> <strong>2009</strong>/10<br />
2,989 3,023<br />
7. Property, plant and equipment<br />
<strong>2009</strong><br />
$<br />
<strong>2010</strong><br />
$<br />
Total Revenue 518,686 359,426<br />
Plant And Equipment<br />
3. Pr<strong>of</strong>it<br />
At cost 24,944 25,913<br />
<strong>2009</strong><br />
$<br />
<strong>2010</strong><br />
$<br />
Less: accumulated depreciation (22,616) (21,080)<br />
Total plant and equipment 2,328 4,833<br />
Total<br />
$<br />
Property,<br />
plant and<br />
equipment<br />
$<br />
Movements in carrying amounts<br />
<strong>2009</strong><br />
Expenses<br />
Depreciation <strong>of</strong> plant and equipment 2,505 3,670<br />
Total employee benefits expense 154,506 191,639<br />
Auditor Remuneration<br />
audit services 5,000 5,000<br />
Significant Revenue<br />
The following significant revenue are<br />
relevant in explaining the financial performance:<br />
Subscriptions and journals 274,295 282,563<br />
Conference 184,827 55<br />
Balance at the beginning <strong>of</strong> year 6,559 6,559<br />
Additions 1,944 1,944<br />
4. Cash and cash equivalents<br />
Depreciation expense (3,670) (3,670)<br />
<strong>2009</strong><br />
$<br />
<strong>2010</strong><br />
$<br />
4,833 4,833<br />
Cash at bank 157,825 550,550<br />
Cash on hand 19,930 19,764<br />
177,755 570,314<br />
<strong>2010</strong><br />
Balance at the beginning <strong>of</strong> year 4,833 4,833<br />
Depreciation expense (2,505) (2,505)<br />
2,328 2,328