

Canada's Forest Inventory 2001 - Publications du gouvernement du ...
Canada's Forest Inventory 2001 - Publications du gouvernement du ...
Canada's Forest Inventory 2001 - Publications du gouvernement du ...

You also want an ePaper? Increase the reach of your titles
YUMPU automatically turns print PDFs into web optimized ePapers that Google loves.
3.10 Volume<br />
Volume information in CanFI<strong>2001</strong> is generally derived from volume tables developed from field samples<br />
for provincial forest management inventories. It is stored as cubic metres per hectare for each of 87<br />
species. The number of species is so large because different species grow in different parts of Canada,<br />
and because source inventories vary in the detail to which their volume tables were created: some include<br />
what might be considered minor species, and some group species (e.g., maple, instead of red maple or<br />
sugar maple). In order to maintain as much detail as possible, CanFI<strong>2001</strong> does not aggregate species to<br />
the lowest common denominator.<br />
Table 15 lists volumes for species, grouped for the purpose of this report, in cubic metres, rather than<br />
in the millions of cubic metres usually used, in order to show contributions of minor species to the total.<br />
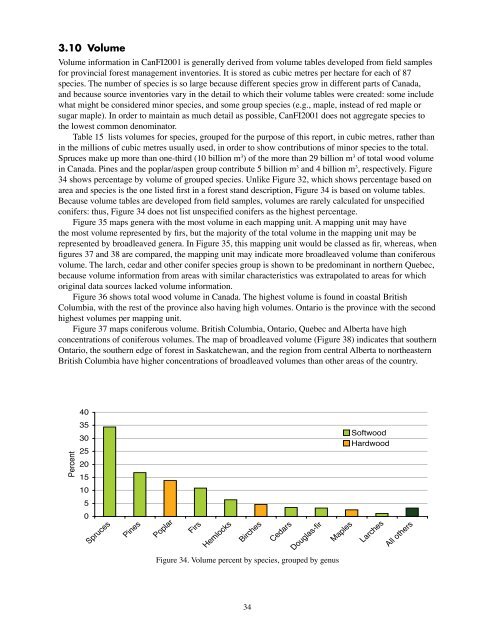
Spruces make up more than one-third (10 billion m 3 ) of the more than 29 billion m 3 of total wood volume<br />
in Canada. Pines and the poplar/aspen group contribute 5 billion m 3 and 4 billion m 3 , respectively. Figure<br />
34 shows percentage by volume of grouped species. Unlike Figure 32, which shows percentage based on<br />
area and species is the one listed first in a forest stand description, Figure 34 is based on volume tables.<br />
Because volume tables are developed from field samples, volumes are rarely calculated for unspecified<br />
conifers: thus, Figure 34 does not list unspecified conifers as the highest percentage.<br />
Figure 35 maps genera with the most volume in each mapping unit. A mapping unit may have<br />
the most volume represented by firs, but the majority of the total volume in the mapping unit may be<br />
represented by broadleaved genera. In Figure 35, this mapping unit would be classed as fir, whereas, when<br />
figures 37 and 38 are compared, the mapping unit may indicate more broadleaved volume than coniferous<br />
volume. The larch, cedar and other conifer species group is shown to be predominant in northern Quebec,<br />
because volume information from areas with similar characteristics was extrapolated to areas for which<br />
original data sources lacked volume information.<br />
Figure 36 shows total wood volume in Canada. The highest volume is found in coastal British<br />
Columbia, with the rest of the province also having high volumes. Ontario is the province with the second<br />
highest volumes per mapping unit.<br />
Figure 37 maps coniferous volume. British Columbia, Ontario, Quebec and Alberta have high<br />
concentrations of coniferous volumes. The map of broadleaved volume (Figure 38) indicates that southern<br />
Ontario, the southern edge of forest in Saskatchewan, and the region from central Alberta to northeastern<br />
British Columbia have higher concentrations of broadleaved volumes than other areas of the country.<br />
Percent<br />
40<br />
35<br />
30<br />
25<br />
20<br />
15<br />
10<br />
5<br />
0<br />
Spruces<br />
Pines<br />
Poplar<br />
Firs<br />
Hemlocks<br />
Birches<br />
34<br />
Cedars<br />
Douglas-fir<br />
Figure 34. Volume percent by species, grouped by genus<br />
Maples<br />
Softwood<br />
Hardwood<br />
Larches<br />
All others


