Adobe Illustrator & Indesign Tutorial - UCSF Radiation Oncology ...
Adobe Illustrator & Indesign Tutorial - UCSF Radiation Oncology ...
Adobe Illustrator & Indesign Tutorial - UCSF Radiation Oncology ...

You also want an ePaper? Increase the reach of your titles
YUMPU automatically turns print PDFs into web optimized ePapers that Google loves.
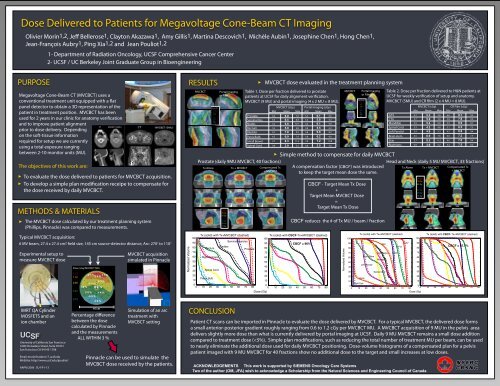
Dose Delivered to Patients for Megavoltage Cone-Beam CT Imaging<br />
Olivier Morin1,2, Je Bellerose1, Clayton Akazawa1, Amy Gillis1, Martina Descovich1, Michèle Aubin1, Josephine Chen1, Hong Chen1,<br />
Jean-François Aubry1, Ping Xia1,2 and Jean Pouliot1,2<br />
PURPOSE<br />
<strong>UCSF</strong><br />
University of California San Francisco<br />
1600 Divisadero Street, Suite H1031<br />
San Francisco CA 94143-1708<br />
Email: morin@radonc17.ucsf.edu<br />
WebSite: http://www.ucsf.edu/jpouliot/<br />
AAPM 2006 SU-FF-I-13<br />
1- Department of <strong>Radiation</strong> <strong>Oncology</strong>, <strong>UCSF</strong> Comprehensive Cancer Center<br />
2- <strong>UCSF</strong> / UC Berkeley Joint Graduate Group in Bioengineering<br />
Megavoltage Cone-Beam CT (MVCBCT) uses a<br />
conventional treatment unit equipped with a at<br />
panel detector to obtain a 3D representation of the<br />
patient in treatment position. MVCBCT has been<br />
used for 2 years in our clinic for anatomy verication<br />
and to improve patient alignment<br />
prior to dose delivery. Depending<br />
on the soft-tissue information<br />
required for setup we are currently<br />
using a total exposure ranging<br />
between 2-10 monitor units (MU).<br />
CT MVCBCT (5MU)<br />
The objectives of this work are:<br />
To evaluate the dose delivered to patients for MVCBCT acquisition.<br />
To develop a simple plan modication receipe to compensate for<br />
the dose received by daily MVCBCT.<br />
METHODS & MATERIALS<br />
The MVCBCT dose calculated by our treatment planning system<br />
(Phillips, Pinnacle) was compared to measurements.<br />
Typical MVCBCT acquisition:<br />
6 MV beam, 27.4 x 27.4 cm2 eld size, 145 cm source-detector distance, Arc: 270o to 110o Experimental setup to<br />
measure MVCBCT dose<br />
IMRT QA Cylinder<br />
MOSFETS and an<br />
ion chamber<br />
Dose (cGy/MVCBCT MU)<br />
1.12<br />
1.05<br />
-2.1 % 1.7 %<br />
2.3 %<br />
0.95<br />
0.3 %<br />
-1.1 %<br />
1.4 % 0.2 %<br />
0.85<br />
2.8 % 1.4 %<br />
0.75<br />
-0.9 %<br />
2.6 %<br />
16 cm<br />
Percentage dierence<br />
between the dose<br />
calculated by Pinnacle<br />
and the measurements<br />
ALL WITHIN 3 %<br />
MVCBCT acquisition<br />
simulated in Pinnacle<br />
Simulation of an arc<br />
treatment with<br />
MVCBCT setting<br />
Pinnacle can be used to simulate the<br />
MVCBCT dose received by the patients.<br />
Normalized Volume<br />
RESULTS<br />
100<br />
90<br />
80<br />
70<br />
60<br />
50<br />
40<br />
30<br />
20<br />
10<br />
MVCBCT Portal Imaging<br />
or Film<br />
Tx (solid) with Tx+MVCBCT (dashed)<br />
Rectum<br />
Right Femoral<br />
Spinal Cord<br />
Penis Bulb<br />
cGy per MU<br />
1.2<br />
1.1<br />
1.0<br />
0.9<br />
0.8<br />
0.7<br />
0.6<br />
0.4<br />
Bladder<br />
0<br />
0 10 20 30 40 50 60 70 80<br />
CONCLUSION<br />
Seminal Vesicles<br />
Prostate<br />
90<br />
80<br />
70<br />
60<br />
50<br />
40<br />
30<br />
20<br />
10<br />
Dose (Gy)<br />
MVCBCT dose evaluated in the treatment planning system<br />
Table 1. Dose per fraction delivered to prostate<br />
patients at <strong>UCSF</strong> for daily alignment verication.<br />
MVCBCT (9 MU) and portal imaging (4 x 2 MU = 8 MU).<br />
Simple method to compensate for daily MVCBCT<br />
Prostate (daily 9MU MVCBCT, 40 fractions)<br />
Head and Neck (daily 5 MU MVCBCT, 33 fractions)<br />
Tx Alone Tx + MVCBCT Compensated Tx<br />
+ MVCBCT<br />
A compensation factor (CBCF) was introduced<br />
to keep the target mean dose the same.<br />
Tx Alone Tx + MVCBCT Compensated Tx<br />
+ MVCBCT<br />
77 Gy<br />
70 Gy<br />
55 Gy<br />
45 Gy<br />
35 Gy<br />
28 Gy<br />
15 Gy<br />
Prostate<br />
Seminal Ves.<br />
Nodes<br />
Rectum<br />
Bladder<br />
Penis Bulb<br />
Small Bowel<br />
Spinal Cord<br />
MVCBCT [cGy] Portal Imaging [cGy]<br />
Min Mean Max Min Mean Max<br />
6.4<br />
6.3<br />
5.2<br />
5.3<br />
6.7<br />
6.5<br />
2.7<br />
0.9<br />
6.9<br />
6.5<br />
6.8<br />
5.9<br />
7.8<br />
6.9<br />
8.3<br />
3.9<br />
Tx (solid) with CBCF. Tx+MVCBCT (dashed)<br />
100<br />
CBCF = 96%<br />
0<br />
0 10 20 30 40 50 60 70 80<br />
7.6<br />
6.8<br />
10.1<br />
6.8<br />
9.5<br />
7.6<br />
11.2<br />
5.2<br />
5.5<br />
5.4<br />
4.4<br />
4.8<br />
5.8<br />
5.8<br />
3.0<br />
0.8<br />
20<br />
Brain<br />
20<br />
10<br />
Right Eye<br />
10<br />
0<br />
0 10 20 30 40 50 60 70 80<br />
0<br />
0 10 20 30 40 50 60 70 80<br />
Dose (Gy)<br />
Patient CT scans can be imported in Pinnacle to evaluate the dose delivered by MVCBCT. For a typical MVCBCT, the delivered dose forms<br />
a small anterior-posterior gradient roughly ranging from 0.6 to 1.2 cGy per MVCBCT MU. A MVCBCT acquisition of 9 MU in the pelvis area<br />
delivers slightly more dose than what is currently delivered by portal imaging at <strong>UCSF</strong>. Daily 9 MU MVCBCT remains a small dose addition<br />
compared to treatment dose (